1. Introduction
The structure of a country’s tax system plays a crucial role in both shaping economic growth and income distribution. In economics, shifting to less growth-distortive taxes, like indirect taxation, often reduces equality. This trade-off is notable in European OECD economies, where moving from direct to indirect taxes has increased income disparities. Over the past century, global wealth concentration has intensified, since that income and wealth was increasingly concentrated in the hands of a small segment of the population. This trend has raised concerns about socio-economic consequences of inequality, not only in emerging economies but also in developed countries. Within the EU, income disparities persist due to divergent fiscal policies in general, not only in tax structures, despite shared economic objectives (
Fredriksen, 2012).
A key driver of these inequalities is the structure of taxation, as EU member states maintain sovereignty over their fiscal policies. In particular, the conflict between fostering economic growth and ensuring social fairness is evident in tax mix: while corporate income tax (CIT) and personal income tax (PIT) revenue have declined in total tax revenue, revenues from value-added tax (VAT) have increased. The impact of this shift is measurable—higher VAT trends have regressive effects, disproportionately burdening lower-income households, while reductions in CIT and PIT often benefit wealthier segments of society. Consequently, tax policies designed primarily to promote efficiency may fail to address or even exacerbate income inequality.
This paper empirically assesses the impact of CIT revenue, PIT revenue, and VAT revenue changes on (in)equality (measured as the Gini coefficient) in the 22 European OECD economies using available empirical data in the period 2003–2020. The research sample comprises 22 European OECD economies, due to their shared adherence to standardized tax policy frameworks and regulatory practices promoted within OECD and EU. This common institutional environment ensures greater comparability of fiscal indicators and enhances the reliability of cross-country analysis. The sample covers 14 developed and 8 emerging European economies, classified according to their EU accession dates and structural characteristics. Founders of the EU and those economies joining till the 1995 enlargement are defined as developed, while those economies acceding in 2004 or after are considered emerging. After the centrally planned system abandonment, emerging EU economies changed their economic and political environment and undertook comprehensive reforms in the process of joining the EU. Thereby structural and developmental differences are captured which were shaped by distinct stages of European integration. Namely, this paper analyzes how tax forms influence growing inequality in both developed (Austria, Belgium, Denmark, Finland, France, Germany, Greece, Ireland, Italy, Luxembourg, Netherlands, Portugal, Spain, and Sweden) and emerging (Czech Republic, Estonia, Hungary, Latvia, Lithuania, Poland, Slovakia, and Slovenia) European OECD economies through the empirical estimation of direct and indirect tax revenues changes on the Gini coefficient. The analyzed period starts in 2003 till 2020, covering the longest possible period related to the availability of reliable and comparable data on tax structure and income distribution across the selected countries. Therefore, the goal of this paper is to empirically assess the short- and long-run relationship between tax revenues and the Gini coefficient and the heterogeneous adjustments for 22 European OECD economies in the period 2003–2020. Robustness was checked using changes in the sample and using different method of estimation—panel-corrected standard error (PCSE)—and through sample changes.
The paper’s structure is as follows:
Section 2 presents the literature review after the Introduction.
Section 3 shows descriptive insights into tax mix and income inequality measured through the Gini coefficient. The data and methodology used are described in
Section 4, the estimation findings are discussed in
Section 5, and the results’ robustness is examined in
Section 6. The concluding remarks are outlined in the last section of the research paper.
2. Literature Review
The literature on
how tax structures affect income disparity in European OECD economies is consulted in this paper. According to
Seelkopf and Lierse (
2017), tax policies and how they affect inequality are far more complex and diverse than is commonly recognized. According to
Atkinson (
2013), inequality occurs not just between skilled and unskilled workers but also between labor and capital. Additionally,
Calabuig and Olcina (
2023) demonstrate that the tax structure is influenced by the elite’s view of public benefits from tax revenues, the share of fiscal reciprocators, and the level of economic inequality between the elite and the rest of the society. Their findings demonstrate a dynamic complementarity between tax progressivity and societal reciprocity. As shown by
Duncan and Sabirianova Peter (
2016), progressivity has a much smaller effect on actual inequality compared to observed income disparity. Specifically, empirical comparative study demonstrates that in economies with weaker legal structures, the difference between observed and actual inequality is far greater. As stated by
Carneiro et al. (
2022), tax cuts can simultaneously support economic growth and reduce inequality when they are strategically targeted at the most effective fiscal components. Furthermore, research by
Popa (
2025) demonstrates that the most prevalent scenario in the EU is that increases in total taxes have the impact of decreasing inequality. Specifically, the Gini coefficient indicates that a decrease in overall taxes has the effect of increasing inequality. However, they demonstrated that in certain EU economies, tax cuts (either higher or lower) possibly had a lessened effect on inequality (measured by the Gini coefficient).
Additionally, the research draws on literature that examines the
impact of corporate income taxes on the Gini coefficient.
Nallareddy et al. (
2022) in their research provided evidence that corporate tax cuts lead to increases in income inequality. That is in line with
Rixen’s (
2011) research which shows that tax competition (CIT rates cuts) has a detrimental impact on inequality. Additionally, the research findings of
Genschel et al. (
2015) demonstrate how tax competition has asymmetrical consequences in developed and emerging economies. Specifically, those with lower earnings are the biggest losers in developed economies. Similarly,
Kostin et al. (
2021) pronounced the returns differentiations between developed and emerging markets. In contrast, tax competition can promote equality in emerging economies by facilitating the growth of aggregate income. According to
Plümper and Troeger (
2012), in liberal market economies that redistribute income through relatively high effective capital taxes and relatively low effective labor taxes, tax competition led governments to shift the tax burden from capital to labor, therefore increasing income inequality. On the other hand, research shows that income inequality did increase little or not at all in social welfare states that dominantly use social security transfers to redistribute income (
Wildowicz-Szumarska, 2022).
Analyzing the
relationship between personal income taxes and the Gini coefficient is a crucial aspect of this study; consequently, the research also incorporates findings from prior studies on this topic.
Cantante (
2020) makes the point that it is necessary to back progressive tax regimes, thus tax aggregate income would be the fairest and most effective way to tackle income inequality (
Obadić et al., 2014). That is in line with
Duncan and Sabirianova Peter’s (
2008) research which shows that progressivity reduces observed inequality in reported gross and net income. However, their research indicates that it has a significantly smaller impact on true inequality, approximated by consumption-based measures of the Gini coefficient.
Stephenson (
2018) found that while proportional income taxation is far more effective in reducing income inequality in emerging economies, the graduated rate income tax system is the most effective in developed economies. According to
Muszyńska et al. (
2021), developed economies use personal income taxes to redistribute wealth more effectively than emerging economies. Pursuant to study by
Ranđelović and Žarković-Rakić (
2011), the personal income tax system should be redesigned to boost the basic allowance and implement a consistent tax rate to improve vertical imbalance in taxes and considerably reduce inequality. Furthermore, the findings of
Calabuig and Olcina (
2023) demonstrate a dynamic complementarity between tax progressivity and the degree of reciprocity in society. A progressive tax culture will be attained if inequality is low enough; if not, a regressive tax culture will predominate.
Since
value-added tax effects on (in)equality are of special interest for this research, thus, this paper reviews the current literature in this field. According to
Martorano (
2018), a higher proportion of direct tax revenues in indirect tax revenues guarantees the tax system’s progressivity, which in turn lowers inequality as determined by the Gini coefficient (
Milanović, 1997;
Duclos & Araar, 2007;
Atkinson, 2015;
Kame Babilla, 2023). Namely, the growth of the share of consumption taxes (VAT) in the overall tax system leads to an increase in inequality (
Alavuotunki et al., 2017). Although progressive tax rates are preferable when it comes to maintaining fairness in society,
Bejaković (
2020) argues that a proportional consumption tax may be the best option due to its superiority over income tax. As noted by
Swistak and de la Feria (
2024), the implementation of progressive VAT rates can help economies become less unequal, which is in line with findings by
Maier and Ricci (
2024) and
Gale (
2020). The idea of this paper is to supplement the existing literature regarding the impact of tax structure on income inequality in society. This study employs heterogeneous non-stationary macro panels—Pooled Mean Group method—to analyze the negative (positive) effects of decreasing (increasing) direct tax forms (CIT and PIT revenues) and the impacts of indirect tax forms (VAT revenues) on the Gini coefficient, as a measure of (in)equality in European OECD economies.
3. Descriptive Insights into Tax Mix and Income Inequality
Over the past few decades, income inequality has increased in most OECD economies (
International Monetary Fund—IMF, 2014). Meanwhile, nearly all developed and emerging economies have implemented significant tax reforms (
Brys et al., 2011). Ever since
Musgrave’s (
1939) idea of differential tax burdens (whether direct or indirect), i.e., the changes in distribution that occur when one tax is replaced by another, economic policy makers have debated how tax structures affect income inequality. In order to examine the impact of tax policies on inequality, it is necessary to analyze how changes in the combination of different tax forms and their revenues (income tax rates on labor, capital, and consumption) affect income inequality in European OECD countries (
Iosifidi & Mylonidis, 2017). Namely, direct taxation directly affects the distribution of income and, consequently, the Gini coefficient, which gauges inequality. The Gini coefficient is a widely used measure of income inequality that quantifies the extent to which the distribution of income among individuals or households deviates from perfect equality. It ranges from 0 (complete equality) to 100 (complete inequality) and it is typically derived from the Lorenz curve, which plots the cumulative share of income against the cumulative share of the population. Direct taxation, as opposed to indirect taxes (VAT), enables more accurate targeting of a more equitable distribution of resources.
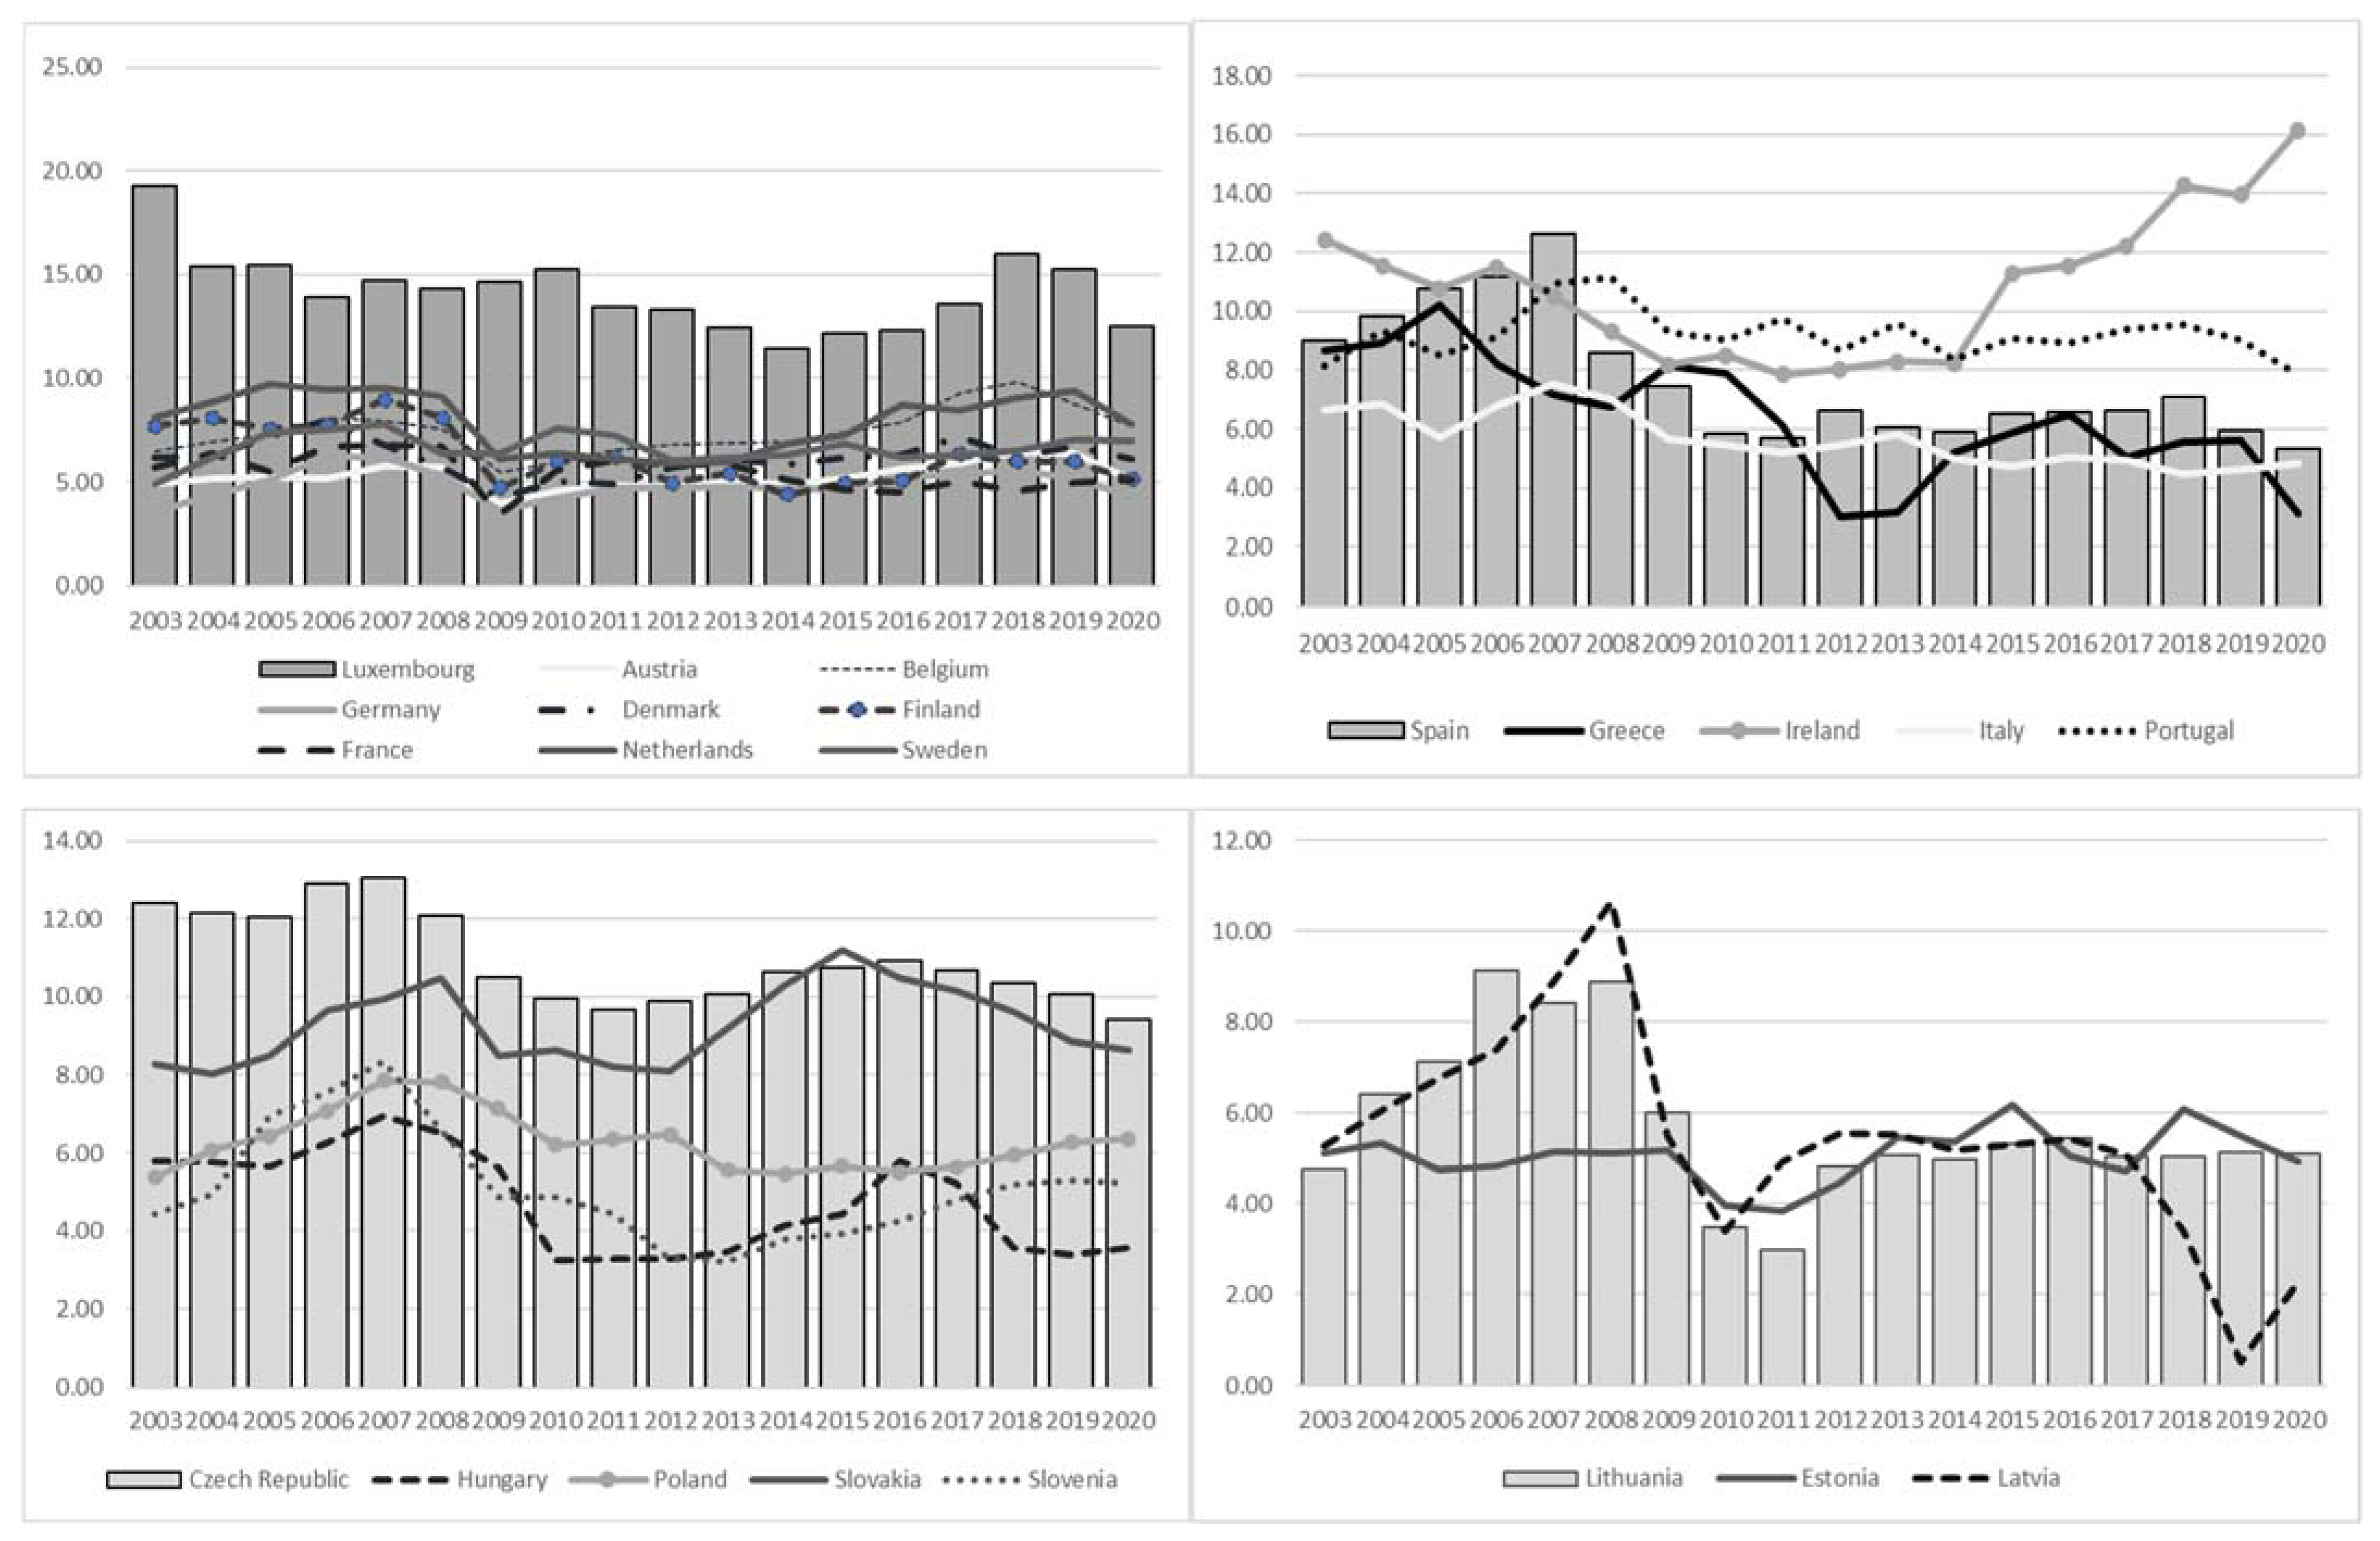
Among emerging economies, Latvia and Estonia experienced the most significant decline in corporate tax revenue (about 4%), largely due to reductions in statutory and effective average tax rates aimed at enhancing tax competitiveness (
Figure 1). However, these reductions negatively impacted tax revenue collection, threatening fiscal stability, as seen in Hungary, which also failed to compensate for lower rates through increased FDI taxable profits. In contrast, Slovenia successfully increased its corporate income tax revenue by implementing competitive tax strategies that attracted FDI. Among developed economies, the PIGS countries saw a notable decline in corporate tax revenue until 2012, after which a slight recovery occurred, while Ireland leveraged tax competitiveness to achieve a significant increase in corporate tax revenue from 12.43% in 2003 to 16.15% in 2020.
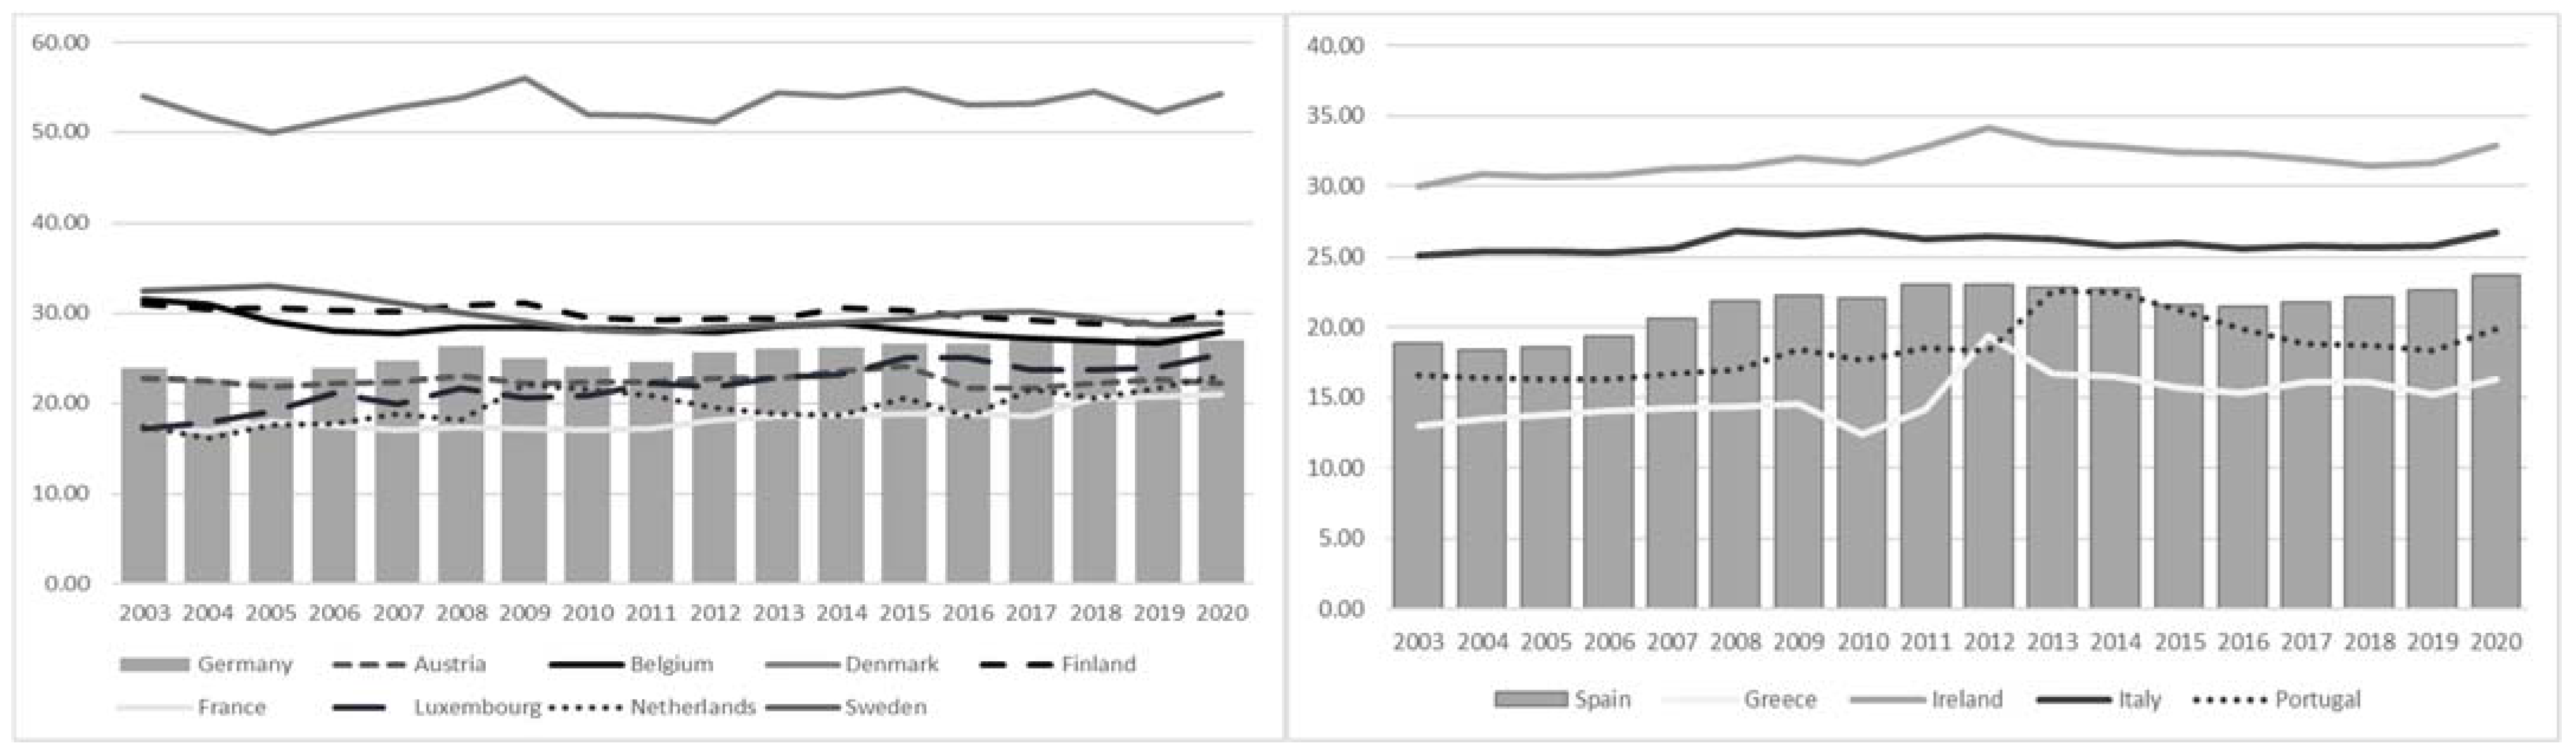
Over the past two decades, the most developed European OECD economies have experienced an increase in the share of PIT revenue, despite reductions in tax rates (
Figure 2). Luxembourg and the Netherlands recorded the highest increase (from 17.24%; 17.54% in 2003 to 25.5%; 22.9% in 2020, respectively), while Belgium and Sweden had significant declines due to substantial rate reductions. In contrast, emerging economies generally experienced a decline in PIT revenue, with the sharpest decrease observed in Hungary. Slovakia and Poland were the only emerging economies to notably increase their share of PIT revenue while cutting PIT rates. This divergence highlights the differing impacts of tax policy changes on revenue trends between developed and emerging economies.
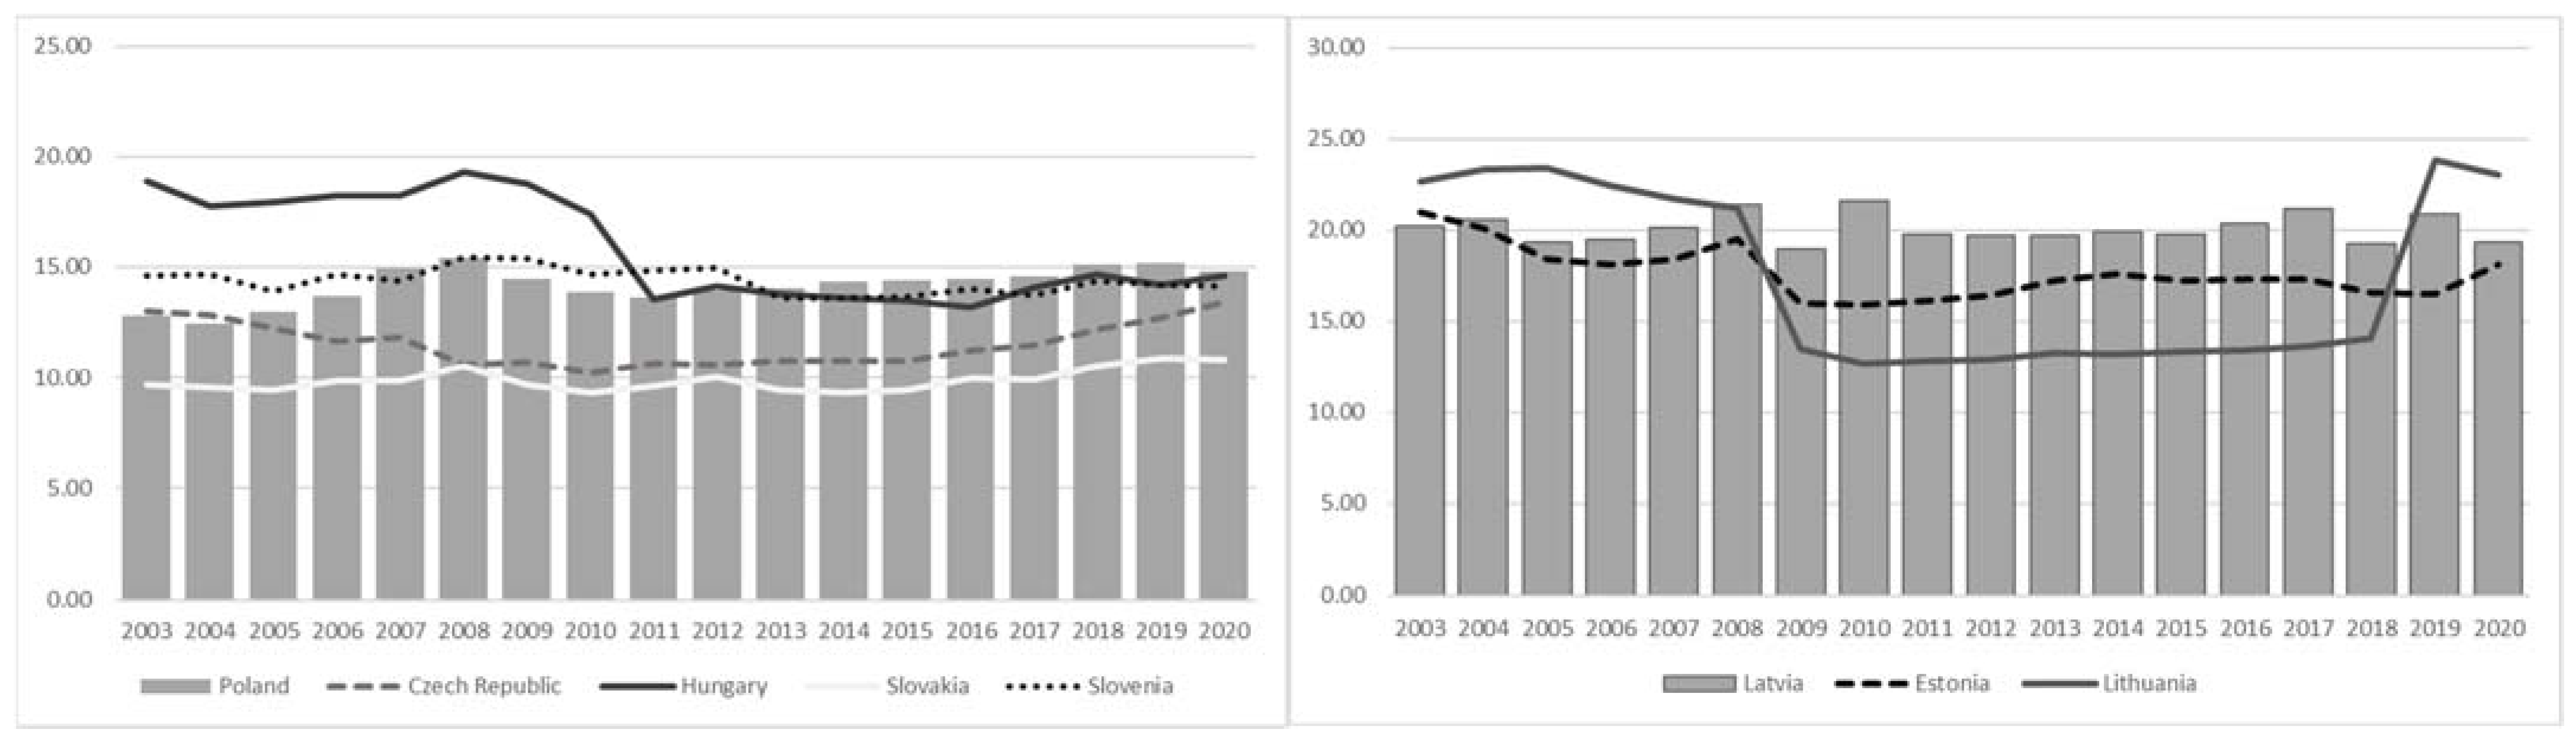
Over the observed period, the share of VAT revenue in total taxation declines slightly, from 32.1% in 2003 to 30.7% in 2020, with a more pronounced decrease in developed European OECD economies (
Figure 3). Ireland recorded a large decline (9.1%), followed by Portugal and Denmark, while Sweden and Finland saw increases due to stable or rising VAT rates. In contrast, emerging economies experienced an increase in VAT revenue share, led by Hungary (from 39.2% in 2003 to 45.1% in 2020) and Czech Republic (from 29.6% in 2003 to 31% in 2020), both of which implemented tax policy shifts favoring indirect taxation. Hungary now holds the highest VAT rate (27%) among the observed economies.
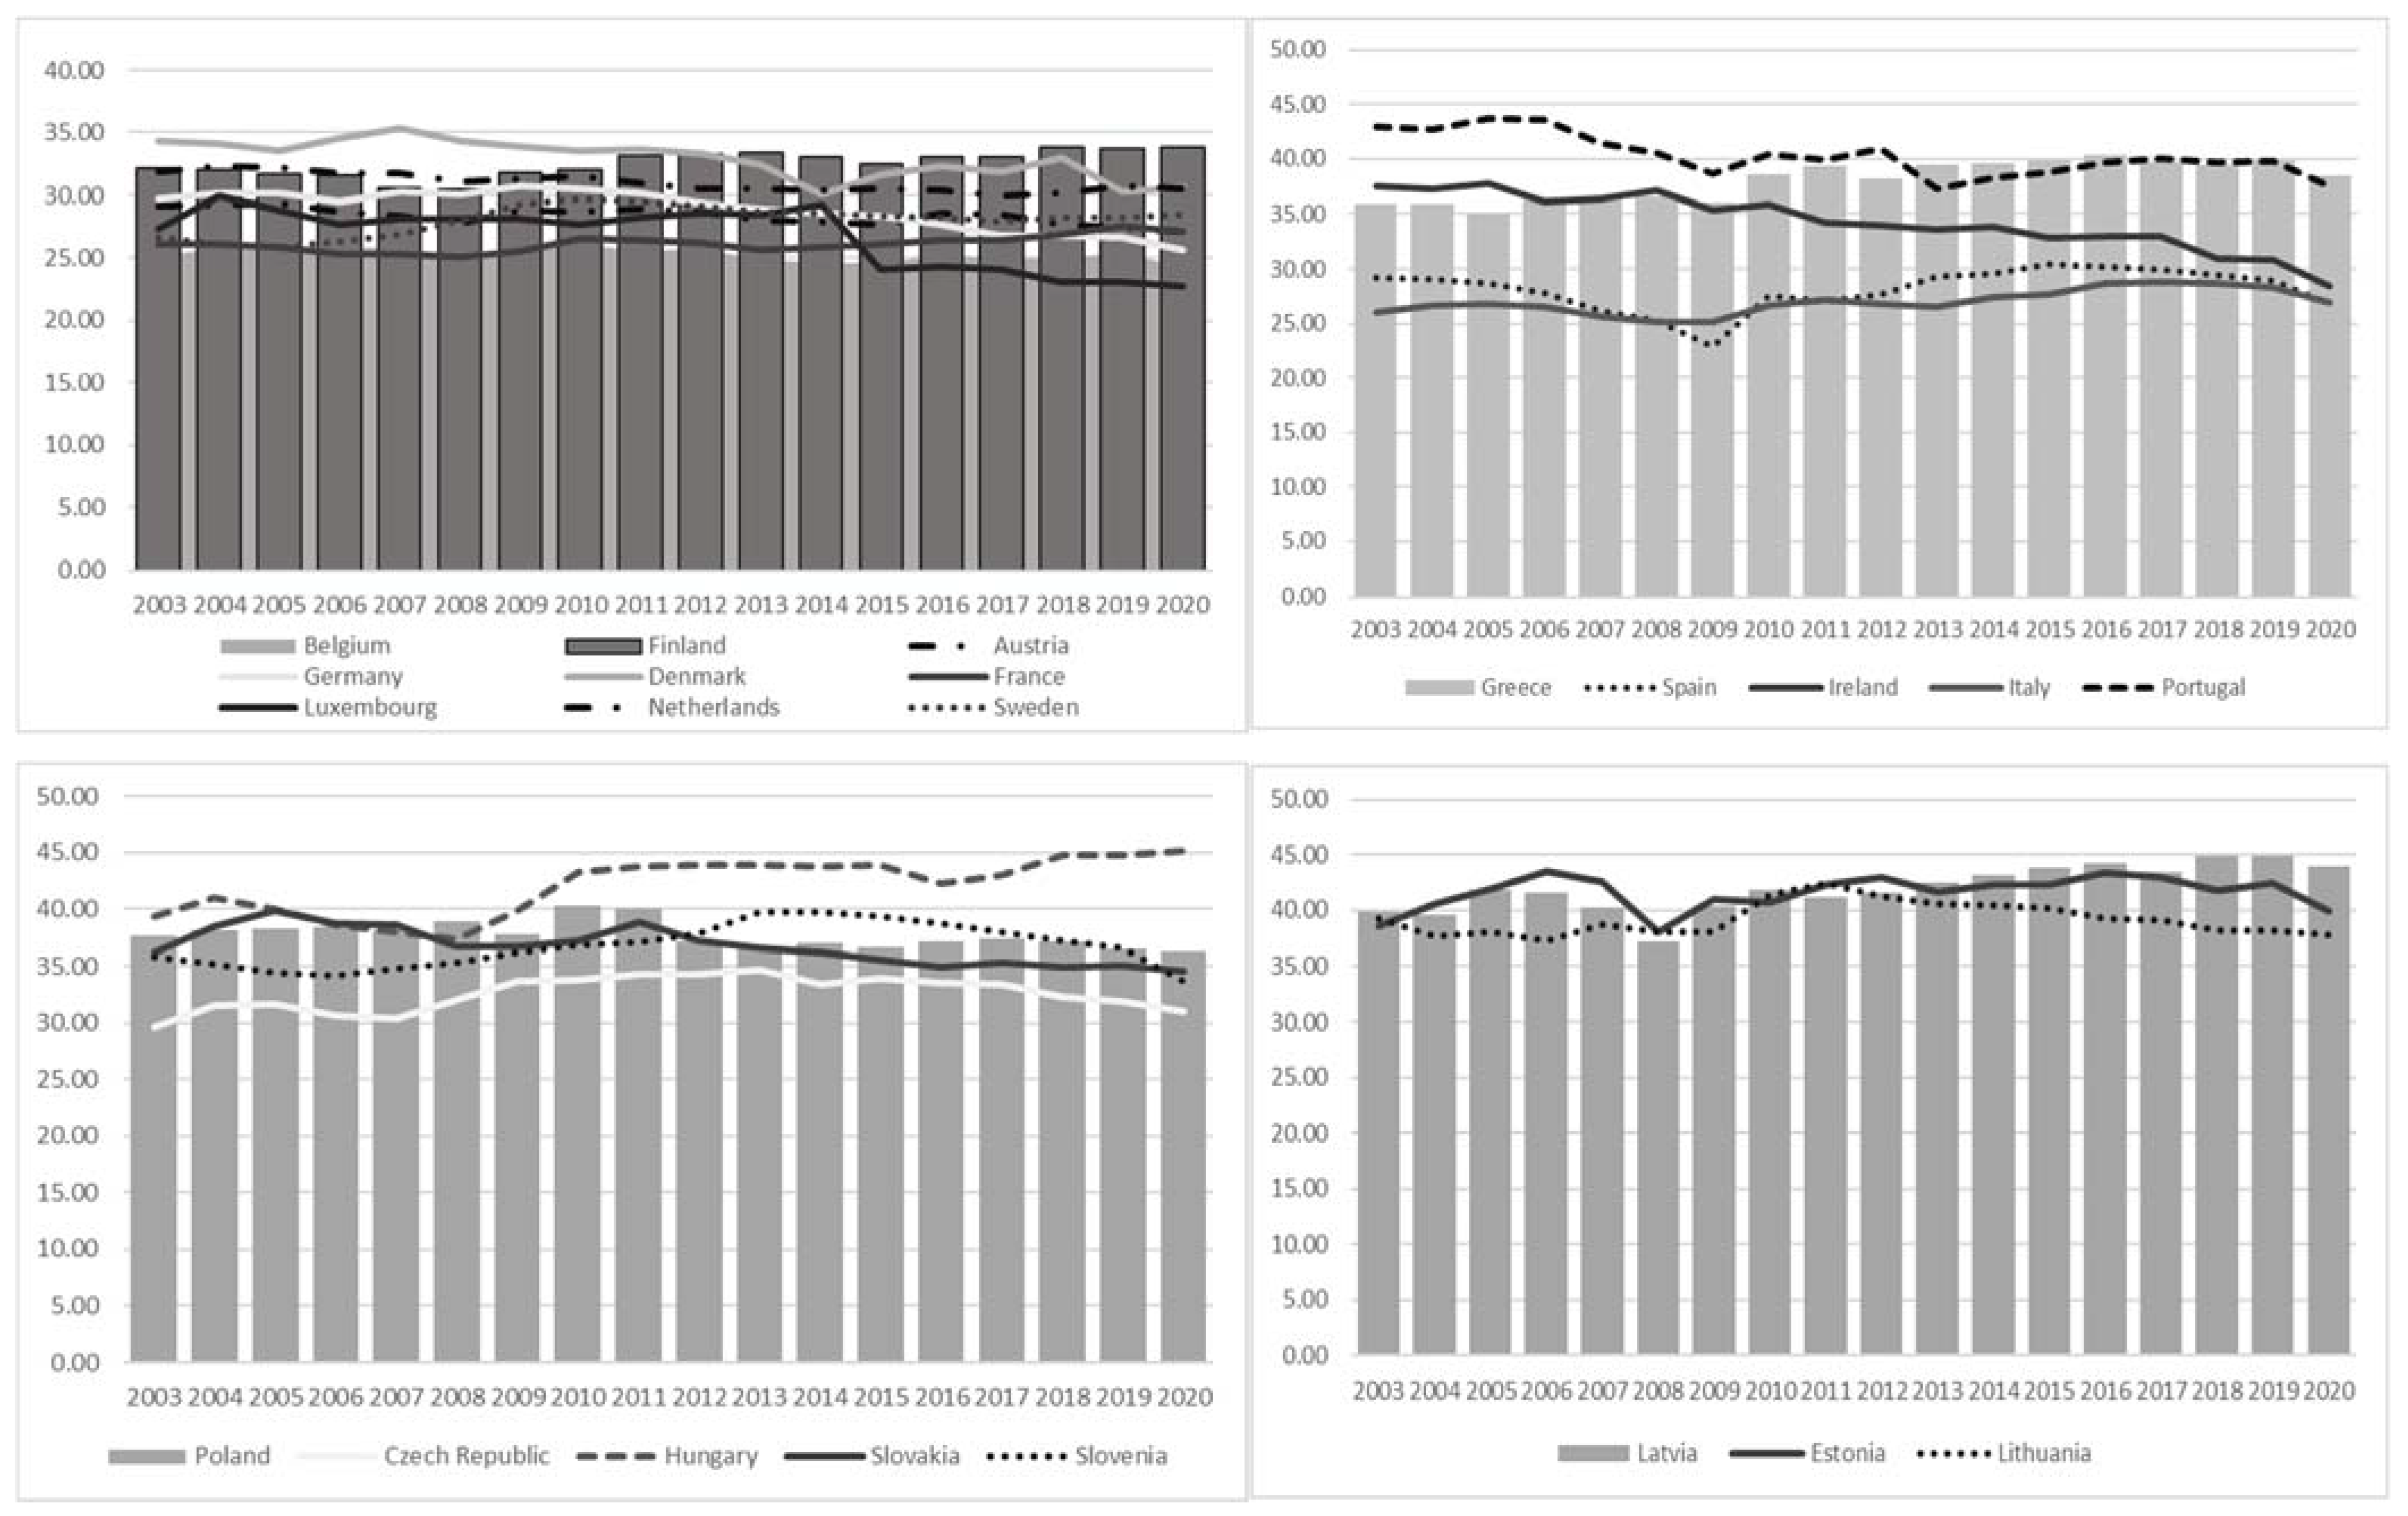
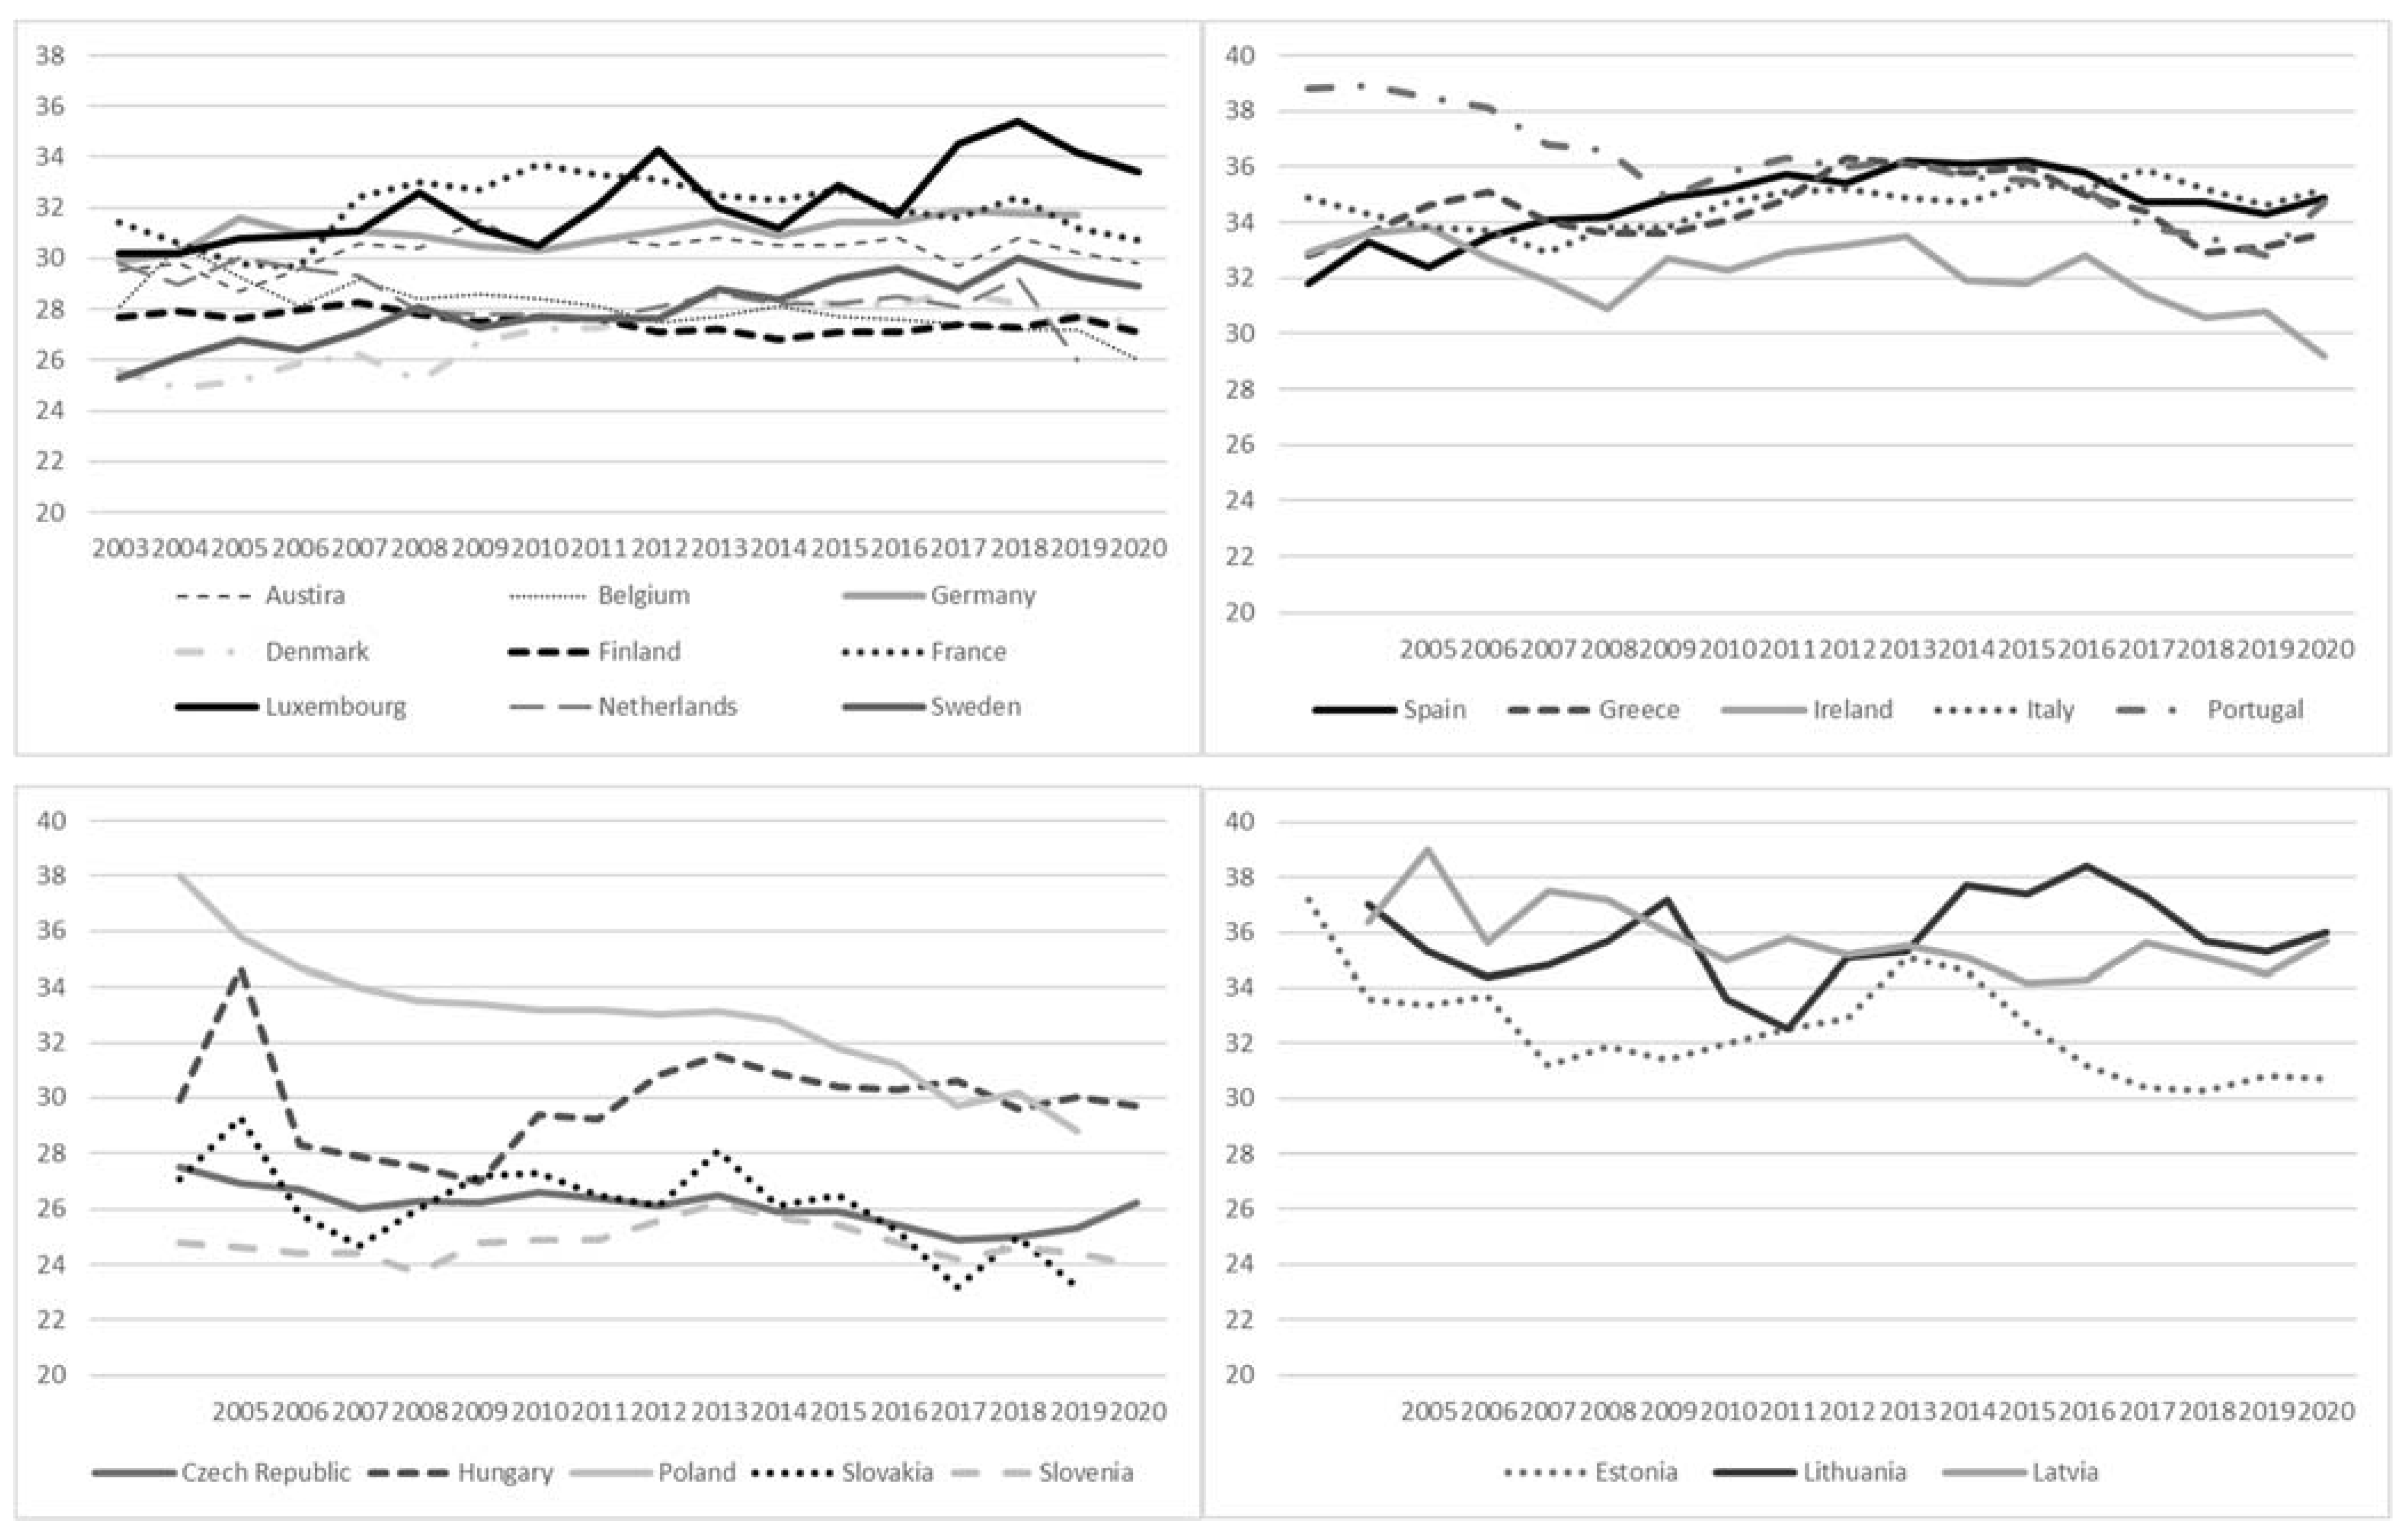
Figure 4 illustrates the variations in the Gini coefficient for the analyzed economies. Specifically, the trends observed from 2003 to 2020 indicate distinct tendencies between developed and emerging economies. In the period before the global financial crisis, inequality was on average lower in developed (30.1) compared to emerging economies (31.8) (except in Slovenia and Slovakia, where the Gini coefficient was the lowest among all observed economies, 24.7, in both economies). After the outbreak of the crisis in 2008–2010, and the European sovereign debt crisis (2010–2012) which resulted in stagnation and a slow economic recovery (
Beljić & Glavaški, 2021), the Gini coefficient increased, especially in Spain, Italy, and Greece (from 34.1; 32.9; 33.6 in 2007 to 36.2; 34.7; 36 in 2015, respectively). After 2010, the Czech Republic, Poland, Slovenia, and Slovakia recorded a constant decline in the Gini coefficient, indicating an increase in equity in these societies, while the Hungarian economy, despite an improvement in the Gini coefficient (in 2006 the Gini coefficient was 27), did not record progress in terms of equity from the beginning of the observation of 29.9 in 2003 to 29.7 in 2020. In the developed economies, Denmark, Finland, Luxembourg, and Germany, the Gini coefficient was relatively stable with a slight increase in inequality, while in France and the Netherlands there was a decrease in inequality.
Between 2003 and 2020 in European OECD economies, CIT and PIT generally declined, while VAT consistently increased, likely due to its broad tax base and resilience. PIT and CIT revenues showed more noticeable fluctuations, especially during the 2008–2010 global financial crisis period, indicating their sensitivity to macroeconomic cycles. Over the same timeframe, Gini coefficients remained relatively unchanged in most economies, with minor reductions in some instances, indicating limited effects of current tax policy on income inequality.
4. Methodology and Data
This research paper employs a panel data econometric framework to examine the short- and long-run relationship between CIT revenue, PIT revenue, VAT revenue, and the Gini coefficient, with the budget balance (BB) as control variable. The dataset encompasses 22 European OECD economies (
N = 22), comprising 14 developed and 8 emerging economies, over the period from 2003 to 2020 (
T = 17), thereby constituting a macro panel. The sample period from 2003 to 2020 is selected to enable a consistent and comprehensive analysis of the relationship between taxation and income inequality in European OECD economies. The period captures major institutional and economic shifts—including the 2004 EU enlargement, the 2008 global financial crisis, and subsequent tax and welfare reforms. Also, it aligns with availability of reliable and comparable data on tax structure and income distribution across the selected countries. The selected timeframe is determined by the availability of data on Gini coefficient, which constrained the maximum feasible period of observation. Given the time dimension of panel, the analysis accounts for cross-sectional dependence, heterogeneity across panels, and potential issues of stationarity. Notably, unlike conventional dynamic panel models characterized by a large N and large T, which exhibit different asymptotic properties, appropriate econometric adjustments are required. Cointegration analysis is often used to capture the long-run relationship among the variables, especially in case of macroeconomic, institutional, of financial factors (
Dauti, 2024).
Although classical panel models are often used in explaining direct taxes effects (
Balasoiu et al., 2023), panel modeling assumptions of stationarity and slope parameter homogeneity are often incorrect in macro panels (
Im et al., 2003). Therefore, we estimated non-stationary heterogeneous panels using Mean-Group (MG) and Pooled Mean-Group (PMG) methods (
Pesaran & Smith, 1995;
Pesaran et al., 1999). Namely, heterogeneous non-stationary panel models allow for country-specific short- and long-run relationships in data where variables are integrated over time, enabling analysis across diverse economies with potentially different adjustment paths. The PMG/MG estimators are employed to analyze the relationship between tax structure and income inequality in European OECD economies, as they allow for country-specific short-run dynamics while capturing a common long-run equilibrium, accommodating structural diversity across national tax systems and inequality patterns. While MG focuses on individual time series estimates to ensure consistent estimates of long-run coefficients in heterogeneous panels, PMG combines pooling and averaging by imposing homogeneity on long-run coefficients across observation units, while allowing for heterogeneity in short-run coefficients, as well as error-correction term. Namely, a key feature of the PMG model is that it allows for heterogeneity between observation units in short-run coefficients, error variances, and error corrections (adjustments to long-run equilibrium). This implies that different economies under observation may have different responses to shocks (economic, health, geopolitical crises) in the short run. The next feature is a common long-run relationship between all observation units (
Ullah & Awan, 2019;
Zaman et al., 2020). This assumes that despite short-run differences, all observation units converge towards the same long-run equilibrium (with different values of the error-correction parameter). Error-correction term indicates the speed of adjustment at which variables return to their long-run equilibrium after a short-run deviation. A statistically significant and negative error correction (between 0 and 1) confirms the existence of a stable long-run relationship and shows how quickly deviations are corrected over time. On the other hand, in the MG model, the slope coefficients are allowed to vary across units of comparable data, such as economies or regions. The MG method is particularly useful in macroeconomics when analyzing data on different entities that may exhibit different behaviors due to different economic structures. MG works by first estimating separate regressions for each unit of comparable data in the panel. The key difference between the two models lies in the constraint imposed on the long-run coefficients, while short-run dynamics remain heterogeneous in both specifications. The appropriate estimator, either the Mean Group (MG) or the Pooled Mean Group (PMG), could be distinguished by the Hausman test (
Hausman, 1978). Since these estimation techniques are categorized as panel error-correction models, the empirical model can be formally specified as follows:
where
is the dependent variable for economy
i and time
t;
represents the common long-run relationship between observation units, while
in the form of a model with equilibrium error correction represents the error-correction parameter that captures the speed of adjustment towards the long-run equilibrium,
represents the short-run coefficients of the lagged dependent variable, and
represents the short-run coefficients of the lagged independent variables.
Using the specification described, we estimated the following model:
where the dependent variable is
and represents the Gini coefficient, as measure of inequality, in 22 European OECD economies (source: World Bank database), while the model also includes three independent variables:
represents tax revenue based on corporate income tax,
represents tax revenue based on personal income tax,
is revenue from value added tax (source: OECD database);
—budget balance expressed as a percentage of GDP (source: World Bank). The independent variable representing the budget balance is used as a control variable in the model since it maintains the fiscal position of the observed economies and the connection between tax revenue and government spending (social transfers, subsidies)—which has an indirect impact on income distribution. Therefore, introducing budget balance into the model provides an optimal model for determining the impact of tax policies on the Gini coefficient (
Bourguignon & Spadaro, 2006). Therefore, the main hypotheses of this paper are as follows:
H1. There is a significant negative short- and long-run relationship between direct taxes revenue (CIT, PIT) with the Gini coefficient in 22 European OECD economies with heterogeneous adjustment towards long-run equilibrium in the period 2003–2020.
H2. The error-correction term is on average higher in developed than in emerging European OECD economies, indicating that developed economies are more successful in using direct taxes to reduce inequality in the period 2003–2020.
H3. In certain European OECD economies, in period 2003–2020, there is a significant negative short-run relationship between VAT revenue and the Gini coefficient.
Robustness Check—Panel-Corrected Standard Error (PCSE)
As the aforementioned model does not include cross-sectional dependence, the method of Panel-Corrected Standard Error (PCSE) is applied in the research to check the robustness of the PMG model. Namely,
Beck and Katz (
1995) recommend the use of this model, considering that it allows for the control of heteroskedasticity and provides more data points, which leads to more precise estimates (
Castañeda Rodríguez, 2018). Thus, PCSE solves several problems, which are reduced to (1) heteroskedasticity—the variability of the error that differs between observation units and time; (2) cross-sectional dependence—the existence of correlation between errors at a given time, which may be a consequence of common shocks or spillover effects. The model can be written in the following form:
where
represents the independent determinants for
i at time
t;
is a dummy variable in the model used to group economies and/or deviations in the empirical data;
represents individual effects; time effects are represented by
, while
represents stochastic disturbances. Thus, the model allows for accurate model estimates in the presence of heteroscedasticity and CSD.
Using the specification described, we estimated the following model:
The econometric procedure performed in order to obtain the final estimates of the PMG/MG estimators consisted of the following empirical steps (
Glavaški et al., 2024): (1) the test of cross-sectional dependence (CSD), with the null hypothesis of independence between panels (Table 1); (2) the second-generation panel stationarity test (Table 1); (3) the cointegration test using the Westerlund cointegration test between non-stationary variables (Table 1); (4) PMG and MG estimations (Table 2); (5) the Hausman test (Table 2); (6) the estimation heterogeneous short-run coefficients and heterogeneous speed of adjustments (Table 3); and (7) a robustness check using the PCSE and PMG estimator (Table 4).
5. Results and Discussion
The subsequent empirical procedures are employed to ascertain the short- and long-run dynamic relationships among CIT revenue, PIT revenue, VAT revenue, BB, and the GINI coefficient. The cross-sectional dependence (CSD) in the panel is initially examined for the 22 European OECD economies during the longest possible period from 2003 to 2020, due to GINI coefficient data availability.
Table 1 displays the results of the Pesaran CD test, indicating that the null hypothesis of cross-section independence must be rejected for the variables CIT revenue, PIT revenue, VAT revenue, BB, and GINI coefficient. Namely, an alternative hypothesis about CSD is accepted for analyzed variables. The strong institutional framework and common policies in EU economies, such as the common market, agricultural policy, customs union, tax harmonization, and monetary union, create connections, spillover effects, and dependencies between EU countries (
Glavaški et al., 2022).
The Pesaran CIPS test (
Pesaran, 2007), a second-generation panel unit root test, was used since CSD was discovered. Considering the results from unit root tests, the null hypothesis of non-stationarity is not rejected, meaning that the variables CIT revenue, PIT revenue, VAT revenue, BB, and the GINI coefficient are non-stationary. Due to the stationarity of the first differences being tested, thus, the results indicate that for all variables, null hypothesis is accepted, meaning variables are stationary in the first differences (
Table 1). As CSD is present, the cointegration is tested using a robust version of Westerlund’s test. The null hypothesis of no cointegration is rejected based on the results of the Westerlund test, while the alternative hypothesis of cointegration is confirmed.
According to the previous results, assumptions to use the PMG/MG model are fulfilled; therefore, the model presented in
Table 2 examines the impact of corporate and personal income tax revenues on the Gini coefficient, which measures the level of equitable income distribution in the economy. The homogeneous coefficients in the model show the long-run relationship between CIT and PIT revenues and the Gini coefficient in both PMG and MG models. Hence, MG results indicate that the long-run relationship is not significant (and it is positive), while PMG results demonstrate that there is a statistically significant (meaning
p-value < 0.05) long-run relationship between CIT, PIT, and the Gini coefficient. Therefore, the Hausman test was applied to determine efficient models. According to the test results (0.8546), the PMG model is found to be optimal, which is expected given that there is a common monetary policy within the eurozone, with a coordinated, but still heterogeneous, tax policy.
According to the preferred PMG method, homogeneous coefficients show that an increase in CIT and PIT revenues has a positive impact on reducing inequality in the observed economies, i.e., an increase in the tax burden on direct taxes leads to a decrease in the Gini coefficient confirming Hypothesis H
1 (which is in accordance with the results of
Rixen, 2011;
Obadić et al., 2014;
Cantante, 2020;
Nallareddy et al., 2022). The discovered negative long-run relationship means that if the CIT and PIT revenue decreases by 1%, there is an increase in GINI by 0.286% and 0.190%, respectively, meaning an increase in inequality and vice versa. According to the homogeneous coefficients, the relationship between VAT revenue and the Gini coefficient is not significant, implying that, unlike direct taxes, indirect taxation such as VAT may have neutral or limited redistributive effects on income inequality. The results show that there is also a statistically significant positive long-run relationship between the BB (which represents the control variable) and the Gini coefficient. The mentioned means that the growth of government spending in the form of social transfers and/or subsidies contributes to the reduction in inequality in society. The error-correction term shows an adjustment, namely, about 73.2% of the deviation from the long-run equilibrium relationship is corrected within one year according to the PMG method. In the short run, only increased PIT revenue significantly reduces the Gini coefficient, while CIT and VAT revenues have delayed effects on income inequality in European OECD economies. A positive budget balance improves income equality, indicating that fiscal expansion promotes a fairer society, also in the short run. In addition to the homogeneous coefficients in the preferred PMG model which suggest a long-run negative relationship between the Gini coefficient and CIT and PIT revenues, the heterogeneous coefficients for 22 European OECD economies are presented below (
Table 3).
In addition, the error-correction terms are significant and heterogeneous, indicating that the speed of adjustment towards the long-run equilibrium relationship is different in the observed economies (developed and emerging). The mentioned shows
Table 3—in the emerging European OECD economies, such as Estonia, Lithuania, Hungary, Slovakia, Slovenia, and in the developed European OECD economies Austria, Belgium, Denmark, Finland, France, Germany, Greece, Ireland, Italy, Luxembourg, the Netherlands, Portugal, Spain, and Sweden. The error-correction term is not significant in the emerging economies Czech Republic, Latvia, and Poland, which indicates that the increase in the tax burden based on direct taxes does not have the capacity to reduce the existing inequality in society only in these emerging economies. In two emerging European OECD economies, Hungary and Slovakia, and in four developed economies, Austria, Belgium, Ireland, and Luxembourg, an excessive error correction was recorded. Based on the above, we can conclude that developed European OECD economies are more efficient in using tax policies with the aim of reducing inequality and achieving a fairer redistribution of income than emerging economies (Hypothesis H
2) Namely, developed economies tend to be more efficient in reducing income inequality through direct taxes due to their more progressive tax system, stronger administrative capacity, and broader tax bases in comparison to emerging European OECD economies. These factors enhance both the redistributive impact and compliance, leading to more effective income equalization (which is in accordance with the results of
Muszyńska et al., 2021).
More detailed analyses of tax systems’ effects on inequality in emerging European OECD economies with the highest error-correction parameters could be explained through the example of small open economies Lithuania and Slovenia. In Lithuania, 77.6% of the deviation from the long-run equilibrium relationship is corrected in one year. Inequality in Lithuania is greatly decreased by raising the tax burden based on direct taxes. In addition, results show that the burden based on indirect taxes (VAT) also contributes to increasing equity in society, which would mean that the efficient use of tax revenues (based on VAT) in the redistribution of wealth can reduce inequality in society. The BB and the Gini coefficient have a significant positive short-run relationship, indicating that the funding obtained through social transfers and subsidies is allocated to the lower-income members of society, guaranteeing better equity. Based on the results, Slovenia stands out as the economy with the second highest error-correction term of 73.2% correction within one year, which indicates that Slovenia successfully uses progressive tax policies. In particular, relying on personal income taxes to provide funds for income redistribution in Slovenia has an influence on achieving greater equity in society.
When it comes to developed economies, Germany recorded the highest error-correction term of 91.5%. The personal income tax, a direct type of taxation, contributes the most to the decrease in the Gini coefficient and social inequality. The findings, however, suggest that VAT contributes significantly to achieving equality in Germany as well, which is unusual for this tax form, since it is regarded as regressive in economic theory (
De Agostini et al., 2014). The positive short-run statistically significant relationship between the BB and the Gini coefficient is estimated as well, which confirms that the growth of government spending (social transfers/subsidies) contributes to the reduction in inequality in society. In Spain, 73.28% of the deviation from equilibrium is corrected within one year, which indicates that the use of personal income taxes has a significant positive impact on reducing inequality, while the influence of indirect taxes is not significant.
Furthermore, based on heterogeneous estimates (
Table 3), it can be concluded that in some European OECD economies, the impact of VAT revenue on the Gini coefficient is statistically significant, in context of short-run heterogeneous estimates (Hypothesis H
3) (which is in accordance with the results of
Maier & Ricci, 2024;
Gale, 2020). As mentioned so far, based on the results, it was revealed that in Lithuania and Germany, as well as in Finland, Greece, and Sweden, there is a significant negative relationship between VAT revenue and the Gini coefficient. In those economies, the short-run negative relationship reflects the use of VAT revenues to finance social transfers or public services that benefit lower-income households. The redistributive impact of VAT furthermore depends on each country’s specific VAT design—such as reduced rates on basic goods, broad exemptions, and the use of VAT revenues to fund well-targeted social transfers and public services, which mitigate the regressive effects and contribute to short-run reductions in inequality. Therefore, although in economic theory VAT revenue is considered as a regressive tax form whose growth particularly negatively affects the part of society with the lowest income, based on the analysis conducted, it was shown that the mentioned economies effectively use tax strategies including VAT revenue in the context of reducing inequality in society.
Some of the economies and examples of VAT use are as follows:
- (a)
Lithuania applies reduced VAT rates to certain essential goods, pharmaceuticals, and public transport. A zero VAT rate (on healthcare, education) ensures that essential goods that have a majority share in the consumer basket for households with the lowest income are taxed at a lower rate. In that way, VAT reduces the burden on disposable income and indirectly lower inequality (
Černiauskas, 2021);
- (b)
In Germany, economic policy makers use VAT tax revenues to finance targeted social transfers and programs (unemployment benefits, social housing, child allowance);
- (c)
In Sweden and Finland, a great importance is attached to the efficient use of VAT revenues; therefore, in addition to the aforementioned use of growing VAT revenues to finance redistribution programs, VAT revenues are also used for public investments: green energy, infrastructure that enables additional job creation, ensuring greater equality in society;
- (d)
Greece applies tax mix, in which VAT increase measures were implemented as part of the broader fiscal consolidation that Greece underwent on several occasions in the observed period, which contributed to the reduction in inequality.
Robustness Check
Robustness check of the results is undertaken in two ways: (1) using changes in method of estimation using the PCSE method, (2) making changes in sample size—dividing sample into two subsamples. In the previous analysis, we concluded that the variables CIT revenue, PIT revenue, VAT revenue, BB, and Gini coefficient are nonstationary and cointegrated, and that the sample is heterogeneous, containing cross-section dependence. Due to the detected problem of nonstationarity and cross-section dependence on the variables, classical panel methods are limited. However,
Beck and Katz (
1995) recommended the use of the PCSE estimator, which allows for heteroskedasticity, autocorrelation, and contemporaneous correlation across panels. Therefore, we employed PCSE as a robustness check.
The results obtained based on PCSE (
Table 4, panel (a)) confirm the results estimated by PMG and Hypothesis H1, that there is a significant negative relationship between the direct tax revenues and the Gini coefficient. Robust estimates imply that the growth of the direct tax burden (CIT revenue −0.1589; PIT revenue −0.077) ensures a reduction in inequality in the observed European OECD economies in the period from 2003 to 2020, while tax revenues based on VAT do not have a statistically significant impact on the Gini coefficient, which is in line with homogeneous long-run PMG results. Budget balance was again used as a control variable (it is significant and positive as expected).
Since that PCSE model does not include heterogeneous parameters, a change in slope coefficient is used to estimate specifics of economies with previously estimated significant redistributive effects of the VAT. Namely, the second model (
Table 4, panel (b)) examined the effects of VAT revenue on the Gini coefficient in five economies where a short-run significant negative relationship within the PMG estimator was discovered. The dummy variable (Dummy_VAT) was generated for certain economies (Lithuania, Finland, Germany, Greece, and Sweden) in order to check the robustness of those results. Dummy variables take values of VAT only in mentioned economies, otherwise 0. The results indicated that the impact of VAT revenue on reducing income inequality is significant in this subgroup, suggesting an intensification of its redistributive effect, confirming Hypothesis H3. Furthermore, there is a noticeable change in the slope coefficient, since that beside overall influence of VAT, estimated an additional negative effect for the variable Dummy_VAT (−0.0046), meaning that in those economies, the magnitude of redistributive effects of VAT is higher (the total influence of VAT in five economies is −0.0809).
Moreover, we aimed to verify PMG results showing that developed economies adjust to equilibrium faster than emerging ones, using direct tax revenue more effectively to reduce income inequality. This result is obtained using the PMG method and error-correction parameter; therefore, the robustness check in this case could not be analyzed using the other method of estimation, rather than making changes in sample size. Therefore, we divided the original sample into two subsamples: 8 emerging economies and 14 developed European OECD economies. Using the PMG estimator (
Table 5), results from two subsamples suggest that the error-correction term is significant, negative, and between 0 and 1. Thus, the speed of adjustment term is higher (73.3%) in developed economies compared to emerging economies (49.6%), confirming the robustness of the original conclusions, Hypothesis H
2.
6. Conclusions
Policy makers are faced with the trade-off between achieving economic efficiency and income equality. Both goals mentioned could be determined by the taxation system. Specifically, progressive tax systems seek to reduce social inequality by redistributing income throughout the economy by requiring higher-earning people to pay a larger proportion of their income in taxes. Conversely, VAT reductions have a more regressive nature yet are linked to greater economic efficiency. This research contributes to the literature that rethinks how heterogeneous tax mix shapes income inequality in European OECD economies in the period 2003–2020. The main findings of the paper can be summarized as follows: (i) The research results show that there is a significant negative relationship between CIT revenue, PIT revenue, and the Gini coefficient, meaning that an decrease/increase in direct tax revenue increases/decreases income inequality in European OECD economies; (ii) Furthermore, using the PMG method, heterogeneous results indicate that developed economies decrease income inequality by using direct taxes more efficiently than emerging European OECD economies, since the speed of adjustment is on average higher in developed economies in comparison to emerging economies; (iii) Based on heterogeneous short-run coefficients—certain European OECD economies use indirect tax—VAT can be used to decrease income inequality since in these economies a significant negative relationship between VAT revenue and the Gini coefficient is revealed. Therefore, these economies efficiently use VAT revenues in increasing equity. (iv) The PCSE model is implemented as a robustness check, confirming the conclusions based on the PMG estimator in relation to the significant negative relationship between the CIT revenue, PIT revenue, and the Gini coefficient. Also, the PCSE model, which includes a dummy variable, confirmed that in certain European OECD economies (Lithuania, Finland, Germany, Greece, and Sweden), there is a significant negative relationship between VAT revenue and the Gini coefficient. (v) The PMG method, as a robustness check, used in two subsamples, developed and emerging economies, confirmed that the speed of adjustment is generally higher in developed economies compared to emerging ones.
According to the research results, the recommendation for policy makers is that the funds collected from CIT and PIT could be redistributed more efficiently, thereby ensuring lower inequality in society. The findings therefore suggest that developed economies ought to adopt policies aimed at raising CIT to reduce inequality, while emerging economies should concentrate more on raising PIT to improve equity. In addition, research confirms that certain economies (Lithuania, Germany, Sweden, Finland, Greece) effectively use tax revenue from VAT, while at the same time not endangering, and indeed promoting, equality in society. This can be achieved if VAT revenues are directed in the context of lowering inequality in society, by financing social programs. It is stated, in accordance with the recommendations of other authors, that it is possible to establish progressive VAT rates (
Swistak & de la Feria, 2024), which would further enable the reduction in inequality in society, given that the increase in VAT burdens the poorest segments of society to the greatest extent. This would imply that by exempting or reducing VAT on essential goods, consumption growth would be ensured for the part of the population with the lowest level of disposable income (
Gale, 2020;
Maier & Ricci, 2024). These findings underscore the importance of maintaining and strengthening progressive direct tax systems to achieve long-run reductions in income inequality across the EU, while also recognizing the short-run redistributive potential of VAT when accompanied by well-targeted social transfers and exemptions on essential goods (as it was implemented in Lithuania, Finland, Germany, Greece, and Sweden). Policy makers should consider a more integrated approach to tax design—balancing efficiency, equity, and revenue needs—particularly in the context of demographic shifts, fiscal pressures, base erosion, and profit-shifting actions, and the EU’s broader commitment to social cohesion. Given that the decisions of economic policy makers are moving in the direction of lowering direct tax rates and increasing indirect ones, the scope of indirect taxation policy in the function of reducing inequality without compromising economic efficiency remains open for further research.


