Review

Analyzing Trends in Green Financial Instrument Issuance for Climate Finance in Capital Markets

by
Purity Maina
1,2,*,
Balázs Gyenge
3,
Mária Fekete-Farkas
4 and
Anett Parádi-Dolgos
5
1
Doctoral School of Economic and Regional Sciences, The Hungarian University of Agriculture and Life Sciences, Páter Károly u. 1, 2100 Gödöllő, Hungary
2
Strathmore University Business School, Strathmore University, Nairobi 00200, Kenya
3
Institute of Economics and Finance, Budapest Metropolitan University (METU), Nagy Lajos Király Utca 1–9, 1148 Budapest, Hungary
4
Institute of Agricultural and Food Economics, The Hungarian University of Agriculture and Life Sciences, Pater Károly u. 1, 2100 Gödöllő, Hungary
5
Department of Investment, Finance and Accounting, Institute of Rural Development and Sustainable Economy, The Hungarian University of Agriculture and Life Sciences, Guba Sándor utca 40 Pf.: 16, 7400 Kaposvár, Hungary
*
Author to whom correspondence should be addressed.
J. Risk Financial Manag. 2024, 17(4), 145; https://doi.org/10.3390/jrfm17040145
Submission received: 29 February 2024 / Revised: 30 March 2024 / Accepted: 31 March 2024 / Published: 4 April 2024

Abstract

:
Numerous stakeholders concur that tackling the climate change effect requires massive financial mobilization from the public and private sectors to reduce the climate financing gap. Capital markets are among the key players fostering this mobilization by issuing green financial instruments and facilitating capital flows to green investments. The study aimed to conduct a bibliometric analysis to fill a knowledge gap by evaluating the status and linkages in the literature on capital markets’ green financial instrument issuances. We utilized the Bibliometrix R package and VOS viewer to analyze 314 relevant publications from the Web of Science in 2017–2023 following the Sustainable Stock Exchanges’ green finance voluntary action plan. The analysis entailed mapping the scientific production trends, journal significance, author productivity, keyword linkages, emerging and trending topics, and collaborations within social structures. Further, the study assessed the applicability of Bradford’s, Zipf’s, and Lotka’s bibliometric laws. We highlight six conclusions based on the analysis, their relevance to various stakeholders, and future research directions. The findings are essential in enhancing the decision-making process of policymakers, corporations, responsible investors, and researchers interested in understanding the effectiveness and impact of green financial instruments.

1. Introduction

Climate change necessitates continuous, increased, and urgent action on a continental scale. The effects of this change cannot be ignored because they are felt globally and impede economic and social progress (Yenneti et al. 2016; Huang et al. 2023). Left unattended, the unpredictable effects may continue harming humanity and delaying the achievement of the Paris Agreement, UN Sustainable Development Goals, and other related goals (Wright et al. 2015; Santos et al. 2022).
Nations require more funds to finance adaptation and mitigation projects to achieve the 2015 Paris Agreement and SDGs, particularly SDG 13 on climate action (Scoville-Simonds 2016; Pauw 2021). The climate finance basket requires massive chip-ins from all avenues possible to reduce the growing gap. Developing countries will require a range of USD 160–340 billion by 2030 and USD 315–565 billion by 2050 for adaptation plans and strategies (United Nations Environment Programme 2022). Vast financing is also needed for mitigation strategies to ensure that the average global temperatures remain below 2 °C relative to pre-industrial levels (UNFCCC 2015).
There have been growing calls for the private sector to continue contributing significantly to the climate basket to heighten private climate finance (Purkayastha and Sarkar 2021; OECD 2022). Functional capital markets play a crucial role in promoting private mobilization and significantly contribute to economic development. This is achieved by facilitating access to and efficient allocation of limited financial resources (Wiafe et al. 2020). Climate finance issuances within the capital markets specifically target supporting projects and initiatives that address climate change and promote environmental sustainability. The secure issuance of green financial instruments via the markets represents one strategy for mobilizing climate finance. Further, the instruments can play an essential role in economic development in two main ways.
First, they aim to fund green projects that are anticipated to have a positive economic impact. The projects, including renewable energy infrastructure, energy efficiency initiatives, and sustainable agriculture projects, are predicted to have economic benefits (Branca et al. 2021; Candra et al. 2023). By facilitating the flow of capital into these areas, climate finance issuance incentivizes the adoption of sustainable technologies and practices. This can lead to new industries, employment opportunities, investment prospects, and overall economic growth in sectors related to environmental sustainability.
Secondly, issuing climate finance instruments could help prevent systemic risk, a potential trigger for severe economic instability, or a collapse of the entire economy. Climate change is empirically identified as one of the factors contributing to the financial systemic risk (Wu and Wan 2023). Therefore, issuing financial instruments for climate change mitigation could decrease environmental risks, enhance financial system resilience, and improve overall economic stability.
While acknowledging the significant financial and economic benefits of issuing green financial instruments via the capital markets, we add to the body of literature by presenting a bibliometric analysis focusing explicitly on capital markets issuances for climate finance. We test the application of three key primary bibliometric laws, Bradford’s Law1, Lotka’s Law2, and Zipf’s Law3, to comprehend and analyze trends in the journals, author productivity, and keywords bibliographic data. We review studies from 2017 to 2023 on green financial instrument issuances by corporations in capital markets by answering six research questions.
  • What is the scientific trend in the literature on green financial instrument issuances via capital markets?
  • Does the scientific journal productivity on climate finance in capital markets follow Bradford’s bibliometric law?
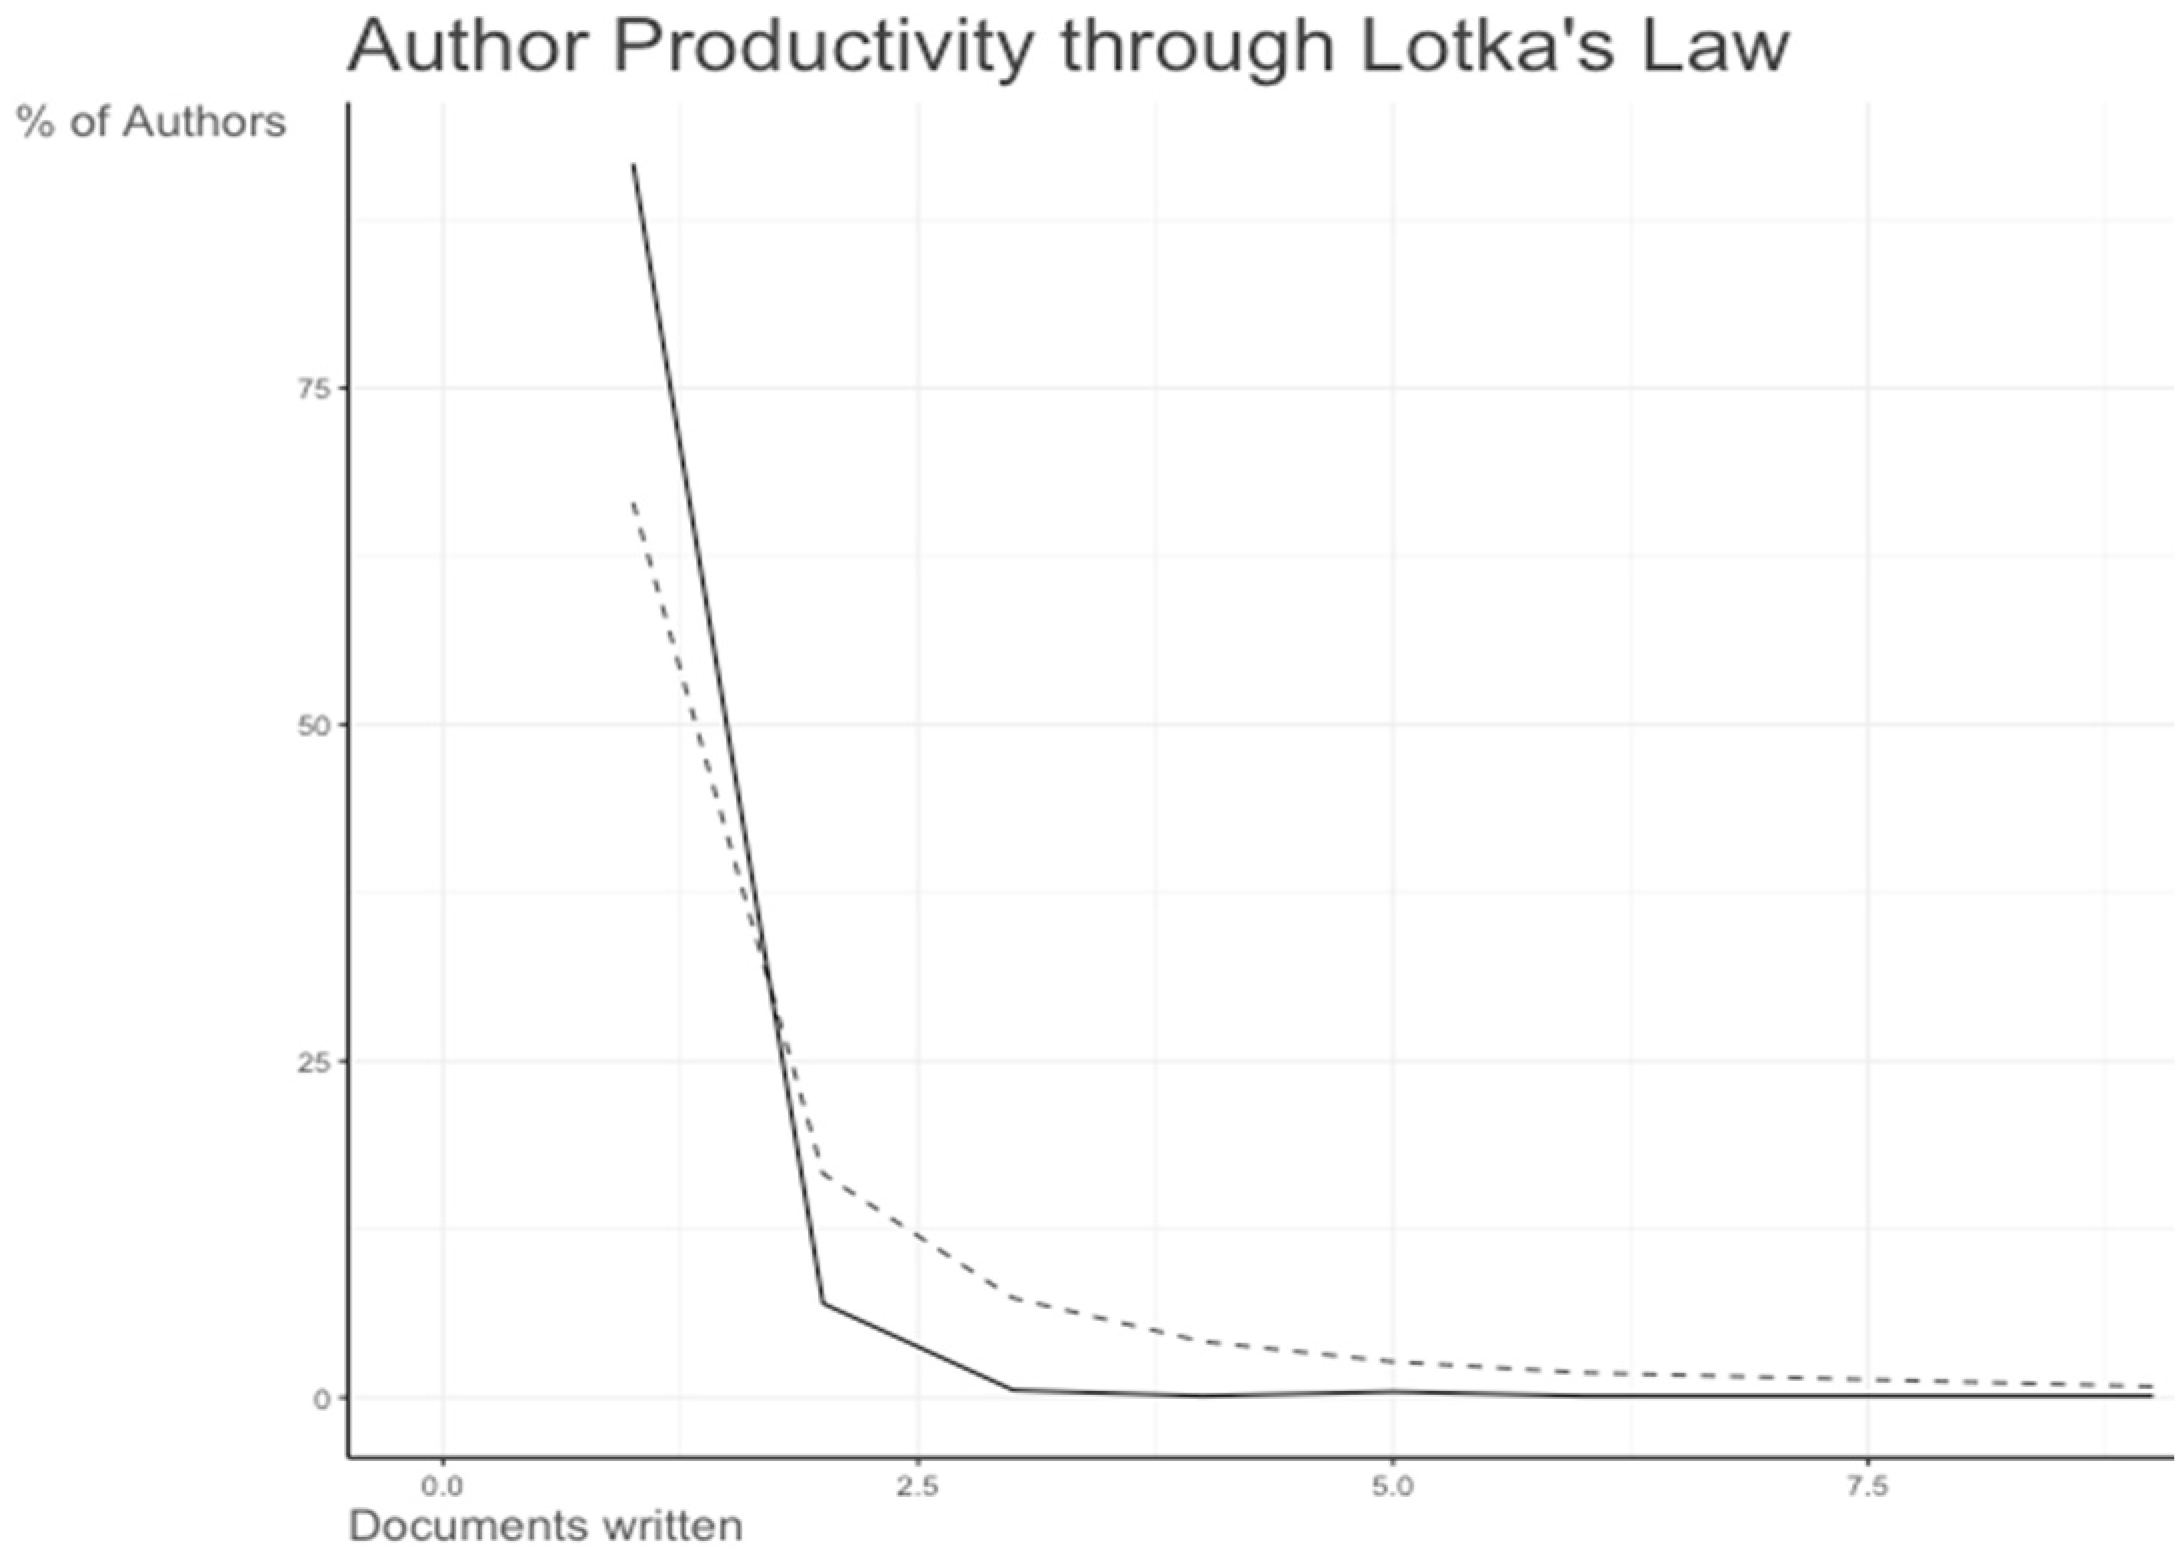
  • Does the author’s productivity align with Lotka’s bibliometric law in the literature on green financial instrument issuance in capital markets?
  • What are the status and linkages in the literature on green financial instrument issuances via capital markets based on conceptual and social structures?
  • Does the word frequency in the literature on green financial instrument issuances via capital markets confirm Zipf’s bibliometric law?
  • What are the trending topics and emerging themes from the literature on climate finance in capital markets?
The focus is 2017–2023, the period after the green finance voluntary action plan launched by the Sustainable Stock Exchanges (Sustainable Stock Exchange Initiative 2017). The plan is intended to guide the capital markets in enhancing their initiatives on green finance mobilization in line with the Paris Agreement.
Existing bibliometric studies on climate finance have focused on broad perspectives. To our knowledge, studies have yet to map the interrelationships and provide evidence based only on capital market issuances, which are vital in private finance mobilization. The remainder of the paper is organized as follows: Section 2 discusses the materials and methods, Section 3 presents the results and discussion of our findings, and we conclude the paper in Section 4.

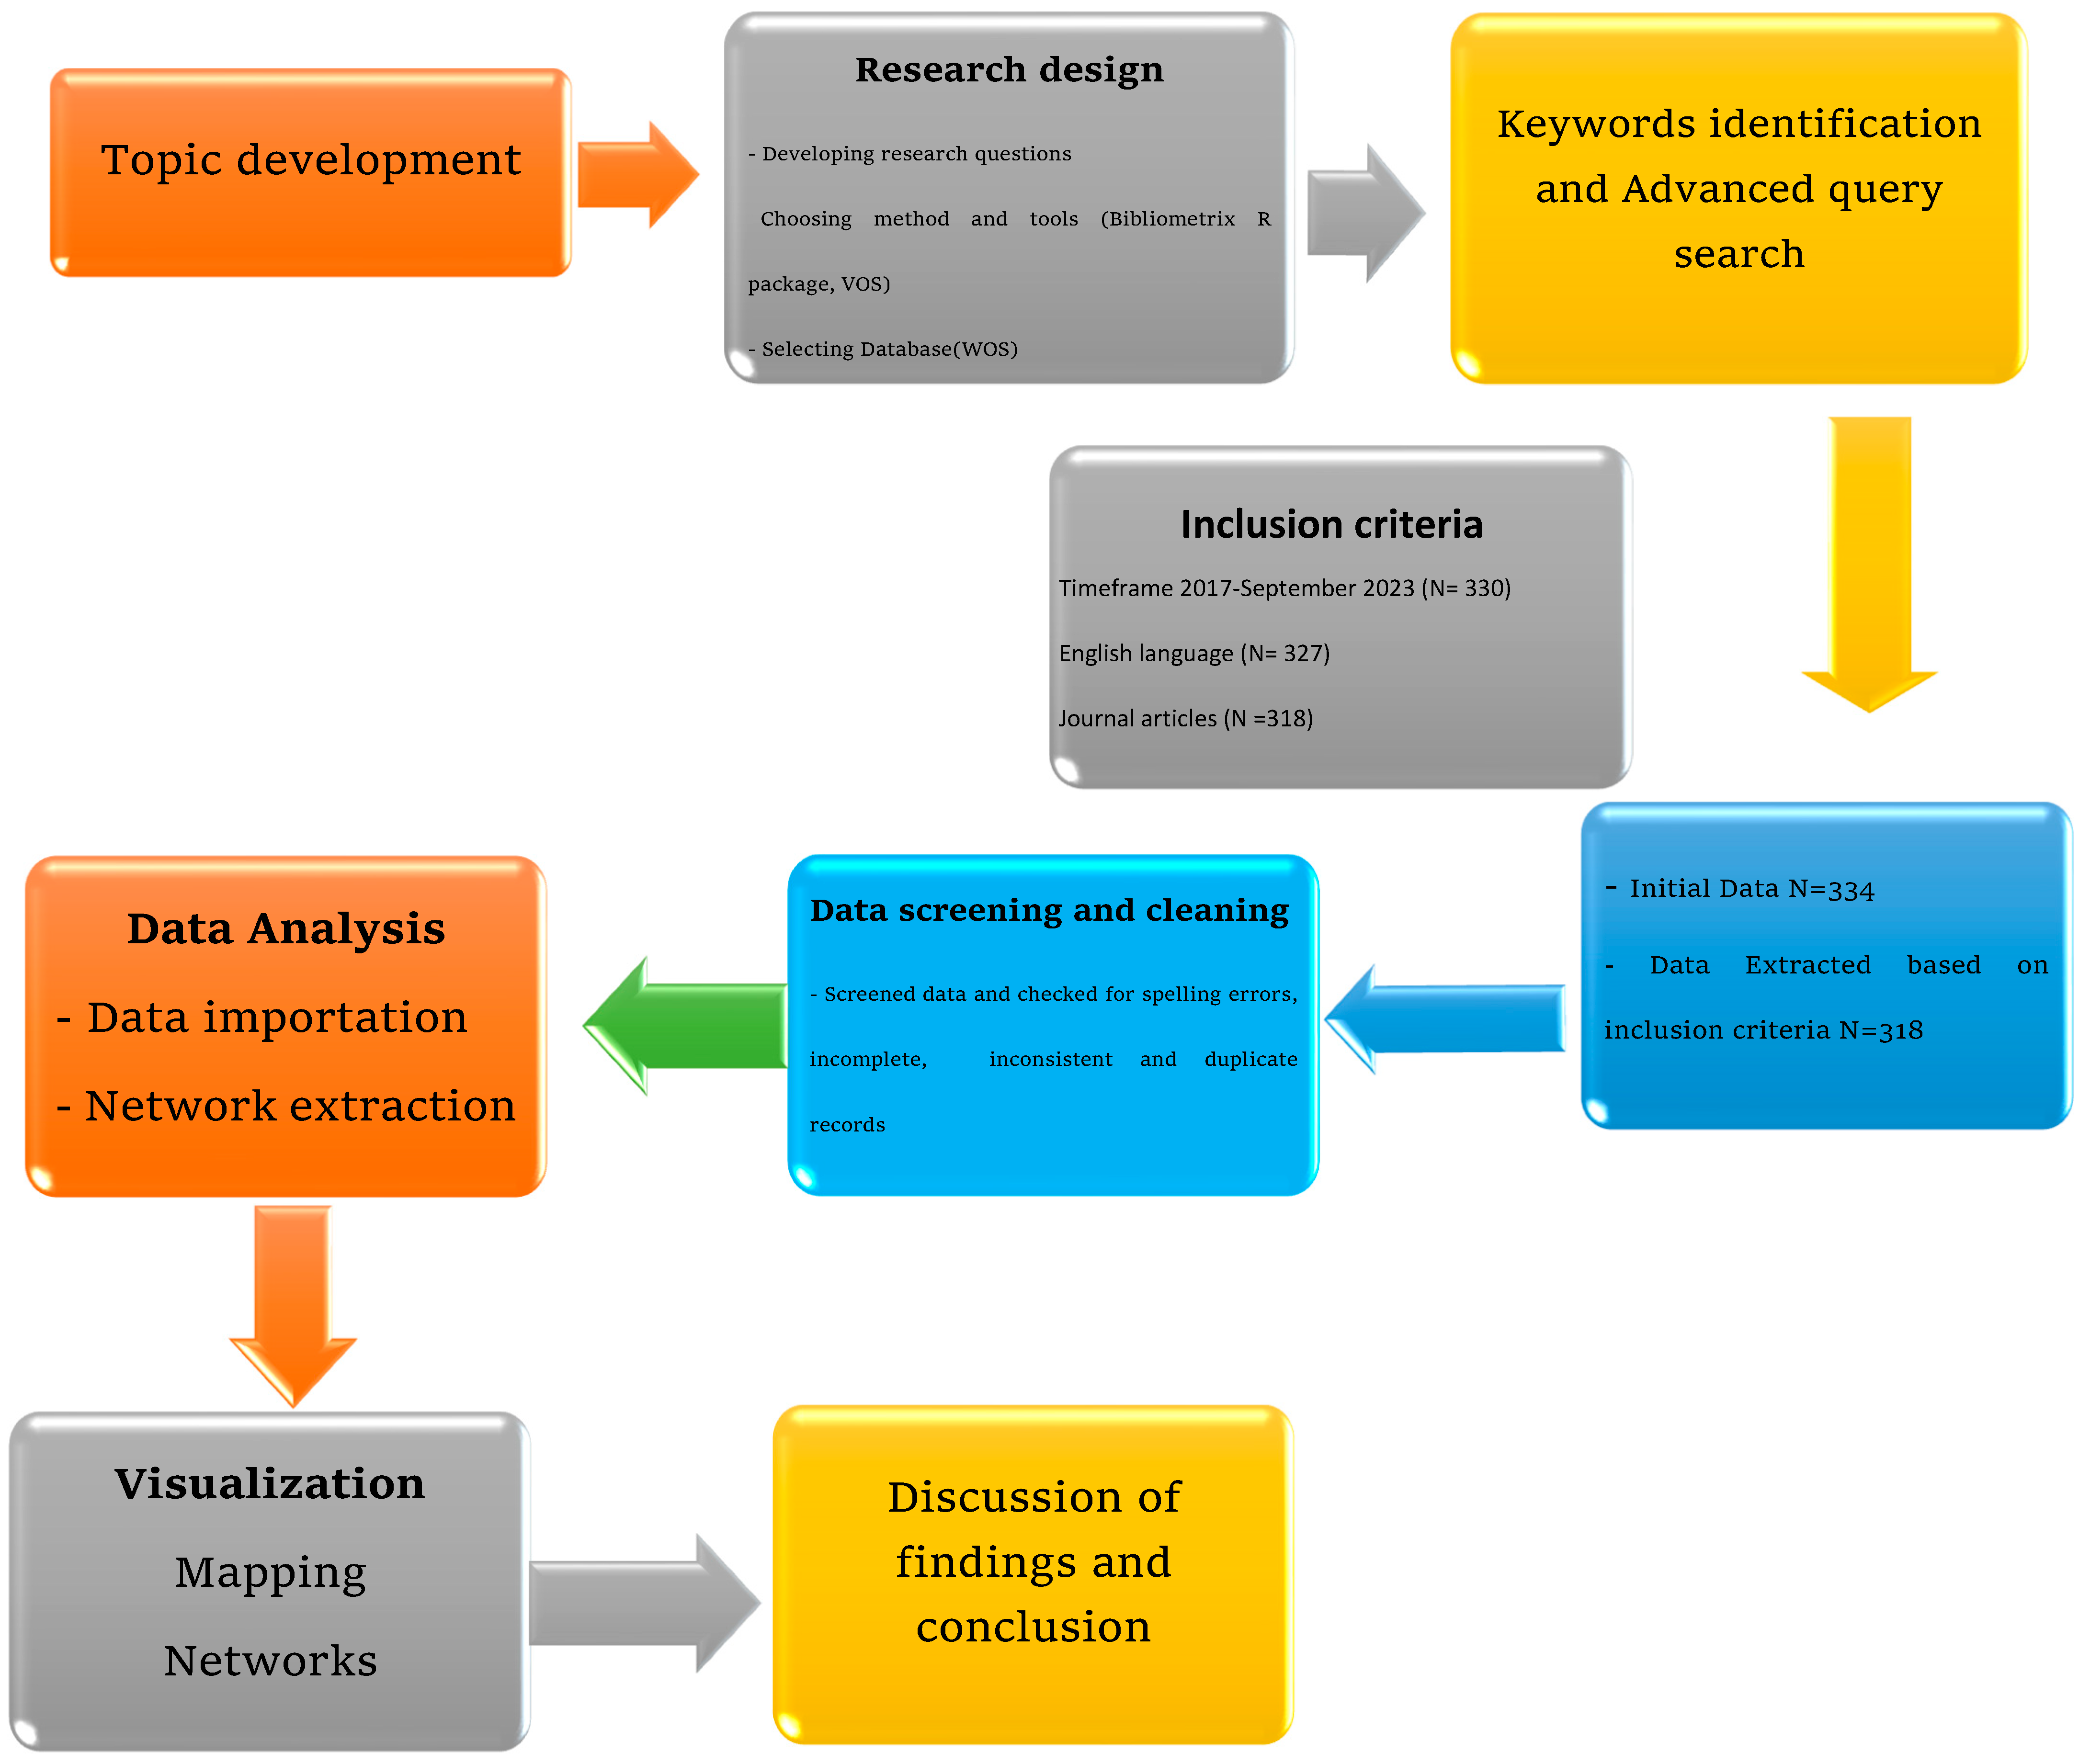
2. Materials and Methods

2.1. Research Framework

The research is a bibliometric analysis of the literature trends, current status, and directions. This analysis is advantageous as it helps synthesize the past literature and utilize the existing knowledge base in an academic world characterized by a vast research stream (Broadus 1987; Naveen Donthu et al. 2021). The research process entailed eight main steps, which were implemented.
First, we developed the topic and then designed the research by defining the research questions and choosing Microsoft Excel version 16.78.3, the VOS viewer version 1.6.20 (van Eck and Waltman 2010), and the Bibliometrix R package version 4.1.4 developed by Aria and Cuccurullo (2017) as the analysis tools. The next step of data collection involved three stages. The first stage was the determination of appropriate keywords related to the topic. The selection of keywords was based on empirical data from the literature review encompassing different phrases employed to depict green financial instruments in capital markets. We then obtained the pertinent literature from the Web of Science website using the advanced query search with the topic field and data restricted to 2017–September 2023, the period after the launch of the green finance voluntary action plan. According to Almeida and Vieira (2023), the Web of Science is a comprehensive database that indexes many high-quality publications from various disciplines. Before export, we refined the documents based on inclusion criteria. This entailed limiting the data to scientific journal articles to ensure that the input data was limited to credible, peer-reviewed sources of information. We also included documents that were written in English language only. Finally, we extracted the data as plain text compatible with the analysis software.
The next stage of the research process involved data analysis. Before analysis, we verified the input data to ensure no duplicates and excluded articles containing missing data. In addition, we checked for spelling errors in journal and author names and checked the keywords and abstracts to ensure that the documents aligned with the study’s scope. After preparing the data, the next step involved importing it into the software and utilizing various methods to extract networks. The aim was to answer the research questions and understand literature trends and linkages. The unit of analysis included journals, citations, keywords, affiliate organizations, countries, and authors. The seventh step entailed visualizing the information using maps and networks. Finally, we discussed the findings to interpret the outputs (see Figure 1).

2.2. Nature of Data

This bibliometric analysis analyzes the literature on climate finance issuances for green investment via the capital markets. We obtained the data from the Web of Science database, similar to (Powell and Peterson 2017; Birkle et al. 2020; Lakner et al. 2021; Muchiri et al. 2022). We restricted research to relevant peer-reviewed journal articles under the period of consideration. This was to focus on strides made in climate finance for green investment in capital markets since the launch of the green action plan by the Sustainable Stock Exchange Initiative as a guiding framework for security Exchanges. The action plan provides guidelines on how stock exchanges can promote green products and services, strengthen environmental disclosures, green the financial markets, and grow green dialogue.
Using the Topic field (TS), we used the advanced search query engine to search the Title-Abstract and Keywords data. Specifically, we applied a nested search query with two parts. The first part comprised nine keywords, including ‘Green financial instrument’, ‘green security(ies)’, ‘green instrument’, ‘green equity’, ‘green index(ces)’, ‘green bond’, ‘green investment’, ‘climate finance’, and ‘green finance’. The second part comprised the keywords ‘capital market’, ‘financial market’, ‘stock exchange’, ‘Security(ies) exchange’, or ‘listed company(ies)’. To factor in slight variations in wording, we incorporate the words ‘green stock’ in the first part. The query search is as follows:
TS = (((“green financial instrument*”) OR (“green securit*”) OR (“green instrument*” ) OR ( “green equity*”) OR (“green inde*”) OR (“green bond*”) OR (“green stock*”) OR (“green investment*”) OR (“climate finance*”) OR (“Green finance*”)) AND ((“stock exchange*”) OR (“capital market*”) OR (“financial market*”) OR (“securit exchange*”) OR (“Listed compa*”) OR (“listed corporation*”)))
As seen in Figure 1, the initial advanced search retrieved 334 publications. Subsequently, we narrowed down the documents based on specific inclusion criteria. Firstly, we limited the timeframe to 2017 to September 2023, resulting in 330 publications. We then refined the search to include only documents in the English language, which reduced the count to 327. Further refinement to include only scientific journal articles yielded 318 peer-reviewed publications based on the specified keywords. These 318 documents were extracted as plain text to align with the analysis tool requirements. Before analysis, we conducted a data examination and cleaning process, which involved manually reviewing the data for duplicate, inconsistent, and incomplete records, leading to the exclusion of 4 articles. Although there were no duplicate documents, three articles contained incomplete records, and one was a retracted publication.
Further, we checked the data abstracts and keywords to ensure the publications aligned with the scope of the study. We also checked and corrected some spelling errors in the journal and authors’ names. Ultimately, the finalized dataset imported into the analysis tools comprised 314 articles that met the established criteria.

3. Results and Discussion

The bibliometric analysis results focus on three areas: The first segment provides a synopsis of the trends in scientific production over the years, relevance of sources via Bradford’s law lens and co-citation analysis, and the authors’ productivity. We then report on conceptual structure in the second part and social structure in the third section.

3.1. Overview

3.1.1. Scientific Production Trend

The scientific production of climate finance instrument issuances in the capital markets has grown since 2017. The analysis of the 314 documents indicated that they were published in 141 sources. The highest publications were in 2022, a 142% growth from 2021 (See Table 1 and Figure 2). Over 80% of papers have been published in the last three years.
As shown in the descriptive statistics in Table 1, production was low, especially in 2017 and 2018, but it is growing tremendously. Research on climate finance issuances in financial markets continues to receive interest from scholars, particularly in the last three years, given the increased attention to climate action topics. This is affirmed by the more than double percentage increase from 2021 to 2022. The numbers in 2023 are low compared to 2022, given that the included data was for three quarters of 2023. Due to the relevance and increasing importance of the topic, the increasing trend in scientific publications will likely continue in 2024 and the coming years.

3.1.2. Core Sources Based on Bradford’s Law

Bradford’s Law pertains to the distribution of literature within a certain subject area (Summers 1983). The genesis of this concept can be traced back to mathematician Samuel Clement Bradford in 1934. The law is derived from his observations and comprehensive study of documents across several journals. Journal articles within a specific topic area can be classified into three zones according to their productivity as defined by the law. The analysis encompasses a central area consisting of highly relevant journals to the issue and two peripheral zones with diminishing article output. The two additional zones have a similar number of publications to the central zone. According to the law, many articles in a specific field are typically published in a limited number of critical journals (Egghe 1990).
Based on Bradford’s law, the most relevant source regarding the frequency of publications was Sustainability. Six sources were categorized as zone 1, the highest category. This represented the journals that had the highest interest to scholars in the climate finance in capital markets field. According to (Desai et al. 2018), Bradford’s zones indicate the degree of significance for the sources, with zone 1 sources referring to select journals that include the most pertinent articles that are extensively referenced. The relevant journals in the top twenty categories accounted for 51.6% of the total documents. The journals included Energy Economics, Journal of Cleaner Production, Environmental Science and Pollution Research, and Resources Policy (see Table 2). The sources are divided into Energy, Environmental Studies, Economics, and Finance categories.
Of the top ten journals, three relate to energy, two are multidisciplinary journals, two are environmental journals, two are finance journals, and one is a technological source. We analyzed the scope of the sources and found that the aims of six of these top journals cover ecological aspects and sustainability, which aligns with the expectations given that our topic falls under these subjects. The scope of journals relating to the energy markets spans from fossil fuel economics to renewable energy economics, which are associated with climate change discussions. Despite the topic search being inclined to finance, only 20% of the top publications are from finance sources, with part of their scope covering financial markets. This indicates that top finance journals are yet to publish articles on climate finance in financial markets significantly. According to the Scimago Journal and Country Rank (SJR) (Scimago Journal & Country Rank n.d.), all ten journals fell under the Q1 category in 2022 for at least one of the subject categories, indicating that most publications on the topic are in sources ranked among the best.
Further, as seen in Table 3, each of the three zones represented approximately 33% of the total articles, totaling around 105 articles based on our data. Additionally, zone 1 comprised the minimum sources (6), which increased sixfold in zone 2 to 36 and further to 99. This aligns with Bradford’s law, which posits that a small number of core journals contain the majority of articles, and zones should have a roughly equal distribution of articles. Consequently, we concluded that the distribution of articles across the different sources adhered to Bradford’s law.

3.1.3. Top Relevant Sources by Co-Citation Analysis

Co-citation analysis is appropriate for business scholars aiming to identify influential publications and fundamental knowledge in their field (Donthu et al. 2021). Co-citation coupling involves coupling publications that are cited together by other papers contained in the dataset. The co-citation analysis using the fractional count method is preferred in assessing the author’s contribution (Luto 2016; Sivertsen et al. 2019).
The fractional count method exhibited that the Energy Economics source ranked first, following the number of citations in papers within the data collected despite it being second according to the number of publications. The other most locally cited sources included the Journal of Clean Production, Finance Research Letters, Energy Policy, Sustainability, and Resources Policy (see Table 4). The Sustainability source was the most pertinent as per the number of publications but fifth in the local citations. Finance research letters had a higher rank based on the number of citations. Eight of the top ten journals made the list of relevance based on the number of publications, as discussed in Section 3.1.2 above, as well as co-citations. This indicates that authors that publish in these eight journals are quite active, which raises the number of publications and the volume of citations for their papers in proportion to their publication activity.
To affirm the author’s activity findings, we analyzed the H-index of these top journals. We generated the index by running the Biblioshiny sources’ local impact and made a comparison with the SJR ranking. From the analysis, The Journal of Clean Production, Energy Economics, and Sustainability had the highest H index, respectively, suggesting authors in these sources have a high average publishing activity relative to the times their work is cited. A comparison of SJR (Scimago Journal & Country Rank n.d.) H-index scores of the same sources indicated that the Journal of Clean Production was still the top source, scoring 268. Energy policy came second (254), followed by energy economics, while Environmental science and pollution research, and Sustainability sources had indices above 100.

3.1.4. Author Productivity via Lotka’s Law Lens

Lotka’s Law was proposed by statistician Alfred J. Lotka in 1926. It argues that specific authors in a given subject exhibit higher productivity and a more significant volume of publications than others in the same field (Huber 1998). In other words, a limited number of authors is expected to write a significant proportion of articles on a specific topic. The law argues that about 60% of authors in a subject area will have one publication, 15% will have two publications, 7% will have three publications, and only 6% will produce more than ten articles (Sahu and Jena 2021).
This is based on the formula yx = c × 1/x2 where
yx is the number of authors with x publications;
c is the number of authors.
The study evaluated the fitness of Lotka’s bibliometric law in assessing authors’ productivity, as presented in Figure 3 and Table 5. According to the law, about 60% of authors in a subject area will have one publication, 15% will have two publications, 7% will have three publications, and only 6% will produce more than ten articles. The findings indicate that 98.7% of the authors have produced 2 or fewer publications, with only 12 authors publishing 3 or more articles. The highest author productivity is nine articles.
More than 90% of authors studying green financial instruments in capital markets have only one publication, contrary to the 60% expected by Lotka. Furthermore, there is a 7% and 6.45% deviation from the expectation for authors with two and three publications, respectively. These statistics demonstrate a deviation from Lotka’s law, leading to the conclusion that the green financial instrument issuances for climate finance in capital market literature do not align with Lotka’s law.

3.2. Conceptual Structure
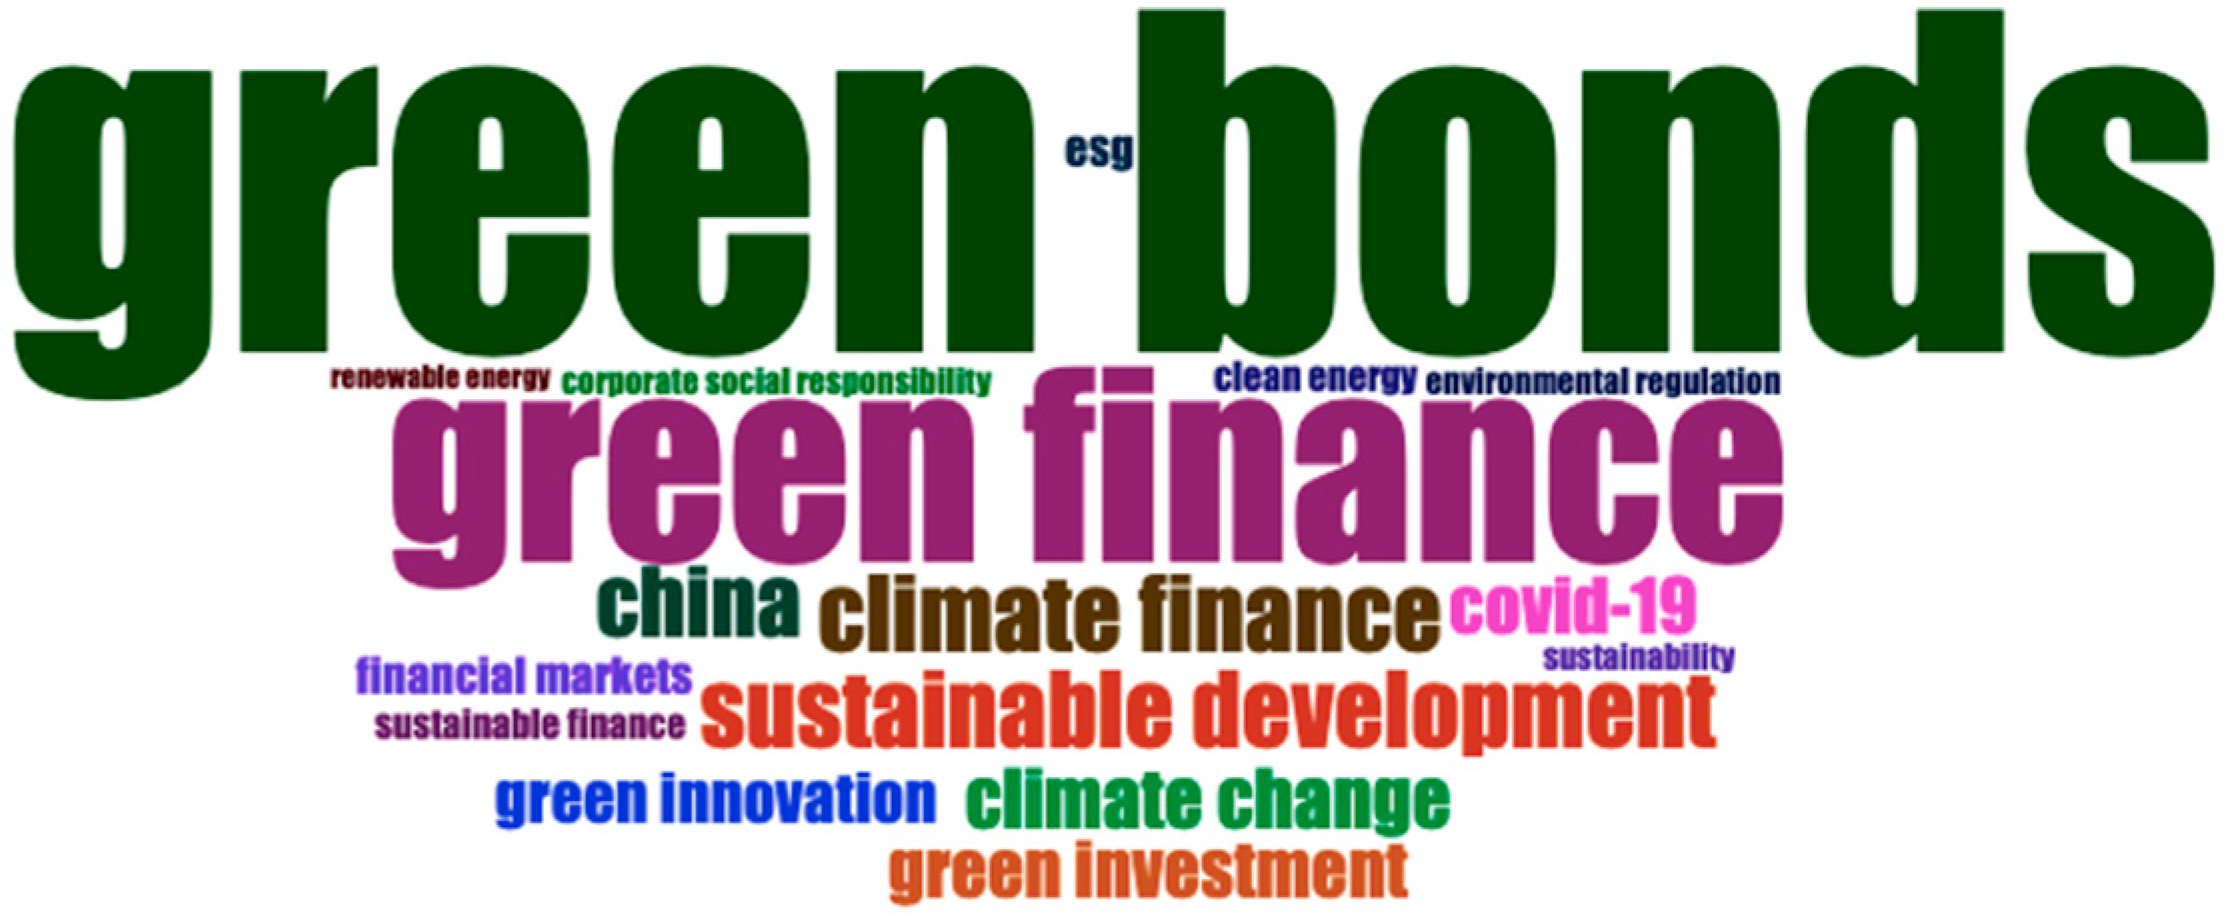
The network approach of conceptual structure entails exploring relationships to determine the co-occurrence of words, titles, or abstracts and the evolution of themes (Aparicio et al. 2019; Cobo et al. 2011). The process involves categorizing data into study areas, pointing out the most popular themes, and identifying patterns that could support the forecast of research directions (Aria and Cuccurullo 2017). This section focuses on the word cloud results, keyword co-occurrence network, and thematic evolution.

3.2.1. Word Cloud

The word cloud overviews the essential and frequent keywords based on researchers’ interests (Hearst et al. 2020; Yang et al. 2020). Figure 4 indicates that ‘green bonds’ and ‘green finance’ are the main keywords of interest in the analyzed publications (Laborda and Sanchez-Guerra 2021; Banga 2019; Flammer 2018; Baulkaran 2019; Dong et al. 2022; Anderloni and Tanda 2017). The frequency of appearance was 102 and 58, respectively, in the authors’ keywords. Other notable words that have attracted attention include ‘climate change’ and ‘climate finance’. The finance of climate change and its governance has been reviewed with some keen focus on adaptation finance (Scoville-Simonds 2016; Calvet et al. 2022). Further, research on the relationship between climate change, economic aspects, and risk management was notable (Stern 2022; Wright et al. 2015; Rocha et al. 2022; Tripathy 2017). ‘Sustainable development’, ‘financial markets’, ‘green investment’, ‘green innovation’, ‘corporate social responsibility’, ‘environmental regulation’, and ‘China’ words were also striking (Purkayastha and Sarkar 2021; Dong et al. 2022; Chen et al. 2022; Chi et al. 2023; Huang and Lei 2021). The interdependence of green bonds and other financial markets, including the stock market, carbon, and conventional financial markets, has garnered attention, majorly in China (Ren et al. 2022; Jiang et al. 2022a; Su et al. 2022; Naeem et al. 2021; Elsayed et al. 2022; Verma and Bansal 2023; Xi and Jing 2022; Mensi et al. 2022). However, despite the analysis’ slant toward green capital market products, ‘green equity’ and ‘green equity indices’ were uncommon and did not appear in the word cloud.

3.2.2. Keyword Frequency via Zipf’s Law Lens

Zipf’s Law uses statistical techniques to arrange words based on their frequency, using statistical techniques. It suggests that the product of the word frequency and rank number in terms of frequency is roughly constant for a distribution (Bookstein 1976; Quoniam et al. 1998). This bibliometric law expounds on the correlation between the present index value and frequency, indicating that joint degrees are more desirable than the expected lowest and maximum values. The law posits that for a word frequency distribution, the most prevalent word appears twice as often as the second most prevalent word, four times as often as the third most prevalent word, and eight times as often as the fourth most prevalent word. Applying Zipf’s Law to analyze word frequency can benefit indexing in a particular domain. Similar to the works of Almeida (2023) and Almeida and Vieira (2023), we evaluate if the three vital bibliometric laws apply to the study’s data.
Zipf’s bibliometric law suggests that the word frequency distribution follows a predictable pattern. The findings in Table 6 depict that ‘green bonds’, the most common word, appears 1.75 times as ‘green finance’, the second most used word. Additionally, ‘green bonds’ appears 4.4 times more often than ‘Sustainable development’, the third most frequent word, and 4.9 times more often than ‘China’, the fourth most common word. These findings partially conform to Zipf’s Law since the term ‘green bonds’ appeared almost twice as often as ‘green finance’ and four times as often as ‘sustainable development’.

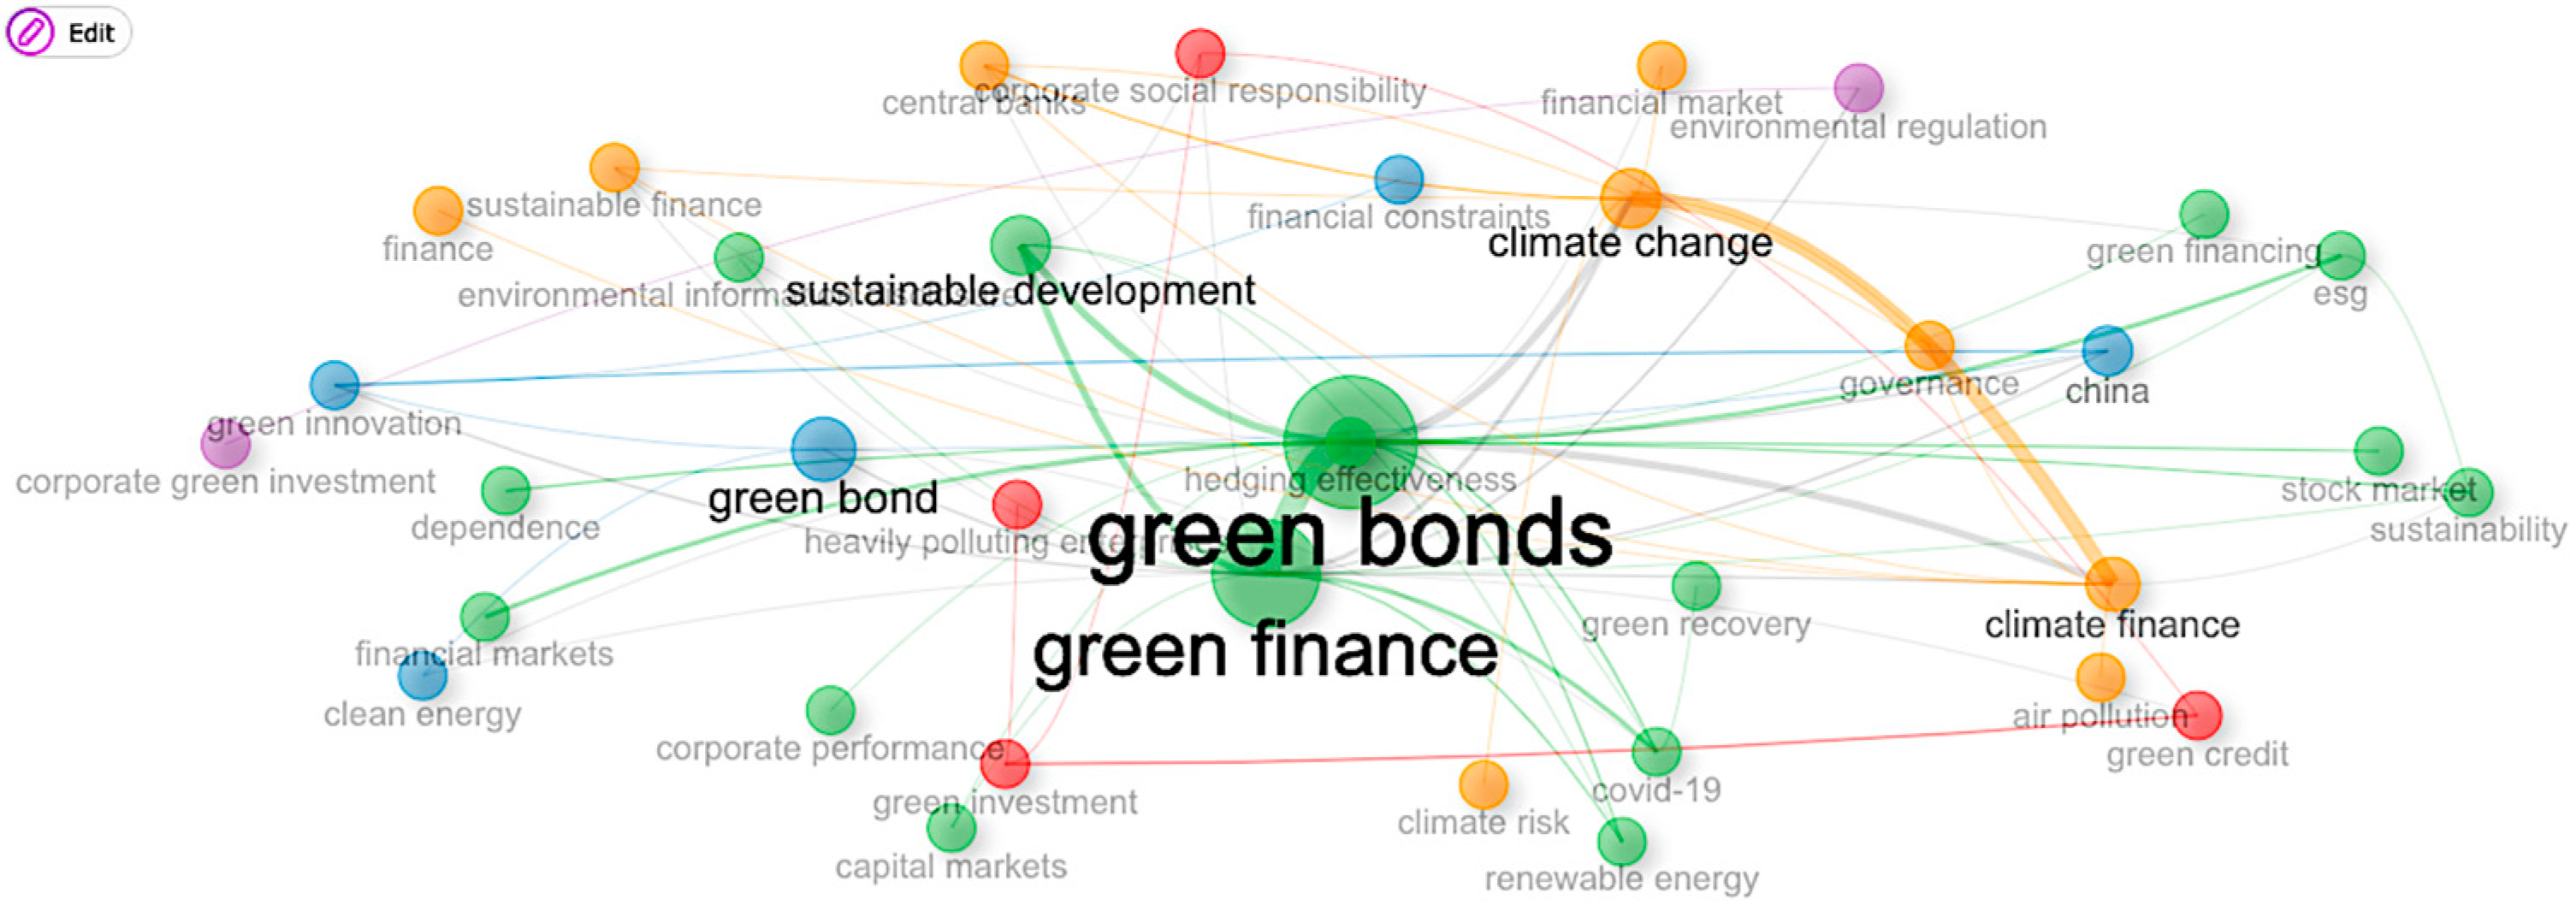
3.2.3. Keyword Co-Occurrence Network

The co-occurrence analysis investigates the subject matter’s conceptual structure by analyzing the documents’ most integral keywords. It can explore links between document keywords, abstracts, titles, or subject categories (Callon et al. 1983; Zhang et al. 2015). We conducted the keyword co-occurrence network (Figure 5) to understand the links between the main keywords illustrated in the word cloud. The node size indicates the frequency of the keyword, with a large node denoting a high appearance. The links indicate the words that occur together, with a thick link showing a greater co-occurrence (Donthu et al. 2021). Different colors are used to differentiate the clusters based on themes.
The network comprised 36 author keywords grouped into 5 clusters. The green cluster (16 words) was mainly represented by the link between ‘green bonds’ and ‘green finance’. This was the thickest link, implying that the two keywords were the fundamental focal area of researchers. The central focus of this cluster entailed trends in the development of green bonds, their efficacy as a green finance mobilization tool, and the opportunities and challenges relating to their issuance (Kiseleva and Efimov 2019). According to Zhou (2019), green bonds are an essential green financing instrument in China. However, the green bond market faces many challenges, including limited product categories, insufficient information disclosure, and unmatured green bond standards.
The significance of green bonds as a global debt climate financing instrument was reaffirmed by (Hadas-Dyduch et al. 2022). They further found evidence of capital mobilization, the growing prominence of the green financial industry, investor preference, and credibility advantages as crucial factors behind the issuance of green government bonds. In a study on green bond financing in Ghana, Mankata et al. (2022) highlight high credit ratings, adherence to local regulations, appropriate green qualifications criteria, and giving preference to feasible projects as the highest-ranking aspects in assuring adequate infrastructural green bond financing.
Other pronounced links in the cluster are between ‘sustainable development’ and ‘green finance’, ‘financial markets’ and ‘green bonds’, and ‘COVID-19’ and ‘green finance’.
In evaluating the effect of COVID-19 on the relationship between green bonds and financial markets, Naeem et al. (2021) results suggest that COVID-19 impacted the return interconnectedness of significant financial instruments, including green bonds. Noteworthily, green bonds’ role as a hedger asset in the financial market network during a crisis is essential. Similarly, Mensi et al. (2022) highlights that green bonds and stock markets are interdependent, especially in times of crises, including the global financial crisis and COVID-19.
A group of researchers evaluated the relationship between green bonds and the energy markets, including the oil, renewable, and clean energy markets. While assessing the interaction between the climate change index, green financial assets, and renewable energy markets at the beginning of the Russia–Ukraine war and in the aftermath of the second wave of COVID-19, Lorente et al. (2023) reported a negative relationship between green assets, clean energy markets, and geopolitical risk. In an associated study, Jiang and Jia (2022) found pronounced spillover effects from the green bonds market to the clean energy markets.
Under the same cluster, we identified scholarly interest in the stock market reaction to green bond issuances. Along this line of investigation, Baulkaran (2019) found positive cumulative abnormal returns due to green corporate bond issuances, majorly in Europe. In addition, Verma and Bansal (2023) also reported a positive significant effect on stock prices due to green bond issuances. The primary focus on this topic is on the impact of green bonds and no other green financial instruments, including green equity and indices. Further evaluation of the effect of the green issuances on ‘corporate performance’ is still minimal. Other articles under the green cluster included (Prakash and Sethi 2022; Rao et al. 2022a; Elsayed et al. 2022).
The second cluster was the orange cluster (nine words). The most prevalent link in the cluster was based on the words ‘climate change’, ‘climate finance’, and ‘governance’. Climate finance mobilization and appropriate governance, to some extent, determine whether or not climate adaptation and mitigation targets will eventually be met. Purkayastha and Sarkar (2021) noted that, to a large extent, the current regulation in the financial system needs a shift to align with climate finance aims, particularly in mobilizing private climate finance. Moreover, Gunningham (2020) emphasized central banks’ and other financial regulators’ regulatory and governance role in enhancing the transition to a low-carbon revolution. Adopting the Paris Agreement to tackle ‘climate change’ led to policy development across relevant institutions. Therefore, a look into ‘governance’ in various institutions, including corporations and capital markets, is expected. The connection between ‘climate change’,’ climate risk’, and ‘central banks’ is also noteworthy but has a low appearance in the network. Central banks’ importance in guiding climate risk management of the financial system cannot be undermined (Gunningham 2020; Shirai 2023).
The red cluster (four words) is centered on the keyword ‘green investment’. Connection is found with ‘corporate social responsibility’(CSR), ‘green credit policy’, and ‘heavily polluting enterprises’. Green credit policy studies from the data majorly assess its effectiveness in enhancing green investment, thus reducing the polluting behavior of enterprises in China. Chen et al. (2023) found a positive significant relationship between green credit policy and carbon neutrality in a study targeting Chinese listed firms. These findings were similar to those of Lu et al. (2022). Green credit policies encourage polluting firms to adopt environmentally sustainable practices (Zhang et al. 2021). However, the positive impact of the green credit policy is not felt across all regions; it is majorly felt across state-owned enterprises and large-scale firms compared to small and medium-sized firms.
The linkage between corporate social responsibility and green investment was also prevalent under the red cluster. An assessment of the influence of green investment and corporate social responsibility on financial and sustainable performance by Indriastuti and Chariri (2021) found a significant positive relationship. Similarly, (Zhou and Cui 2019) empirical results indicated that the issuance of green bonds for green investment in Chinese listed firms positively impacts CSR and signals positive to the investors. The empirical evidence on green investment, CSR, green credit policy, and heavily polluting firms is provided for China but still needs to be in other countries. This focus is expected, given that China channels loan financing from polluting firms to emission-reducing firms (Ha 2009).
The blue cluster’s main link is between the keywords ‘green innovation’ and ‘China’. A further check on the 17 green innovation papers revealed that they all focused on China’s economy. One group of researchers evaluated the effect of green finance on green innovation. Rao et al. (2022b) found a positive significant relationship, particularly for state-owned, large, and less-emitting enterprises. Moreover, Li and Yang (2022) and Jiang et al. (2022b) indicate enhanced technological corporate innovation from green finance. Empirical evidence on green innovation of listed corporations in other countries is missing.

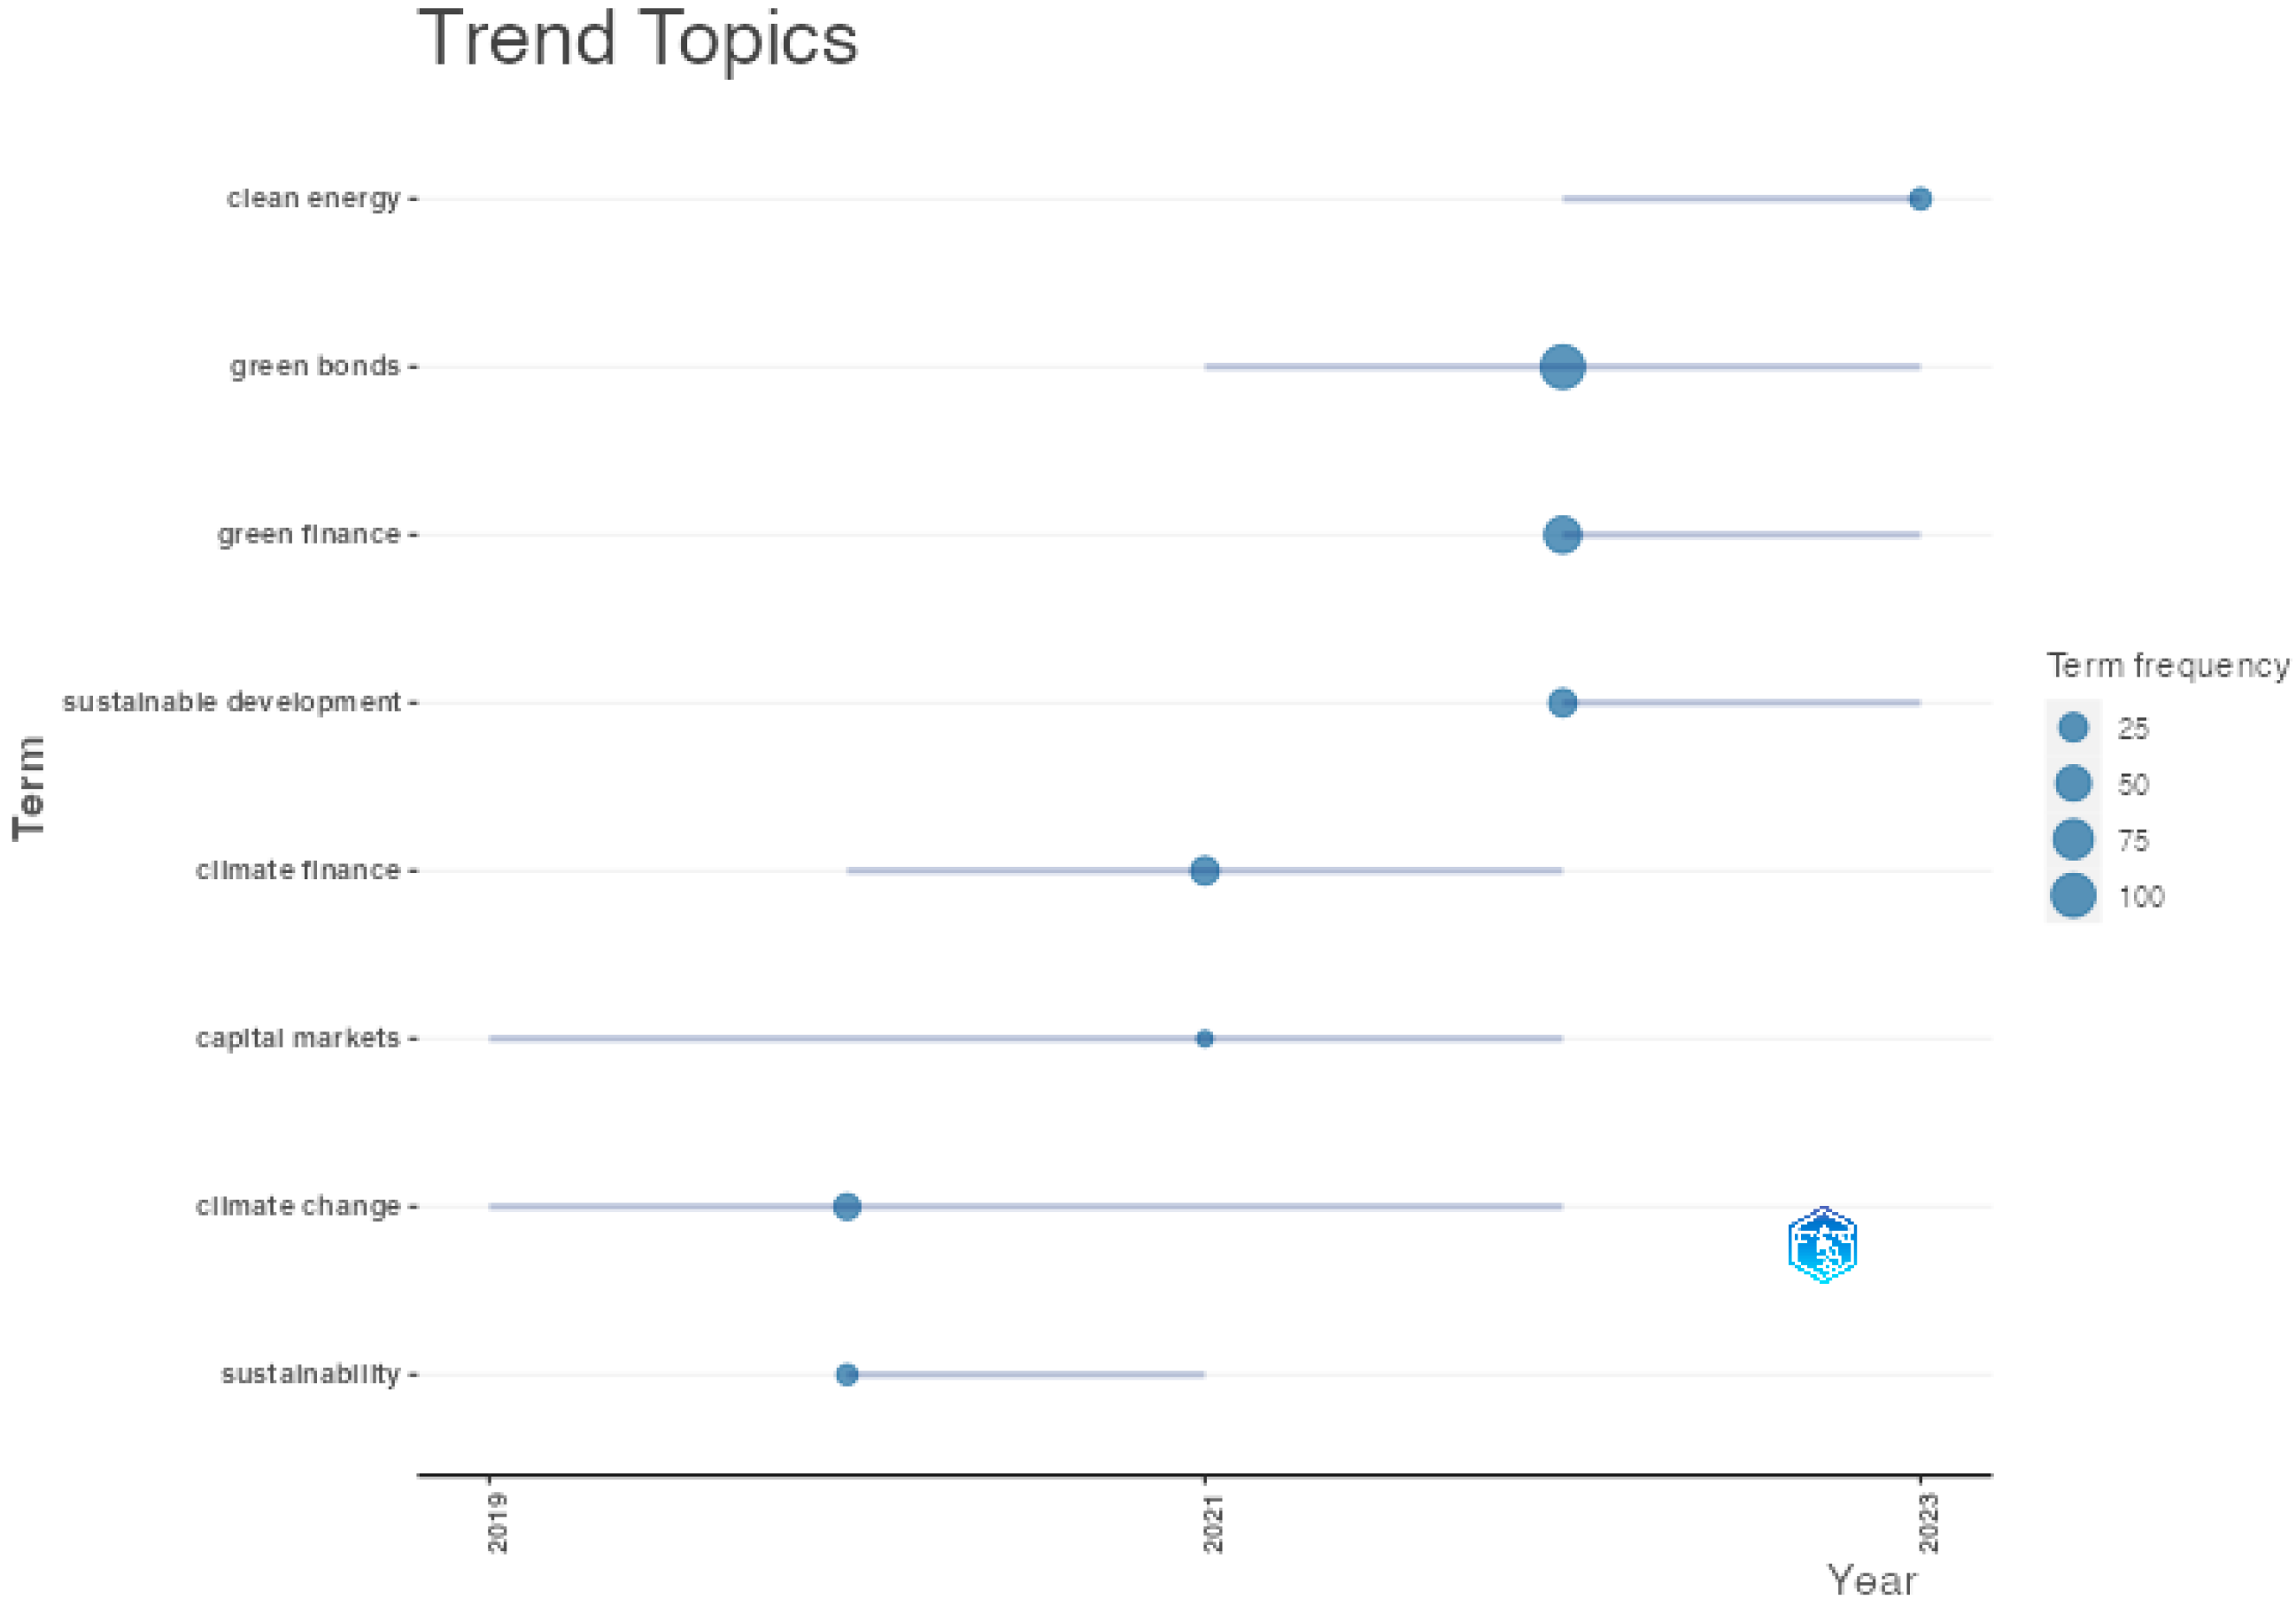
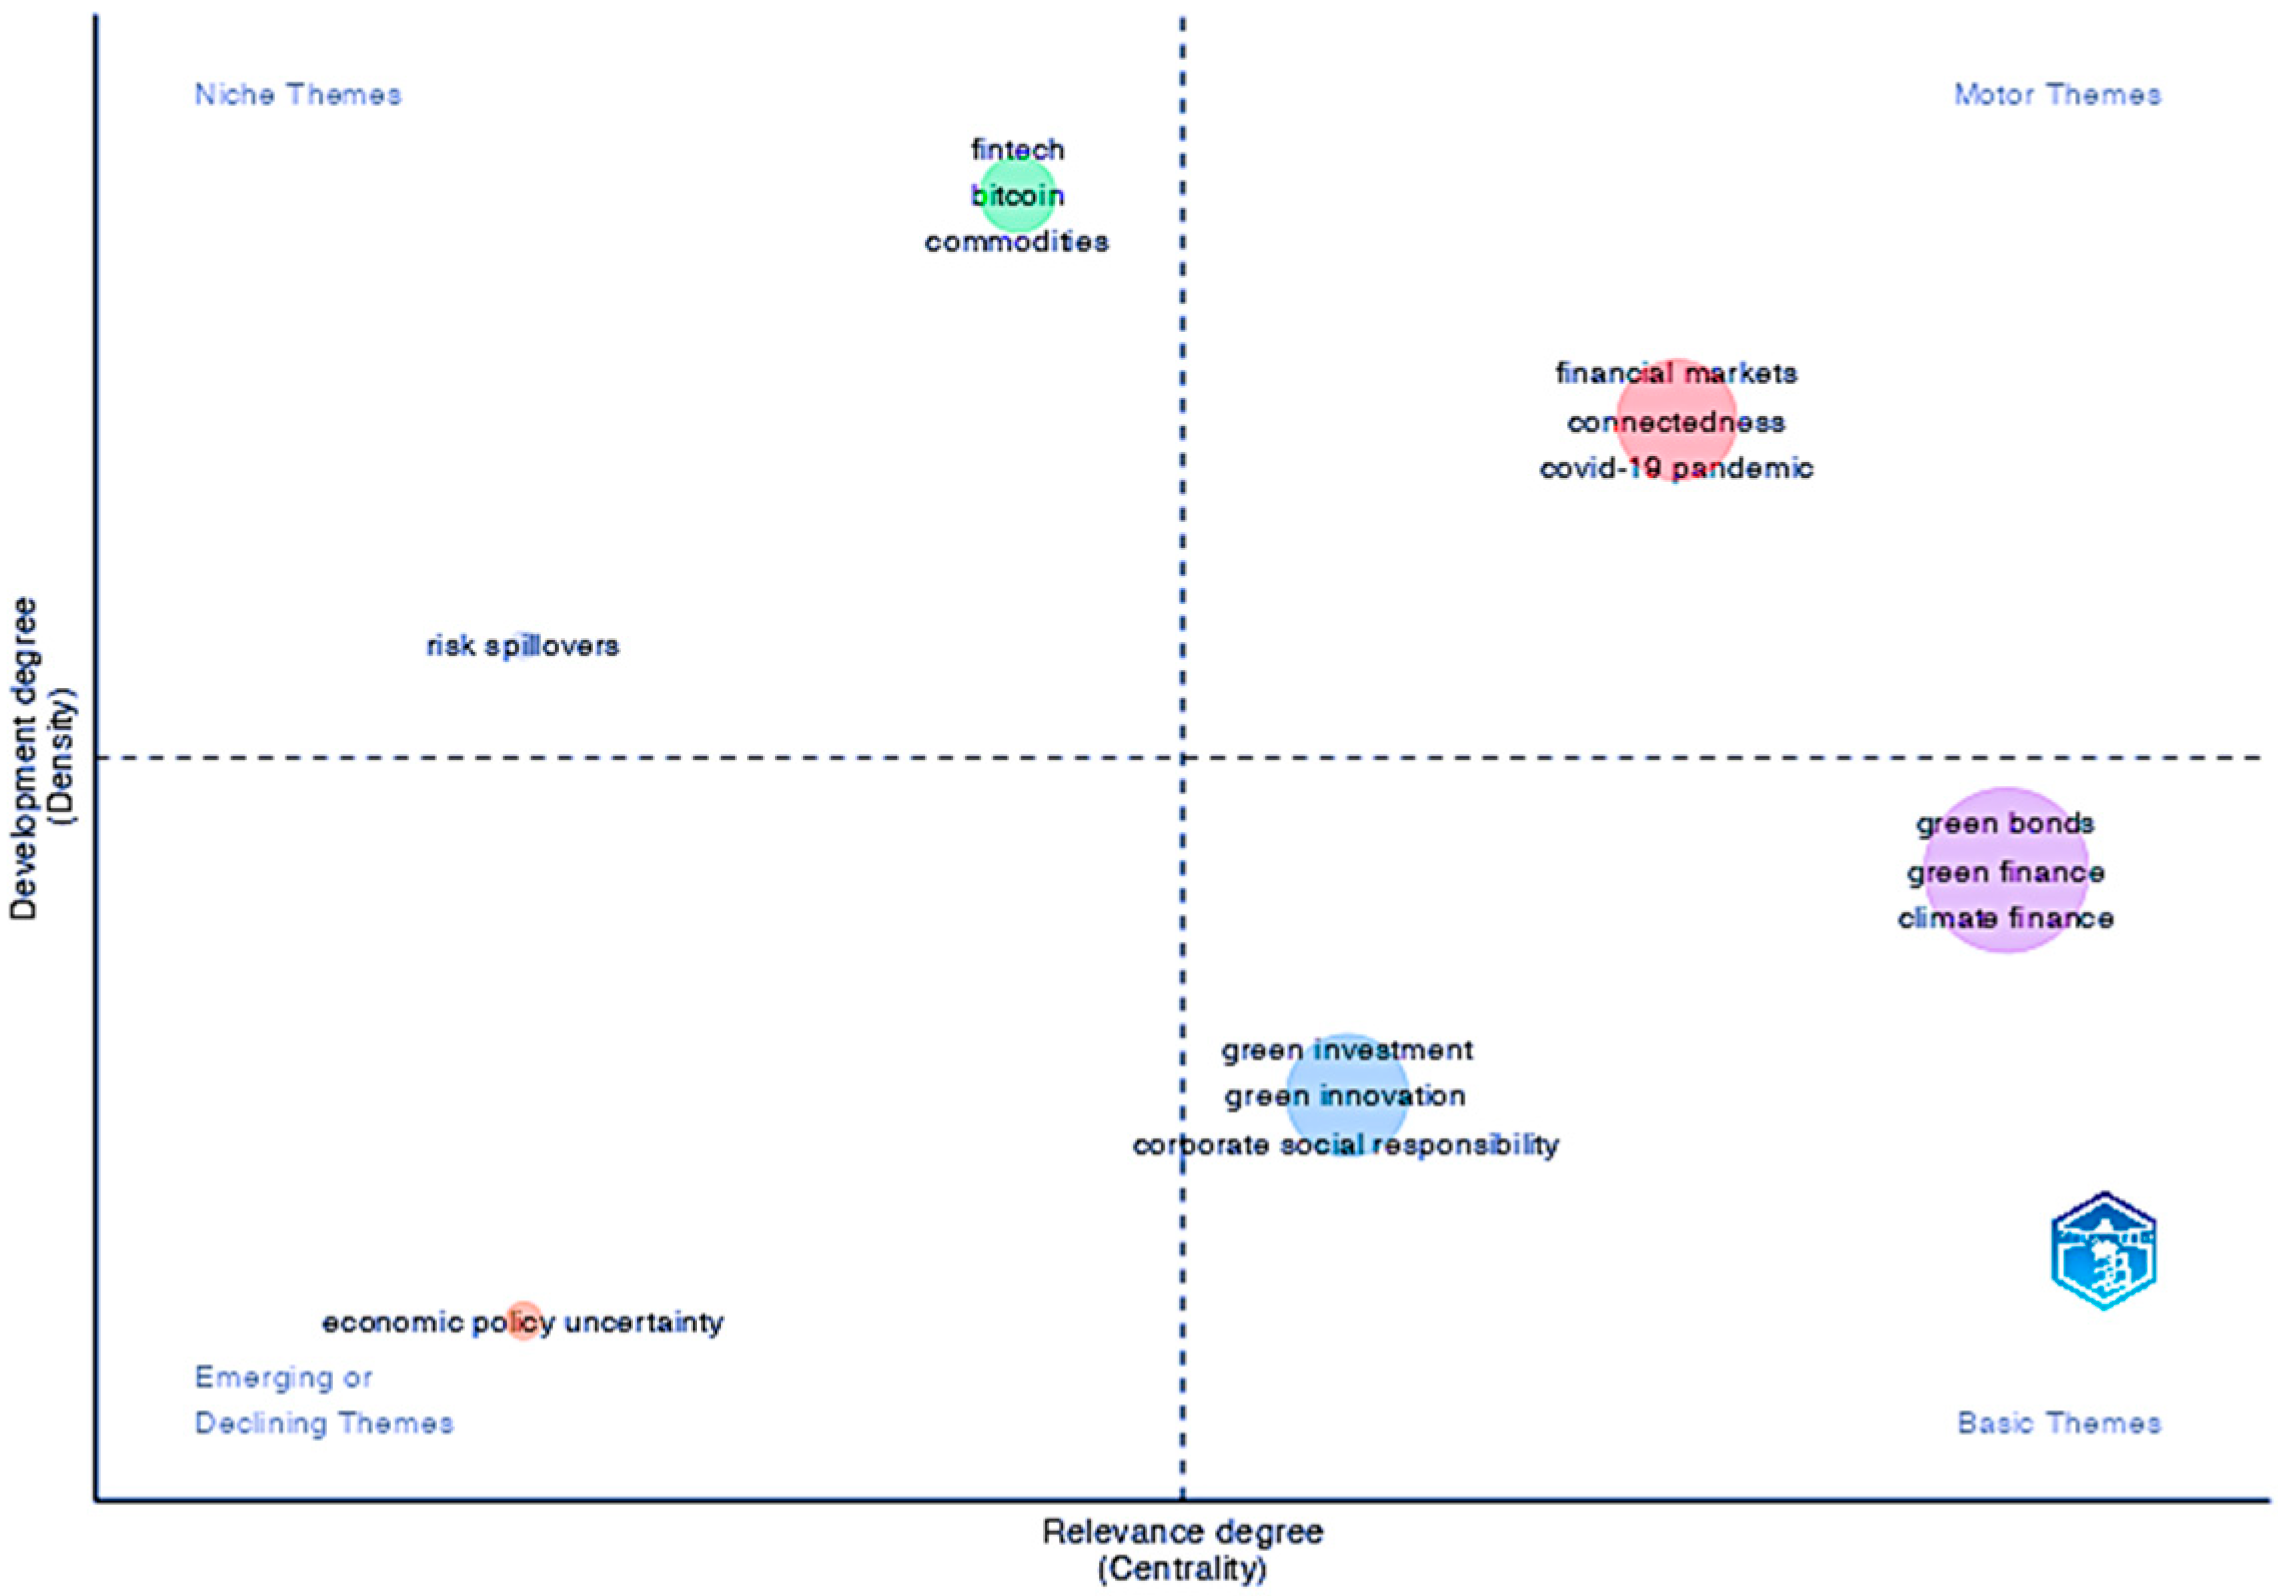
3.2.4. Trend Topics and Thematic Map

The trend topics exhibit the level of scholarly attention given to various keywords by researchers across the years. Conversely, the thematic map shows the past, current, and future research patterns (Janik et al. 2021; Rani et al. 2023). Motor themes, characterized by high centrality and density, are advanced and relevant to the structure of the research field. Basic themes include the past and auspicious matters relating to the subject. Niche themes have a high density, implying they are well developed but contribute a limited role in the entire area. Emerging or declining themes can gain more centrality or density depending on the direction of movement. They therefore may serve as a springboard for new trends or advancements in the subject (Khare and Jain 2022).
Figure 6 depicts the current research trending topics from 2022 to 2023 related to clean energy markets, green bonds, green finance, and sustainable development. The recent prominence of clean energy research could be attributed to the clean energy transition discussions following the global energy crisis heightened by the Russia–Ukraine war that impacted the global energy markets (Umar et al. 2022). Despite the terms sustainable development and sustainability being first mentioned in the 19th century (Du Pisani 2006), they have gained popularity in the 2020 decade when the UN Sustainable Development Goals are targeted to be met. The topic of green bonds has gained prominence since 2021, with the most significant interest in 2022. The subjects of climate finance, financial markets, climate change, and sustainability experienced a notable increase in attention from 2019 to 2022. This trend can be explained by the numerous climate action calls, particularly in the aftermath of the ratification of the Paris Agreement.
To further understand these trends, we analyzed the theme map (Figure 7 and Table 7) to gain insight into the historical, present, and potential future research trends.
The themes are assessed based on the degrees of Callon development (density) and relevance (Centrality). The Callon centrality metric assesses the importance of a theme by considering the strength of its connection with other clusters. At the same time, Callon’s density index measures a theme’s development level by looking at the strength of links within the cluster (Callon et al. 2005; Yu et al. 2021).
Table 7. Cluster centrality and density. Source: Authors’ compilation (2024) based on WOS data. The table highlights the level of importance and development of six main theme clusters based on the Callon metric.
Main ClustersCallon CentralityCallon Density
Financial markets0.57449494938.38383838
green investment0.37043597726.45356754
fintech0.14583333342.22222222
green bonds1.34751075828.5799679
economic policy uncertainty025
risk spillovers033.33333333
The highest degree of centrality was observed for the green bonds cluster (1.3475) beneath the basic theme and the financial markets cluster (0.5744) under the motor theme as measured by the interconnection among sets. The green bond cluster comprising 31 words was the largest. Researchers under this cluster focused on topics such as ‘green and climate finance’, ‘impact investing’, ‘climate change and risk’, ‘ESG’, ‘renewable energy’, ‘green recovery, ‘environmental protection’, ‘economic growth’, ‘sustainable development’ and ‘market value’. The financial markets cluster (20 words) was the second largest with some main keywords including ‘connectedness’, ‘dependence’, ‘stock market’, ‘hedging’, ‘portfolio diversification’, ‘event study’, ‘COVID-19’, and ‘conventional financial markets. Most papers in the two top clusters examined studies on one element inside this cluster and another component from a distinct set.
A closer examination of the literature revealed that the most relevant authors, including Muhammad Abubakr Naeem, Aviral Kumar Tiwari, and Emmanuel Joel Aikins Abakah, have significantly contributed to the clusters above’ centrality. Their overall focus is on the relationship between financial markets, including conventional financial, Islamic, commodities, bond, and clean energy markets, as well as the influence of crises and green financial instrument issuances on markets, as addressed under the keywords co-occurrence network. Other researchers contributing to the highest centrality include (Mocanu et al. 2021), who applied the event study methodology to assess the stock market reaction to sustainability bond issuances and found a small negative impact. Another group of researchers evaluated the connection between green financing and environmental sustainability on economic growth and green recovery. For example, Ma et al. (2023) found disparities in the impact of green funding based on the country’s level of development. Further, (Hu et al. 2021) argued that green funding piloting increases the value of enterprises and could potentially promote the green recovery of economies.
Regarding theme development, Callon’s density top two rankings were for the ‘fintech’ (42.222) and ‘financial markets’ (38.38383) clusters, indicating the highest internal strength of the networks. Studies in these categories are closely related and revolve around issues from the same cluster. The main topics in the ‘fintech’ cluster included ‘bitcoin’, ‘commodities’, ‘hedge’, and ‘risk management’. One focus of researchers in the cluster is financial product hedging and diversification potential, especially during crises. El Khoury et al. (2023) conducted a comprehensive study to inform portfolio diversification and hedging risk management strategies for financial market players. Their assessment of the behavior of financial markets before and during the Russia–Ukraine war with a specific focus on spillover effects on fintech, ESG, MSCI sustainability index, gold, and renewable energy markets revealed a heterogeneous spillover. In a related study, Arif et al. (2022) reported the benefits investors accrued in holding green bonds as diversifying and hedging assets of currency and commodity assets during the COVID-19 period.
In terms of the combination of level of relevance and development, the bottom-right clusters (‘green bonds’ and ‘green investment’) are still in the formative research stages, signifying future research potential. Given green finance and climate finance trends, notably the issuing of new financial products for green investment arising from green innovation, greater scholarly attention is expected to continue analyzing these topics and their interaction with other sections of the financial system. The ‘economic policy’ theme is still in the formative research based on relevance and density. The future research focus may shift the topic toward the direction of a niche theme or motor theme. Overall, the mature and pertinent themes are fewer, indicating research prospects.

3.3. Social Structure

The social structure encompasses networks of publication collaboration based on three units of analysis: countries of origin, authors, and associated affiliations (Crane 1969; Benomar et al. 2022). Understanding collaboration is crucial as it affects scientific impact and visibility (Limaymanta et al. 2022). We present and discuss the results of collaboration networks based on the three units.

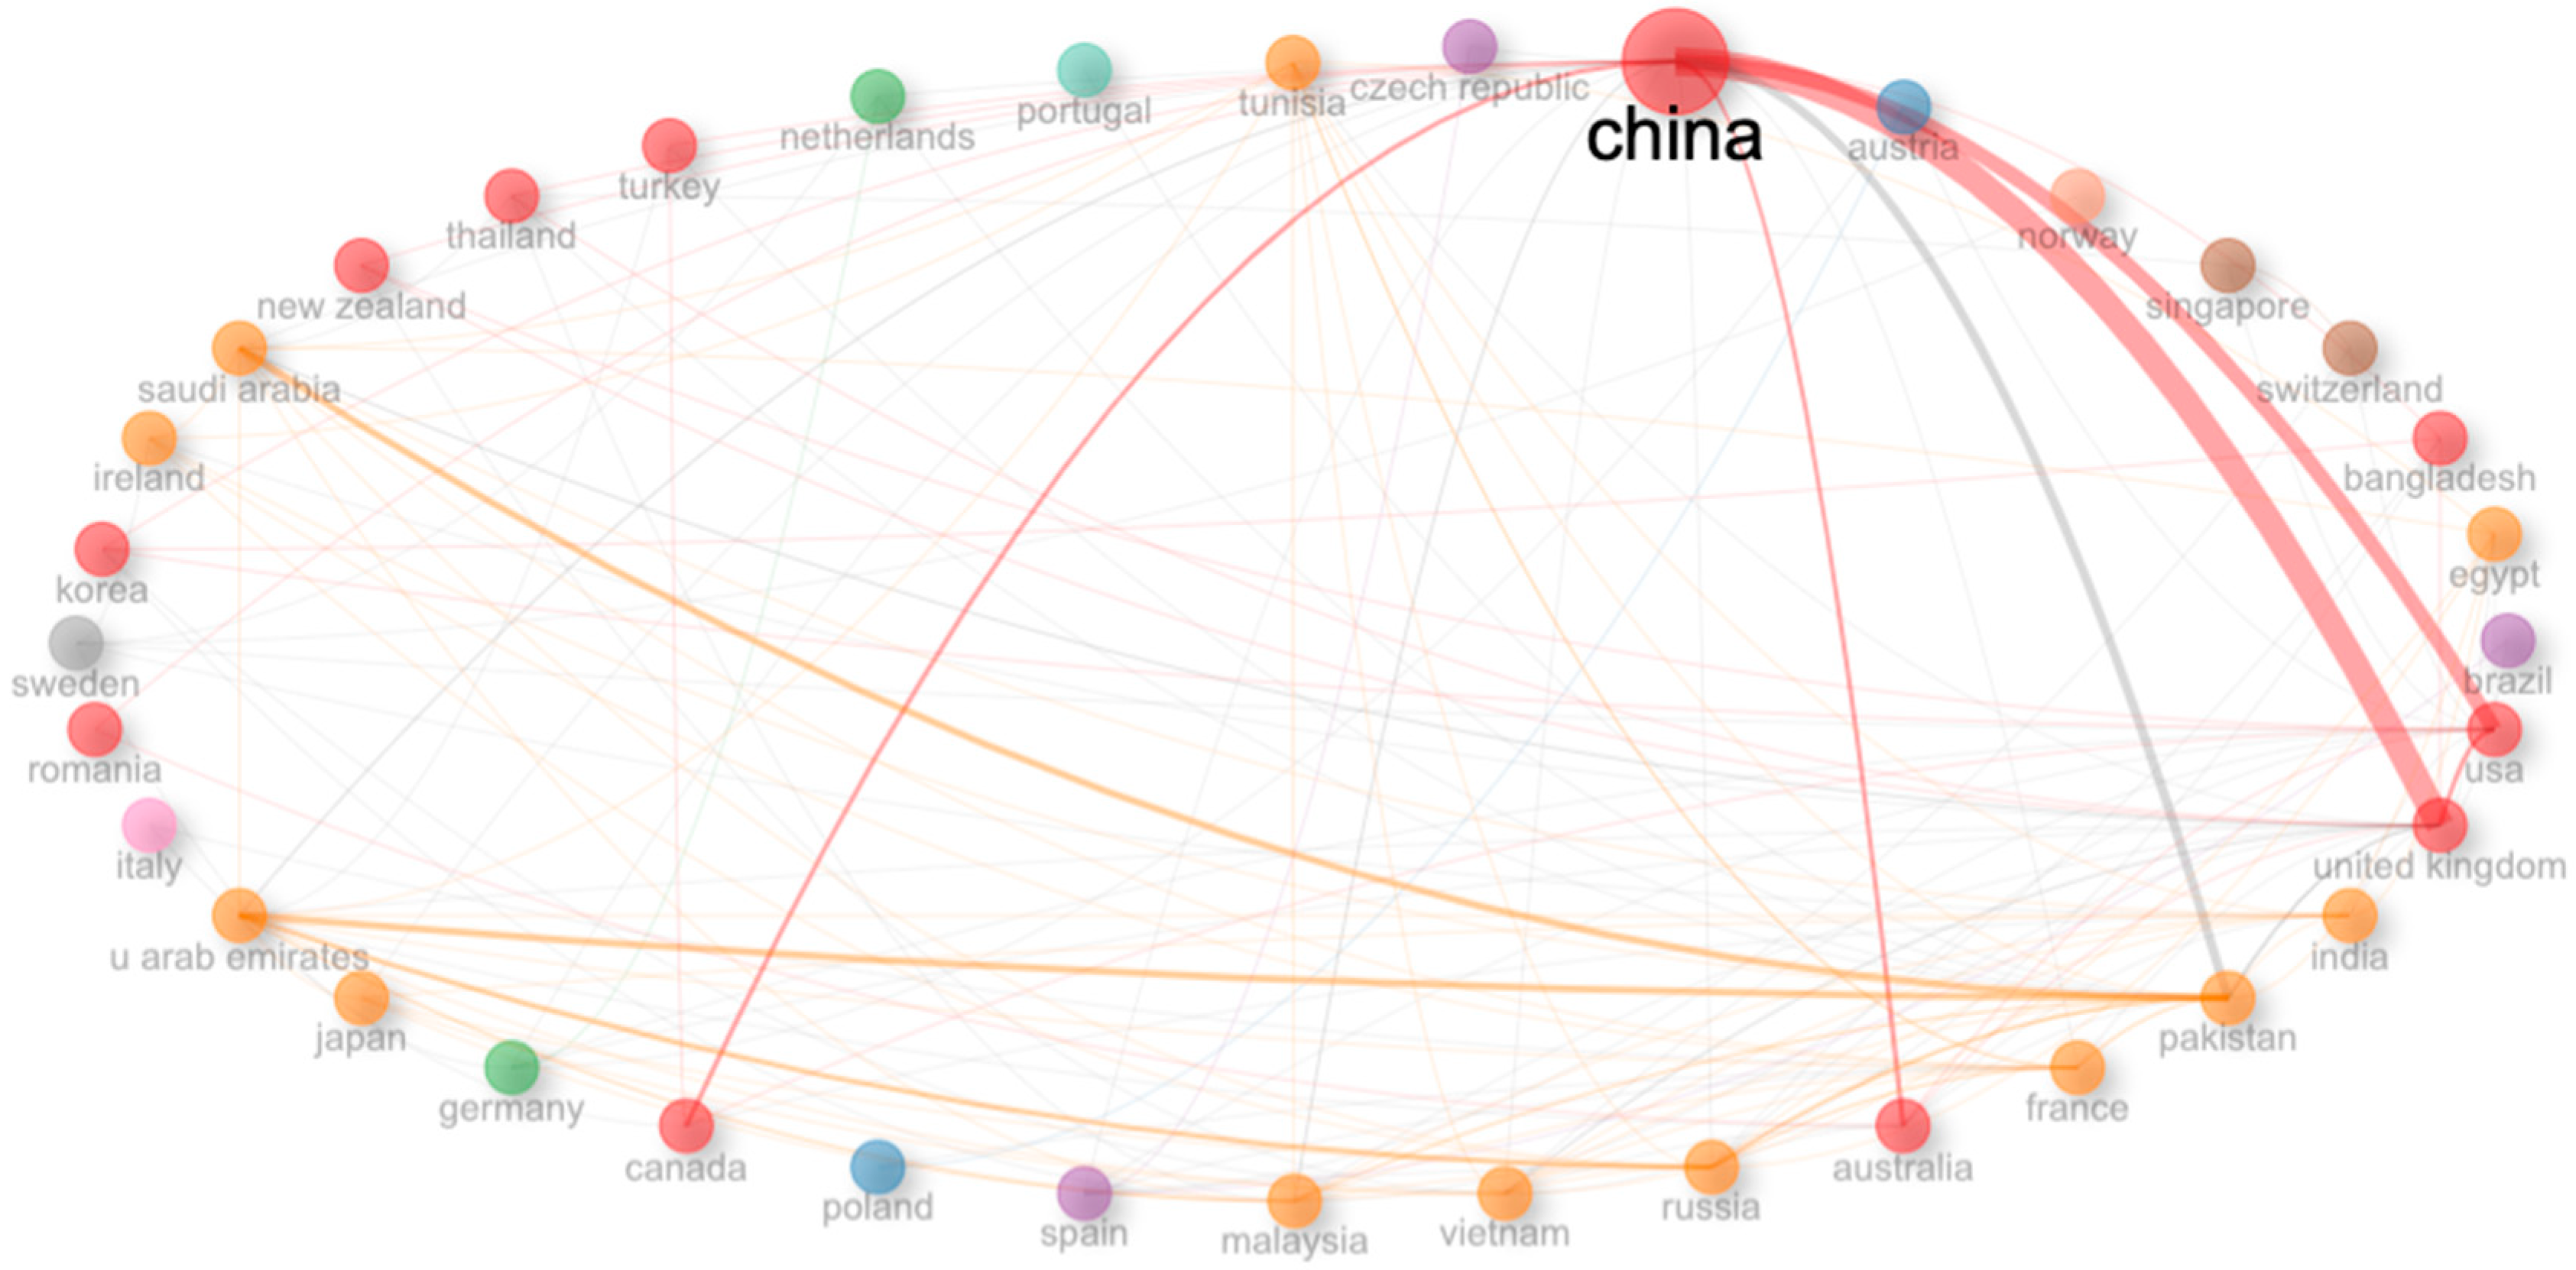
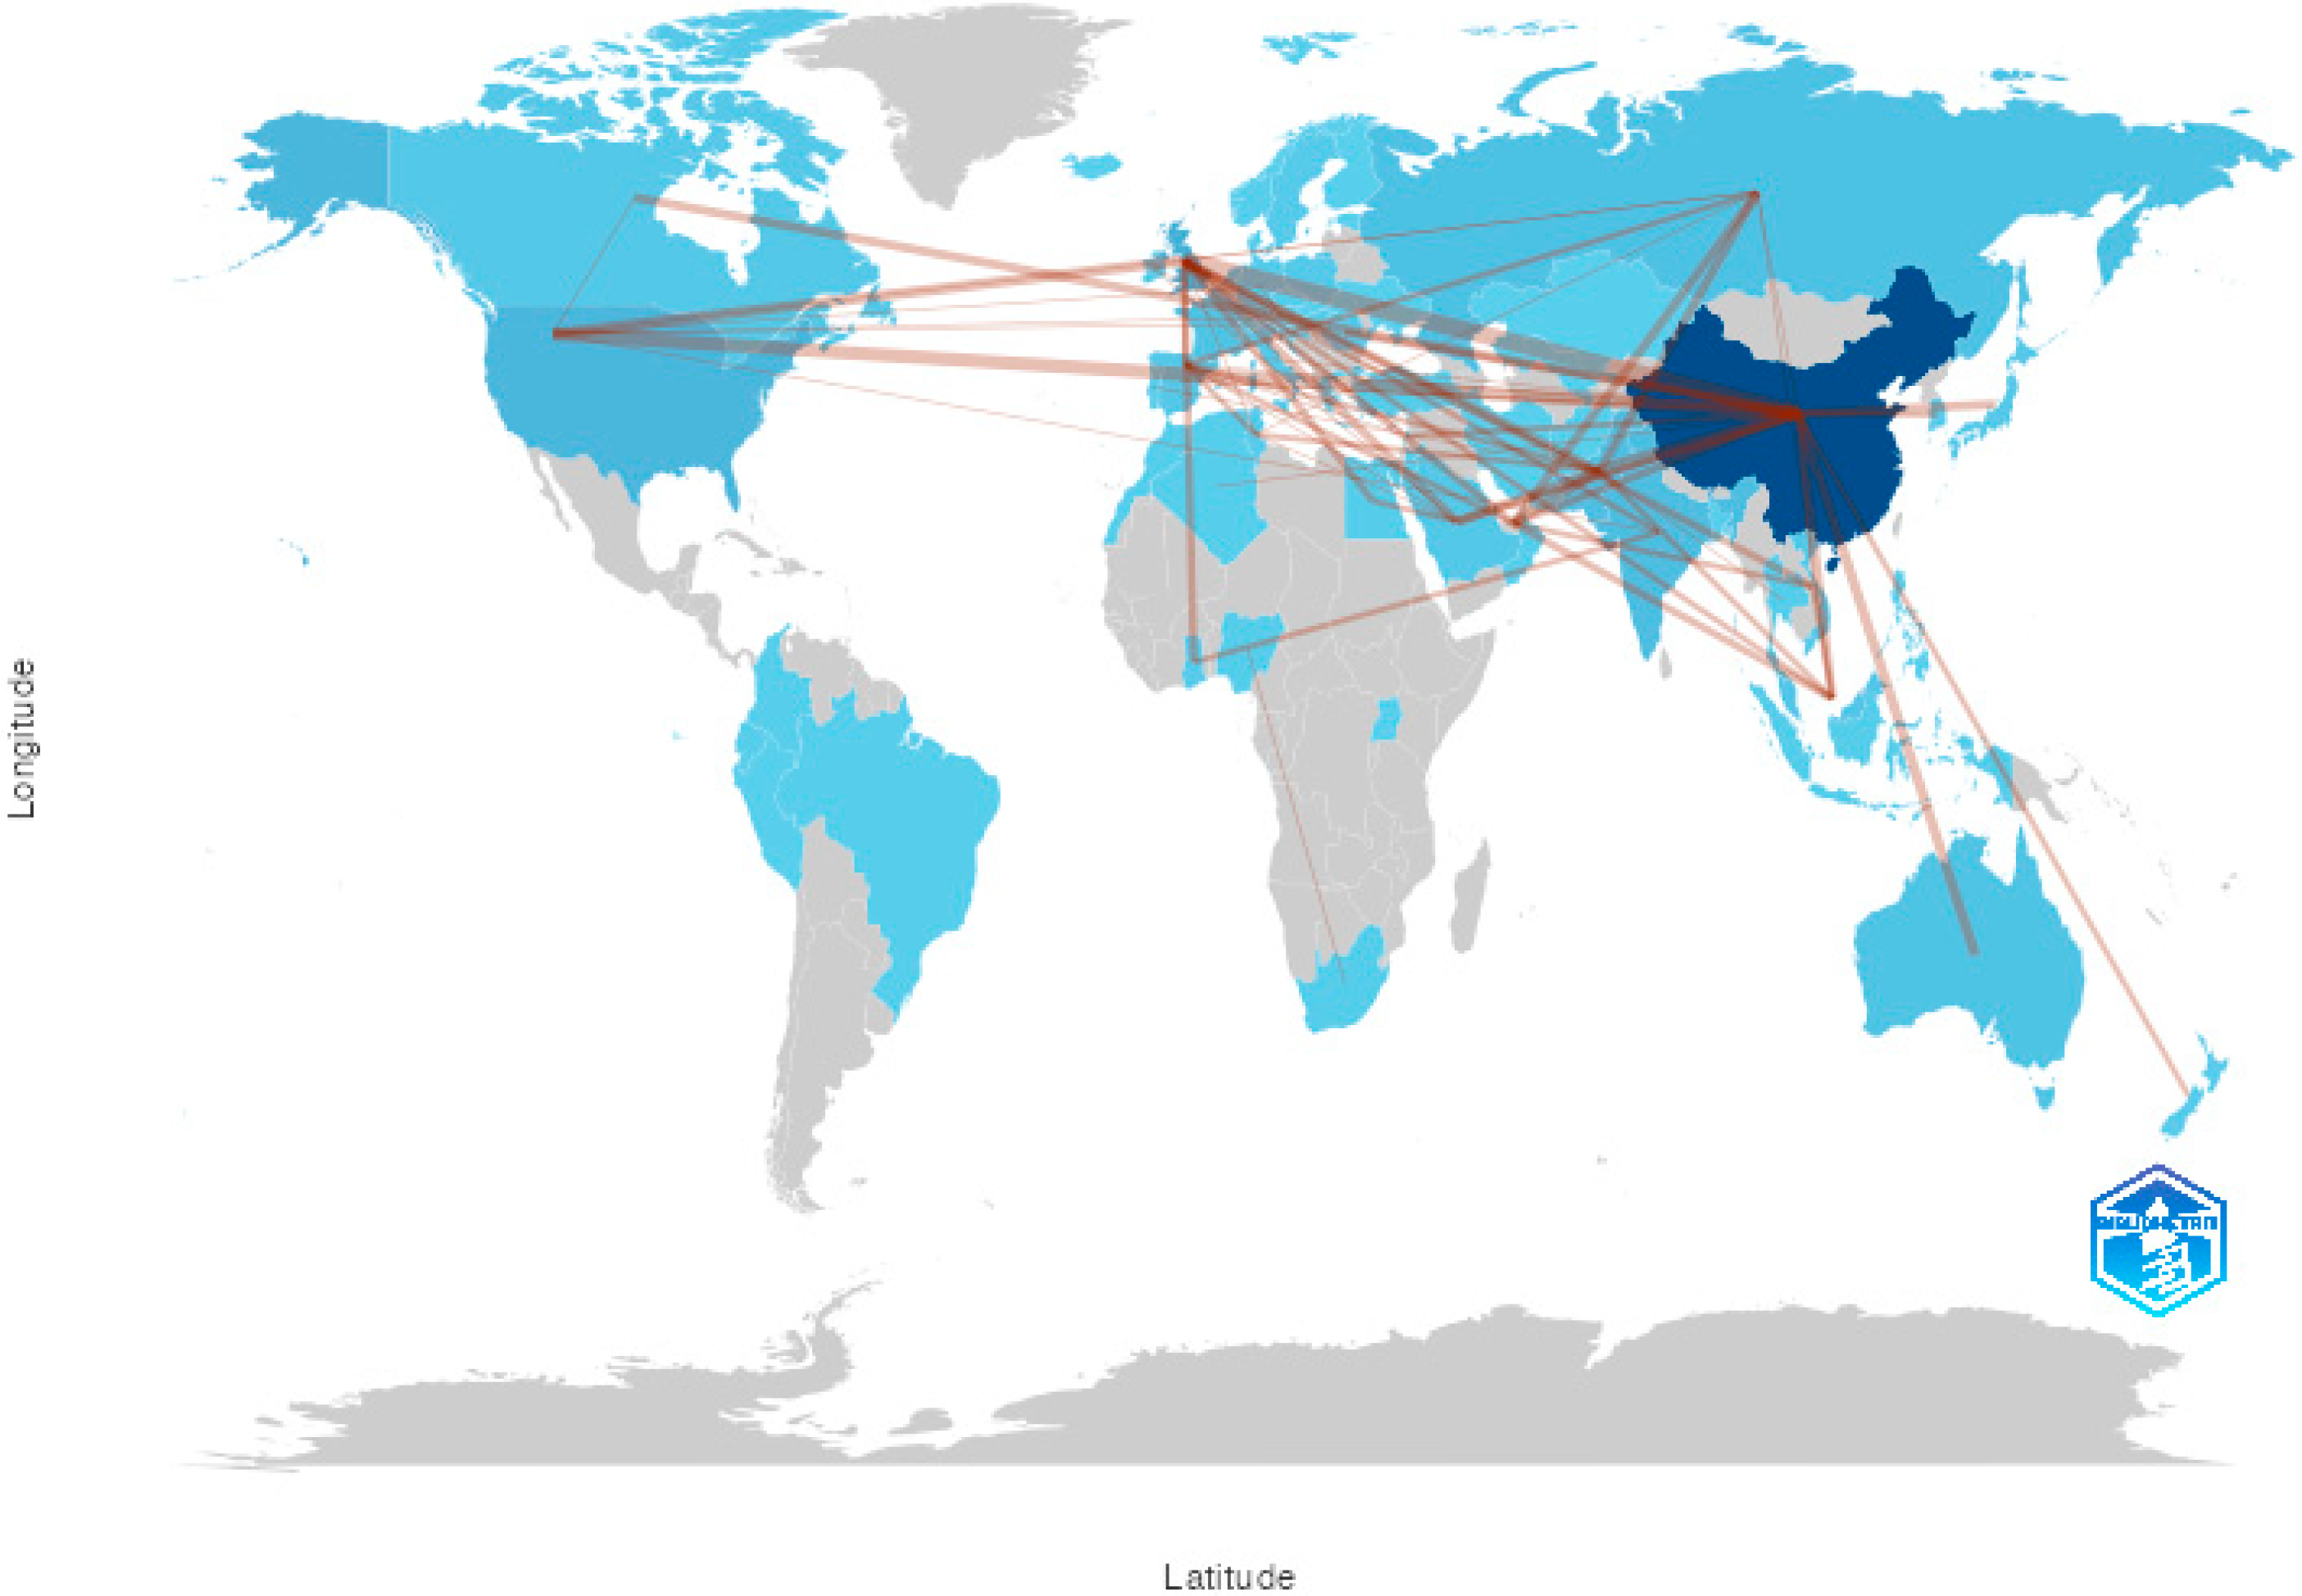
3.3.1. Countries Collaboration

Figure 8 and Figure 9 show that China had an enormous node size and thickest connection, implying the highest frequency of publications with other countries. The notable prominence of China’s publications on climate finance-related topics can be attributed to the significant attention from policymakers and researchers towards the country’s environmental policies. This is owing to China’s status as the largest emitter and its changes in climate change policy (Lai 2021). In particular, the efficacy of the green credit policy implemented to reduce air pollution, given the Chinese government’s declaration of war against pollution, has received attention (Ha 2009). The red cluster countries had the thickest link strengths based on their collaboration with China. As seen in Table 8 and Figure 8 and Figure 9, the main collaborators of China are the United Kingdom (UK) (17 publications), Pakistan (10 publications), the USA (10 publications), Australia (6 journals), and Canada (5 publications). Over the years, China has changed its engagement with foreign nations on climate governance, especially in the West, when transforming its climate identity (Li and Yang 2022). This might have led to more research interest, especially in its relationship with the UK. The collaboration from the United Kingdom to the USA (seven publications) is also significant under the red cluster.
Main collaborations from the orange cluster are from Pakistan to the United Arab Emirates and Saudi Arabia (6 publications each). Several other Asian countries, including Vietnam and Malaysia, had collaborated. The Asian continent, particularly the southern region, exhibits vulnerability to the effects of climate change; hence, a focus on climate finance for adaptation and mitigation is ideal. The representation of European countries on the collaboration network was also noteworthy, with 16 countries representing 47% of total nodes. A study by the European Investment Bank indicated that Europeans are more concerned about climate change than Chinese and Americans (European Investment Bank n.d.). In addition to the United Kingdom, Russia was among the top European countries with many alliances on the topic.
The appearance of Latin America on the network was limited to Brazil, which had an association with Spain and the UK only. Five countries represented Africa on the collaboration network, with Tunisia and Egypt topping the collaboration rank. Tunisia had the highest number of collaborations (9), including France and India. However, the links are faint, similar to those of Egypt. African countries’ scientific publications (Figure 8) and collaborations on climate finance in capital markets topics are minimal despite climate change being a considerable threat to Africa (Climate Change Is an Increasing Threat to Africa|UNFCCC n.d.). The majority of these few studies are from the Middle East and North Africa (MENA) region, with just a handful from Sub-Saharan Africa.

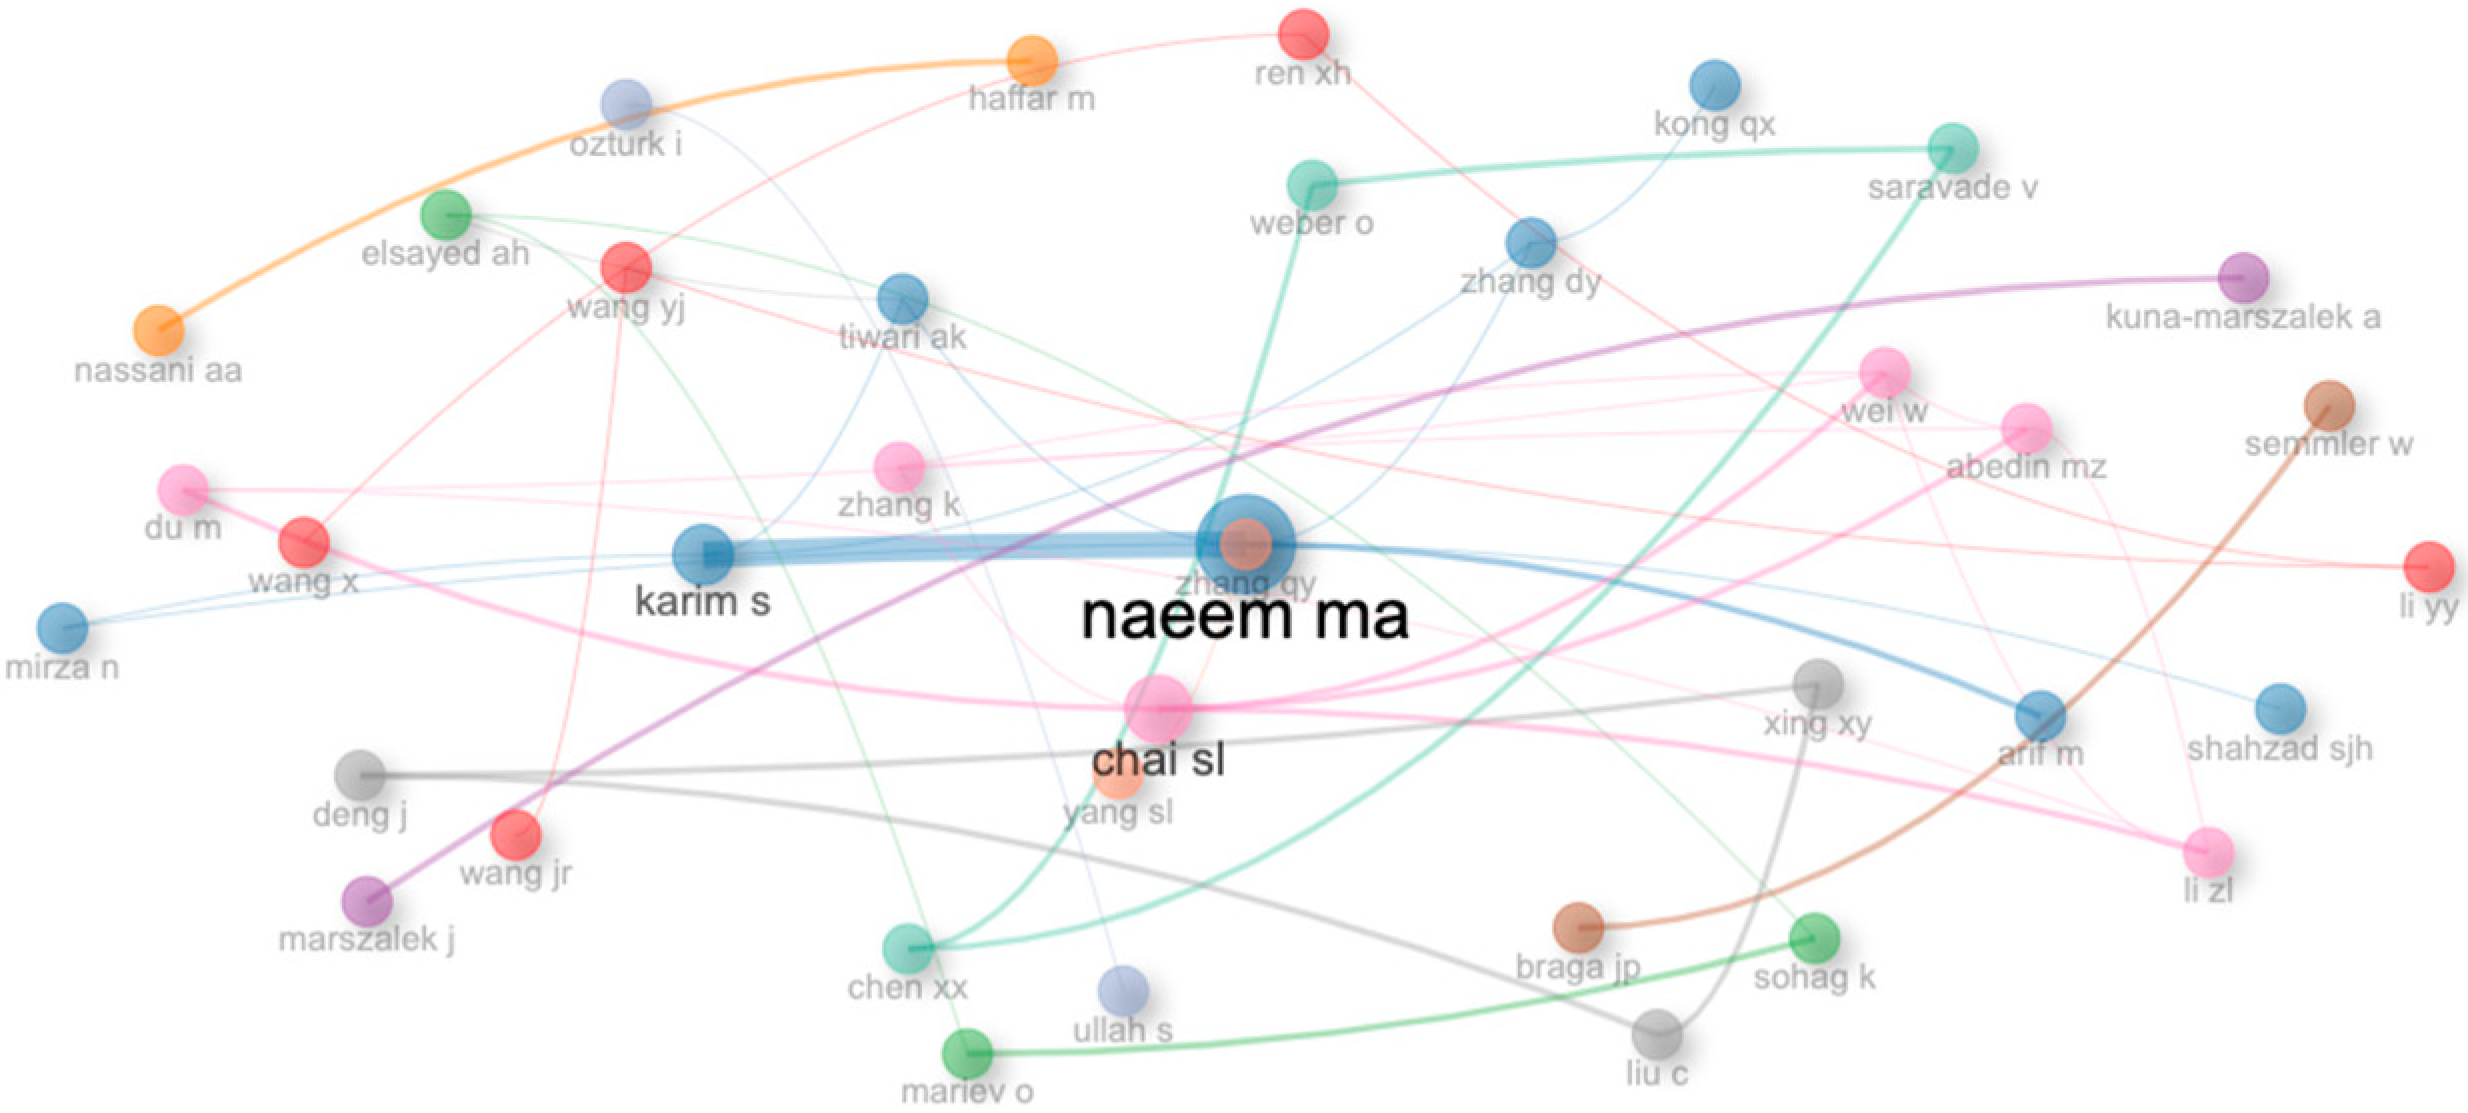
3.3.2. Author Collaboration

Our analysis indicated that the average co-authorship per publication was 3.2, with international co-authorship comprising 39.81%. Out of the 901 total authors, 27 were single authors. Figure 10 illustrates that Muhammad Abubakr Naeem (UAE, Russia, and Ireland) has collaborated the most with other authors, especially Karim Sitara (Malaysia). An evaluation of their research interest revealed their shared interest in uncertainties and interconnectedness of financial markets, which explains their joint publications relating to these areas. Other vital collaborations are with Muhammad Arif (Pakistan), Nawazish Mirza (France), and Syed Jawad Hussain Shahzad (France) on topics relating to volatility spillovers. Shanglei Chai (China) is the second most frequently collaborated, mostly with Zhilong Li (China), Mo Du (China), and Mohammad Zoynul Abedin (UK and Bangladesh). This results from their joint research interest in conducting studies on China’s financial system. Mohammad Zoynul Abedin had no affiliation with Chinese organizations but had other publications relating to Chinese stock markets, provinces, and listed enterprises with other authors. Given the node size, Karim Sitara’s (Malaysia) collaboration frequency was also noteworthy. This was with authors from China, Japan, Tunisia, India, and France. However, all the links were faint, indicating less activity between the authors. The principal authors collaborating on the topic are from Asia and Europe, mainly France. The deduction from these findings for researchers is the potential for collaboration with scholars who share similar research interests regardless of their location and those interested in the same region intrigued by related topics.

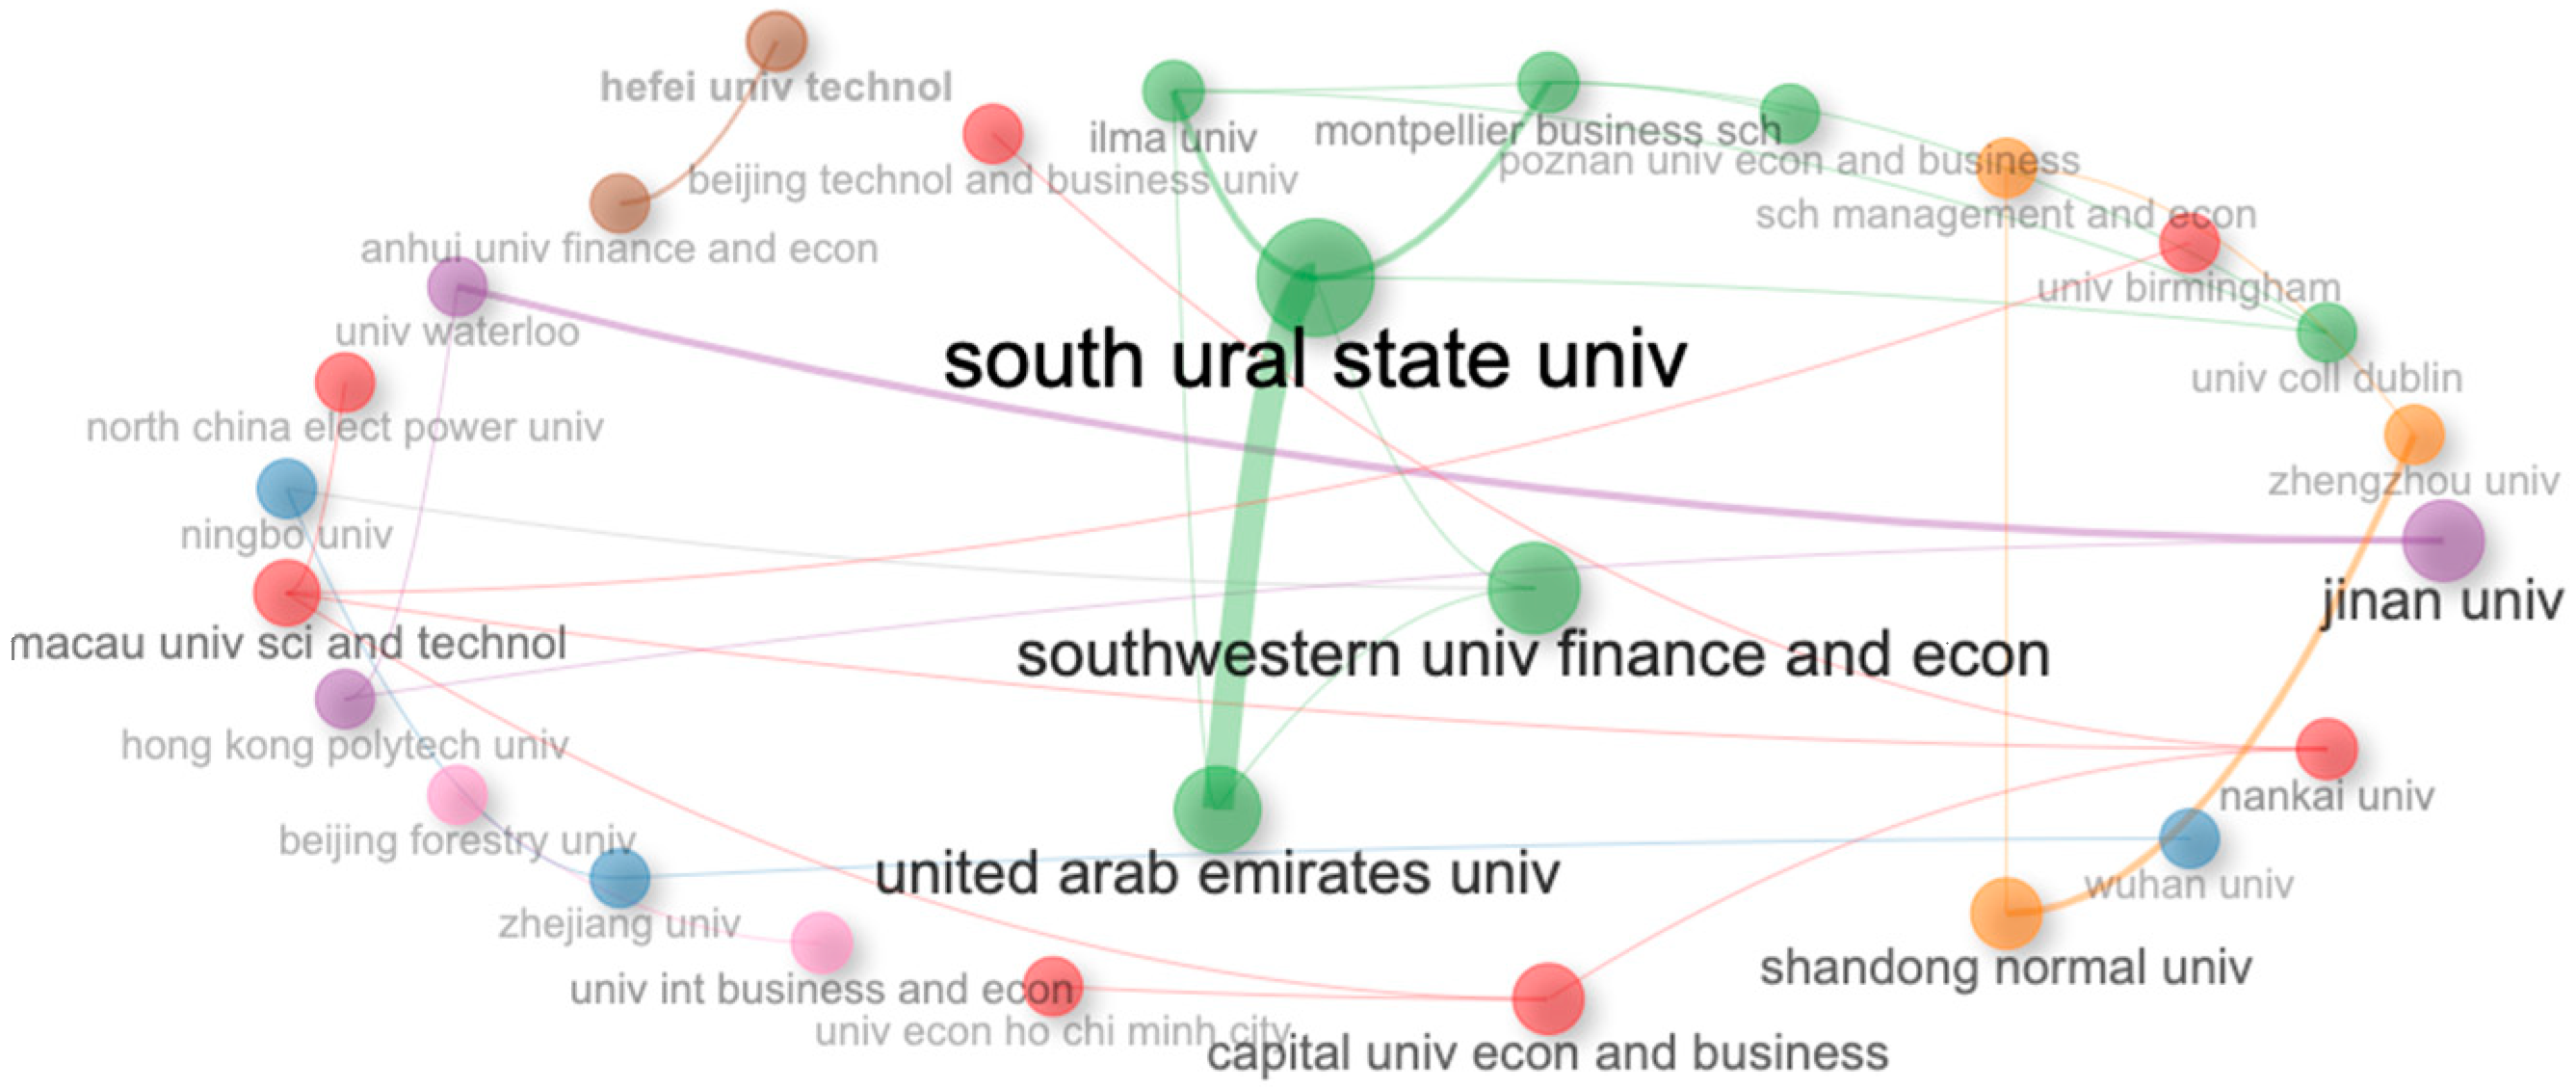
3.3.3. Affiliation Collaboration

Figure 11 shows that South Ural State University (Russia) had the highest rank based on the frequency of organizational collaboration. Considering the solidity of the link, the university’s involvement with the United Arab Emirates University was strong.
These collaborations were, however, majorly because Muhammad Abubakr Naeem, a top contributor, had affiliations with both institutions in 2022. Significant activity was exhibited between Montpellier Business School (France) and Ilma University(Pakistan). This result was mainly from collaborations between Syed Jawad Hussain Shahzad, affiliated with Montpellier Business School and South Ural State University, and Sitara Karima, affiliated with Ilma University. Southwestern University of Finance and Economics (China) and United Arab Emirates University also rate highly. The level of activity between Jinan University (Lebanon) and the University of Waterloo (Canada), as well as Shandong Normal University (China) and Zhengzhou University (China), is also significant. Asian organizations are among the top collaborators, although most connections are faint, indicating less activity. The research finding implies collaboration possibilities exist across institutes with similar research themes related to green finance.

4. Conclusions, Future Research Possibilities, and Limitations

We conducted a bibliometric analysis using the VOS viewer and Biblioshiny app within the Bibliometrix R tool. We answer six research questions by analyzing 314 scientific journal articles from the Web of Science in 2017–2023 following the launch of the Sustainable Stock Exchanges’ green finance voluntary action plan. The analysis involved mapping scientific production trends, relevant journal sources, author productivity, the conceptual structure, keyword linkages and emerging and trending topics, and collaborations within social structures. Additionally, the study assessed the applicability of Bradford’s, Zipf’s, and Lotka’s bibliometric laws on climate finance in capital markets literature.
Based on the findings of our investigation, we highlight six significant conclusions that can aid in decision making for researchers, listed corporations, capital markets, responsible investors, financial institutions, and economic policymakers.
First, while the present focus on capital markets’ green issuances and the subsequent market reaction is mainly on green bonds, there is a slow shift to other green financial instruments, particularly green stocks. The shift could indicate where future investment opportunities lie in climate finance. Future research endeavors could explore the dynamics of the other underexplored green finance vehicles, shedding light on their efficacy as climate finance mobilization tools, their market implications, and their potential interplay with traditional financial instruments. By addressing this research gap, scholars can provide valuable insights that inform policymakers and regulators about the significance of diversifying the landscape of green financial instruments. Assessing the implications of various green finance vehicles would be essential in crafting policies that foster innovation, development, and timely issuance of diverse green financial instruments, aligning with the imperative to mobilize climate finances effectively.
Second, our research reveals that clean energy has emerged as the top trending scholarly investigation in studies on green financial vehicles within capital markets. This trend has gained substantial momentum following the global energy crisis, mainly from the escalation of the Russia–Ukraine war and the COVID-19 recovery (Ozili and Ozen 2023). Given climate scientists’ warning about the importance of urgently reducing carbon emissions, coupled with many economies experiencing energy shortages in 2022, governments are reassessing their energy policies. Consequently, discussions on the transition to clean energy markets have received considerable interest from a policy and scholarly point of view. This trend continues to create a massive opportunity for capital markets to allocate funds to green energy investments by issuing green financial instruments.
Third, the study’s analysis of the thematic map discloses several related topics, categorized into two distinct clusters that are highly relevant and have room for development. Thematic insights highlight knowledge gaps that can be filled from a practical and research perspective. Notable subjects revealing room for research development under the first cluster include: ‘impact investing’, ‘market value’, ‘climate change and risk’, ‘green recovery’, ‘economic growth’, and ‘green and climate finance. ‘ As listed corporations seek to maximize their market value and raise green funds via issuances in capital markets, they need to be cognizant that responsible investors are concerned not only about the company’s ability to generate a financial return but also their social and environmental impact (Alhamar et al. 2024). Nevertheless, firms sometimes have challenges finding an equilibrium between earning short-term shareholder returns and engaging in impact investing, as the latter typically requires a longer time horizon for creating financial gains. Policy and research potential exist for firms to achieve this balance and maximize shareholder wealth while contributing positively to social and environmental issues.
Green recovery and economic growth subjects also exhibit promising potential for development in capital markets. This is especially vital given that economies are still recovering from the COVID-19 pandemic and the 2021–2023 global energy crisis. The commitments towards greening economies via adaptation and mitigation financing were at risk as developed nations focused on their contingency plans (Ongoma et al. 2023). Research-driven, balanced, and workable solutions that enhance green and economic recovery during and after a crisis are vital for listed corporations and government policymakers.
The fourth conclusion of our study indicates that the green investment cluster also falls into the category of highly relevant but underdeveloped areas, signifying opportunities for further investigation and policymaking. The category comprised several topics, including ‘green innovation’, ‘corporate social responsibility’, ‘environmental regulation’, ‘financial constraints’, ‘green credit policy’, ‘financial development’, and ‘heavily polluting enterprises’. The deduction emphasizes the need for publicly traded firms, especially heavily polluting enterprises, to invest in green innovation for competitive advantage and compliance with evolving environmental regulations, positively impacting corporate performance. However, financial constraints pose challenges, necessitating the mobilization of funds, for instance, via the issuance of green financial instruments. The research potential for scholars lies in evaluating the effectiveness of green credit policies in high-emission regions outside of China. Furthermore, further research is imperative given green innovation’s significant financial and operational performance enhancement.
Based on the social structure analysis, the fifth conclusion is that collaborations between geographical hotspots in climate finance within capital markets research and underexplored regions have the potential to inspire cross-regional knowledge transfer and the exchange of best practices. This can result in significant research and policy contributions addressing the global climate change challenge. By exploring the unique challenges, innovations, and opportunities present in underexplored and climate-vulnerable regions of Africa and Latin America via international collaborations, researchers can develop localized solutions that specifically address the distinct dynamics of these regions. Significant climate finance is needed in these regions as they are among the most vulnerable to the effects of climate change (World Meteorological Organization 2022; African Development Bank 2019).
Finally, based on our analysis of Bradford’s, Zipf’s, and Lotka’s fundamental bibliometric laws, we found that the climate finance issuances in capital markets literature aligned with Bradford’s distribution law. Similarly, the literature largely adhered to Zipf’s law. However, based on the number of articles metric, the author’s productivity did not fit Lotka’s distribution law. The findings imply the consistent applicability of Bradford’s Law and Zipf’s Law in characterizing the distribution and frequency of scholarly publications in the climate finance field, providing valuable insights into the patterns and dynamics of scientific knowledge dissemination.
The conclusions made from the research have some limitations. First, we rely on the Web of Science database only for data published in English; therefore, our findings are limited to this extent. Furthermore, we only included the studies before 2017 because we focused on the time after the launch of the Sustainable Stock Exchange’s voluntary action plan. Additionally, as additional publications become accessible, we acknowledge that documentation constantly evolves.

Author Contributions

Conceptualization, P.M. and B.G.; methodology, P.M.; software, P.M.; validation, B.G., M.F.-F. and A.P.-D.; formal analysis, P.M.; investigation, P.M.; resources, P.M., B.G. and A.P.-D.; data curation, P.M.; writing—original draft preparation, P.M.; writing—review and editing, P.M., B.G., M.F.-F. and A.P.-D.; visualization, P.M.; supervision, B.G., M.F.-F. and A.P.-D. All authors have read and agreed to the published version of the manuscript.

Funding

The Hungarian University of Agriculture and Life Science, Doctoral School of Economics, and Regional Sciences funded the APC.

Data Availability Statement

The data presented in this study are available upon request from the corresponding author.

Acknowledgments

We acknowledge the support offered by the Hungarian University of Agriculture and Life Sciences (MATE) and the Stipendium Hungaricum Scholarship. We also thank the reviewers and editor for their constructive feedback.

Conflicts of Interest

The authors declare no conflicts of interest.

Notes

1
Section 3.1.2 Core sources based on Bradford’s law.
2
Section 3.1.4 Author productivity via Lotka’s law lens.
3
Section 3.2.2 Keyword frequency via Zipf’s Law lens.

References

  1. African Development Bank. 2019. Climate Change in Africa. Text. African Development Bank—Building Today, a Better Africa Tomorrow. Abidjan: African Development Bank Group. Available online: https://www.afdb.org/en/cop25/climate-change-africa (accessed on 28 November 2023).
  2. Alhamar, Fatema, Allam Hamdan, and Mohamad Saif. 2024. Environmental, Social, and Governance (ESG) Impact on Firm’s Performance. In Artificial Intelligence and Transforming Digital Marketing. Edited by Allam Hamdan and Esra Saleh Aldhaen. Studies in Systems, Decision and Control. Cham: Springer Nature, pp. 461–75. [Google Scholar] [CrossRef]
  3. Almeida, Luís. 2023. Risk and Bankruptcy Research: Mapping the State of the Art. Journal of Risk and Financial Management 16: 361. [Google Scholar] [CrossRef]
  4. Almeida, Luís, and Elisabete Vieira. 2023. Technical Analysis, Fundamental Analysis, and Ichimoku Dynamics: A Bibliometric Analysis. Risks 11: 142. [Google Scholar] [CrossRef]
  5. Anderloni, Luisa, and Alessandra Tanda. 2017. Green Energy Companies: Stock Performance and IPO Returns. Research in International Business and Finance 39: 546–52. [Google Scholar] [CrossRef]
  6. Aparicio, Gloria, Txomin Iturralde, and Amaia Maseda. 2019. Conceptual Structure and Perspectives on Entrepreneurship Education Research: A Bibliometric Review. European Research on Management and Business Economics 25: 105–13. [Google Scholar] [CrossRef]
  7. Aria, Massimo, and Corrado Cuccurullo. 2017. Bibliometrix: An R-Tool for Comprehensive Science Mapping Analysis. Journal of Informetrics 11: 959–75. [Google Scholar] [CrossRef]
  8. Arif, Muhammad, Muhammad Abubakr Naeem, Saqib Farid, Rabindra Nepal, and Tooraj Jamasb. 2022. Diversifier or More? Hedge and Safe Haven Properties of Green Bonds during COVID-19. Energy Policy 168: 113102. [Google Scholar] [CrossRef] [PubMed]
  9. Banga, Josué. 2019. The Green Bond Market: A Potential Source of Climate Finance for Developing Countries. Journal of Sustainable Finance & Investment 9: 17–32. [Google Scholar] [CrossRef]
  10. Baulkaran, Vishaal. 2019. Stock Market Reaction to Green Bond Issuance. Journal of Asset Management 20: 331–40. [Google Scholar] [CrossRef]
  11. Benomar, Lahcen, Raed Elferjani, Jill Hamilton, Greg A. O’Neill, Said Echchakoui, Yves Bergeron, and Mebarek Lamara. 2022. Bibliometric Analysis of the Structure and Evolution of Research on Assisted Migration. Current Forestry Reports 8: 199–213. [Google Scholar] [CrossRef]
  12. Birkle, Caroline, David A. Pendlebury, Joshua Schnell, and Jonathan Adams. 2020. Web of Science as a Data Source for Research on Scientific and Scholarly Activity. Quantitative Science Studies 1: 363–76. [Google Scholar] [CrossRef]
  13. Bookstein, Abraham. 1976. The Bibliometric Distributions. The Library Quarterly: Information, Community, Policy 46: 416–23. [Google Scholar]
  14. Branca, Giacomo, Ademola Braimoh, Yuxuan Zhao, Motselisi Ratii, and Puseletso Likoetla. 2021. Are There Opportunities for Climate-Smart Agriculture? Assessing Costs and Benefits of Sustainability Investments and Planning Policies in Southern Africa. Journal of Cleaner Production 278: 123847. [Google Scholar] [CrossRef]
  15. Broadus, Robert N. 1987. Toward a Definition of ‘Bibliometrics’. Scientometrics 12: 373–79. [Google Scholar] [CrossRef]
  16. Callon, Michel, Jean Pierre Courtial, and Francoise Laville. 2005. Co-Word Analysis as a Tool for Describing the Network of Interactions between Basic and Technological Research: The Case of Polymer Chemsitry. Scientometrics 22: 155–205. [Google Scholar] [CrossRef]
  17. Callon, Michel, Jean-Pierre Courtial, William A. Turner, and Serge Bauin. 1983. From Translations to Problematic Networks: An Introduction to Co-Word Analysis. Social Science Information 22: 191–235. [Google Scholar] [CrossRef]
  18. Calvet, Laurent, Gianfranco Gianfrate, and Raman Uppal. 2022. The Finance of Climate Change. Journal of Corporate Finance 73: 102162. [Google Scholar] [CrossRef]
  19. Candra, Oriza, Abdeljelil Chammam, José Ricardo Nuñez Alvarez, Iskandar Muda, and Hikmet Ş. Aybar. 2023. The Impact of Renewable Energy Sources on the Sustainable Development of the Economy and Greenhouse Gas Emissions. Sustainability 15: 2104. [Google Scholar] [CrossRef]
  20. Chen, Xingxing, Olaf Weber, and Vasundhara Saravade. 2022. Does It Pay to Issue Green? An Institutional Comparison of Mainland China and Hong Kong’s Stock Markets Toward Green Bonds. Frontiers in Psychology 13: 833847. [Google Scholar] [CrossRef]
  21. Chen, Yi, Zhongwen Xu, Xuehao Wang, and Yining Yang. 2023. How Does Green Credit Policy Improve Corporate Social Responsibility in China? An Analysis Based on Carbon-Intensive Listed Firms. Corporate Social Responsibility and Environmental Management 30: 889–904. [Google Scholar] [CrossRef]
  22. Chi, Yi, Ning Hu, Dong Lu, and Yang Yang. 2023. Green Investment Funds and Corporate Green Innovation: From the Logic of Social Value. Energy Economics 119: 106532. [Google Scholar] [CrossRef]
  23. Climate Change Is an Increasing Threat to Africa|UNFCCC. n.d. Available online: https://unfccc.int/news/climate-change-is-an-increasing-threat-to-africa (accessed on 1 August 2022).
  24. Cobo, Manuel J., A. G. López-Herrera, Enrique Herrera-Viedma, and Francisco Herrera. 2011. An Approach for Detecting, Quantifying, and Visualizing the Evolution of a Research Field: A Practical Application to the Fuzzy Sets Theory Field. Journal of Informetrics 5: 146–66. [Google Scholar] [CrossRef]
  25. Crane, Diana. 1969. Social Structure in a Group of Scientists: A Test of the ‘Invisible College’ Hypothesis. American Sociological Review 34: 335–52. [Google Scholar] [CrossRef]
  26. Desai, Nidhi, Laura Veras, and Ankush Gosain. 2018. Using Bradford’s Law of Scattering to Identify the Core Journals of Pediatric Surgery. Journal of Surgical Research 229: 90–95. [Google Scholar] [CrossRef]
  27. Dong, Zhao, Haodong Xu, Zhifeng Zhang, Yipin Lyu, Yuqi Lu, and Hongyan Duan. 2022. Whether Green Finance Improves Green Innovation of Listed Companies—Evidence from China. International Journal of Environmental Research and Public Health 19: 882. [Google Scholar] [CrossRef]
  28. Donthu, Naveen, Satish Kumar, Debmalya Mukherjee, Nitesh Pandey, and Weng Marc Lim. 2021. How to Conduct a Bibliometric Analysis: An Overview and Guidelines. Journal of Business Research 133: 285–96. [Google Scholar] [CrossRef]
  29. Du Pisani, Jacobus A. 2006. Sustainable Development—Historical Roots of the Concept. Environmental Sciences 3: 83–96. [Google Scholar] [CrossRef]
  30. Egghe, Leo. 1990. Applications of the Theory of Bradford’s Law to the Calculation of Leimkuhler’s Law and to the Completion of Bibliographies. Journal of the American Society for Information Science 41: 469–92. [Google Scholar] [CrossRef]
  31. El Khoury, Rim, Nohade Nasrallah, Khaled Hussainey, and Rima Assaf. 2023. Spillover Analysis across FinTech, ESG, and Renewable Energy Indices before and during the Russia–Ukraine War: International Evidence. Journal of International Financial Management & Accounting 34: 279–317. [Google Scholar] [CrossRef]
  32. Elsayed, Ahmed H., ader Naifar, Samia Nasreen, and Aviral Kumar Tiwari. 2022. Dependence Structure and Dynamic Connectedness between Green Bonds and Financial Markets: Fresh Insights from Time-Frequency Analysis before and during COVID-19 Pandemic. Energy Economics 107: 105842. [Google Scholar] [CrossRef]
  33. European Investment Bank. n.d. Europeans Are More Concerned about Climate Change Than People in the USA and China. Luxembourg: European Investment Bank. Available online: https://www.eib.org/en/infographics/eu-climate-change-peer-us-china (accessed on 11 October 2023).
  34. Flammer, Caroline. 2018. Corporate Green Bonds. The Journal of Financial Economics 41. [Google Scholar] [CrossRef]
  35. Gunningham, Neil. 2020. A Quiet Revolution: Central Banks, Financial Regulators, and Climate Finance. Sustainability 12: 9596. [Google Scholar] [CrossRef]
  36. Ha, Phan Thanh. 2009. China Green Credit Policy. Business Issues Bulletin, Vietnam 54370. Available online: https://documents1.worldbank.org/curated/zh/960771468261298975/pdf/543700BRI0ENGL1BOX0349405B01PUBLIC1.pdf (accessed on 27 October 2023).
  37. Hadas-Dyduch, Monika, Blandyna Puszer, Maria Czech, and Janusz Cichy. 2022. Green Bonds as an Instrument for Financing Ecological Investments in the V4 Countries. Sustainability 14: 2188. [Google Scholar] [CrossRef]
  38. Hearst, Marti A., Emily Pedersen, Lekha Patil, Elsie Lee, Paul Laskowski, and Steven Franconeri. 2020. An Evaluation of Semantically Grouped Word Cloud Designs. IEEE Transactions on Visualization and Computer Graphics 26: 2748–61. [Google Scholar] [CrossRef] [PubMed]
  39. Hu, Jun, Juncheng Li, Xiangyu Li, Yueyue Liu, Wenwei Wang, and Liansheng Zheng. 2021. Will Green Finance Contribute to a Green Recovery? Evidence from Green Financial Pilot Zone in China. Frontiers in Public Health 9: 794195. [Google Scholar] [CrossRef] [PubMed]
  40. Huang, Lingyun, and Zhuojun Lei. 2021. How Environmental Regulation Affect Corporate Green Investment: Evidence from China. Journal of Cleaner Production 279: 123560. [Google Scholar] [CrossRef]
  41. Huang, Xiaobing, Yousaf Ali Khan, Noman Arshed, Sultan Salem, Muhammad Ghulam Shabeer, and Uzma Hanif. 2023. Increasing Social Resilience against Climate Change Risks: A Case of Extreme Climate Affected Countries. International Journal of Climate Change Strategies and Management 15: 412–31. [Google Scholar] [CrossRef]
  42. Huber, John C. 1998. The Underlying Process Generating Lotka’s Law and the Statistics of Exceedances. Information Processing & Management 34: 471–87. [Google Scholar] [CrossRef]
  43. Indriastuti, Maya, and Anis Chariri. 2021. The Role of Green Investment and Corporate Social Responsibility Investment on Sustainable Performance. Cogent Business & Management 8: 1960120. [Google Scholar] [CrossRef]
  44. Janik, Agnieszka, Adam Ryszko, and Marek Szafraniec. 2021. Exploring the Social Innovation Research Field Based on a Comprehensive Bibliometric Analysis. Journal of Open Innovation: Technology, Market, and Complexity 7: 226. [Google Scholar] [CrossRef]
  45. Jiang, Dongming, and Fang Jia. 2022. Extreme Spillover between Green Bonds and Clean Energy Markets. Sustainability 14: 6338. [Google Scholar] [CrossRef]
  46. Jiang, Shuangshuang, Xiaojiao Liu, Zhonglu Liu, Hao Shi, and Hongdi Xu. 2022a. Does Green Finance Promote Enterprises’ Green Technology Innovation in China? Frontiers in Environmental Science 10: 981013. [Google Scholar] [CrossRef]
  47. Jiang, Yonghong, Jieru Wang, Zhiming Ao, and Yujou Wang. 2022b. The Relationship between Green Bonds and Conventional Financial Markets: Evidence from Quantile-on-Quantile and Quantile Coherence Approaches. Economic Modelling 116: 106038. [Google Scholar] [CrossRef]
  48. Khare, Apoorv, and Rajesh Jain. 2022. Mapping the Conceptual and Intellectual Structure of the Consumer Vulnerability Field: A Bibliometric Analysis. Journal of Business Research 150: 567–84. [Google Scholar] [CrossRef]
  49. Kiseleva, Elena. G., and Aleksei M. Efimov. 2019. Green Bonds as A Tool for Sustainable Development on Emerging Markets. St. Petersburg: Peter the Great St. Petersburg Polytechnic University, pp. 5619–27. [Google Scholar]
  50. Laborda, Juan, and Alvaro Sanchez-Guerra. 2021. Green Bond Finance in Europe and the Stock Market Reaction. Estudios De Economia Aplicada 39. [Google Scholar] [CrossRef]
  51. Lai, Hongyi. 2021. The Evolution of China’s Climate Change Policy: International and Domestic Political Economy and a Strategy for Working with China. Journal of the British Academy 9: 69–98. [Google Scholar] [CrossRef]
  52. Lakner, Zoltán, Brigitta Plasek, Gyula Kasza, Anna Kiss, Sándor Soós, and Ágoston Temesi. 2021. Towards Understanding the Food Consumer Behavior–Food Safety–Sustainability Triangle: A Bibliometric Approach. Sustainability 13: 12218. [Google Scholar] [CrossRef]
  53. Li, Xiuping, and Ye Yang. 2022. Does Green Finance Contribute to Corporate Technological Innovation? The Moderating Role of Corporate Social Responsibility. Sustainability 14: 5648. [Google Scholar] [CrossRef]
  54. Limaymanta, Cesar H., Rosalía Quiroz-de-García, Jesús A. Rivas-Villena, Andrea Rojas-Arroyo, and Orlando Gregorio-Chaviano. 2022. Relationship between Collaboration and Normalized Scientific Impact in South American Public Universities. Scientometrics 127: 6391–411. [Google Scholar] [CrossRef]
  55. Lorente, Daniel Balsalobre, Kamel Si Mohammed, Javier Cifuentes-Faura, and Umer Shahzad. 2023. Dynamic Connectedness among Climate Change Index, Green Financial Assets and Renewable Energy Markets: Novel Evidence from Sustainable Development Perspective. Renewable Energy 204: 94–105. [Google Scholar] [CrossRef]
  56. Lu, Yuchen, Yuqiang Gao, Yu Zhang, and Junrong Wang. 2022. Can the Green Finance Policy Force the Green Transformation of High-Polluting Enterprises? A Quasi-Natural Experiment Based on ‘Green Credit Guidelines’. Energy Economics 114: 106265. [Google Scholar] [CrossRef]
  57. Luto, Waltman. 2016. A Review of the Literature on Citation Impact Indicators. Journal of Informetrics 10: 365–91. [Google Scholar] [CrossRef]
  58. Ma, Mengjuan, Xiao Zhu, Meishan Liu, and Xiaodong Huang. 2023. Combining the Role of Green Finance and Environmental Sustainability on Green Economic Growth: Evidence from G-20 Economies. Renewable Energy 207: 128–36. [Google Scholar] [CrossRef]
  59. Mankata, Lawrence Martin, De-Graft Owusu-Manu, M. Reza Hosseini, and David John Edwards. 2022. Analysis of Success-Dependent Factors for Green Bond Financing of Infrastructure Projects in Ghana. Journal of Sustainable Finance & Investment 12: 832–48. [Google Scholar] [CrossRef]
  60. Mensi, Walid, Muhammad Shafiullah, Xuan Vinh Vo, and Sang Hoon Kang. 2022. Spillovers and Connectedness between Green Bond and Stock Markets in Bearish and Bullish Market Scenarios. Finance Research Letters 49: 103120. [Google Scholar] [CrossRef]
  61. Mocanu, Mihaela, Laura-Gabriela Constantin, and Bogdan Cernat-Gruici. 2021. Sustainability bonds. An international event study. Journal of Business Economics and Management 22: 1551–76. [Google Scholar] [CrossRef]
  62. Muchiri, Martin Kamau, Szilvia Erdei-Gally, Mária Fekete-Farkas, and Zoltán Lakner. 2022. Bibliometric Analysis of Green Finance and Climate Change in Post-Paris Agreement Era. Journal of Risk and Financial Management 15: 561. [Google Scholar] [CrossRef]
  63. Naeem, Muhammad Abubakr, Imen Mbarki, Majed Alharthi, Abdelwahed Omri, and Syed Jawad Hussain Shahzad. 2021. Did COVID-19 Impact the Connectedness Between Green Bonds and Other Financial Markets? Evidence from Time-Frequency Domain with Portfolio Implications. Frontiers in Environmental Science 9: 657533. [Google Scholar] [CrossRef]
  64. OECD. 2022. Aggregate Trends of Climate Finance Provided and Mobilised by Developed Countries in 2013–2020. Climate Finance and the USD 100 Billion Goal. Paris: OECD. [Google Scholar] [CrossRef]
  65. Ongoma, Victor, Terence Epule Epule, Youssef Brouziyne, Meryem Tanarhte, and Abdelghani Chehbouni. 2023. COVID-19 Response in Africa: Impacts and Lessons for Environmental Management and Climate Change Adaptation. Environment, Development and Sustainability 26: 5537–59. [Google Scholar] [CrossRef]
  66. Ozili, Peterson K., and Ercan Ozen. 2023. Global Energy Crisis. In The Impact of Climate Change and Sustainability Standards on the Insurance Market. Beverly: Scrivener Publishing LLC, pp. 439–54. [Google Scholar] [CrossRef]
  67. Pauw, W. Pieter. 2021. The Adaptation Finance Gap Can Only Be Closed by Limiting the Adaptation Costs. One Earth 4: 1352–55. [Google Scholar] [CrossRef]
  68. Powell, Kimberly R., and Shenita R. Peterson. 2017. Coverage and Quality: A Comparison of Web of Science and Scopus Databases for Reporting Faculty Nursing Publication Metrics. Nursing Outlook 65: 572–78. [Google Scholar] [CrossRef]
  69. Prakash, Nisha, and Madhvi Sethi. 2022. A Review of Innovative Bond Instruments for Sustainable Development in Asia. International Journal of Innovation Science 14: 630–47. [Google Scholar] [CrossRef]
  70. Purkayastha, Dhruba, and Runa Sarkar. 2021. Getting Financial Markets to Work for Climate Finance. Journal of Structured Finance 27: 27–41. [Google Scholar] [CrossRef]
  71. Quoniam, Luc, Frédéric Balme, Hervé Rostaing, Eric Giraud, and Jean Marie Dou. 1998. Bibliometric Law Used for Information Retrieval. Scientometrics 41: 83–91. [Google Scholar] [CrossRef]
  72. Rani, Monika, Serena Ducoli, Stefania Federici, and Laura Eleonora Depero. 2023. Influx of Near-Infrared Technology in Microplastic Community: A Bibliometric Analysis. Microplastics 2: 107–21. [Google Scholar] [CrossRef]
  73. Rao, Amar, Mansi Gupta, Gagan Deep Sharma, Mandeep Mahendru, and Anirudh Agrawal. 2022a. Revisiting the Financial Market Interdependence during COVID-19 Times: A Study of Green Bonds, Cryptocurrency, Commodities and Other Financial Markets. International Journal of Managerial Finance 18: 725–55. [Google Scholar] [CrossRef]
  74. Rao, Huacheng, Dongxu Chen, Feichao Shen, and Yangyang Shen. 2022b. Can Green Bonds Stimulate Green Innovation in Enterprises? Evidence from China. Sustainability 14: 5631. [Google Scholar] [CrossRef]
  75. Ren, Xiaohang, Yiying Li, Cheng Yan, Fenghua Wen, and Zudi Lu. 2022. The Interrelationship between the Carbon Market and the Green Bonds Market: Evidence from Wavelet Quantile-on-Quantile Method. Technological Forecasting and Social Change 179: 121611. [Google Scholar] [CrossRef]
  76. Rocha, Jorge, Sandra Oliveira, Cláudia M. Viana, and Ana Isabel Ribeiro. 2022. Chapter 8—Climate Change and Its Impacts on Health, Environment and Economy. In One Health. Edited by Joana C. Prata, Ana Isabel Ribeiro and Teresa Rocha-Santos. Cambridge: Academic Press, pp. 253–79. [Google Scholar] [CrossRef]
  77. Sahu, Archana, and Puspanjali Jena. 2021. Lotka’s Law and Author Productivity Pattern of Research in Law Discipline. Collection and Curation 41: 62–73. [Google Scholar] [CrossRef]
  78. Santos, Filipe Duarte, Paulo Lopes Ferreira, and Jiesper Strandsbjerg Tristan Pedersen. 2022. The Climate Change Challenge: A Review of the Barriers and Solutions to Deliver a Paris Solution. Climate 10: 75. [Google Scholar] [CrossRef]
  79. Scimago Journal & Country Rank. n.d. Available online: https://www.scimagojr.com/index.php (accessed on 21 September 2023).
  80. Scoville-Simonds, Morgan. 2016. The Governance of Climate Change Adaptation Finance—An Overview and Critique. International Development Policy|Revue Internationale de Politique de Développement 7. [Google Scholar] [CrossRef]
  81. Shirai, Sayuri. 2023. Green Central Banking and Regulation to Foster Sustainable Finance. Tokyo: Asian Development Bank Institute. [Google Scholar] [CrossRef]
  82. Sivertsen, Gunnar, Ronald Rousseau, and Lin Zhang. 2019. Measuring Scientific Contributions with Modified Fractional Counting. Journal of Informetrics 13: 679–94. [Google Scholar] [CrossRef]
  83. Stern, Nicholas. 2022. A Time for Action on Climate Change and a Time for Change in Economics. The Economic Journal 132: 1259–89. [Google Scholar] [CrossRef]
  84. Su, Tong, Zuopeng Justin Zhang, and Boqiang Lin. 2022. Green Bonds and Conventional Financial Markets in China: A Tale of Three Transmission Modes. Energy Economics 113: 106200. [Google Scholar] [CrossRef]
  85. Summers, Edward G. 1983. Bradford’s Law and the Retrieval of Reading Research Journal Literature. Reading Research Quarterly 19: 102–9. [Google Scholar] [CrossRef]
  86. Sustainable Stock Exchange Initiative. 2017. How Stock Exchanges Can Grow Green Finance a Voluntary Action Plan. New York: Sustainable Stock Exchange Initiative. Available online: https://sseinitiative.org/wp-content/uploads/2019/12/SSE-Green-Finance-Guidance-.pdf (accessed on 19 October 2023).
  87. Tripathy, Aneil. 2017. Translating to Risk: The Legibility of Climate Change and Nature in the Green Bond Market. Economic Anthropology 4: 239–50. [Google Scholar] [CrossRef]
  88. Umar, Muhammad, Yasir Riaz, and Imran Yousaf. 2022. Impact of Russian-Ukraine War on Clean Energy, Conventional Energy, and Metal Markets: Evidence from Event Study Approach. Resources Policy 79: 102966. [Google Scholar] [CrossRef]
  89. UNFCCC. 2015. Adoption of the Paris Agreement. Bonn: United Nations Framework Convention on Climate Change. Available online: https://unfccc.int/resource/docs/2015/cop21/eng/l09r01.pdf (accessed on 3 October 2023).
  90. United Nations Environment Programme. 2022. Adaptation Gap Report 2022: Too Little, Too Slow—Climate Adaptation Failure Puts World at Risk. Available online: https://www.unep.org/resources/adaptation-gap-report-2022 (accessed on 3 October 2023).
  91. van Eck, Nees Jan, and Ludo Waltman. 2010. Software Survey: VOSviewer, a Computer Program for Bibliometric Mapping. Scientometrics 84: 523–38. [Google Scholar] [CrossRef] [PubMed]
  92. Verma, Rakesh Kumar, and Rohit Bansal. 2023. Stock Market Reaction on Green-Bond Issue: Evidence from Indian Green-Bond Issuers. Vision-The Journal of Business Perspective 27: 264–72. [Google Scholar] [CrossRef]
  93. Wiafe, Nti Akenten, Charles Boateng, and Haftamu Kiros. 2020. The Role of Capital Markets in Economic Growth: Evidence from Ghana. Social Science Research Network Scholarly Paper. Available online: https://www.readcube.com/articles/10.2139%2Fssrn.3530744 (accessed on 3 October 2023).
  94. World Meteorological Organization. 2022. State of the Climate in Latin America and the Caribbean 2021 (WMO-No. 1295). Geneva: WMO. [Google Scholar]
  95. Wright, Helena, Saleemul Huq, and Jonathan Reeves. 2015. Impact of Climate Change on Least Developed Countries. London: International Institute for Environment and Development-JSTOR. [Google Scholar]
  96. Wu, Gabriel Shui Tang, and Wilson Tsz Shing Wan. 2023. What Drives the Cross-Border Spillover of Climate Transition Risks? Evidence from Global Stock Markets. International Review of Economics & Finance 85: 432–47. [Google Scholar] [CrossRef]
  97. Xi, Bin, and Huimin Jing. 2022. Research on the Impact of Green Bond Issuance on the Stock Price of Listed Companies. Kybernetes 51: 1478–97. [Google Scholar] [CrossRef]
  98. Yang, Lu, Jie Li, Wenhuan Lu, Yi Chen, Kang Zhang, and Yan Li. 2020. The Influence of Font Scale on Semantic Expression of Word Cloud. Journal of Visualization 23: 981–98. [Google Scholar] [CrossRef]
  99. Yenneti, Komali, Sabyasachi Tripathi, Yehua Dennis Wei, Wen Chen, and Gaurav Joshi. 2016. The Truly Disadvantaged? Assessing Social Vulnerability to Climate Change in Urban India. Habitat International 56: 124–35. [Google Scholar] [CrossRef]
  100. Yu, Yunlong, Zhao Jin, and Junping Qiu. 2021. Global Isotopic Hydrograph Separation Research History and Trends: A Text Mining and Bibliometric Analysis Study. Water 13: 2529. [Google Scholar] [CrossRef]
  101. Zhang, Shengling, Zihao Wu, Yao Wang, and Yu Hao. 2021. Fostering Green Development with Green Finance: An Empirical Study on the Environmental Effect of Green Credit Policy in China. Journal of Environmental Management 296: 113159. [Google Scholar] [CrossRef]
  102. Zhang, Wei, Qingpu Zhang, Bo Yu, and Limei Zhao. 2015. Knowledge Map of Creativity Research Based on Keywords Network and Co-Word Analysis, 1992–2011. Quality & Quantity 49: 1023–38. [Google Scholar] [CrossRef]
  103. Zhou, Xiaoguang, and Yadi Cui. 2019. Green Bonds, Corporate Performance, and Corporate Social Responsibility. Sustainability 11: 6881. [Google Scholar] [CrossRef]
  104. Zhou, Yaning. 2019. Development of Green Bond Market in Chin. Beijing: Peking University, vol. 319, pp. 448–51. [Google Scholar]
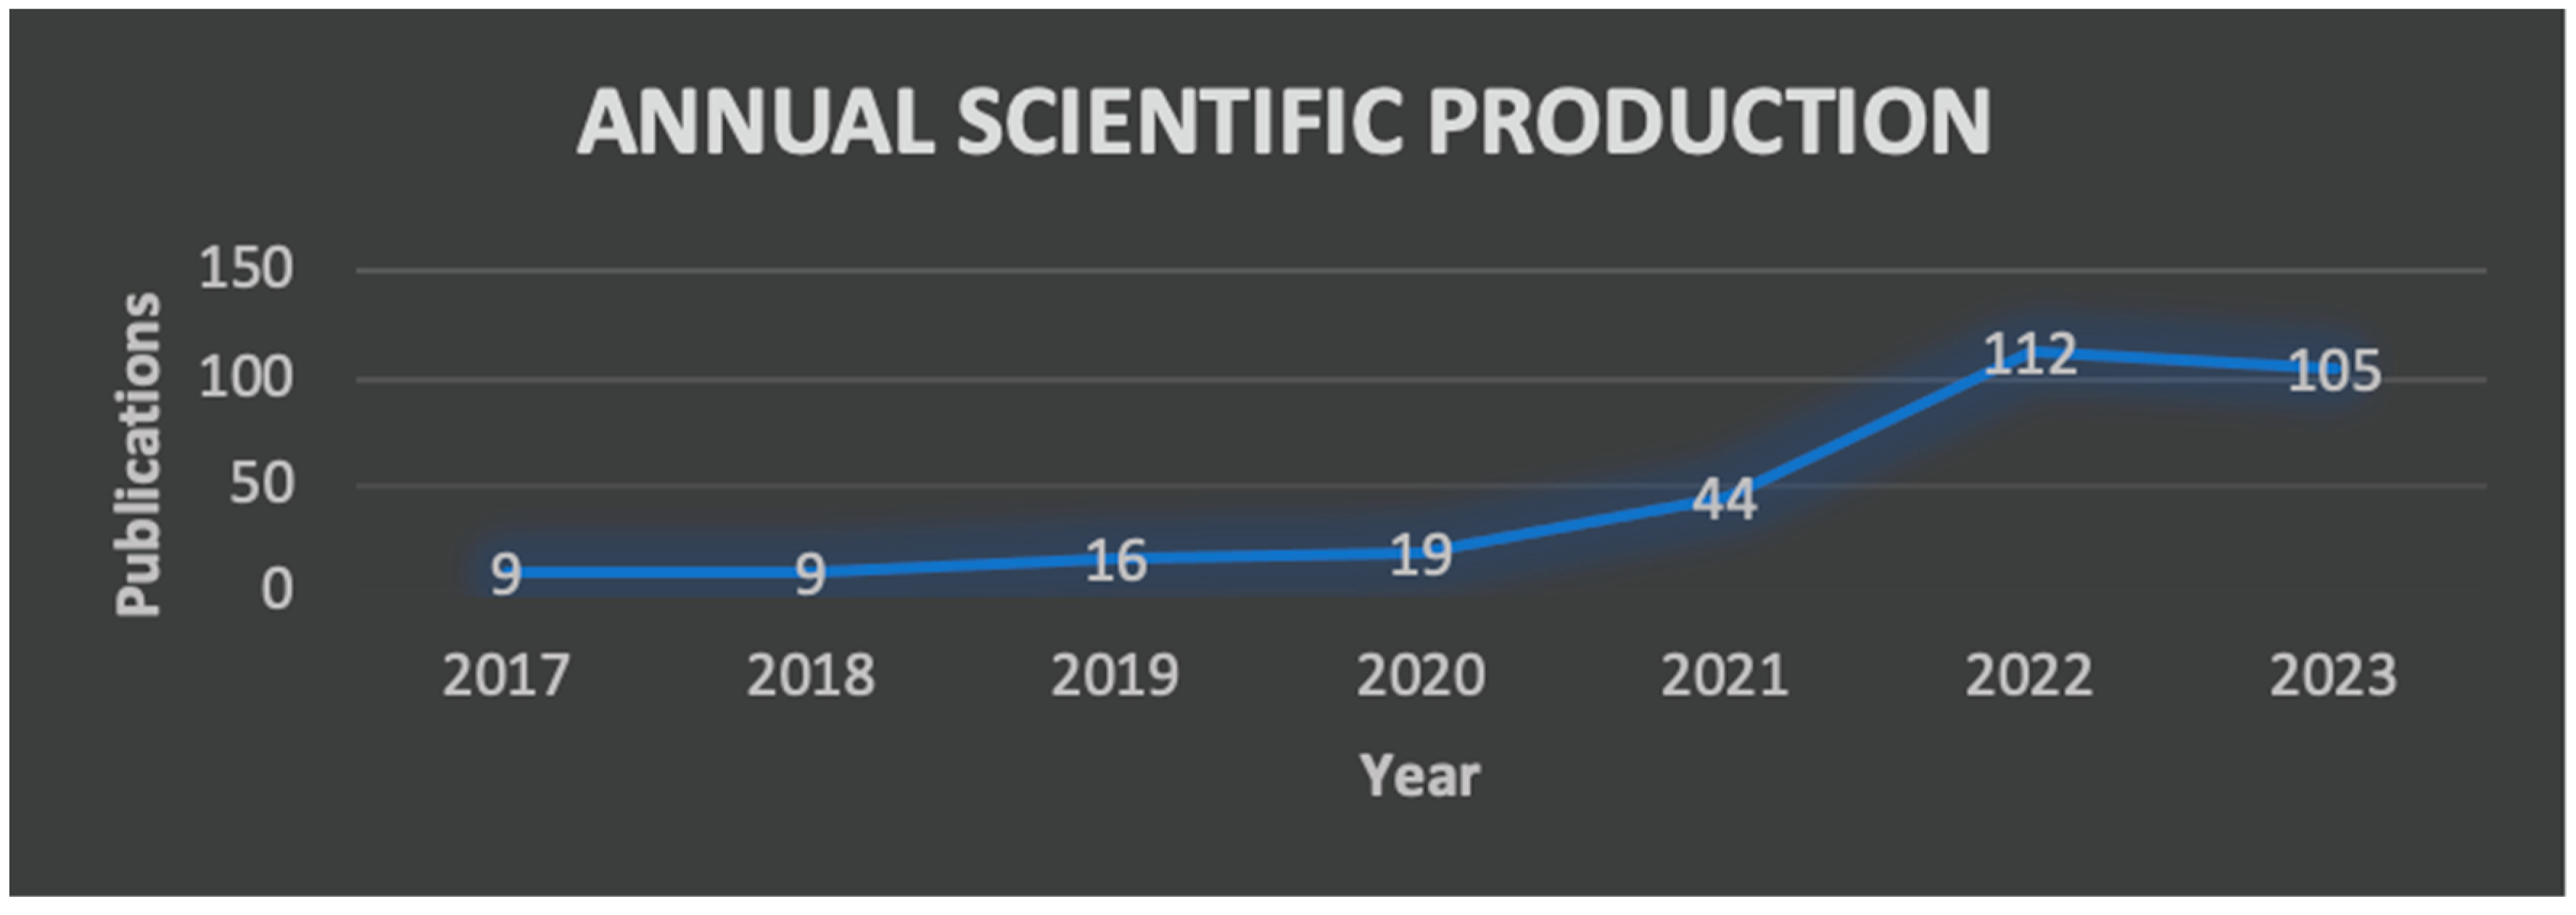
Figure 1. Research process. Source: Authors’ compilation (2024). The figure illustrates the steps undertaken in the research process.
Jrfm 17 00145 g001
Figure 2. Annual scientific production for the period 2017–September 2023. Source: Authors’ compilation (2024) based on WOS.
Jrfm 17 00145 g002
Figure 3. Author productivity via Lotka’s law. Source: Authors’ compilation (2024) based on WOS data.
Jrfm 17 00145 g003
Figure 4. Word cloud highlighting keywords of interest. Source: Authors’ compilation (2024) based on WOS data. The words shown in large font sizes have garnered the most research attention.
Jrfm 17 00145 g004
Figure 5. Keyword co-occurrence network. Source: Authors’ compilation (2024) based on WOS data.
Jrfm 17 00145 g005
Figure 6. Trend topics from 2019–2023. Source: Authors’ compilation (2024) based on WOS data. The figure displays eight popular topics along with the years that they were most prevalent.
Jrfm 17 00145 g006
Figure 7. The thematic map based on the relevance and density of themes. Scheme 2024. based on WOS data. The figure illustrates the themes’ development levels (density) and their importance (centrality).
Jrfm 17 00145 g007
Figure 8. Countries’ publication collaboration. Source: Authors’ compilation (2024) based on WOS data. The node sizes and link thickness show the strength of countries’ collaborations based on the authors’ associated countries.
Jrfm 17 00145 g008
Figure 9. Collaboration world map. Source: Authors’ compilation (2024) based on WOS data. The links show countries’ collaborations across the world.
Jrfm 17 00145 g009
Figure 10. Main author collaborations. Source: Authors’ compilation (2024) based on WOS data. The sizes of the nodes and the thickness of the links indicate the strength of the collaborations.
Jrfm 17 00145 g010
Figure 11. Key organization collaborations. Source: Authors’ compilation (2024) based on WOS data.
Jrfm 17 00145 g011
Table 1. Articles’ distribution over the years. Source: Authors’ compilation (2024) based on WOS data. The table displays the annual production of articles and their respective percentages based on total publications in the dataset.
YearArticles per Year (N)Percentage of Total
201792.87%
201892.87%
2019165.10%
2020196.05%
20214414.01%
202211235.67%
202310533.44%
N314100%
Table 2. Top 20 core sources based on Bradford’s law. Source: Authors’ compilation (2024) based on WOS data. Highlights the top 20 journals as per Bradford’s law, detailing their publication numbers and zone classification.
SourceRankFrequencyCumulative PercentageZone
Sustainability13310.5%Zone 1
Energy Economics22016.86%Zone 1
Journal of Cleaner Production31922.91%Zone 1
Environmental Science and Pollution Research41527.69%Zone 1
Resources Policy51030.87%Zone 1
Renewable Energy6733.1%Zone 1
Technological Forecasting and Social Change772.23%Zone 2
Energy Policy8635.33%Zone 2
Finance Research Letters9637.24%Zone 2
Journal of Sustainable Finance & Investment10639.15%Zone 2
Economic Research-Ekonomska Istraživanja11540.74%Zone 2
Frontiers in Environmental Science12542.33%Zone 2
International Journal of Environmental Research and Public Health13543.92%Zone 2
Business Strategy and the Environment14344.88%Zone 2
Climate Policy15346.8%Zone 2
Economic Analysis and Policy16347.76%Zone 2
Frontiers in Energy Research17348.72%Zone 2
Frontiers in Public Health18349.68%Zone 2
Green Finance19350.64%Zone 2
Heliyon20351.6%Zone 2
Table 3. Summary of distribution of articles according to Bradford’s law. Source: Authors’ compilation (2024) based on WOS data. The table summarizes journal and article data according to Bradford’s law zones.
ZoneNumber of JournalsNumber of Articles
N% N%
Zone 164.255%10433.12%
Zone 23625.53%10734.08%
Zone 39970%10332.80%
Total141 314
Table 4. Relevant sources by local citations. Source: Authors’ compilation (2024) based on WOS data. The table ranks the ten most frequently co-cited journals within the dataset.
SourcesArticle Citations
Energy Economics894
Journal of Clean Production724
Finance Research Letters498
Energy Policy362
Sustainability351
Resources Policy291
Environmental Science and Pollution Research254
Journal of Financial Economics245
Technological Forecasting and Social Change239
International Review of Financial Analysis209
Table 5. Author productivity output. Source: Authors’ compilation (2024) based on WOS data. Highlights the number of authors who have produced a given number of article(s) and the respective percentages.
No of ArticlesNo of AuthorsFrequency (%)
182691.68%
2637%
350.55%
410.11%
540.44%
610.11%
910.11%
Table 6. Main keyword frequency across publications. Source: Authors’ compilation (2024) based on WOS data. Summarizes the number of times a keyword occurred in the entire dataset.
WordsOccurrences
Green bonds102
Green finance58
Sustainable development23
China21
Climate change18
Climate finance18
COVID-1917
Green investment17
Green innovation15
Financial markets11
ESG11
Clean energy9
Table 8. Frequency of top country collaboration. Source: Authors’ compilation (2024) based on WOS data. A Summary of main country collaborations alongside the article publication numbers.
Country 1Country 2FrequencyPercentage
ChinaUnited Kingdom1722.08%
ChinaPakistan1012.99%
ChinaUSA1012.99%
United KingdomUSA79.09%
ChinaAustralia67.79%
PakistanSaudi Arabia67.79%
PakistanUnited Arab Emirates67.79%
ChinaCanada56.49%
ChinaJapan56.49%
ChinaMalaysia56.49%
Disclaimer/Publisher’s Note: The statements, opinions and data contained in all publications are solely those of the individual author(s) and contributor(s) and not of MDPI and/or the editor(s). MDPI and/or the editor(s) disclaim responsibility for any injury to people or property resulting from any ideas, methods, instructions or products referred to in the content.

