Abstract
The objective of this paper goes beyond the boundaries of an exploratory analysis to operationalize the association between corporate working capital and return on assets. This paper optimizes the impact of the Cash Conversion Cycle (CCC) on Return on Assets (ROA). The paper develops a mathematical formulation that connects the components of CCC to ROA. The sample includes the non-financial firms listed in DJIA30 and NASDAQ100. The data covers the quarterly periods from June 1992 to March 2018. The paper uses standard statistical tests including linearity (RESET), the Hausman test for fixed and random effects, and the Breusch–Pagan/Cook–Weisberg test for heteroskedasticity. The estimation is carried out using the GLS estimator. This study finds: (a) the optimal, rather than observed, components of CCC are robust and coherent, (b) if firms were to optimize the components of CCC, the ROA improves significantly, (c) the positive estimates of size show that the components of CCC help firms grow, (d) the effects of either observed or optimal CCC on ROA are reached in the short term (four quarters), (e) the results show that observed as well as optimal CCC are able to detect the structural break in the 2008 financial crisis, and (f) the results of a logit analysis show that the optimization algorithm results in significant increases in ROA that are associated with increases in degree of financial leverage and decreases in short-term debt ratio. This paper contributes to the related literature in two ways. First, the paper develops a mathematical structure that associates corporate CCC and ROA in a way that offers a guide to corporate financial managers regarding structural management of corporate CCC. Second, the paper examines the impacts of optimized CCC on ROA.
Keywords:
working capital; cash conversion cycle; return on assets; optimization; structural breaks; DIJA30; NASDAQ100 JEL Classification:
M21; C21; C33
1. Introduction
The association between corporate working capital and profitability is intrinsic as working capital is part of the investments of a company. The popularity of this association is mainly due to the characteristics of investment in working capital being, to a considerable extent, reversable, which is contrary to the investment in fixed assets being irreversible. The reversibility of investments in working capital offers alternative strategies to optimize the amount of investment in each component of working capital. Intrinsically, the optimization of the investment in working capital must be associated with corporate profitability. Eventually, corporate return on assets takes into consideration investment in working capital as well as fixed assets. In this sense, the practical management of working capital must be guided by structured links between components of working capital and return on assets. Although this link has gone through an evolution (Smith 1980), the related literature is fairly exploratory in terms of describing the relationship between working capital and profitability. An efficient management of working capital requires a structured relationship that enables practitioners not only to analyze but also to optimize the management of working capital to improve corporate profitability. It is worth noting that the efficient management of working capital entails planning and controlling current assets and current liabilities to reduce the risk of a firm’s inability to meet its short-term obligations and simultaneously avoid over-investing in current assets (Eljelly 2004). In this sense, Morshed (2020) offers an interesting qualitative view of the importance of CCC as a qualification that accountants must possess in order to better comprehend the need of financial decisions makers. Indeed, this treatment is a true reflection of the managerial skills required for better management of working capital. In addition, this view reflects the true measurement of working capital being drawn from both the balance sheet and income statement, both of which are prepared by accountants following accounting rules and standards.
The optimization of working capital has become an on-going research issue (Deloof 2003; Howorth and Westhead 2003; Lamberson 1995). Nazir and Afza (2009) conclude that a firm may adopt an aggressive policy by maintaining a low percentage of current assets to total assets or a high level of current liabilities as a percentage of total liabilities. However, having low levels of current assets has a negative impact on the firm’s liquidity. Alternatively, firms may adopt a more conservative working capital management policy by having a greater percentage of capital in liquid assets, but this may lead to lower levels of profitability (Weinraub and Visscher 1998). Therefore, an optimal level of working capital is the one that achieves a balance between liquidity and profitability.
The issues of aggressive versus conservative working capital management have been examined in the literature in terms of pros and cons (AlShattarat et al. 2010; Jose et al. 1996; Gentry et al. 1990). The authors in this paper argue that logical thinking is required if a firm is planning to reach a target profitability. The operationalization of this view is what is referred to as optimization, which is the central point in this paper. The main objective of working capital management is to create a balance between corporate profitability and any associated risk, as firms are required to achieve profitability while maintaining liquidity and solvency (Lazaridis and Tryfonidis 2006). Therefore, the management of working capital may have positive or negative impacts on the profitability of a firm, which in turn affects the wealth of shareholders (Raheman and Nasr 2007; Ponsian et al. 2014).
1.1. Objectives
This paper develops an algorithm that optimizes the component of the CCC based on the understanding that firms can reduce their dependence on external funding, and thus lower the costs of financing (De Almeida and Eid 2014). Therefore, this paper examines the extent to which an optimal CCC contributes to the profitability of a company, which is measured by the return on assets.
1.2. Contribution
This paper develops a novel structured mathematical link between working capital and return on assets. This link offers a practical guide for respective corporate managers regarding the efficient use of working capital to optimize return on assets.
The rest of the paper is organized as follows. Section 1 discusses the findings of the related studies about the effect of working capital on corporate profitability. Section 2 describes the data, the variables, the mathematical development of the relationship between CCC and return on assets, the mathematical algorithm to optimize the relationship between CCC and return on assets, and statistical estimation methods. Section 3 discusses the results. Section 4 presents the conclusions.
2. Literature Review and Hypotheses Development
The association between working capital and profitability has been examined in different ways. Charitou et al. (2010) argue that managers and major stakeholders, such as investors, creditors, and financial analysts, should be concerned with the effects of working capital, especially after the global financial crisis. At a micro level, and in terms of risk-return tradeoffs, Nazir and Afza (2009) report that aggressive working capital management policies achieve high returns but, simultaneously, are associated with increased risk. On the other hand, conservative policies are associated with lower profitability but lower risk (Gardner et al. 1986; Weinraub and Visscher 1998). In addition, Jose et al. (1996) and García-Teruel and Martínez-Solano (2007) report that aggressive working capital management policies significantly impact corporate profitability. More specifically, they report a significant inverse relationship between the cash conversion cycle and profitability. Chang (2018) offer further findings to support that an aggressive working capital policy could enhance corporate financial performance. In terms of industry effect, Nazir and Afza (2009) examine the impact of aggressive and conservative working capital policies in different industries, concluding that industry effects matter significantly. The benefits of efficient working capital management are also observed in the corporate performance of the stock market. Raheman and Nasr (2007) and Filbeck et al. (2017) have reported that managers can increase the value of shareholders and the profitability of a firm by reducing the cash conversion cycle, although they report a significant inverse relationship between liquidity and profitability. This conclusion is valid apart from the location of firms. That is, Raheman and Nasr (2007) report the same conclusion in Pakistani listed firms in Karachi Stock Exchange (KSE). In other developed economies, Filbeck et al. (2017) offer significant evidence that highly ranked firms in the “Working Capital Scorecard” published in CFO Magazine have been associated with higher excess equity portfolio returns than those lowly ranked. Nevertheless, although these results are significant indicators of the benefits of good management of working capital, the study did not further examine what these results could have been if the working capital had been optimized.
Filbeck and Krueger (2005) examine the working capital policies in different industries in the United States and report significant differences in working capital policies over time across different industries. Using the cash conversion cycle as an indicator of working capital management, Högerle et al. (2020) examine the development of working capital management and its impact on profitability and shareholder value, concluding that efficient working capital management (indicated by a shorter cash conversion cycle) influence profitability and shareholder value positively. In addition, Eldomiaty et al. (2018) report a significant role of a short cash conversion cycle for improving profitability. Accordingly, the first testable hypothesis can be developed as follows.
H0:
No significant relationship exists between the observed components of CCC and ROA.
H1:
Significant and positive relationships exist between the observed components of CCC and ROA.
Ching et al. (2011) and Jayarathne (2014) examine the relationship between the optimization of working capital and profitability. The results show that working capital management significantly impacts corporate performance and profitability, especially inventory management and cash conversion cycle, which contribute to better profitability. The related literature offers extended results about the the positive impact of working capital management on corporate performance (Deloof 2003; Gill et al. 2010; Nobanee et al. 2011; Baños-Caballero et al. 2014; Nguyen et al. 2020). Gustén and Pahkamaa (2017) offer an extended contribution of the CCC from simply being an indicator of liquidity to an indicator of working capital efficiency. That is, the shorter the CCC, the higher the working capital efficiency. This view is quite progressive, as the term efficiency reflects cost savings (or cost shields) that usually result in higher profitability. It is worth noting that the latter is the main integral objective being examined in this present study. Accordingly, the first testable hypothesis can be developed as follows.
H0:
No significant relationship exists between the optimal components of CCC and ROA.
H1:
Significant and positive relationships exist between the optimal components of CCC and ROA.
In terms of efficiency, Mavropulo et al. (2021) offer significant evidence that value-based management control systems improve in highly efficient working capital management. Furthermore, the working capital can be used effectively as a safeguard against corporate default (Sardo and Serrasqueiro 2022). Nevertheless, in both studies, the benefits of optimizing working capital is not examined. In this sense, Eldomiaty et al. (2016) report that the Value at Risk (VaR) for corporate working capital is a sufficient orientation toward an efficient management of working capital. That is, when firms are able to manage woking capital efficiently, the VaR of working capital can be reduced, which reflects an improvement in profitability. In this sense, the authors in the current paper argue that an optimization of the components of CCC is an efficient structure that helps improve the profitability of a firm.
The management of a company’s working capital requires consideration of the financing requirements, which is typically characterized as short-term financing. In this sense, the quality of managing the components of working capital affects the capital structure of a company. This effect is cumulative, as the company is financing working capital using short term financing. In the long run, significant changes in the company’s capital structure can be realized due to successive changes in the financing patterns. That is, debt financing can be adjusted to provide financial flexibility, which helps absorb liquidity shocks (Denis and McKeon 2012; DeAngelo et al. 2011; Gamba and Triantis 2008). This conclusion reflects the common practice in the literature of using the Cash Conversion Cycle as a convenient measure of liquidity (Richards and Laughlin 1980). A few studies have referred to the effects of certain components of working capital on a company’s capital structure. Graham and Harvey (2001) discussed the effects of product characteristics and trade credit obtained from suppliers on the capital structure of a company. That is, certain products are sold on credit, which results in increases in accounts receivable. The latter requires further short-term financing. In the same sense, the trade credits being received from the suppliers result in decreases in short-term financing (Petersen and Rajan 1997). Vu Thi and Phung (2021) offer extended evidence on the negative relationship between working capital and debt financing. Empirically, Flannery and Öztekin (2019) have concluded the robust and positive effects of payables and receivables of the leverage of a company. Furthermore, these effects are causal, which offer support to the above-mentioned arguments that the quality of managing working capital affects the capital structure in the long run.
3. Data, Variables, and Estimation Methods
The data examined in this paper are obtained from Thomson Reuters Finance Centre. The data include the non-financial firms listed in DJIA30 and NASDAQ100 listed firms. The data covers quarterly periods from June 1992 to March 2018. The choice of non-financial firms is justifiable on the basis that the components of the CCC carry significant importance in comparison to financial and service firms. The choice of the period under consideration is limited by the available data at Reuters Finance Centre. Nevertheless, the exclusion of updated recent years helps avoid a contemporaneous relationship due to the structural changes caused by the COVID19 pandemic. A list of the companies being examined in this paper is reported in Appendix A.
3.1. Dependent Variables
The paper examines the dependent variable using the ROA, which is a common measure of corporate profitability. The choice of ROA as an objective function stems from business reality. The ROA combines all the activities of a firm being reported in the income statement and balance sheet. The total assets (the denominator) reflect the size of the firm. The trace of total assets over time offer a satisfiable indicator of the growth of the firm (Yao et al. 2011; Sougiannis et al. 2008; Morrison 1993). The net profits (the numerator) reflect the extent to which a firm is managing its total assets efficiently in a way that results in increases in its net profits. In addition, the ROA reflects corporate operating efficiency and avoids differences in the capital structure (Jose et al. 1996). Accordingly, if there is an unjustifiable investment in current assets leading to high working capital, the profitability can be negatively influenced.
3.2. Independent Variables
The independent variables are classified into two groups: the observed and optimal components of CCC, respectively. The latter is the common measure of working capital (Soenen 1993; Deloof 2003; Padachi 2006; García-Teruel and Martínez-Solano 2007; Moussa 2019).
The weaknesses of these studies rest on a number of facts. First, these studies have been conducted in different countries that are classified as either developed or developing. Second, these studies examined different industries. Third, these studies have reached relatively, and to a large extent, common factors that are currently recognized in the related literature as determinants of working capital management. The descriptive statistics of the independent variables are reported in Appendix B.
3.3. Working Capital and ROA: Mathematical Formulation
The authors offer a formulation that relates the components of CCC to ROA. It is worth noting that the components of the CCC include sales revenue and COGS as two components in the income statement. In this sense, the latter can be addressed and re-arranged to solve for net profits, which is the numerator in the ROA ratio.
The mathematical formulation develops as follows.
where CCC = Cash Conversion Cycle, AR = Accounts Receivables, Inv = Inventory Conversion Period, AP = Accounts Payables deferral period, COGS = Cost of Goods Sold, S = Sales Revenue.
Equation (1) can be written in terms of turnover ratios as follows.
where = Accounts Receivable Turnover, = Inventory Turnover, = Accounts Payables Turnover.
If the three turnovers were to equal industry averages, respectively, the CCC converts into the industry average, which is referred to in this paper as . The latter can be considered a benchmark for CCC. As the target for any company is to match the industry benchmark, Equation (2) can be written as follows.
Equation (3) can be rearranged as follows.
Dividing both sides by 365
Equation (5) can be rewritten as follows.
Dividing both sides in Equation (6) by AR produces
Multiplying both sides in Equation (7) by S, produces
Solving Equation (8) for S produces
Given that the sales revenue in the income statement equation is as follows.
The sales Equation (10) can be put equal to Equation (9), which produces.
Therefore, Equation (11) can be rearranged and solved for Net Income as follows.
The inclusion of Total Assets (TA) to Equation (12) considers the contribution of working capital components to the Return on Assets (ROA) of a firm. The latter does not depend only on working capital but also on the extent to which fixed assets are utilized by using working capital. In this sense, both sides in Equation (12) are divided by TA, which produces an estimated ROA* as follows.
Equation (13) offers a mathematical association between the three components of CCC and ROA. As this formulation follows the industry average CCC* as a benchmark, it follows that if a firm manages the components of working capital to approach the CCC*, the ROA approaches the industry average as well, which can be referred to as “Estimated ROA”. This potential association between CCC and ROA requires an examination of whether the components in Equation (13) carry the same hypothetical trends that are implied in the equation.
3.4. The Optimization Algorithm of CCC and Target Return on Assets
The optimal components of CCC are reached by developing a mathematical algorithm with an objective function that incorporates ROA = Industry average ROA. The optimization algorithm follows Luenberger and Ye (2008) and Vavasis (1991). The standard optimization algorithm includes an objective function , where refers to the Objective Function that ROA* = Industry Average ROA; the decision variables that include CCC, AR, Inv, AP, COGS; the constraints that AR + Inv < CA; AP < CL; COGS < Sales revenue; Total Assets = Total Liabilities and Owners’ Equity; Target Total Assets = Observed Total Assets.
3.5. The Estimation of the Effects of Observed and Optimal CCC on ROA
This section shows the results of the effects of observed and optimal CCC on firms’ ROA independently. That is, the estimation process is run twice. The first run regresses the components of the observed CCC (as reported in the firms’ income statement and balance sheets) against observed ROA. Then, the components of the CCC are optimized using the algorithm being structured in Section 3.4. The second run regresses the components of the optimized CCC against observed ROA. The objective is to examine the impacts of the components of CCC when they are optimized. In addition, the estimation procedures consider the effects of the size of a firm as control variables. Size is measured as the natural log of total assets (Chan et al. 1985; Kim and Burnie 2002; Dang et al. 2018; Mustilli et al. 2018; Hashmi et al. 2020). As the size of a firm is generic and changes over time, it is worth noting that the effect of size is examined in this paper not as a level data but as clusters. That is, the values of the log of total assets are arranged in a descending order and are then classified into four quartiles that represent four clusters of size of the firm. The four quartiles of size are examined as four dummy variables being measured as binary values. The estimating equation of the random effect linear model takes the form of Least Squares Dummy Variables (LSDV) as follows.
where t = 1, …, n, k = number of firms in each group, = ROA, = the Components of Observed and Optimal CCC, respectively, in addition to quartiles of corporate size as control variables, = Random error term due to the individual effect, = Random error.
Model 1: The association between observed components of CCC and observed ROA; Model 2: The association between observed components of CCC, ROA, and size of the firm; Model 3: The association between optimal components of CCC and observed ROA; Model 4: The association between optimal components of CCC, observed ROA, and size of the firm. Hausman test results show that models 1, 2, 3, and 4 fit the random effect model as the p-value associated with the test is greater than 5%. The results are reported in Appendix C. The results for the RESET test show that the linear model fits the data. The results of the test are reported in Appendix D. The results for the Breusch–Pagan/Cook–Weisberg test for heteroskedasticity show that the variances of residuals are not constant, requiring a robust estimation of the model’s parameters. The results are reported in Appendix E. The results for the Multicollinearity test (Variance Inflation Factor, VIF) show that all variables are associated with VIF < 5. The results are reported in Appendix F.
4. Discussion
4.1. The Effects of Observed CCC on Observed ROA
The results reported in Table 1 indicate that the coefficients in models 1 and 2 (the Observed Accounts Receivables and Observed Inventory Turnover respectively) affect ROA positively and significantly. Extended positive impacts are also reported in various countries. For example, in Poland, Anton and Nucu (2021) have reached an inverted U-shape relationship between working capital and profitability of the firms, which implied a non-linear relationship. In this sense, the results reported by Arnaldi et al. (2021) from Czech Republic SMEs offer support to the downward impact of investment in the inventory on profitability that is measured by EBITDA. It is worth noting that the above-reported positive relationships reflect business realities. That is, the positive impact of accounts receivables on profitability is quite interpretable by a common business trend of offering and extending credit sales, which encourages customers to buy beyond current needs. Accordingly, sales revenues increase, which extends to an improvement in profitability. This interpretation extends to the positive impact of inventory turnover on profitability. That is, high inventory turnover reflects increases in sales revenue, which extends to high profitability. These positive impacts have been realized in different countries. In Sweden, Gustén and Pahkamaa (2017) extend the benefits of managing working capital efficiently to improve ROA. The same benefits of working capital efficiency have also been extended and examined in Qatar in the Gulf region, reaching the same conclusion (Aldubhani et al. 2022). These results offer an extended validity of the relationship between working capital management and profitability. However, the treatment of the relationship between working capital and profitability in this present paper offers updates to the above-mentioned results in different countries that seem relatively homogeneous. That is, in this present paper, the estimate of Observed Accounts Payables is fragile as it turned insignificant when dummy variables for corporate size were included. The same results, in terms of significance and trend, have been reached by Takon (2013), Enqvist et al. (2014), and Guragai et al. (2019).

Table 1.
The results for the observed and optimal components of CCC on ROA.
Khan et al. (2021) have reached the same trend and significance using Gross Profit as a profitability indicator. Chang (2018) used Tobin’s Q as a profitability measure alongside the return on assets. The results indicated that industry-adjusted CCC exhibits a significant relationship between the industry-adjusted ROAs and industry-adjusted Tobin’s Q. Nevertheless, Rizky and Mayasari (2018), Nguyen et al. (2020), Sawarni et al. (2020), Arnaldi et al. (2021), Mathuva (2010), Nobanee et al. (2011), and Yazdanfar and Öhman (2014) report the same significance but with reverse signs. In terms of size of the firm, Howorth and Westhead (2003) and Mathuva (2010) report significant and positive association with profitability. Interestingly, the positive estimates of size (natural log of Total Assets) show that the components of CCC help firms grow and have positive effects on ROA. This result is quite apparent in the study of Howorth and Westhead (2003) where they examined a sample of small firms entirely as well as variables that are intrinsically components of the CCC. That is, the size of the firm matters convincingly. It is worth noting that the positive impact of the size of the firm on profitability reflects business reality as well. That is, increases in the accounts receivable and inventory cause increases in the total assets. As the results show positive impacts of the accounts receivables and inventory on profitability, it is true that total assets (as a proxy for size) have a positive impact on profitability.
4.2. The Effects of Optimal CCC on Observed ROA
The results in Table 1 show that the estimates of optimal CCC in Models 3 and 4 are more robust and coherent than the estimates of observed CCC in Models 1 and 2. The three components of CCC have the same positive trend and significance. It is worth noting that the explanatory power of CCC’s optimal estimates is greater than the observed CCC’s estimates. These results indicate that when firms can optimize the components of CCC, the effect on ROA improves significantly. In this sense, the results of the optimized CCC offer the corporate planners a practical guide regarding the significant components of CCC, which significantly help improve ROA.
In terms of the duration of CCC, the results in Table 1 show that the effects of either observed or optimal CCC on ROA can be reached in the short term (four quarters). Eldomiaty et al. (2018) report a similar outcome. Indeed, this result conforms to the reality of managing working capital as it takes place in the short, rather than, long term.
Interestingly, the authors must admit that the results reported in this paper reveal a large extent of similarity among other related studies being examined and conducted in different countries and different times and business cycles. This paper extends the state of convergence so that the observed components of CCC can be managed to converge to optimal CCC. Therefore, the effects of CCC on a firm’s ROA converge to a universal state.
4.3. An Examination of the Structural Breaks for Observed and Optimal Working Capital
The Quandt–Andrews test (Quandt 1958; Andrews 1993) is performed to show whether structural breaks exist in the observed and optimal CCC. The initial visual observations of potential structural breaks are shown in Figure 1, Figure 2 and Figure 3.
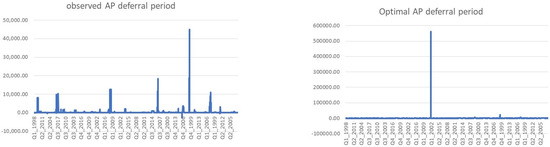
Figure 1.
Visual presentation of potential structural breaks in case of observed and optimal accounts payables deferral period.
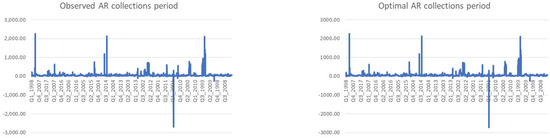
Figure 2.
Visual presentation of potential structural breaks in case of observed and optimal accounts receivable collections period.
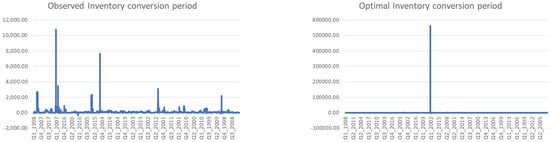
Figure 3.
Visual presentation of potential structural breaks in case of observed and optimal inventory conversion period.
The objective of the three graphs is to detect the extent to which the optimization of the components of CCC may have significant differences from the observed CCC. Figure 2 shows that the behavior of the accounts receivables collections period seems very close in cases of observed and optimal CCC. It is obvious that the structural breaks of accounts payables deferral period and inventory conversion period in the observed setting differ from the optimal. Nevertheless, further statistical testing is required to examine whether the structural breaks in the observed CCC are significant, which is performed using the Quandt–Andrews test (Quandt 1958; Andrews 1993). The results are reported in Table 2.
Table 2.
The results of the Quandt–Andrews test for the observed and optimal accounts payables deferral period and inventory conversion period.
The results in Table 2 show significant variations between the breakpoints in the cases of observed values of the accounts payables deferral period and observed inventory conversion period. In this case, the structural breakpoints in these two components indicate significant instability in the management of these two components. Nevertheless, when these two components are managed optimally in a way that targets lagged industry average ROA, the majority of the observations (up to 35% of the quarterly data) can be stabilized in the sense that the variations between the breakpoints in the cases of optimal values of the accounts payables deferral period and optimal inventory conversion period are insignificant. This is also evident in Figure 1 and Figure 3, in which these two optimal components of working capital are much more stable than those observed.
4.4. An Examination of the Potential Structural Break in the 2008 Financial Crisis
The above-mentioned results about structural breaks must be further examined in terms of the significance of the 2008 financial crisis, which is quite intrinsic to the data being about the listed non-financial firms in the USA. The Chow (1960) test is employed, and the results are reported in Table 3.
Table 3.
Testing the significance of the observed and optimal CCC during the 2008 financial crisis.
The results in Table 3 show that the observed CCC in the listed non-financial firms in DJIA30 and NASDAQ100 were affected by the 2008 financial crisis. The same is true for the optimized CCC as well. These results extend the conclusion reached by (Akgün and Karataş 2020) that, during the 2008 financial crisis, the gross working capital for firms in all the European Union had significant effects on the ROA. Therefore, the authors plausibly argue that the results reported in this present paper are characterized by a significant degree of generalizations as similar results are reported in different regions: the USA in case of the present paper, the EU (Akgün and Karataş 2020), and the MENA region (EL-Ansary and Al-Gazzar 2021), although the relationship between working capital and ROA is non-linear. Furthermore, the results in the present paper offer an empirical validity of the optimization algorithm, which could efficiently detect the effects of the 2008 structural break, as the statistical values (F, Log Likelihood, and Wald) are much higher than the observed components of the cash conversion cycle. These results also show that the mathematical structure in Equation (13) can be efficiently used to manage the cash conversion cycle in a way that helps get a firm’s ROA close to the industry average ROA during financial turbulence.
4.5. An Examination of the Impact of Short-Term Debt and Degree of Financial Leverage on Return on Assets
The optimization of working capital further raises two related empirical issues that reflect the reality of managing firm’s working capital. The first issue is to do with the financing of working capital. The second related issue is to do with the impact of financing of working capital on the degree of financial leverage. Initially, the financing of working capital using current liabilities affects a firm’s capital structure. In this case, the short-term debt ratio (current liabilities/total assets) is a relevant measure. Therefore, the changes in are reflected in the income statement in terms of the Degree of Financial Leverage (percentage change in EPS/Percentage change in EBIT). Intrinsically, the financing of working capital follows a short-term horizon where short-term debt (or current liability) is the relevant source of financing. In this case, the logit analysis is helpful. The structure of the logit models is as follows.
The dependent variable uses binary values, where 1 refers to a current , which is greater than a one-quarter lagged , and zero otherwise. The two independent variables are the and . The takes binary values where 1 refers to a current is greater than a one-quarter lagged and zero otherwise. The takes binary values where 1 refers to a current is smaller than a one-quarter lagged and zero otherwise. The results of the logit analysis are reported in Table 4.
Table 4.
The impact of short-term debt ratio and degree of financial leverage on return on assets: logit analysis.
The results reported in Table 4 compare the impacts of and on in two states; namely, the current state, which is referred to as observed and optimized state. The results show the perils of optimization. That is, 54.14% of the observations (quarters) of increases in are associated with increases in , which is greater than the observed state. In addition, 63.21% of the observations (quarters) of decreases in are associated with increases in .
5. Conclusions
This paper offers a structural relationship between working capital (being proxied by CCC) and returns on assets. The intrinsic characteristics of the components of CCC being reversable allow for an optimization of these components to get corporate return on assets to a benchmark that is the average industry ROA. This paper examines the impact of the components of CCC on ROA through a mathematical formulation that connects both dimensions. The paper compares the effect of observed and optimal components of CCC on the ROA of a firm.
As the efficient management of working capital and profitability has been reported to be significant in various studies and in different countries and regions, this paper further examines whether an optimized working capital is associated with the same benefits. Indeed, this significant relationship turned out to be universal as long as it is reported in different countries and/or regions such as USA, UK, European Union, and MENA.
The perils of optimizing the CCC to reach a target ROA are further shown by logit analysis. That is, the optimization algorithm results in significant increases in ROA that are associated with increases in the degree of financial leverage and decreases in short-term debt ratio. The updated results reported in this present paper can be used to offer a ground theory for the relationship between profitability and working capital management. When firms can optimize the management of working capital, we can reach an efficient working capital that helps firms improve the return on assets.
5.1. Recommendation for Corporate Planners
As far as structural breaks are concerned, the 2008 financial crisis had an impact on the relationship between working capital and profitability. In this regard, the optimization algorithm being carried out in this paper helps stabilize the accounts payables deferral period and observed inventory conversion period during the 2008 financial crisis. It is, therefore, plausible to assume that this optimization algorithm offers wide benefits to the management of working capital across different countries and can lessen the unfavorable effects during turbulent times. The optimality condition is based on optimizing the components of CCC to satisfy the condition that the observed ROA matches the previous lagged industry average ROA. The methodology of this paper offers a realistic as well as empirical analysis about using working capital to reach a target profitability. The use of the first lagged (last quarter) industry average ROA offers an advantage to a corporate planner that helps a firm get close to the industry average ROA. The results show that the optimization of two components of working capital (accounts payables and inventory) helps companies improve ROA to reach the industry average ROA. As the optimization of working capital could contribute to the stabilization of accounts payables deferral period and observed inventory conversion, further benefits can also be realized in case of potential increases in interest rates. That is, when firms finance current assets using short term financing, the stabilization of inventory and accounts payables guarantee lower cost of financing.
5.2. Recommendation for Further Research
The results show that the optimization algorithm that is developed in this paper results in a more stable accounts payables deferral period and inventory conversion period. In this sense, the authors suggest further research in the realm of modeling other dimensions of corporate liquidity that help firms improve profitability. Arithmetically, it is worth noting that the results of the optimized components of CCC being reported in this paper are limited to the fulfillment of the objective function, which is the industry average ROA. That is, there are several firms in the same industry that might have ROAs that are greater or smaller than the average. Therefore, the average ROA is treated and examined in this paper as an indicator of profitability, but not necessarily an ultimate objective. A firm might still have a chance to set a target ROA greater than the industry average.
Nevertheless, the optimization of the components of CCC can be further extended to fulfill various profitability indicators such as profit margin (which concerns the management of operational activities), earnings before interest and taxes (which concerns the creditors of a company) and dividends yield (which concerns the shareholders). In this sense, the optimization of working capital can play a significant role in mitigating the information asymmetry between corporate managers and other stakeholders.
Author Contributions
Conceptualization, T.E. and M.R.; methodology, T.E. and N.E.; software, F.T.; validation, T.E., M.R. and N.E.; formal analysis, T.E.; investigation, M.R.; resources, F.T.; data curation, T.E. and F.T.; writing—original draft preparation, T.E.; writing—review and editing, M.R.; visualization, N.E.; supervision, T.E.; project administration, T.E.; funding acquisition, T.E., N.E. and M.R. All authors have read and agreed to the published version of the manuscript.
Funding
This research received no external funding.
Data Availability Statement
The data that support the findings of this study are available from Reuters Finance Centre (https://www.reuters.com/markets/) (accessed on 9 May 2023).
Conflicts of Interest
The authors declare no conflict of interest.
Appendix A. List of the Companies Examined in This Paper
| ID | Company | ID | Company | ID | Company | ID | Company | ID | Company |
| 1 | Act Blizzard Inc. | 26 | Cognizant Tech Solutions Corp. | 51 | JD.com Inc. | 76 | Seagate Technology PLC | 101 | Cisco |
| 2 | Adobe Systems Inc. | 27 | Comcast Corp. | 52 | KLA Tencor Corp. | 77 | Shire PLC | 102 | Coca Cola |
| 3 | Alexion Pharma Inc. | 28 | Costco Wholesale Corp. | 53 | Kraft Heinz Co | 78 | Sirius XM Holdings Inc. | 103 | ExMob |
| 4 | Align Technology Inc. | 29 | CSX Corp. | 54 | Lam Research Corp. | 79 | Skyworks Solutions Inc. | 104 | GE |
| 5 | Alphabet Inc. | 30 | Ctrip.Com International Ltd. | 55 | Liberty Global PLC | 80 | Symantec Corp. | 105 | Goldman |
| 6 | Amazon.com | 31 | Dentsply Sirona Inc. | 56 | Marriott International Inc. | 81 | Synopsys Inc. | 106 | Home Depot |
| 7 | American Airlines G Inc. | 32 | DISH Network Corp. | 57 | Maxim Integrated Products Inc. | 82 | TakeTwo Interactive Software Inc. | 107 | Intel Inc. |
| 8 | Amgen Inc. | 33 | Dollar Tree Inc. | 58 | Mercadolibre Inc. | 83 | Tesla Inc. | 108 | Int Bus Mach |
| 9 | Analog Devices Inc. | 34 | Electronic Arts Inc. | 59 | Microchip Technology Inc. | 84 | Texas Instruments Inc. | 109 | J & J |
| 10 | Apple Inc. | 35 | Expedia Group Inc. | 60 | Micron Technology Inc. | 85 | T-Mobile US Inc. | 110 | Mac Don |
| 11 | ASML Holding NV | 36 | Express Scripts Holding Co | 61 | Microsoft Corp. | 86 | TwentyFirst Century Fox Inc. | 111 | Merck |
| 12 | Automatic Data Processing Inc. | 37 | Facebook Inc. | 62 | Mondelez International Inc. | 87 | Ulta Beauty Inc. | 112 | Microsoft |
| 13 | Baidu Inc. | 38 | Fastenal Co | 63 | Monster Beverage Corp. | 88 | Verisk Analytics Inc. | 113 | Nike |
| 14 | Biogen Inc. | 39 | Fiserv Inc. | 64 | Mylan NV | 89 | Vertex Pharmaceuticals Inc. | 114 | P&G |
| 15 | Biomarin Pharmaceutical Inc. | 40 | Gilead Sciences Inc. | 65 | NetEase Inc. | 90 | Walgreens Boots Alliance Inc. | 115 | Pfizer |
| 16 | Booking Holdings Inc. | 41 | Hasbro Inc. | 66 | Netflix Inc. | 91 | Western Digital Corp. | 116 | UnitedHealth |
| 17 | Broadcom Inc. | 42 | Henry Schein Inc. | 67 | NVIDIA Corp. | 92 | Workday Inc. | 117 | United Technologies |
| 18 | CA Inc. | 43 | Hologic Inc. | 68 | O’Reilly Automotive Inc. | 93 | Wynn Resorts Ltd. | 118 | Verizon |
| 19 | Celgene Corp. | 44 | IDEXX Laboratories Inc. | 69 | Paccar Inc. | 94 | Xilinx Inc. | 119 | Visa |
| 20 | Cerner Corp. | 45 | Illumina Inc. | 70 | Paychex Inc. | 95 | 3M | 120 | Walmart |
| 21 | Charter Communications Inc. | 46 | Incyte Corp. | 71 | PayPal Holdings Inc. | 96 | AmExp | 121 | Walt Disney |
| 22 | Check Point Software Tech Ltd. | 47 | Intel Corp. | 72 | Qualcomm Inc. | 97 | Apple | ||
| 23 | Cintas Corp. | 48 | Intuit Inc. | 73 | Qurate Retail Inc. | 98 | Boeing | ||
| 24 | Cisco Systems Inc. | 49 | Intuitive Surgical Inc. | 74 | Regeneron Pharmaceuticals Inc. | 99 | CAT | ||
| 25 | Citrix Systems Inc. | 50 | J B Hunt Transport Services Inc. | 75 | Ross Stores Inc. | 100 | Chevron |
Appendix B. Descriptive Statistics of the Variables Examined in This Paper
| Minimum | Maximum | Mean | Std. Deviation | |
| Observed Return on Assets | −1.065 | 1.1295 | −0.0422 | 0.1075 |
| Observed Accounts Payables Deferral period | −2323.3 | 45,000.0 | 376.2 | 1782.2 |
| Observed Accounts Receivables collections period | −2700.0 | 2250.0 | 68.2 | 123.8 |
| Observed Inventory Turnover period | −270.0 | 10,800.0 | 95.6 | 300.1 |
| Optimal Accounts Payables deferral period | −73.5 | 561,697.2 | 304.9 | 8900.0 |
| Optimal Accounts Receivables collections period | −2700.0 | 2250.0 | 68.3 | 124.0 |
| Optimal Inventory Turnover period | −49.7 | 561,723.1 | 232.9 | 8880.6 |
Appendix C. Testing for Random vs. Fixed Effects (Hausman Test)
Since the data are cross section-time series panel, the Hausman specification test (Hausman 1978; Hausman and Taylor 1981) is required to determine whether the fixed or random effects model should be used. The test looks for the correlation between the observed and the unobserved , and it is therefore run under the hypotheses that follow.
where = regressors, and = error term.
The results in Table A1 show that Models 1, 2, 3, and 4 best fit the random effect model as the p-value associated with the test is greater than 5%.
Table A1.
The results of the Hausman test. Model 1: The association between the observed components of CCC and observed ROA; Model 2: The association between the observed components of CCC, ROA, and size of the firm; Model 3: The association between optimal components of CCC and observed ROA; Model 4: The association between optimal components of CCC, observed ROA and size of the firm.
| Model 1 | Model 2 | Model 3 | Model 4 | |
|---|---|---|---|---|
| Hypothesis | H0: differences in coefficients are not systematic; H1: differences in coefficients are systematic | |||
| Chi2 Statistic | Chi2(3) = 6.56 [0.0874] | Chi2(6) = 5.53 [0.4774] | Chi2(3) = 0.85 [0.8384] | Chi2(6) = 1.75 [0.9411] |
[Significance levels].
Appendix D. Testing for Linearity vs. Nonlinearity (RESET)
The issue of linearity versus nonlinearity is addressed and examined as well. Regression Equation Specification Error Test, RESET (Ramsey 1969; Thursby and Schmidt 1977; Thursby 1979; Sapra 2005; Wooldridge 2015) is employed to test the two hypotheses that follow:
The null hypothesis refers to linearity and the alternative refers to nonlinearity.
The results in Table A2 show that the linear model fits the data.
Table A2.
Ramsey RESET test using powers of the fitted values of observed ROA. Model 1: The association between observed components of CCC and observed ROA; Model 2: The association between observed components of CCC, ROA and size of the firm; Model 3: The association between optimal components of CCC and observed ROA; Model 4: The association between optimal components of CCC, observed ROA and size of the firm.
| Model 1 | Model 2 | Model 3 | Model 4 | |
|---|---|---|---|---|
| Hypothesis | H0: model has no omitted variables; H1: model has omitted variables | |||
| Statistic | F (3, 9794) = 1.23 [0.297004] | F (3, 9791) = 1.70 [0.16469] | F (3, 9794) = 1.49 [0.215053] | F (3, 9791) = 1.18 [0.31567] |
Appendix E. Heteroskedasticity Test
The results in Table A3 show that the variances of residuals are not constant, requiring a robust estimation to estimate the model’s parameters.
Table A3.
The results for the Breusch–Pagan/Cook–Weisberg test for heteroskedasticity. Model 1: The association between observed components of CCC and observed ROA; Model 2: The association between observed components of CCC, ROA, and size of the firm; Model 3: The association between optimal components of CCC and observed ROA; Model 4: The association between optimal components of CCC, observed ROA and size of the firm.
| Model 1 | Model 2 | Model 3 | Model 4 | |
|---|---|---|---|---|
| Hypothesis | H0: The residuals have constant variance; H1: The residuals have no constant variance | |||
| Statistic | chi2(1) = 84.13 *** | chi2(1) = 304.05 *** | chi2(1) = 63.15 *** | chi2(1) = 269.92 *** |
*** Significant at 1%.
Appendix F. Multicollinearity Test
The results in (Table A4) show that there is no multicollinearity among the independent variables as the values of VIF are less than 5.
Table A4.
The results for the Multicollinearity test (Variance Inflation Factor, VIF). Model 1: The association between observed components of CCC and observed ROA; Model 2: The association between observed components of CCC, ROA, and size of the firm; Model 3: The association between optimal components of CCC and observed RO; Model 4: The association between optimal components of CCC, observed ROA and size of the firm.
| Model 1 | Model 2 | Model 3 | Model 4 | |
|---|---|---|---|---|
| Observed Accounts Payables Deferral Period | 1.08 | 1.14 | ||
| Observed Accounts Receivables Collections Period | 1.05 | 1.06 | ||
| Observed Inventory Conversion Period | 1.03 | 1.07 | ||
| Firm Size Q4 | 1.57 | |||
| Firm Size Q3 | 1.56 | |||
| Firm Size Q2 | 1.55 | |||
| Optimal Accounts Payables | 2.170 | 2.48 | ||
| Optimal Inventory Conversion | 2.169 | 2.45 | ||
| Optimal Accounts Receivables | 1.05 | 1.07 | ||
| Firm Size Q4 | 1.52 | |||
| Firm Size Q3 | 1.51 | |||
| Firm Size Q2 | 1.51 |
References
- Aldubhani, Maad A. Q., Jitian Wang, Tingting Gong, and Ramzi A. Maudhah. 2022. Impact of working capital management on profitability: Evidence from listed companies in Qatar. Journal of Money and Business 2: 70–81. [Google Scholar] [CrossRef]
- AlShattarat, Wasim K., Haitham Nobanee, Haitham Haddad, and Maryam Al Hajjar. 2010. Working capital management, operating cash flow and corporate performance. International Journal of Strategic Management 10: 84–88. [Google Scholar]
- Akgün, Ali I., and Ayyüce M. Karataş. 2020. Investigating the relationship between working capital management and business performance: Evidence from the 2008 financial crisis of EU-28. International Journal of Managerial Finance 17: 545–67. [Google Scholar] [CrossRef]
- Anton, Sorin G., and Anca E. A. Nucu. 2021. The Impact of Working Capital Management on Firm Profitability: Empirical Evidence from the Polish Listed Firms. Journal of Risk and Financial Management 14: 9. [Google Scholar] [CrossRef]
- Arnaldi, Arnaldo, Bar Novak, Remo Roscigno, and Wu Zhang. 2021. Working capital management and profitability: Empirical evidence. International Journal of Business Management and Economic Research 12: 1911–17. [Google Scholar]
- Andrews, Donald W. K. 1993. Tests for Parameter Instability and Structural Change with Unknown Change Point. Econometrica 61: 821–56. [Google Scholar] [CrossRef]
- Baños-Caballero, Sonia, Pedro J. García-Teruel, and Pedro Martínez-Solano. 2014. Working capital management, corporate performance, and financial constraints. Journal of Business Research 67: 332–38. [Google Scholar] [CrossRef]
- Chang, Chong-Chuo. 2018. Cash conversion cycle and corporate performance: Global evidence. International Review of Economics & Finance 56: 568–81. [Google Scholar]
- Chan, K. C., Nai-fu Chen, and David Hsieh. 1985. An exploratory investigation of the firm size effect. Journal of Financial Economics 14: 451–71. [Google Scholar] [CrossRef]
- Charitou, Melita Stephanou, Maria Elfani, and Petros Lois. 2010. The effect of working capital management on firms profitability: Empirical evidence from an emerging market. Journal of Business & Economics Research 8: 111–18. [Google Scholar]
- Ching, Hong Yuh, Ayrton Novazzi, and Fábio Gerab. 2011. Relationship Between Working Capital Management and Profitability in Brazilian Listed Companies. Journal of Global Business and Economics 3: 74–86. [Google Scholar]
- Chow, Gregory C. 1960. Tests of Equality Between Sets of Coefficients in Two Linear Regressions. Econometrica 28: 591–605. [Google Scholar] [CrossRef]
- Dang, Chongyu, Zhichuan Li, and Chen Yang. 2018. Measuring firm size in empirical corporate finance. Journal of Banking and Finance 86: 159–76. [Google Scholar] [CrossRef]
- Denis, David J., and Stephen B. McKeon. 2012. Debt financing and financial flexibility evidence from proactive leverage increases. The Review of Financial Studies 25: 1897–929. [Google Scholar] [CrossRef]
- De Almeida, Juliano Ribeiro, and William Eid, Jr. 2014. Access to finance, working capital management and company value: Evidence from Brazilian companies listed on BM&FBOVESPA. Journal of Business Research 67: 924–34. [Google Scholar]
- DeAngelo, Harry, Linda DeAngelo, and Toni M. Whited. 2011. Capital structure dynamics and transitory debt. Journal of Financial Economics 99: 235–61. [Google Scholar] [CrossRef]
- Deloof, Marc. 2003. Does working capital management affect profitability of Belgian firms? Journal of Business Finance & Accounting 30: 573–88. [Google Scholar]
- EL-Ansary, Osama, and Heba Al-Gazzar. 2021. Working capital and financial performance in MENA region. Journal of Humanities and Applied Social Sciences 3: 257–80. [Google Scholar] [CrossRef]
- Eldomiaty, Tarek, Marwa Anwar, and Ahmed Ayman. 2018. How can firms monitor the move toward optimal working capital? Journal of Economic and Administrative Sciences 34: 217–36. [Google Scholar] [CrossRef]
- Eldomiaty, Tarek Ibrahim, Mohamed Hashem Rashwan, Mohamed Bahaa El Din, and Waleed Tayel. 2016. Firm, Industry and Economic Determinants of Working Capital at Risk. International Journal of Financial Engineering 3: 1–29. [Google Scholar] [CrossRef]
- Eljelly, Abuzar M. A. 2004. Liquidity-profitability tradeoff: An empirical investigation in an emerging market. International Journal of Commerce and Management 14: 48–61. [Google Scholar] [CrossRef]
- Enqvist, Julius, Michael Graham, and Jussi Nikkinen. 2014. The impact of working capital management on firm profitability in different business cycles: Evidence from Finland. Research in International Business and Finance 32: 36–49. [Google Scholar] [CrossRef]
- Flannery, Mark Jeffrey, and Özde Öztekin. 2019. The Effects of Working Capital Balances on Financial Leverage. Available online: https://ssrn.com/abstract=3479180 (accessed on 18 March 2022). [CrossRef]
- Filbeck, Greg, and Thomas M. Krueger. 2005. An analysis of working capital management results across industries. American Journal of Business 20: 11–20. [Google Scholar] [CrossRef]
- Filbeck, Greg, Xin Zhao, and Ryan Knoll. 2017. An analysis of working capital efficiency and shareholder return. Review of Quantitative Finance and Accounting 48: 265–88. [Google Scholar] [CrossRef]
- Gamba, Andrea, and Alexander Triantis. 2008. The value of financial flexibility. The Journal of Finance 63: 2263–96. [Google Scholar] [CrossRef]
- García-Teruel, Pedro Juan, and Pedro Martínez-Solano. 2007. Effects of working capital management on SME profitability. International Journal of Managerial Finance 3: 164–77. [Google Scholar] [CrossRef]
- Gardner, Mona J., Dixie L. Mills, and Ralph A. Pope. 1986. Working capital policy and operating risk: An empirical analysis. Financial Review 21: 31. [Google Scholar] [CrossRef]
- Gentry, James A., R. Vaidyanathan, and Hei Wai Lee. 1990. A weighted cash conversion cycle. Financial Management 19: 90–99. [Google Scholar] [CrossRef]
- Gill, Amarjit, Nahum Biger, and Neil Arun Mathur. 2010. The relationship between working capital management and profitability: Evidence from the United States. Business and Economics Journal 10: 1–9. [Google Scholar]
- Graham, John R., and Campbell R. Harvey. 2001. The theory and practice of corporate finance: Evidence from the field. Journal of Financial Economics 60: 187–243. [Google Scholar] [CrossRef]
- Guragai, Binod, Paul D. Hutchison, and M. Theoore Farris. 2019. Cash-to-Cash (C2C) length: Insights on present and future profitability and liquidity. In Advances in Management Accounting. Bingley: Emerald Publishing Limited. [Google Scholar]
- Gustén, O., and T. Pahkamaa. 2017. Working Capital Efficiency and Firm Profitability—A Quantitative Study of Listed Swedish Firms 2000–15. Unpublished Master thesis, Department of Business Studies, Uppsala University, Uppsala, Sweden. [Google Scholar]
- Hausman, Jerry A., and William E. Taylor. 1981. Panel data and unobservable individual effects. Journal of the Econometrics 16: 1377–98. [Google Scholar] [CrossRef]
- Hausman, Jerry A. 1978. Specification tests in Econometrics. Econometrica 46: 1251–71. [Google Scholar] [CrossRef]
- Hashmi, Syed Danial, Saqib Gulzar, Zeshan Ghafoor, and Iram Naz. 2020. Sensitivity of firm size measures to practices of corporate finance: Evidence from BRICS. Future Business Journal 6: 1–19. [Google Scholar] [CrossRef]
- Howorth, Carole, and Paul Westhead. 2003. The focus of working capital management in UK small firms. Management Accounting Research 14: 94–111. [Google Scholar] [CrossRef]
- Högerle, Bernadette, Michel Charifzadeh, Marlene Ferencz, and Konstantin B. Kostin. 2020. The development of working capital management and its impact on profitability and shareholder value: Evidence from Germany. Strategic Management 25: 27–39. [Google Scholar]
- Jayarathne, T. A. N. R. 2014. Impact of working capital management on profitability: Evidence from listed companies in Sri Lanka. Paper presented at the 3rd International Conference on Management and Economics, Matara, Sri Lanka, February 26–27, vol. 26, pp. 269–74. [Google Scholar]
- Jose, Manuel L., Carol Lancaster, and Jerry L. Stevens. 1996. Corporate returns and cash conversion cycles. Journal of Economics and Finance 20: 33–46. [Google Scholar] [CrossRef]
- Khan, Mohammed Abdul Imran, Shabbir Alam, and Ahsan Jamil Syed. 2021. Correlation between the profitability and working capital practices: A case study in the Gulf Cooperation Council. Journal of Asian Finance, Economics and Business 8: 229–36. [Google Scholar]
- Kim, Moon K., and David A. Burnie. 2002. The Firm Size Effect and the Economic Cycle. The Journal of Financial Research 25: 111–24. [Google Scholar] [CrossRef]
- Lamberson, Morris. 1995. Changes in working capital of small firms in relation to changes in economic activity. American Journal of Business 10: 45–50. [Google Scholar] [CrossRef]
- Lazaridis, Ioannis, and Dimitrios Tryfonidis. 2006. Relationship between working capital management and profitability of listed companies in the Athens stock exchange. Journal of Financial Management and Analysis 19: 26–35. [Google Scholar]
- Luenberger, David G., and Yinyu Ye. 2008. Linear and Nonlinear Programming. Reading: Addison-Wesley, vol. 2. [Google Scholar]
- Mathuva, David. 2010. The Influence of Working Capital Management Components on Corporate Profitability: A Survey on Kenyan Listed Firms. Research Journal of Business Management 4: 1–11. [Google Scholar] [CrossRef]
- Mavropulo, Olena, Marc Steffen Rapp, and Iuliia A. Udoieva. 2021. Value-based management control systems and the dynamics of working capital: Empirical evidence. Management Accounting Research 52: 100740. [Google Scholar] [CrossRef]
- Morshed, Amer. 2020. Role of working capital management in profitability considering the connection between accounting and finance. Asian Journal of Accounting Research 5: 257–67. [Google Scholar] [CrossRef]
- Morrison, Catherine J. 1993. Investment in Capital Assets and Economic Performance: The U.S. Chemicals and Primary-Metals Industries in Transition. Journal of Business and Economic Statistics 11: 45–60. [Google Scholar]
- Moussa, Amr A. 2019. Determinants of working capital behavior: Evidence from Egypt. International Journal of Managerial Finance 15: 39–61. [Google Scholar] [CrossRef]
- Mustilli, Mario, Francesco Campanella, and Eugenio D’Angelo. 2018. Measuring Determinants and Effects of Firm s’ Financial Struct ure in a Deleverage Setting: Evidence From Italy. International Journal of Financial Research 9: 23–30. [Google Scholar] [CrossRef]
- Nazir, Mian Sajid, and Talat Afza. 2009. Impact of Aggressive Working Capital Management Policy on Firms’ Profitability. IUP Journal of Applied Finance 15: 19–30. [Google Scholar]
- Nguyen, Huu Anh, Huong Thanh Pham, and Hang Thu Nguyen. 2020. Impact of working capital management on firm’s profitability: Empirical evidence from Vietnam. The Journal of Asian Finance, Economics and Business 7: 115–25. [Google Scholar] [CrossRef]
- Nobanee, Haitham, Modar Abdullatif, and Maryam AlHajjar. 2011. Cash conversion cycle and firm’s performance of Japanese firms. Asian Review of Accounting 19: 147–56. [Google Scholar] [CrossRef]
- Padachi, Kesseven. 2006. Trends in working capital management and its impact on firms’ performance: An analysis of Mauritian small manufacturing firms. International Review of Business Research Papers 2: 45–58. [Google Scholar]
- Petersen, Mitchell A., and Raghuram G. Rajan. 1997. Trade credit: Theories and evidence. The Review of Financial Studies 10: 661–91. [Google Scholar] [CrossRef]
- Ponsian, Ntui, Kiemi Chrispina, Gwatako Tago, and Halim Mkiibi. 2014. The effect of working capital management on profitability. International Journal of Economics, Finance and Management Sciences 2: 347–55. [Google Scholar] [CrossRef]
- Quandt, Richard E. 1958. The Estimation of the Parameters of a Linear Regression System Obeying Two Separate Regimes. Journal of the American Statistical Association 53: 873–80. [Google Scholar] [CrossRef]
- Raheman, Abdul, and Mohamed Nasr. 2007. Working capital management and profitability–case of Pakistani firms. International Review of Business Research Papers 3: 279–300. [Google Scholar]
- Ramsey, J. B. 1969. Tests for specification errors in classical linear least-squares regression analysis. Journal of the Royal Statistical Society: Series B (Methodological) 31: 350–71. [Google Scholar] [CrossRef]
- Richards, Verlyn D., and Eugene J. Laughlin. 1980. A cash conversion cycle approach to liquidity analysis. Financial Management 9: 32–38. [Google Scholar] [CrossRef]
- Rizky, Ade, and Mega Mayasari. 2018. The Impact of Cash Conversion Cycle on Firm Profitability of Retail Companies. Journal of Applied Accounting and Taxation 3: 73–78. [Google Scholar]
- Sardo, Filipe, and Zélia Serrasqueiro. 2022. Determinants of working capital: Empirical evidence on manufacturing SMEs. Journal of Economic Studies 49: 506–21. [Google Scholar] [CrossRef]
- Sapra, Sunil. 2005. A regression error specification test (RESET) for generalized linear models. Economics Bulletin 3: 1–6. [Google Scholar]
- Sawarni, Kumar Sanjay, Sivasankaran Narayanasamy, and Kanagaraj Ayyalusamy. 2020. Working capital management, firm performance and nature of business: Empirical evidence from India. International Journal of Productivity and Performance Management 70: 179–200. [Google Scholar] [CrossRef]
- Smith, Keith. 1980. Profitability versus liquidity tradeoffs in working capital management. Readings on the Management of Working Capital 42: 549–62. [Google Scholar]
- Soenen, L. A. 1993. Cash conversion cycle and corporate profitability. Journal of cash Management 13: 53–53. [Google Scholar]
- Sougiannis, Theodore, Kuo Chi Chan, Jason Karceski, and Josef Lakonishok. 2008. Balance Sheet Growth and the Predictability of Stock Returns. Working Paper. Champaign: Gies College of Business. [Google Scholar]
- Takon, Samuel Manyo. 2013. Does cash conversion cycle have impact on return on assets of Nigerian firms. Research Journal of Finance and Accounting 4: 34–42. [Google Scholar]
- Thursby, Jerry G. 1979. Alternative specification error tests: A comparative study. Journal of the American Statistical Association 74: 222–25. [Google Scholar] [CrossRef]
- Thursby, Jerry G., and Peter Schmidt. 1977. Some properties of tests for specification error in a linear regression model. Journal of the American Statistical Association 72: 635–41. [Google Scholar] [CrossRef]
- Vavasis, Stephen A. 1991. Nonlinear Optimization: Complexity Issues. Oxford: Oxford University Press, Inc. [Google Scholar]
- Vu Thi, Anh-Huyen, and The-Dong Phung. 2021. Capital Structure, Working Capital, and Governance Quality Affect the Financial Performance of Small and Medium Enterprises in Taiwan. Journal of Risk and Financial Management 14: 381. [Google Scholar] [CrossRef]
- Weinraub, Herbert J., and Sue Visscher. 1998. Industry practice relating to aggressive conservative working capital policies. Journal of Financial and Strategic Decision 11: 11–18. [Google Scholar]
- Wooldridge, Jeffrey M. 2015. Introductory Econometrics: A Modern Approach. Thomson South-Western, International Student Edition. Boston: Cengage. [Google Scholar]
- Yao, Tong, Tong Yu, Ting Zhang, and Shaw Chen. 2011. Asset growth and stock returns: Evidence from Asian financial markets. Pacific-Basin Finance Journal 19: 115–39. [Google Scholar] [CrossRef]
- Yazdanfar, Darush, and Peter Öhman. 2014. The impact of cash conversion cycle on firm profitability: An empirical study based on Swedish data. International Journal of Managerial Finance 10: 442–52. [Google Scholar] [CrossRef]
Disclaimer/Publisher’s Note: The statements, opinions and data contained in all publications are solely those of the individual author(s) and contributor(s) and not of MDPI and/or the editor(s). MDPI and/or the editor(s) disclaim responsibility for any injury to people or property resulting from any ideas, methods, instructions or products referred to in the content. |
© 2023 by the authors. Licensee MDPI, Basel, Switzerland. This article is an open access article distributed under the terms and conditions of the Creative Commons Attribution (CC BY) license (https://creativecommons.org/licenses/by/4.0/).