Abstract
This study aims to investigate the dynamic conditional correlation and volatility spillover between the conventional and Islamic stock markets in developed and emerging countries in order to develop better portfolio and asset allocation strategies. We used both multivariate GARCH (MGARCH) and multi-scales-based maximal overlap discrete wavelet transform (MODWT) approaches to investigate dynamic conditional correlation and volatility spillover between conventional and Islamic stock markets in developed and emerging countries. The results show that conventional and Islamic markets move together in the long run for a specific time horizon and present time-varying volatility and dynamic conditional correlation, while volatility movement changes due to financial catastrophes and market conditions. Further, the findings point out that Chinese conventional and Islamic stock indexes showed higher volatility, whereas Malaysian conventional and Islamic stock indexes showed comparatively lower volatility during the global financial crisis. This study provides fresh insights and practical implications for risk management, asset allocation, and portfolio diversification strategies that evaluate stock market reactions to the crisis in the international avenues of finance literature.
JEL Classification:
G10; G11; G15; G19
1. Introduction
The global financial crisis (GFC) during 2007–2008 was the most turbulent economic event before the COVID-19 pandemic. Apart from these two major crises, there were associated events such as the Eurozone crisis (EZC) during 2010–2012 and the Middle East crisis (MEC) during 2014–2016; these crises have increased the propagation of systematic risk and caused potential risks for the financial markets (Kwan 2020; Mensi et al. 2021; Mensi 2019; OECD 2011). However, the consequences of these major incidents (such as GFC, EZC and MEC) have triggered volatility and increased uncertainty in the global financial markets (Belke et al. 2018; Chau et al. 2014). As a result, fund managers, investors, and policymakers have attempted to understand the reaction to these periods of crisis and, at the same time, they have searched for safe haven markets to buffer their potential losses during crisis periods.
A safe haven market has generally been defined as a place where investors can save their money from sharp losses (Bouri et al. 2020; Shahzad et al. 2019). From the viewpoint of international finance, a safe haven market offers an asset or a set of assets that are associated with a negative, weak correlation compared with other assets or a collection of assets in a particular period (Arif et al. 2021; Ji et al. 2020; Baur and McDermott 2010). Every crisis brings blessings along with its dark sides; however, it is important to remember that nobody can ignore the potential downfalls of financial crises. Banking systems lose customer confidence during crisis periods; moreover, policymakers must rethink how they will maintain the banking system’s stability. Private commercial banks are always in competition with each other and work in a complex business environment. This competition brings a healthy and positive outcome, and often leads to the development of an alternative product line and unique business model or innovation (Akins et al. 2016; Bătrâncea et al. 2008; Su et al. 2021; Tian et al. 2020). The GFC is over; nevertheless, this event is considered to be a bigger game-changer (turning point) for the Islamic finance industry than traditional finance in the context of resilience and reaction to the crisis (Lajis 2017; Yarovaya et al. 2022). After the GFC, Islamic finance has gained in popularity, and the aftermath of the GFC has provided an important catalyst to shed light on Islamic products and services compare to their conventional counterparts. The development of Islamic finance is an important innovation in the modern world (Masih et al. 2018).
The products and services of Islamic finance are appealing and desirable to both Muslim and non-Muslim investors, due to the unique features and regulations of Shariah law (Hassan et al. 2020). Shariah law regulates the Islamic financial market, and the products and services of the Islamic financial markets must pass Shariah screening procedures. According to Shariah law, Riba (interest and usury), Gharar (uncertainty, excessive risk), and Maysir (games of chance) are strongly prohibited and the financial market is free from excessive debt and leverage (Shamsuddin 2014). In addition, Shariah standards provide an ethical framework and boundaries for organizations. Concerning Shariah standards, organizations operating under Shariah law have do not deal with toxic or indecent substances and services (e.g., alcohol, betting, and so forth) (Sahabuddin et al. 2018, 2020). Moreover, as a consequence of Shariah law, the filtration process excludes all organizations and firms that have accumulated severe immense debt from the pool of investible equities. On the other hand, equities are included in the Shariah-compliant investible universe for those business that have passed the screening scrutiny (Rizvi et al. 2015). The different risk-return structures may cause a different reaction pattern between the Shariah and non-Shariah-compliant markets during a crisis period (Saiti and Masih 2016).
Volatility spillover and the reaction to the crisis of the Islamic stock market may be influenced by the mechanism of addition to, and deletion from, the indexes, which is known as the Shariah filtering process or Shariah screening criteria. Additions to and deletions from criteria give positive and negative perceptions, respectively, to investors, which help decision-making regarding their portfolios. However, a positive perception is currently being enjoyed by the Islamic index and may have been augmented during the financial crisis period. In addition, the existing literature has demonstrated that the Islamic indexes and Islamic Banking Systems (IBs) have better financial performance ratings and resilience than their conventional counterparts during financial crises (Ho et al. 2014; Farooq and Zaheer 2015).
Therefore, despite the increasing importance of performance in Islamic stock markets over the last few years, the reaction to the crisis or volatility spillover of Islamic and conventional stock markets has created considerable attention to the literature exploring the financial market. In this context, most of the researchers have investigated the dynamic conditional correlation and volatility spillover effect between conventional and Islamic stock using time-varying based GARCH (1, 1), TGARCH, and MGARCH-DCC methods (Hassan et al. 2019; Shahzad et al. 2019; Rejeb 2017; Saiti and Noordin 2018). A handful of studies have focused on time and frequency-based MGARCH (DCC) and MODWT-based variance approaches (Hassan et al. 2020; Yildirim et al. 2018).
This study aims to investigate the dynamic conditional correlation and volatility spillover between the conventional and Islamic stock markets in developed and emerging countries in order to make better portfolio and asset allocation decisions. This study is able to contribute fresh insights; first, this study fills the knowledge gap for portfolio implications in the dynamic business environment. Although conditional correlation and volatility spillover between conventional and Islamic stock markets are significant topics in international finance, this study ignores extensively dynamic and different scales (frequencies)-based linkages in developed and emerging nations. Instead, this study is focused on investigating the dynamic linkages between conventional and Islamic stock markets in developed and emerging countries (Chowdhury et al. 2022; Hassan et al. 2020). Moreover, this study makes a distinctive contribution to the existing literature in the context of time-varying and scale or frequency-dependent correlation and volatility spillover between conventional and Islamic stock markets. Particularly, this study can find better portfolio opportunities for a different set of investors bearing different investment horizons (Abdullah et al. 2016).
Second, in most cases, previous studies have employed traditional time-domain techniques such as co-integration, correlation analysis, simple linear causality test, and GARCH (1,1) models to capture the dynamic conditional correlation and volatility spillover in time-domain properties. In this regard, financial fund managers and investors are unable to discover whether a significantly higher (lower) correlation is observed within a certain range of investment horizons in scale or frequency domain perspectives. Therefore, we apply MGARCH-DCC and MODWT-based variance approaches to address dynamic and time-frequency connectivity in cross-country stock markets in order to make sound investment decisions (Liow et al. 2019a, 2019b).
Finally, this study provides important interconnections and practical implications for risk-returns and trade-offs using assets allocation and portfolio diversification strategies that have evaluated stock market reactions to financial crises in the international avenues of finance literature. In particular, the GFC of 2007–2008 and the COVID-19 pandemic have seriously affected the movement of the global financial market, and this trend has pushed investors to restructure their portfolios with alternative and safe haven assets to minimize risk and loss (Hemche et al. 2016; Karanasos et al. 2014; Yousaf et al. 2022; Yarovaya et al. 2022). Among the different asset classes, Islamic stocks are very popular among Muslim and non-Muslim investors, and the stocks play an immense role as viable and alternate financial assets that can help minimize risk and better hedge opportunities (Raza et al. 2019).
The present study employs multivariate GARCH and multi-solution-based maximal overlap discrete wavelet transform (MODWT) approaches under dynamic conditional correlation criteria to measure the dynamic connection and volatility spillover between the conventional and Islamic stock markets in developed and emerging countries. This approach allows us to develop a suitable way to explain returns under a conditional correlation environment between two markets (Engle 2002). Moreover, this study also offers robust outcomes that can be implemented under dynamic circumstances (Basher and Sadorsky 2016; Robiyanto et al. 2021).
The results from the conditional correlation and dynamic conditional correlation analysis confirm that the Bursa Malaysia Hijrah Shariah index has the least volatility, while the China Shariah-based index has the highest volatility. Notably, the United States (US) Shariah market has a lower correlation, along with Chinese, Malaysian, and Japanese Shariah and non-Shariah-based markets. The highest positive correlation was between UK Shariah and non-Shariah-based markets. In the most recent financial crisis, the Chinese Shariah-compliant stock index showed the highest volatility, but this trend has significantly declined in the long run. In a nutshell, the dynamic conditional correlation analysis reports that volatility is time-varying and the selected stock markets have moved closely together over the long run.
The linkages between conventional and Islamic stock markets are confirmed to be time-varying dependent and they manage to maintain heterogeneity in different investment horizons. This may be due to ethical considerations and behavioral differences. For example, short-run investors expect more returns in the short-term investment horizon. On the other hand, long-term investors focus on strategic investment movement (Liow et al. 2019b).
2. Literature Review
For this study, we chose to concentrate on reviewing the related current literature for investigating the dynamic conditional correlation and volatility spillover between conventional and Islamic stock markets during crisis periods. First, the review starts with the conceptual perspectives and represents the empirical pieces of evidence of the reaction to the financial crisis of Islamic and conventional stock markets in selected developed and emerging countries. There is no standard way to explain the stock market reaction during the crisis periods. The concept is generally defined as a sharp decline in the prices of the stock market index due to changes in the world order. The reaction of the stock market to the crisis has an abrupt impact on national economies, as well as on investors’ behavior. For example, for the global financial crisis, the European debt crisis, and COVID-19 pandemic crisis Rizvi et al. (2015) investigated the exposure impacts of financial contagion in the Asia Pacific region. This study detected the waves of exposures in relation to the fundamental or pure base contagion for the Islamic stock markets. Researchers were able to point out a valid question, which is how the crisis impacts and increases volatility during periods of turmoil. This study is in line with a prior study done by Dewandaru et al. (2014), which provides further attempts at improvement strategies. They found that the shocks to the financial market are transmitted through extreme linkages; nevertheless, the latest subprime crisis revealed fundamentals-based contagion in the markets. Luchtenberg and Vu (2015) examined contagion effects during the GFC from a global perspective using an international sample of returns from 2003 to 2009. The evidence indicates that cross-market linkages increase in different financial markets when uni-directional and bi-directional contagions are considered after controlling for crisis-related volatility.
Unlike previous crises, contagion effects followed the GFC of 2007–2008. However, the GFC is not confined to emerging markets, since the USA financial market and other matured financial markets in the sample also transmit and receive contagions. Homapour et al. and Zhang et al. created variables that represent relative changes in the global economy before and during the crisis; these variables influence economic fundamentals—such as inflation rates, trade structure, industrial production, interest rates, and regional effects—and investors’ risk aversion, with both contributing to international contagion (Homapour et al. 2022; Zhang et al. 2022). Hoque et al. (2016) determined the relationship between Islamic and conventional equity market movements during and after the financial crisis using evidence from MSCI family indexes. They explained their theoretical underpinning, which is based on fundamental, category, and habitant theorems, and employed the Beveridge Nelson (BN) time-series decomposition technique. The findings revealed that there are fundamental differences between Islamic and conventional stocks in terms of market microstructure and screening criteria. The results further showed that both markets move together, and a long-standing relationship has evolved.
Moreover, Islamic stock markets should show lower volatility, due to the lower leverage ratio. Surprisingly, Islamic stock markets show more volatility during crisis periods but less volatility during post-crisis periods, with volatility being more evident in the permanent part than in the market’s transitory part. Wang et al. (2017) tested the stock market’s contagion during the financial crisis period by utilizing multiscale correlation techniques. They covered developed countries such as the USA and the other six members of the Group of Seven (G7)—Canada, France, Germany, Italy, Japan, and the UK—as well as emerging economies such as the BRIC countries. The results revealed that cross-market correlations between the USA and other selected countries are conditioned on the time scale. Further, the evidence showed that stock market contagion during the GFC is dependent on both the recipient country and the time scale, e.g., contagion from the USA to Japan, China, and Brazil occurs when the time scale is longer than 50 days or more.
There are numerous studies that have been carried out on the issue of stock market stability during crisis periods from the perspective of conventional stock markets. Nevertheless, from a comparative perspective, these studies remain rather scarce, and the results obtained from studies that have been conducted on the reactions to the crisis of conventional and Islamic stock markets in developed and emerging countries are still inconclusive. Therefore, this study employs a multivariate GARCH approach under dynamic conditional correlation criteria to measure the dynamic connection between conventional and Islamic stock markets in developed and emerging countries. This approach produces a suitable way to explain returns between two markets in a conditional correlation environment (Engle 2002). Moreover, this approach is also suitable for dynamic circumstances and offers robust evidence for measuring conditional correlation and volatility spillover between conventional and Islamic stocks in developed and emerging countries (Basher and Sadorsky 2016; Robiyanto et al. 2021).
Finally, most prior studies have used traditional approaches such as GARCH (1, 1). This approach is based on a bi-variate ahistorical covariance matrix and unconditional static manner. It has a drawback in the sense that the unconditional static manner approach cannot measure risk exposures accurately. Given this limitation, the dynamic behavior of covariance is crucial to understanding the risk-return chemistry between Sharia-compliant and conventional stock markets. To overcome this problem, the present study utilizes a MGARCH-DCC technique. This technique is noteworthy for its dynamic characteristics that can change the first moment (mean) and the second moment (variances) over time. Mainly, the MGARCH-DCC model allows researchers to understand how correlation and volatility change and when they would be weak or strong over time in financial markets. Therefore, this model is ideal for identifying possible benefits of diversifications, structural changes, and reactions to the financial crisis between financial assets (Aas and Berg 2009; Righi and Ceretta 2011; Kılıç et al. 2022). In a nutshell, this study makes a distinctive contribution to extending the existing literature in the context of time-varying and scale or frequency-dependent correlation and volatility spillover between conventional and Islamic stock markets. In particular, this study is able to identify better portfolio opportunities for different sets of investors bearing different investment horizons (Abdullah et al. 2016).
3. Data and Methodology
3.1. Data
Data for this study were collected from the selected developed and emerging countries. Daily closing prices were chosen and the time span was taken from 26 October 2007 until 7 June 2018. Due to dual availability and market capitalization, these variables were selected in both conventional and Islamic stock markets, which examine the dynamic conditional correlation and volatility spillover for making better investment decisions. All data were obtained from DataStream.
3.2. Sample Countries
This study examines dynamic conditional correlation and volatility spillover between three developed nations (the USA, the UK, and Japan) and three developing nations (Malaysia, Indonesia, and China). The USA, UK, and Japan have consistently contributed over 75% of global stock market capitalization. Based on market capitalization, the USA is the largest, Japan is the third largest, China is the fourth largest, and the UK is the sixth largest capital market economy globally. Malaysia is the top fifth and Indonesia is the third performer in 2018 amongst seventeen regional indexes in terms of returns (Bloomberg 2018a). Further, in terms of overall market development, Malaysia reached a new height and maintained the top IF market in the world (IFDI 2018). Indonesia being the largest Muslim-populated country in the world and a topmost competitor in the IF markets is ramping up efforts to move to the front ahead of regional players such as Malaysia and other markets. Due to their substantial growth, Islamic stock markets are a part of mainstream markets. Therefore, most of the developed and developing countries have a pairwise stocks index (conventional and Islamic) and both indexes move together over time.
These stock markets cover the three major regions (Asia, Europe, and America) in the world, which is shown in Figure 1.
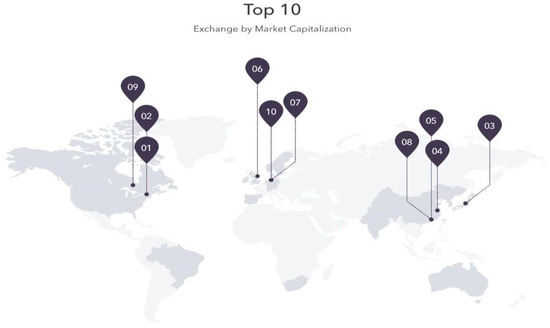
Figure 1.
World top stock exchange by market capitalization. Source: Bloomberg (2018b) and Value Walk (2018).
3.3. List of Countries and Stock Market Indexes
Along with the mainstream indexes, several Muslim and non-Muslim countries have launched Shariah-based indexes to meet the demand for Islamic finance products and services. Table 1 presents the selected list of variables for this study. Dow Jones is one of the largest index provider companies in the world. They launched the DJIMI in 1999. FTSE is the second-largest index provider in the world. They launched their indexes at the London stock exchange in 1999. The S&P (Standard and Poor) is another large index provider and they established Shariah indexes in 2006. Consequently, many developed and emerging countries such as Japan, China, and Indonesia have sought to cater to the demand for benchmark Shariah products in those regions.

Table 1.
lists of variables.
Where USDJII indicates the USA Dow Jones composite index, UKDJII indicates the UK Dow Jones Islamic index, UKFTSE indicates the UK FTSE composite index, JPNSI indicates Japan Shariah-compliant stock index, TOPIX indicates the Tokyo stock exchange composite index, BMHJSI indicates the Bursa Malaysia Hijara Shariah index, BMKLCI indicates the Bursa Malaysia composite index, JII indicates the t Jakarta Islamic index, IDX indicates the Indonesia composite index, CHSI indicates the China Shariah index, and SSEC indicates the Shanghai stock exchange composite index, respectively (El Amri and Hamza 2017).
3.4. Model Specification
The present study specified its model using the stock price return form. The return form of data is expressed in natural logarithm criteria as the percentage by multiplying by 100. Hence, the popular return transformation process is applied, such as the present day’s stock index prices (Pt) divided by the previous days’ prices (Pt−1). The return form formula is as follows:
Here, Rt denotes the stock return index, and Pt and Pt−1 indicate the present day and previous days’ stock prices, respectively. Missing data and time differences due to bank and public holidays, or for any other reason, in different markets are adjusted to the previous day’s prices. In accordance with the findings of Chiang et al. (2007), it was assumed that the previous day’s prices remain unchanged, and they should stay the same as the previous day’s prices. Investors are very much concerned with risk diversification in the avenue of international financial markets. In order to diversify their risks, they want to know the reactions to the markets. Therefore, it is essential to identify the multivariate relationships among variables. Hence, we apply an advanced MGARCH technique from the GARCH family model to measure dynamic multivariate relationships among the different stock markets.
The multivariate GARCH-DCC model was developed by Engle (2002) and was employed in our study to estimate time-varying correlation and volatilities. We used the MGARCH-DCC model to investigate the dynamic conditional correlation and volatility spillover between conventional and Islamic stock markets. This method is commonly applied to estimate dynamic conditional correlation and volatility spillover effects among variables. Moreover, it can overcome the drawback of dimensionality by decomposing the conditional covariance matrix into conditional correlations and standard deviations; therefore, the GARCH family models are suitable (Pham 2019; Zhang and Yan 2020), and we apply the MGARCH-DCC model in this study to investigate the dynamic conditional correlation between conventional and Islamic stock markets.
This model has two steps of estimation, conditional variance estimation and time-varying correlation estimation. For the Univariate GARCH (1, 1) model:
where , , the ARCH effect which is observed for the shocks to return X in the short-term holding period, holding period, and K presents the number of assets.
The second step estimation is the dynamic conditional correlation between asset returns using the DCC formula, which is as follows:
where Ht represents multivariate conditional correlation and Dt exhibits a K × K matrix, respectively, of conditional time-varying standardized residual εt, which originated from the univariate GARCH model. The first GARCH (1, 1) model is:
where a symmetric positive decisive matrix is exhibited, having on its diagonals such that I = 1, 2, …, K.
Ht = Dt Rt Dt
Rt = Qt*−1QtQt*−1, where Rt indicates an off-diagonal time-varying correlation matrix.
Hence, Qt* indicates the diagonal matrix with on the square root of the diagonal elements of Qt.
Wavelet-based decomposition of time series data is very popular and provides wide-range implications in time-frequency domain properties. This technique decomposes the time series data into different time and scale or frequency bands. Interestingly, each time and scale exhibits a series of progressive or smoothed segments. For example, the highest time and scales indicate a lower frequency; on the other hand, the lowest time and scales indicate a higher frequency domain.
The discrete wavelet transform (DWT) is defined by Reboredo et al. (2017) and the equation is as follows:
Hence, and present two basic functions, which are popularly known as father and mother wavelet transformations, respectively. The father wavelet signifies the low frequency (smooth) while the mother wavelet characterizes the high frequency (detailed) component of the time series. In addition, the father wavelets are applied to the trend parts and the mother wavelets are used to calculate deviations obtained from trends (Tiwari et al. 2013). The coefficients sj,k and dj.k, …, d1 stand for wavelet transform coefficients which quantify the contribution of respective wavelet functions to the whole signal. Hence, using J-level multi-resolution decomposition analysis, a time series y(t) can be written in the form of signals as:
where, Dj represents the components of frequency of short, medium, or long-term deviations explained by shocks from time scales of 2j, and Sj stands for residuals once D1, …, Dj are removed from the original time series.
4. Empirical Results
4.1. Preliminary Analysis
Figure 2 shows the price movement among the variables. The price movement is expressed in local currencies. Preliminary, daily closing prices are abstracted from the respective conventional and Islamic stock indexes. The price movement shows positive momentum during the study period. The advantages of daily stock prices are such that we can easily convert data into natural logarithms and return forms. We also reduced observed skewness from the distribution of data (Bora and Basistha 2021).
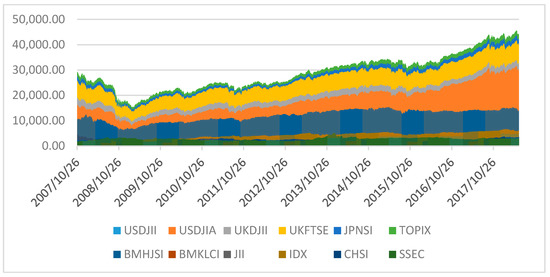
Figure 2.
Stock prices performance.
4.2. Stock Prices Return Movement
Figure 3 shows the plotted return movement. Time series data are used in a log for the stock price return movement to examine the characteristics among the variables. The results show that the stock price return movement is volatile, and volatility dominates during the GFC of 2007–2008. These stock return indexes are calculated by the first difference of the natural logarithms form of each stock-price index and expressed as percentages (multiplied by 100). Interestingly, the trend of return indexes showed that they move together and maintain a similar type of movement tendency.
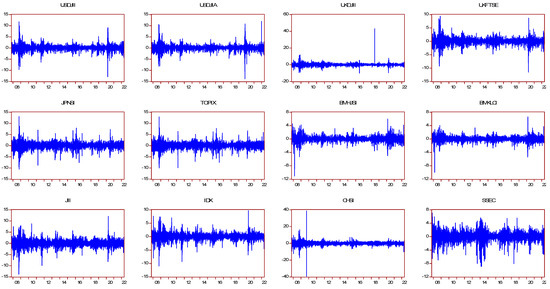
Figure 3.
Stock price return movement.
4.3. Summary of Descriptive Statistics
Table 2 shows a summary of the descriptive statistics for the return series. The highest and the lowest average value exhibits were for the USA and the UK, respectively. Interestingly, the UK led China by its average value of the Islamic stock index perspectives. However, the average value of JII was reportedly better than the BMHJSI stock return. Standard deviation displays absolute variability (time-dependent) for the return series, which was larger than the Chinese economy in conventional and Islamic stock markets. On the other hand, Bursa Malaysia’s conventional and Islamic stock indexes showed weak volatility (less riskiness) among variables. Skewness is a vital movement of any distribution; it expresses the symmetry and asymmetry of a distribution. Zero and positive skewness imply symmetrical and asymmetrical distribution, respectively. The results prove that the distribution of all variables is negatively skewed. This indicates a symmetrical effect that leads to relatively higher volatility. Kurtosis, on the other hand, measures the fatness for any distribution. It can also be used to measure the normal distribution. In addition, it shows how data concentrates around data and belong to the mean distribution. The standard value for normal distribution is three, which refers to neither flat (platykurtic) nor peaked (leptokurtic). The evidence shows that the price distribution is leptokurtic for both stock indexes.
Table 2.
Summary of the descriptive statistics.
This study applied augmented Dickey–Fuller–ADF (Dickey and Fuller 1979) and Phillips–Perron–PP (Phillips and Perron 1988) tests to address the stationary data issue (Appendix A). The empirical results show that not all variables meet the stationary criteria at the level and intercept; therefore, we first ran the data at the difference and intercept levels, and the results showed that all variables are stationary at the first difference and intercept level, with a 5% significant criteria. Finally, we used the decomposed-based wavelet MODWT and MGARCH-DCC methods, which overcome the structural break problem of time series data (Sakti et al. 2018).
4.4. Multivariate Generalized Autoregressive Conditional Heteroscedastic-Dynamic Conditional Correlation (MGARCH-DCC) Analysis
This study employed the multivariate GARCH model for investigating the reaction to crises using DCC. This technique has better application when comparing the pliability and stability using t-distribution in multivariate properties. Particularly, to fit the tailed landscape for the distribution of stock returns and risk assessment measuring, the DCC is suitable for a portfolio comparing the performance of conventional and Islamic stock markets in developed and emerging countries. However, it is more rational to apply the MGARCH-DCC approach to fit in the fat-tailed nature of the distribution of stock returns using multivariate t-distribution, specifically for risk assessments involving the tail properties of yield distribution. Therefore, this study attempts to use this latest model in sorting out our research objectives to investigate the reaction to the crisis of Shariah and non-Shariah compliant market indexes in developed and developing countries. The results of Gaussian-DCC and t-DCC models are reported in Table 3. This is the initial stage for determining the optimum model. From the maximum log-likelihood estimation, the Gaussian-DCC and t-DCC models are both statistically significant. Hence, the maximum log-likelihood value of t-DCC is greater (−26,672.4) than the Gaussian-DCC model (−28,090.1). Moreover, the estimated degrees of freedom for the t-normal distribution are below 30; therefore, these results suggest that the t-distribution is a more appropriate model for capturing the fat-tailed nature of the distribution of the stock returns.
Table 3.
Normal DCC model for maximum likelihood estimation.
Table 4 illustrates the optimum volatility parameters, which in turn indicate that volatility gradually decays. This means that the riskiness involved in the returns gradually cancels out following a shock in the market. However, after adding Lambda1 (λ1) for the USDJII and Lambda1 (λ2) for the USDJII {(0.91013 + 0.74382) = 0.984512} with other remaining indexes, the results of the summation are still less than 1. This result indicates that the volatility of the USDJII return is not following the Integrated Generalized Auto-Regressive Conditional Heteroscedasticity in the same manner as the other stock indexes’ return. Thus, these findings indicate that the shocks to the volatility are not permanent. Due to this implication, investors and portfolio managers may have a high chance of losing their investments even if they make high profits in the short run. On the other hand, speculators would welcome such conditions as favorable to their interests.
Table 4.
t-DCC model for maximum likelihood estimation.
4.5. Dynamic Conditional Volatility Estimation for Developed and Emerging Countries
Figure 3 shows the time-varying movement of dynamic conditional volatilities for the USA, the UK, Japan, Malaysia Indonesia, and China composites, as well as for the Islamic stock indexes. This graphic presentation shows how the dynamic conditional volatilities of all indexes move closely together, except for the China Shariah index. High volatility was observed in the Chinese Shariah index returns during the period 2007–2009 due to the global crisis. However, during the post-crisis period, the volatility of the Chinese Shariah-compliant stock index has significantly declined.
Conditional volatility properties from the perspectives of developed countries are illustrated in Figure 4. Both conventional and Islamic stock markets present time-varying volatility and conditional correlation via the MGARCH-DCC estimations. The results show that all developed markets move together in the long run; however, in specific time horizons, the movement of volatility changes due to financial catastrophe. For example, during the GFC of 2007–2008, the USA conventional index shows more volatility, and it was followed by the UK composite and UK Islamic-based stock markets.
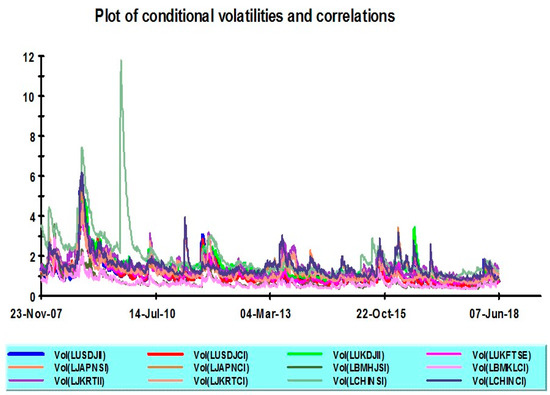
Figure 4.
Conditional volatility.
Figure 5 and Figure 6 show conditional volatility properties from the perspective of developed and emerging countries. Both conventional and Islamic stock markets present time-varying volatility and conditional correlation via the MGARCH-DCC estimations. The results show that the markets of developing and emerging both countries move together in the long run; however, in specific time horizons, the movement of volatility changes due to financial catastrophe. For example, during the GFC of 2007–2008, the China Shariah and conventional indexes show more volatility. On the other hand, Malaysia’s Shariah and composite indexes show more stability and resilience in the GFC of 2007–2008.
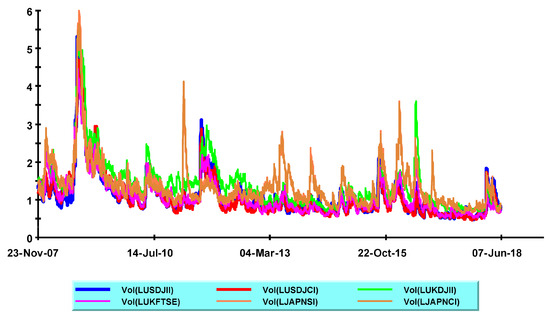
Figure 5.
Conditional volatility in developed markets.
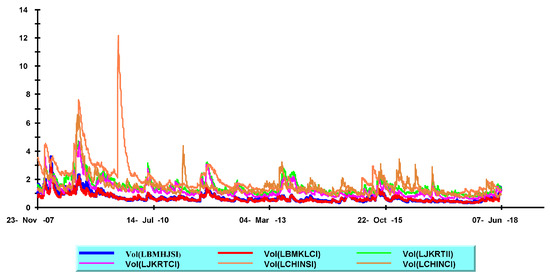
Figure 6.
Conditional volatility in emerging markets.
4.6. Robustness Check
4.6.1. Robustness Check Using Dynamic Volatility and Unconditional Correlation Analysis
Table 5 presents the unconditional correlation and dynamic volatilities of the indexes. The on-diagonal value indicates the dynamic volatility among the variables. The off-diagonal value marks the unconditional correlation between the two indexes’ returns. If the value of unconditional volatility is near zero, this could indicate that the particular index is less risky (volatility) whereas if the unconditional volatility is near 1 and above, this could indicate higher risk (higher volatility levels).
Table 5.
Dynamic volatility and correlation analysis.
The results demonstrate that the Malaysian Shariah-based equity index (BMHJSI) and traditional-based composite index (BMKLCI) have secured the lowest (0.70) volatility, while the China Shariah-based index has shown the highest (2.18) volatility. On the other hand, the US Islamic market has the highest correlation with the UK Islamic and composite-based markets, whereas Japanese, Malaysian, and Chinese markets show the least correlation. This finding is in line with a prior study conducted by Naseri et al. (2017). The researchers suggest that due to the practice of Shariah law and the presence of a strong regulatory body, the Malaysian stock market is a suitable hub for developed countries’ investors. The Chinese-based Shariah stock market, however, is still immature and struggling to develop a legislative framework for Islamic finance (ADB 2022).
4.6.2. The Maximal Overlap Discrete Wavelet Transform (MODWT)
The MODWT is a multi-scales-based approach that can overcome the restriction of 2j for determining sample size. It contains detailed (mother) and smooth (father) wavelet concepts and transforms or decomposes data into an algorithm pyramid form. The key advantage of this approach is to transform non-orthogonal data in a variant form without changing the pattern of coefficients (Masset 2015; Rhif et al. 2019). Moreover, MODWT-based wavelet variance has a standard and robust analytical framework that substitutes the notion of variability between two variables over definite time and scales.
Table 6 depicts the results of variance decompositions for all stock indexes. Higher frequencies or scales are related to the short-term holding periods and lower frequency bands and are present in the long-term holding periods. The evidence indicates that d1-d3 expresses the 1–2 days, 2–4 days, and 4–8 days’ scales and these band scales confirm the short-term holding or investment horizons. Similarly, d4-d5 exhibits 16–32 days and 32–64 days’ band scales and confirm the mid-term holding period. Lastly, d6-d8 presents a long holding period with 128–256 days and above 256 days’ band scales (Bhuiyan et al. 2019). The findings of variance decompositions between conventional and Islamic stock indexes increase or decrease depending on market conditions throughout the scales, however, this trend will converge in the long run. For example, the Islamic stock index in the USA exhibits the lowest volatility in all band scales, while experiences are the opposite. In addition, the Japanese Islamic stock index shows lower decomposed variance at the mid-term (d5–d6 band scales) and long-term (d7–d8 band scales) holding periods, while the Chinese Islamic stock index experiences higher volatility than other markets. Interestingly, both of Malaysia’s stock indexes (Islamic and conventional) show relatively less volatility than other indexes. Particularly, the Malaysia Islamic stock index provides the lowest variance in the long-run investment horizon at the d7–d8 band scale. However, the variance of stock price return increases sharply during global crisis periods at the d1–d2 band scales.
Table 6.
MODWT variance decomposition analysis.
5. Conclusions
The results from the conditional correlation and dynamic conditional correlation analysis confirm that the Bursa Malaysia Hijrah Shariah index has the least volatility, while the China Shariah-based index has the highest volatility. Notably, the United States (US) Shariah market has a lower correlation with Chinese, Malaysian, and Japanese Shariah and non-Shariah-based markets. The highest positive correlation was between UK Shariah and non-Shariah-based markets.
All findings conveyed several insights regarding the policy implications of this study. First, investors can choose alternative investment horizons in different characterized products, which may offer portfolio gains. Further, the findings of this study have confirmed that Shariah and non-Shariah based markets are not out-of-the-way, whether in developed or emerging countries. Interdependency and levels of reaction to crises differ from country to country in accordance with their product variation, financial strengths, and trade openness. Therefore, this study uncovers important consequences and practical implications for the risk assessment, asset allocation, and diversification of funds in different asset lines during crisis periods. Second, fund managers can take appropriate steps for assessing the market movement in international avenues. Because of this, portfolio strategy and its success depend on better understanding the market correlation in dynamic ways (Sharma and Seth 2012). Third, financial institutions, policymakers, and monetary authorities should take proper steps to revise the provision and movement of funds for economic development and growth. In particular, they should be more cautious about selecting investable asset classes and making investment decisions when a financial crisis occurs, and investors and financial fund managers can consider the dynamic time-frequency varying correlation movement when making these decisions.
Moreover, MODWT-based wavelet variance decomposition analysis provides novel and robust findings that substitute the notion of variability between two variables over definite scales. The findings of variance decompositions between conventional and Islamic stock indexes increase or decrease depending on market conditions throughout the scales, however, this trend will converge in the long run. For example, the Islamic stock index in the USA exhibits the lowest volatility in all band scales, while experiences are the opposite. In addition, the Japanese Islamic stock index shows lower decomposed variance at the mid-term (d5–d6 band scales) and long-term (d7–d8 band scales) holding periods, while the Chinese Islamic stock index experiences higher volatility than other markets. Interestingly, both Malaysian stock indexes (Islamic and conventional) show relatively less volatility than other indexes. Particularly, the Malaysia Islamic stock index provides the lowest variance in the long-run investment horizon at the d7–d8 band scale. However, the variance of stock price return increases sharply during global crisis periods at the d1–d2 band scales.
Finally, one of the theoretical implications for researchers and academics is why the stock market reaction has contained features that are distinct from other concepts such as stock market integration, and how this adds value to the financial literature. Particularly, as a novel technique, the MGARCH-DCC approach provides more insights than other GARCH family analysis methods and resolves the drawbacks of standard time series techniques. Therefore, this study employs a multivariate GARCH approach under dynamic conditional correlation criteria to measure the dynamic connection between the conventional and Islamic stock markets in developed and emerging countries. This allows us to develop a suitable way to explain returns under a conditional correlation environment between two markets (Engle 2002). Moreover, this study also offers robust outcomes that can be implemented under dynamic circumstances (Basher and Sadorsky 2016; Robiyanto et al. 2021).
The limitation of this study is the period constraint. Future studies can investigate the conditional correlation and dynamic conditional correlation by using the latest datasets, including COVID-19 impact data. Further studies may also explore the dynamic connectedness between different indexes by employing a novel approach such as the DCC-GARCH-based dynamic connectedness approach (Zhang et al. 2022).
Author Contributions
M.S.: Conceptualization, writing—original draft preparation, Methodology, M.A.I.: Methodology, Software, formal analysis, M.I.T.: Conceptualization, writing—original draft preparation, critical revision. M.K.A.: Study design and concept, data interpretation, drafting, L.N.D.: methodology, data analysis, supervision, I.I.M.: Project administration, Supervision. All authors have read and agreed to the published version of the manuscript.
Funding
This research received no external funding.
Data Availability Statement
Data will be given based on a responsible request.
Acknowledgments
The authors would like to thank the anonymous reviewers for their sound comments. We also extend our thanks to the academic editor and the editorial team.
Conflicts of Interest
The authors declare no conflict of interest.
Appendix A
| Country Index | p-Value | |
| ADF | PP | |
| Level and Intercept | ||
| USDJII | 0.9945 | 0.9960 |
| USDJCI | 0.9914 | 0.9923 |
| UKDJII | 0.015 | 0.0275 |
| UKFTSE | 0.7338 | 0.7818 |
| JAPNSI | 0.8282 | 0.8583 |
| TOPIX | 0.7840 | 0.8106 |
| BMHJSI | 0.7952 | 0.7882 |
| BMKLCI | 0.7742 | 0.7863 |
| JII | 0.6677 | 0.7049 |
| IDX | 0.8902 | 0.8929 |
| CHSI | 0.0012 | 0.0012 |
| SHCICH | 0.9045 | 0.9133 |
| First difference and intercept | ||
| ∆USDJII | 0.0000 | 0.0001 |
| ∆USDJCI | 0.0000 | 0.0001 |
| ∆UKDJII | 0.0001 | 0.0001 |
| ∆UKFTSE | 0.0001 | 0.0001 |
| ∆JAPNSI | 0.0001 | 0.0001 |
| ∆TOPIX | 0.0001 | 0.0001 |
| ∆BMHJSI | 0.0001 | 0.0001 |
| ∆BMKLCI | 0.0001 | 0.0001 |
| ∆JII | 0.0000 | 0.0001 |
| ∆IDX | 0.0000 | 0.0001 |
| ∆CHSI | 0.0001 | 0.0001 |
| ∆SHCICH | 0.0001 | 0.0001 |
| Source: The author’s own calculation using the statistical tools Eviews10. Note: ADF and PP. Both tests assume that null hypothesis of non-stationarity against the alternative hypothesis of stationarity at a 5% significance level. | ||
References
- Aas, Kjersti, and Daniel Berg. 2009. Models for construction of multivariate dependence—A comparison study. The European Journal of Finance 15: 639–59. [Google Scholar] [CrossRef]
- Abdullah, Ahmad Monir, Buerhan Saiti, and Mansur Masih. 2016. The impact of crude oil price on Islamic stock indices of South East Asian countries: Evidence from MGARCH-DCC and wavelet approaches. Borsa Istanbul Review 16: 219–32. [Google Scholar] [CrossRef]
- ADB. 2022. Available online: https://www.adb.org/what-we-do/sectors/finance/islamic-finance#accordion-0-8 (accessed on 11 August 2022).
- Akins, Brian, Lynn Li, Jeffrey Ng, and Tjomme O. Rusticus. 2016. Bank competition and financial stability: Evidence from the financial crisis. Journal of Financial and Quantitative Analysis 51: 1–28. [Google Scholar] [CrossRef]
- Arif, Muhammad, Muhammad Abubakr Naeem, Mudassar Hasan, Suha M Alawi, and Farhad Taghizadeh-Hesary. 2021. Pandemic crisis versus global financial crisis: Are Islamic stocks a safe-haven for G7 markets? Economic Research-Ekonomska Istraživanja 35: 1707–33. [Google Scholar] [CrossRef]
- Basher, Syed Abul, and Perry Sadorsky. 2016. Hedging emerging market stock prices with oil, gold, VIX, and bonds: A comparison between DCC, ADCC and GO-GARCH. Energy Economics 54: 235–47. [Google Scholar] [CrossRef]
- Bătrâncea, L. M., I. Bătrâncea, and A. Moscviciov. 2008. The analysis of the banking liquidity risk. Journal of International Business and Economics, International Academy of Business and Economics, 111–23. [Google Scholar]
- Baur, Dirk G., and Thomas K. McDermott. 2010. Is gold a safe haven? International evidence. Journal of Banking and Finance 34: 1886–98. [Google Scholar] [CrossRef]
- Belke, Ansgar, Irina Dubova, and Thomas Osowski. 2018. Policy uncertainty and international financial markets: The case of Brexit. Applied Economics 50: 3752–70. [Google Scholar] [CrossRef]
- Bhuiyan, Rubaiyat Ahsan, Maya Puspa Rahman, Buerhan Saiti, and Gairuzazmi Bin Mat Ghani. 2019. Does the Malaysian Sovereign sukuk market offer portfolio diversification opportunities for global fixed-income investors? Evidence from wavelet coherence and multivariate-GARCH analyses. The North American Journal of Economics and Finance 47: 675–87. [Google Scholar] [CrossRef]
- Bloomberg, Jason. 2018a. Digitization, digitalization, and digital transformation: Confuse them at your peril. Forbes 28: 2019. [Google Scholar]
- Bloomberg. 2018b. Available online: https://www.bloomberg.com/news/articles/2018-04-26/asia-s-top-stockmarket-of-2018-set-to-be-world-s-worst-in-april (accessed on 1 January 2023).
- Bora, Debakshi, and Daisy Basistha. 2021. The outbreak of COVID-19 pandemic and its impact on stock market volatility: Evidence from a worst-affected economy. Journal of Public Affairs 21: e2623. [Google Scholar] [CrossRef]
- Bouri, Elie, Syed Jawad Hussain Shahzad, David Roubaud, Ladislav Kristoufek, and Brian Lucey. 2020. Bitcoin, gold, and commodities as safe havens for stocks: New insight through wavelet analysis. The Quarterly Review of Economics and Finance 77: 156–64. [Google Scholar] [CrossRef]
- Chau, Frankie, Rataporn Deesomsak, and Jun Wang. 2014. Political uncertainty and stock market volatility in the Middle East and North African (MENA) countries. Journal of International Financial Markets, Institutions and Money 28: 1–19. [Google Scholar] [CrossRef]
- Chiang, Thomas C., Bang Nam Jeon, and Huimin Li. 2007. Dynamic correlation analysis of financial contagion: Evidence from Asian markets. Journal of International Money and Finance 26: 1206–28. [Google Scholar] [CrossRef]
- Chowdhury, Emon Kalyan, Bablu Kumar Dhar, and Alessandro Stasi. 2022. Volatility of the US stock market and business strategy during COVID-19. Business Strategy & Development 5: 350–60. [Google Scholar]
- Dewandaru, Ginanjar, Syed Aun R. Rizvi, Rumi Masih, Mansur Masih, and Syed Othman Alhabshi. 2014. Stock market co-movements: Islamic versus conventional equity indices with multi-timescales analysis. Economic Systems 38: 553–71. [Google Scholar] [CrossRef]
- Dickey, David A., and Wayne A. Fuller. 1979. Distribution of the estimators for autoregressive time series with a unit root. Journal of the American Statistical Association 74: 427–31. [Google Scholar]
- El Amri, Henda, and Taher Hamza. 2017. Are there causal relationships between Islamic versus conventional equity indices? International Evidence. Studies in Business and Economics 12: 40–60. [Google Scholar] [CrossRef]
- Engle, Robert. 2002. Dynamic conditional correlation: A simple class of multivariate generalized autoregressive conditional heteroskedasticity models. Journal of Business & Economic Statistics 20: 339–50. [Google Scholar]
- Farooq, Moazzam, and Sajjad Zaheer. 2015. Are Islamic banks more resilient during financial panics? Pacific Economic Review 20: 101–24. [Google Scholar] [CrossRef]
- Hassan, Kamrul, Ariful Hoque, and Dominic Gasbarro. 2019. Separating BRIC using Islamic stocks and crude oil: Dynamic conditional correlation and volatility spillover analysis. Energy Economics 80: 950–69. [Google Scholar] [CrossRef]
- Hassan, Kamrul, Ariful Hoque, Dominic Gasbarro, and Wing-Keung Wong. 2020. Are islamic stocks immune from financial crises? Evidence from contagion tests. International Review of Economics & Finance. in press. [Google Scholar] [CrossRef]
- Hemche, Omar, Fredj Jawadi, Samir B. Maliki, and Abdoulkarim Idi Cheffou. 2016. On the study of contagion in the context of the subprime crisis: A dynamic conditional correlation–multivariate GARCH approach. Economic Modelling 52: 292–99. [Google Scholar] [CrossRef]
- Ho, Catherine Soke Fun, Nurul Afiqah Abd Rahman, Noor Hafizha Muhamad Yusuf, and Zaminor Zamzamin. 2014. Performance of global Islamic versus conventional share indices: International evidence. Pacific-Basin Finance Journal 28: 110–21. [Google Scholar] [CrossRef]
- Homapour, Elmina, Larry Su, Fabio Caraffini, and Francisco Chiclana. 2022. Regression analysis of macroeconomic conditions and capital structures of publicly listed British firms. Mathematics 10: 1119. [Google Scholar] [CrossRef]
- Hoque, Hafiz, Sarkar Humayun Kabir, El Khamlichi Abdelbari, and Viktor Manahov. 2016. Islamic and conventional equity market movements during and after the financial crisis: Evidence from the newly launched MSCI indices. Financial Markets, Institutions & Instruments 25: 217–52. [Google Scholar]
- IFDI. 2018. Efaidnbmnnnibpcajpcglclefindmkaj. Available online: https://ceif.iba.edu.pk/pdf/Reuters-Islamic-finance-development-report2018.pdf (accessed on 1 January 2023).
- Ji, Qiang, Dayong Zhang, and Yuqian Zhao. 2020. Searching for safe-haven assets during the COVID-19 pandemic. International Review of Financial Analysis 71: 101526. [Google Scholar] [CrossRef]
- Karanasos, Menelaos, Alexandros G. Paraskevopoulos, Faek Menla Ali, Michail Karoglou, and Stavroula Yfanti. 2014. Modelling stock volatilities during financial crises: A time varying coefficient approach. Journal of Empirical Finance 29: 113–28. [Google Scholar] [CrossRef]
- Kılıç, Nagihan, Burhan Uluyol, and Kabir Hassan. 2022. Diversification benefits of Turkey-based investors: Evidence from top trading partners based on a multivariate-GARCH approach. Journal of Economic and Administrative Sciences. ahead-of-print. [Google Scholar]
- Kwan, Chi Hung. 2020. The China–US trade war: Deep-rooted causes, shifting focus and uncertain prospects. Asian Economic Policy Review 15: 55–72. [Google Scholar] [CrossRef]
- Lajis, Siti Muawanah. 2017. Risk-sharing securities: Accelerating finance for SMEs. Islamic Economic Studies 130: 1–21. [Google Scholar] [CrossRef]
- Liow, Kim Hiang, Yuting Huang, and Jeonseop Song. 2019a. Relationship between the United States housing and stock markets: Some evidence from wavelet analysis. The North American Journal of Economics and Finance 50: 101033. [Google Scholar] [CrossRef]
- Liow, Kim Hiang, Xiaoxia Zhou, Qiang Li, and Yuting Huang. 2019b. Time–scale relationship between securitized real estate and local stock markets: some wavelet evidence. Journal of Risk and Financial Management 12: 16. [Google Scholar] [CrossRef]
- Luchtenberg, Kimberly F., and Quang Viet Vu. 2015. The 2008 financial crisis: Stock market contagion and its determinants. Research in International Business and Finance 33: 178–203. [Google Scholar] [CrossRef]
- Masih, Mansur, Nazrol K. M. Kamil, and Obiyathulla I. Bacha. 2018. Issues in Islamic equities: A literature survey. Emerging Markets Finance and Trade 54: 1–26. [Google Scholar] [CrossRef]
- Masset, Philippe. 2015. Analysis of Financial Time Series Using Wavelet Methods. In Handbook of Financial Econometrics and Statistics. Edited by Cheng-Few Lee and John C. Lee. New York: Springer. [Google Scholar] [CrossRef]
- Mensi, Walid. 2019. Global financial crisis and co-movements between oil prices and sector stock markets in Saudi Arabia: A VaR based wavelet. Borsa Istanbul Review 19: 24–38. [Google Scholar] [CrossRef]
- Mensi, Walid, Khamis Hamed Al-Yahyaee, Xuan Vinh Vo, and Sang Hoon Kang. 2021. Modeling the frequency dynamics of spillovers and connectedness between crude oil and MENA stock markets with portfolio implications. Economic Analysis and Policy 71: 397–419. [Google Scholar] [CrossRef]
- Naseri, Marjan, Syed Othman Alhabshi, and Mansur Masih. 2017. Malaysian investors’ perspectives on the integration and co-movement of Islamic stock markets in developed and developing countries. In Handbook of Empirical Research on Islam and Economic Life. Cheltenham: Edward Elgar Publishing, pp. 624–56. [Google Scholar]
- OECD. 2011. Available online: https://www.oecd.org/economy/outlook/49113623.pdf (accessed on 25 June 2022).
- Pham, Linh. 2019. Do all clean energy stocks respond homogeneously to oil price? Energy Economics 81: 355–79. [Google Scholar] [CrossRef]
- Phillips, Peter C. B., and Pierre Perron. 1988. Testing for a unit root in time series regression. Biometrika 75: 335–46. [Google Scholar] [CrossRef]
- Raza, Naveed, Sajid Ali, Syed Jawad Hussain Shahzad, Mobeen Ur Rehman, and Aneel Salman. 2019. Can alternative hedging assets add value to Islamic-conventional portfolio mix: Evidence from MGARCH models. Resources Policy 61: 210–30. [Google Scholar] [CrossRef]
- Reboredo, Juan C., Miguel A. Rivera-Castro, and Andrea Ugolini. 2017. Wavelet-based test of co-movement and causality between oil and renewable energy stock prices. Energy Economics 61: 241–52. [Google Scholar] [CrossRef]
- Rejeb, Aymen Ben. 2017. On the volatility spillover between lslamic and conventional stock markets: A quantile regression analysis. Research in International Business and Finance 42: 794–815. [Google Scholar] [CrossRef]
- Rhif, Manel, Ali Ben Abbes, Imed Riadh Farah, Beatriz Martínez, and Yanfang Sang. 2019. Wavelet transform application for/in non-stationary time-series analysis: A review. Applied Sciences 9: 1345. [Google Scholar] [CrossRef]
- Righi, Marcelo Brutti, and Paulo Sergio Ceretta. 2011. Analyzing the structural behavior of volatility in the major European markets during the Greek crisis. Economics Bulletin 31: 3016–29. [Google Scholar]
- Rizvi, Syed Aun R., Shaista Arshad, and Nafis Alam. 2015. Crises and contagion in Asia Pacific—Islamic v/s conventional markets. Pacific-Basin Finance Journal 34: 315–26. [Google Scholar] [CrossRef]
- Robiyanto, Robiyanto, Bayu Adi Nugroho, Andrian Dolfriandra Huruta, Budi Frensidy, and Suyanto Suyanto. 2021. Identifying the role of gold on sustainable investment in Indonesia: The dcc-garch approach. Economies 9: 119. [Google Scholar] [CrossRef]
- Sahabuddin, Mohammad, Junaina Muhammad, Mohamed Hisham Dato’ hjYahya, Sabarina Mohammed Shah, and Mohammad Mizanur Rahman. 2018. The co-movement between Shariah compliant and sectorial stock indexes performance in Bursa Malaysia. Asian Economic and Financial Review 8: 515–24. [Google Scholar] [CrossRef]
- Sahabuddin, Mohammad, Junaina Muhammad, Mohamed Hisham Yahya, and Sabarina Mohammed Shah. 2020. Co-movements between Islamic and Conventional Stock Markets: An Empirical Evidence. Journal Economic Malaysia 54: 27–40. [Google Scholar]
- Saiti, Buerhan, and Mansur Masih. 2016. The co-movement of selective conventional and Islamic stock indices: Is there any impact on shariah compliant equity investment in China? International Journal of Economics and Financial Issues 6: 1895–905. [Google Scholar]
- Saiti, Buerhan, and Nazrul Hazizi Noordin. 2018. Does Islamic equity investment provide diversification benefits to conventional investors? Evidence from the multivariate GARCH analysis. International Journal of Emerging Markets 13: 267–89. [Google Scholar] [CrossRef]
- Sakti, Muhammad Rizky Prima, Mansur Masih, Buerhan Saiti, and Mohammad Ali Tareq. 2018. Unveiling the diversification benefits of Islamic equities and commodities: Evidence from multivariate-GARCH and continuous wavelet analysis. Managerial Finance 44: 830–50. [Google Scholar] [CrossRef]
- Shahzad, Syed Jawad Hussain, Elie Bouri, David Roubaud, Ladislav Kristoufek, and Brian Lucey. 2019. Is Bitcoin a better safe-haven investment than gold and commodities? International Review of Financial Analysis 63: 322–30. [Google Scholar] [CrossRef]
- Shamsuddin, Abul. 2014. Are Dow Jones Islamic equity indices exposed to interest rate risk? Economic Modelling 39: 273–81. [Google Scholar] [CrossRef]
- Sharma, Anil, and Neha Seth. 2012. Literature review of stock market integration: A global perspective. Qualitative Research in Financial Markets 4: 84–122. [Google Scholar] [CrossRef]
- Su, Chi-Wei, Meng Qin, Syed Kumail Abbas Rizvi, and Muhammad Umar. 2021. Bank competition in China: A blessing or a curse for financial system? Economic Research-Ekonomska Istraživanja 34: 1244–64. [Google Scholar]
- Tian, X. L., Gang Kou, and Weike Zhang. 2020. Geographic distance, venture capital and technological performance: Evidence from Chinese enterprises. Technological Forecasting and Social Change 158: 120155. [Google Scholar] [CrossRef]
- Tiwari, Aviral Kumar, Arif Billah Dar, and Niyati Bhanja. 2013. Oil price and exchange rates: A wavelet based analysis for India. Economic Modelling 31: 414–22. [Google Scholar] [CrossRef]
- Value Walk. 2018. Available online: https://www.valuewalk.com/2019/02/top-10-largest-stock-exchanges/ (accessed on 1 January 2023).
- Wang, Gang-Jin, Chi Xie, Min Lin, and H. Eugene Stanley. 2017. Stock market contagion during the global financial crisis: A multiscale approach. Finance Research Letters 22: 163–68. [Google Scholar]
- Yarovaya, Larisa, Janusz Brzeszczyński, John W. Goodell, Brian Lucey, and Chi Keung Marco Lau. 2022. Rethinking financial contagion: Information transmission mechanism during the COVID-19 pandemic. Journal of International Financial Markets, Institutions and Money 79: 101589. [Google Scholar] [CrossRef]
- Yildirim, Ramazan, Mansur Masih, and Obiyathulla Ismath Bacha. 2018. Determinants of capital structure: evidence from Shari’ah compliant and non-compliant firms. Pacific-Basin Finance Journal 51: 198–219. [Google Scholar] [CrossRef]
- Yousaf, Imran, Makram Beljid, Anis Chaibi, and Ahmed AL Ajlouni. 2022. Do volatility spillover and hedging among GCC stock markets and global factors vary from normal to turbulent periods? Evidence from the global financial crisis and COVID-19 pandemic crisis. Pacific-Basin Finance Journal 73: 101764. [Google Scholar] [CrossRef]
- Zhang, Yue-Jun, and Xing-Xing Yan. 2020. The impact of US economic policy uncertainty on WTI crude oil returns in different time and frequency domains. International Review of Economics & Finance 69: 750–68. [Google Scholar]
- Zhang, Wenting, Xie He, and Shigeyuki Hamori. 2022. Volatility spillover and investment strategies among sustainability-related financial indexes: Evidence from the DCC-GARCH-based dynamic connectedness and DCC-GARCH t-copula approach. International Review of Financial Analysis 83: 102223. [Google Scholar] [CrossRef]
Disclaimer/Publisher’s Note: The statements, opinions and data contained in all publications are solely those of the individual author(s) and contributor(s) and not of MDPI and/or the editor(s). MDPI and/or the editor(s) disclaim responsibility for any injury to people or property resulting from any ideas, methods, instructions or products referred to in the content. |
© 2023 by the authors. Licensee MDPI, Basel, Switzerland. This article is an open access article distributed under the terms and conditions of the Creative Commons Attribution (CC BY) license (https://creativecommons.org/licenses/by/4.0/).