Abstract
Using a sample of 11,365 unique US firms over the period 1966 to 2021, this study examines the relationship between the age of a firm and its cash holdings. We categorize firms as young, mature, or old based on their age or years of operation. Our results show that firm age is one of the important determinants of cash holdings and that managers adjust cash holdings in response to changing financial needs and risks as firms age. We find that young firms tend to hold higher levels of cash than more established firms and that the marginal value of cash holdings is higher for younger firms. This is consistent with the notion that young firms are more focused on growth and investment and may have limited access to external financial resources. In contrast, mature and old firms tend to hold lower cash levels, possibly due to greater financial stability, increased creditworthiness, and a lower need to manage financial risks. Controlling for significant variables, we confirm our findings with the robustness tests. Taking care of the endogeneity issue, we still can confirm that firm age is negatively significant to the level and the marginal value of cash holdings.
1. Introduction
Corporate cash holdings have emerged as a crucial topic in the field of corporate finance, especially in making decisions around the firm’s value. The decision-making process surrounding corporate cash holdings necessitates a delicate balance between the benefits and costs associated with holding cash. Lee and Lee (2009) and Martínez-Sola et al. (2013) conclude that cash holdings decrease the firm’s value, but Opler et al. (1999) and Kusnadi (2011) find that cash holdings are positively associated with the firm’s growth opportunities. From this perspective, extensive research has been conducted regarding corporate cash holdings, driven primarily by two main motivations: operational requirements and the agency problem. From an operational standpoint, previous studies (Opler et al. 1999; Dittmar et al. 2003; Almeida et al. 2004; Pinkowitz et al. 2006; Han and Qiu 2007; Denis and Sibilkov 2010; Saunders and Steffen 2011) have revealed that corporate cash holdings aid in reducing transaction costs, facilitating efficient capital raising, and mitigating the cost of raised capital known as the precautionary motive. Addressing the agency problem, Jensen (1986) suggests that firms with sufficiently high levels of cash holdings can reduce market monitoring and minimize the need to raise external capital. This, however, can lead to top management pursuing their self-interests rather than those of shareholders due to the reduction in market monitoring. The existing literature provides empirical evidence supporting the agency perspective as a key factor contributing to the accumulation of cash holdings. (Ferreira and Vilela 2004; Malmendier and Tate 2008; Chen et al. 2012; Nikolov and Whited 2014).
Cash holdings have been attributed to both firm-specific factors and external factors. Extensive research has been conducted to identify relevant firm-specific factors, including dividend payout, leverage, liquidity, R&D, leverage, and firm size (Dittmar et al. 2003; Ferreira and Vilela 2004; Pinkowitz et al. 2006; Bates et al. 2009; Wasiuzzaman 2014; Uyar and Kuzey 2014; Bates et al. 2018; Liu et al. 2021). Graham and Leary (2018) propose that macroeconomic factors may explain changes in cash holdings for which firm-specific factors alone cannot adequately account. In particular, in unfavorable macroeconomic conditions, firms are inclined to hold more cash when external funding becomes costly. In particular, firms with high investment and growth opportunities seek to build cash holdings as a safeguard against adverse economic shocks (Faulkender and Wang 2006; Han and Qiu 2007; Denis and Sibilkov 2010; Ki and Adhikari 2022). Furthermore, the precautionary motive is associated with changes in cash holdings based on the level of macroeconomic uncertainty. Studies by Baum et al. (2006), Hackbarth et al. (2006), Gao et al. (2017), and Ki and Adhikari (2022) suggest that higher macroeconomic uncertainty leads to higher cash levels due to the increased unpredictability of future cash flows. Due to the aforementioned reasons, firms have been accumulating a larger volume of cash holdings. Figure 1 exhibits supportive evidence that the average cash ratio for U.S. firms has been increasing, especially since the 1980s.
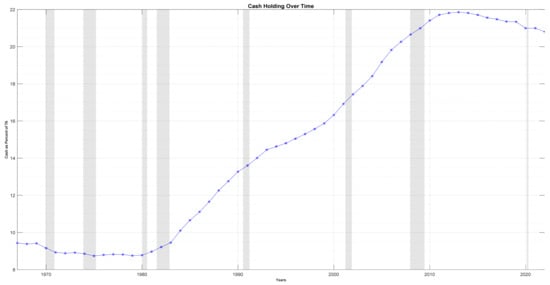
Figure 1.
Average cash ratio over time. This figure shows a 10-year moving average of the cash ratio. The cash ratio for each year is defined as the cross-sectional average of individual firms’ cash-to-total book value of assets. The shaded area represents the NBER-defined recessions for the U.S. economy. Our sample data for publicly traded firms are obtained from Standard and Poor’s annual Compustat database. Our sample spans from 1966 to 2021. We exclude all utilities and financial firms (SIC codes between 6000–6999 and 4900–4999), firms with less than three years of observation because we use the lag of the dependent variable, and firms with negative sales or total assets. Our final sample consists of 11,365 unique firms with 187,140 firm-year observations.
Firms exhibit varying levels of cash holdings based on their age and degree of maturity as their operational and investment opportunities differ. Figure 2 suggests that the average cash ratio declines as firms age, indicating that firms are inclined to possess less cash as they become mature. Correspondingly, Figure 3 shows that firms at different age levels show different volumes of cash holdings. Younger firms in blue (3–10 years) and red curves (11–20 years) in Figure 3 tend to have a higher level of cash holdings than mature firms since 1980.
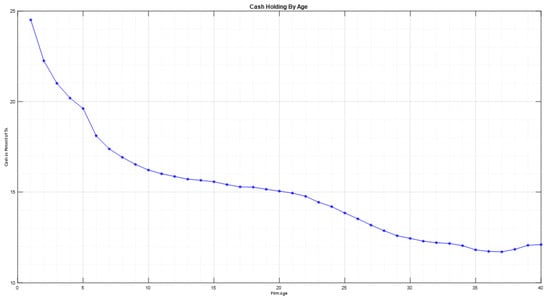
Figure 2.
Average cash ratio by age. The line depicts the cross-sectional annual average of cash and short-term investment to total assets ratios, organized by firms’ age. Our sample data are obtained from the annual Compustat database and span from 1966 to 2021. We exclude all utilities and financial firms, firms with less than three years of observation because we use the lag of the dependent variable, and firms with negative sales or total assets. Our final sample consists of 11,365 unique firms with 187,140 firm-year observations. In our analysis, we define a firm’s age as 1 when it first appears in the annual Compustat data and increments it by 1 in the following year, continuing this pattern. Firm ages are capped at 40 years. For each age group, we calculate the cross-sectional average of the cash and short-term investment to total assets ratios and illustrate these values against the respective firm ages on the plot.
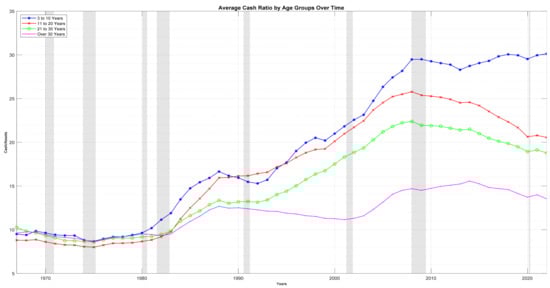
Figure 3.
Average cash holdings ratio by age groups. Firms are separated by their age group of 3 to 10 years (in blue), 11 to 20 years (in red), 21 to 30 years (in green), and over 30 years (in pink). Each group’s average cash holdings ratio is defined as the cross-sectional average of individual firms’ cash-to-total book value of assets in each group. The shaded area represents the NBER-defined recessions for the U.S. economy. Our sample data are obtained from the annual Compustat database and span from 1966 to 2021. We exclude all utilities and financial firms, firms with less than three years of observation because we use the lag of the dependent variable, and firms with negative sales or total assets. Our final sample consists of 11,365 unique firms with 187,140 firm-year observations.
Consequently, researchers have explored the relationship between a firm’s age and its cash holdings across different ages. Prior studies have employed the life-cycle theory to examine the association between age and cash holdings (Drobetz et al. 2015; Alzoubi 2019; Eulaiwi et al. 2020), primarily focusing on whether firms at different life-cycle phases tend to have different levels of cash holdings. However, the potential influence of the marginal value of cash holdings has not been adequately explored. Our study investigates both the level and marginal value of cash holdings at different ages at an aggregate level. We hypothesize that there exists a significant negative relationship between the level of cash holdings and a firm’s age. We exploit the marginal value of cash holdings as a motive for the relationship, expecting it to decrease gradually as firms establish a stronger reputation, a better market share, improved skills to manage risks, and better access to alternative sources of external funding as they mature.
We use a sample of publicly traded U.S. firms from 1966 to 2021 and employ various econometric techniques to analyze how firm age affects cash holdings and how the marginal value of cash holdings changes by firm age. First, we examine the relationship between cash holdings and firm age, controlling for other firm characteristics such as size, profitability, and investment opportunities. Second, we explore the relationship between firm age and the marginal value of cash holdings. Thirdly, we confirm our findings regarding the relationship of both the level and the marginal value of cash holdings with firm age with robustness tests. Lastly, we introduce a dynamic panel model setup to address the endogeneity issue universal in the corporate finance literature.
We find that younger firms tend to maintain higher cash holdings than their older counterparts, primarily due to the greater investment opportunities, lower operating cash inflows, higher operating cash outflows, and heightened financial constraints, necessitating a greater need for cash holdings. As firms mature and establish themselves, they gain increased access to external financing and encounter fewer investment opportunities, consequently diminishing their reliance on cash holdings. We can draw a connection between our findings and the agency problem. Immature firms often demonstrate substandard corporate governance practices (O’Connor and Byrne 2015). Such firms or firms with concentrated ownership tend to be inefficient in investments, such as hasty cash dissipation in M&A, resulting in an intensified agency problem (Harford et al. 2008; Dittmar and Mahrt-Smith 2007). Firms with substantial cash holdings are inclined to rely less on external funding for capital expenditure or investments. This reliance on internal cash holdings reduces the need for external monitoring, ultimately exacerbating the manifestation of the agency problem (Harford et al. 2008).
Additionally, we observe a decline in the marginal value of cash holdings as firms mature. Younger firms grappling with financial constraints and operating uncertainties alongside information asymmetry tend to attribute a higher value to their cash holdings. Conversely, older firms, characterized by greater financial stability and limited investment prospects, find excess cash to be less valuable. Figure 4 plots the moving average of the marginal value of cash holdings against firm age, showing a declining marginal value of cash holdings with firm age. This is consistent with the pecking order theory of financing, which suggests that firms prefer to finance investment projects first with retained earnings, debt, and, finally, equity. The marginal value of cash holdings declines with firm age due to several reasons. First, with maturity, firms experience more stable cash flows and predictable investment prospects, therefore lessening the necessity for substantial cash buffers. Second, established firms boasting a proven track record are viewed as less risky, therefore diminishing the imperative for significant cash holdings. Third, older firms may enjoy enhanced access to external financing options like equity or debt, reducing their dependence on internal cash holdings. Lastly, mature firms may encounter more lucrative investment opportunities, reducing the opportunity cost associated with holding cash.
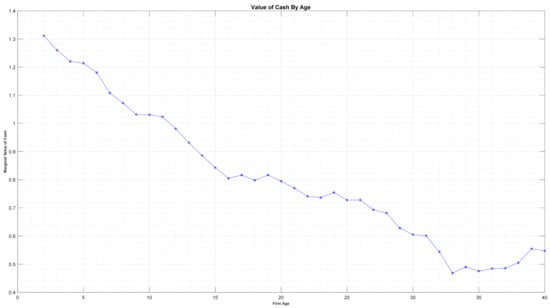
Figure 4.
The ten-year moving average of the marginal value of cash against firm age. Initially, the marginal value of cash is calculated by regression analysis with firm age, using excess returns as the dependent variable and other independent variables as specified in Equation (2). The first regression includes all firms aged three years, the second includes those aged four years, and subsequent regressions include firms of increasing ages incremented by one year. A firm may appear in multiple samples; for example, a firm aged ten years may be included in up to nine different regressions. In the second step, the ten-year moving simple average of the marginal values of cash obtained from the first step’s regressions is computed. Finally, this moving average against firm age is plotted in Figure 4. It shows a declining marginal value of cash with age.
To confirm the relationship between cash holdings and firm age, we control for variables that are known to notably impact both the level and the marginal value of cash holdings. Additionally, we control for firm characteristics, including growth and financial constraints. The robustness tests consistently support the finding that mature firms tend to maintain lower cash holdings compared to younger firms and the diminishing marginal value of cash holdings as firms age.
Firm age as an independent variable may be one of the potential sources of endogeneity issues. To address this issue, we estimate our main equations with three estimators: the Blundell–Bond estimator, Arellano–Bover/Blundell–Bond estimator, and the least square dummy variable estimator. The results indicate that firm age is negatively significant to the level and the marginal value of cash holdings, confirming our main findings.
This paper broadens the scope of research on cash holdings by introducing the firm’s age as an independent variable, shedding light on its role in influencing the level of cash holdings. Moreover, this contribution to the literature highlights the marginal value of cash holdings as an additional factor motivating firms to accumulate cash holdings, complementing the existing literature on precautionary and agency motives. Several prior studies, such as Dickinson (2011), Drobetz et al. (2015), Hasan and Habib (2017), and Eulaiwi et al. (2020), have leveraged the firm’s life-cycle theory to examine cash holdings’ levels and values across various life-cycle stages. Similarly, other studies, including Liu and Mauer (2011), Liu et al. (2014), and Lim and Lee (2019), have employed the firm’s age as an independent variable to elucidate cash holdings’ behaviors, yet they overlook the heterogeneous impact of the firm’s age on cash holdings at distinct age levels. These studies primarily emphasize comprehending the regional influence of the firm’s age on cash holdings. In contrast, this paper examines the influence of firm age on both the level and the marginal value of cash holdings, directly incorporating firm age into the model and addressing potential endogeneity issues stemming from the feedback loop between dependent variables like cash holdings and excess returns and the independent variable of firm age. Our findings remain robust after accounting for previously identified control variables and alternative models and tests.
2. Related Literature and Hypothesis Development
The behavior of a firm’s cash holdings is explored through the lens of the life-cycle theory. Firms in the introduction phase often lack comprehensive knowledge about operational parameters and the industry, leading to negative cash flows from operations and investments (Dickinson 2011). These firms typically have limited access to external funding sources, making it crucial for them to hold higher cash holdings to meet operational and investment needs (Faff et al. 2016; Atif and Ali 2021). During the growth phase, firms can establish a stronger market reputation, increase profit margins, and generate positive operating cash flows. However, they still have a strong motivation to maintain or accumulate higher levels of cash holdings to overcome entry barriers and capitalize on promising investment opportunities (Dickinson 2011; Faff et al. 2016). During the mature phase, firms commonly demonstrate well-established operational efficiency and generate positive operating cash flows, leading to a tendency to maintain reduced levels of cash holdings. Their investment focus shifts toward asset maintenance and the implementation of corporate governance strategies, leading them to hold less cash and, therefore, mitigate agency problems (Dickinson 2011; Hasan and Habib 2017). Firms in the decline phase experience a decline in growth rates, prices, profitability, managerial capabilities, financial performance, and operating cash flows. With limited asset liquidation to service outstanding debt and sustain ongoing operations, these firms reduce their cash holdings (Dickinson 2011; Faff et al. 2016; Hasan and Habib 2017). Drobetz et al. (2015) demonstrate how the level and value of cash holdings change across different stages of the firm’s life cycle, noting that cash holdings are high in the early stages and decline as the firm reaches maturity. Alzoubi (2019) examines how a firm’s cash holdings decisions change throughout the life cycle and finds a negative relationship between cash holdings and the later stages of the life cycle. Taken together, these studies emphasize how the life-cycle stage of a firm influences its cash holdings decisions, highlighting the varying motivations and patterns of cash accumulation or depletion throughout the different phases.
Previous research suggests that a firm’s age significantly influences various aspects of its behavior and characteristics. Young firms lacking access to external funding opportunities or established credit lines often face higher challenges in maintaining growth rates than matured firms, especially during contractionary economic conditions (Fort et al. 2013). Empirical studies have extensively explored the relationship between a firm’s age and its performance, such as its speed and cautiousness (Krafft et al. 2014; Colombelli et al. 2016), the link between age and innovation (Cucculelli 2018; Pellegrino 2018), the association between age and financial performance (Van Stel et al. 2018; Reed 2020), and the relationship between age and growth (Cowling et al. 2018). Additionally, research has documented how a firm’s age influences its capital structure and corporate governance. Faff et al. (2016) conclude that firms tend to increase their assets-in-place and, consequently, take on more debt as they age. Filatotchev et al. (2006) and O’Connor and Byrne (2015) argue that a firm’s governance structures evolve to reflect the changing needs throughout its life cycle. These studies imply that corporate governance and capital structure may change as a firm progresses in age, with the firm’s age serving as a crucial control variable.
The age of a firm is expected to have a dual effect on the level of cash holdings. In the case of younger firms, they typically generate lower operating cash inflows and face a higher need for initial investments and cash outflows. Moreover, due to information asymmetry and uncertainty surrounding their performance, these firms encounter higher costs of external capital. Consequently, younger firms are more likely to hold larger cash holdings to fulfill their investment requirements, as observed in Figure 3. This relationship between firm age and cash holdings is supported by studies conducted by Huynh and Petrunia (2007) and Wang et al. (2014). On the contrary, as companies mature over time, they tend to become less vulnerable to information asymmetry and uncertainties in their operational performance. Their well-established reputation often results in reduced capital costs. Consequently, mature firms typically have fewer incentives to amass and maintain high levels of cash holdings. The anticipated relationship between a company’s age and its cash holdings is negative for older firms, in line with the observations depicted in Figure 2. This conclusion is consistent with the findings of prior studies conducted by Schaller (1993), Mohd-Ashhari and Faizal (2018), and Sethi and Swain (2019). In summary, the dual effect of firm age on cash holdings indicates that newly established and younger firms tend to maintain higher cash holdings, whereas older and more mature firms typically exhibit lower levels of cash holdings. Drawing upon a comprehensive review of existing literature, we have formulated the following hypothesis to be tested in our study.
Hypothesis 1.
Firms tend to hold a lower level of cash holdings as firms mature.
Hypothesis 2.
The marginal value of each dollar in the cash holdings tends to decrease as firms mature.
3. Data and Methodology
Our firm-specific variables for publicly traded firms are obtained from Standard and Poor’s annual Compustat database. Our sample spans from 1966 to 2021. We exclude all utilities and financial firms (SIC codes between 6000–6999 and 4900–4999) because utility firms are subject to regulatory oversight, and financial firms hold cash to maintain holding requirements. We exclude firms with less than three years of observation because we use the lag of the dependent variable. We also exclude firms with negative sales or total assets. Our final sample consists of 11,365 unique firms with 187,140 firm-year observations. All continuous variables are winsorized at the 1% and 99% levels. Data for the 25 Fama–French benchmark portfolios formed on size and book-to-market 10 are obtained from Prof. French’s data library.1
We examine corporate cash holdings’ dynamics by age using two strands of literature. The first set of literature highlights the importance of understanding the factors that drive a firm’s financial decisions and the complex interplay between firm-specific, macroeconomic, and institutional factors. Some of the key determinants identified in the literature (Opler et al. 1999; Bates et al. 2009; Dittmar and Mahrt-Smith 2007) include the one-year lag value of corporate cash to assets ratio (L. Cash Ratio), market-to-book ratio (MB Ratio), firm size (Firm Size), cash flow to assets ratio (CF Ratio), net working-to-capital-assets (NWC Ratio), capital expenditures to assets (Capex Ratio), leverage (Leverage Ratio), R&D to sales (RD/Sales ratio), acquisition to assets (Acq. Ratio), and dividend payout dummy (Dividend). The definitions of these control variables, as well as additional variables used in the marginal value of cash holdings model, are provided in Appendix A. Using these control variables, and following Bates et al. (2009), our first model to examine the relationship between cash holdings and firm age is as follows.
The coefficient of interest for our analysis from Equation (1) is . Young firms often face challenges in securing external financing for their growth due to their limited creditworthiness. Consequently, they tend to maintain relatively higher levels of cash holdings compared to older firms. As companies grow and establish themselves, they gain access to credit, which enables them to fund future growth endeavors and mitigate unforeseen financial uncertainties. Consequently, mature firms typically maintain lower cash holdings. Their preference leans toward distributing cash to shareholders through dividends or share repurchases, resulting in lower cash holdings relative to their investment needs. We hypothesize that the sign for is negative.
Another strand of literature our study utilizes is related to the marginal value of cash holdings. Several studies (Faulkender and Wang 2006; Pinkowitz et al. 2006; Dittmar and Mahrt-Smith 2007) examined the determinants of the factors that influence the marginal value of cash holdings, including firm size, growth opportunities, financial flexibility, access to credit markets, and macroeconomic conditions. Although there is general agreement on the significance of these factors, there exists a significant divergence in the estimates of the marginal value of cash holdings in various studies. This suggests that the ideal level of cash holdings might be contingent on a firm’s individual circumstances and the prevailing economic conditions. To examine the marginal value of cash holding, we use the model developed by Faulkender and Wang (2006) by adding an interaction term as follows:
where is the excess return of a stock over the fiscal year calculated as the return of stock i minus the return of the 25 Fama–French benchmark portfolios formed on size and book-to-market during the fiscal year t, the Δ indicates the change in the value from the previous year’s value and εi,t is the error term. The other firm-level variables at time t are cash holdings (, earnings (, non-cash assets (, R&D expenditures (, interest expense (, dividends (, leverage (, net financing (, and firm age in years (. All firm-level variables are deflated by the one-year lag market value of equity (). The regression coefficient can be interpreted as the dollar change in the value of the firm for a one-dollar change in the amount of cash held by the form. We anticipate that both coefficient related to the interaction effect between changes in cash holdings and firm age and will demonstrate both negativity and statistical significance.
Alternatively, we also use an augmented version of the Fama and French (1993) model as modified by Pinkowitz et al. (2006) in the following form:
where Vi,t is the value of a firm i at time t measured as the sum of the market value of equity, the book value of short-term debt, and the book value of long-term debt. Here, Δ is the change of the level of variable X from fiscal year t − 1 to year t, and Δ is the change in the level of variable X from fiscal year t to year t + 1, and εi,t is the error term. The other variables in the equation include earnings before extraordinary items plus interest, deferred tax credits, investment tax credits (E), net assets (NA), research and development expenditure (RD), interest expense (I), common dividends paid (D), and cash and cash equivalents (C). All variables are divided by total assets (A) in year t. The coefficient of the firm age, , is expected to be negative, implying that mature firms have less marginal value of cash holdings than firms in younger firms.
Our unbalanced panel models represented by Equations (1) and (2) are estimated using a pooled OLS estimator and fixed-effects estimator with cluster-robust standard errors. To ascertain the resilience of our findings, we will incorporate controls for diverse factors, including size, governance, and financial constraints.
4. Empirical Results
4.1. Summary Statistics
Table 1 provides a comprehensive overview of the variables examined in our study, including their magnitudes and directions, as referenced from Bates et al. (2009, 2018) and Opler et al. (1999). It is essential to note that the reported summary statistics may differ from those in previous studies, primarily due to variations in the sample periods. For instance, our sample period reflects an average cash ratio of 16.33%, slightly higher than the 17% in Opler et al. (1999). Similarly, the median cash holdings ratio in our sample is 8.3%, as opposed to the 6.5% in Opler et al. (1999). Excess return, the dependent variable in our study, has a mean value of 20.65%. This differs significantly from 5.8% in Bates et al. (2018) for the sample period of 1980 to 2009.

Table 1.
Descriptive statistics.
The median values of other key variables for the marginal value of cash holdings are very similar to those reported by Bates et al. (2018). For example, the median values of earnings, non-cash assets, R&D expenditures, and interest expenses in our study are 0.85%, 4.35%, 0%, and 1%, while Bates et al. (2018) report median values of 0.8%, 4.3%, 0%, and 0%, respectively.
The variable of focus in our study is the firm age, measured as the number of years a firm has appeared in the Compustat database. To mitigate the influence of outlier values, we have truncated this variable at 40 years, as it is a rare occurrence for firms to survive beyond this point. We have set a minimum requirement of 3 years for a firm to be considered for inclusion in our sample, as we utilize lead and lag values for certain variables in our analysis. Within our sample, the median firm age stands at 9 years, while the average age is 12.43 years. Notably, a significant portion of the firms, approximately 75%, possess a lifespan of less than 17 years. The truncation of the variable has resulted in relatively low variability in firm age.
Table 2 presents the pairwise correlation coefficients between the variables used in our equations. Panel A displays the correlation coefficients between the variables used to analyze how firm age affects the level of cash holdings. Statistical significance levels at 10%, 5%, and 1% are indicated by asterisks *, **, and ***, respectively. The correlation coefficient between firm age and cash ratio is negative (−14%). Similarly, in panel B, we present the correlation coefficients between the variables used to measure the marginal value of cash holdings resulting from changes in firm age.
Table 2.
Pairwise correlations—Panel A. Pairwise correlations—Panel B.
Our analysis has revealed a negative correlation between firm age and firm value. Specifically, the correlation coefficient between excess returns and firm age stands at −0.04%. This finding substantiates our initial hypothesis, which posited negative associations between firm age and both the level and the marginal value of cash holdings. However, it is essential to note that further examination is needed to ascertain whether firm age does indeed impact changes in both the level and the marginal value of cash holdings.
4.2. Regression Results
In this section, we provide a summary of our empirical findings. To begin, we present the results of our regression analysis using Equation (1), as shown in Table 3. The dependent variables, Cashr and Dcash, are considered separately, and we estimate model (1) using both pooled methods and fixed-effects regression methods. Columns 1 to 3 offer an overview of the results from the pooled estimation, while columns 4 to 6 present the findings from the fixed-effects model. Our baseline model, which does not include the firm age variable, aligns with previous studies, such as Opler et al. (1999), Bates et al. (2009), Bates et al. (2018), and Chung et al. (2020). Subsequently, we enhance the baseline model by incorporating the firm age variable and re-estimate the model. The outcomes in columns 2 to 3 and 5 to 6 consistently demonstrate that firm age exhibits an inverse relationship with both the cash holdings ratio and changes in cash holdings. The negative coefficient indicates that as firms mature, they tend to maintain lower cash holdings.
Table 3.
Age, Cash Ratio, and Change in Cash.
Table 4 and Table 5 provide a concise summary of the estimation results for models (2) and (3). In Model 2, adhering to Faulkender and Wang’s (2006) specifications, we focus on the impact of firm age on firm value. The change in firm value is calculated as the difference between the excess return of firm i during fiscal year t and the return of the benchmark portfolio during the same period. These benchmark portfolios are constructed based on Fama and French’s (1993) size and book-to-market portfolios. Consistent with Faulkender and Wang (2006), we also account for other variables that may exhibit correlations with firm cash holdings and returns. Since both the dependent and independent variables are normalized by the preceding year’s market value of equity, the coefficient on the cash change ( signifies the marginal value of cash holdings resulting from a one-dollar change in the firm’s cash holdings. To evaluate the influence of firm age on the marginal value of cash holdings, we create an interaction term between the cash change and firm age ( Firm Age). A positive coefficient on this interaction term implies an increase in market value as firms age, while a negative coefficient suggests a decrease in market value as firms mature.
Table 4.
Firm Age and Marginal Value of Cash Holdings (Equation (2)).
Table 5.
Age and Marginal Value of Cash Holdings (Equation (3)).
Table 4 provides a summary of estimation results, with columns labeled [1] and [2] representing the outcomes of the pooled regression and columns labeled [3] and [4] presenting the results from the fixed effect regression. Notably, all of our estimates for the control variables exhibit statistical significance, and their directions are consistent with those reported in Faulkender and Wang (2006). Of particular interest is the coefficient on the interaction between firm age and the change in cash holdings ( Firm Age) is negative and statistically significant. This suggests that, for older firms, the stock market attributes a relatively lower value to each dollar of cash held by the company.
Alternatively, we adopt the method proposed by Pinkowitz et al. (2006) to evaluate the impact of firm age on the marginal value of cash holdings, as presented in Table 5. In our study, the dependent variable is the market-to-book ratio, which serves as an indicator of firm value. The control variables encompass various factors that are expected to influence investors’ expectations regarding future net cash flows, consequently impacting the firm’s overall value. It is noteworthy that the coefficients on the firm age and the interaction variable between excess cash and firm age (*) are not only negative but also statistically significant. This signifies that firm age has a substantial and meaningful impact on reducing the value of cash holdings. In simpler terms, older firms exhibit a statistically and economically significant decrease in the value of each dollar held in cash.
4.3. Robustness Tests
Our findings continue to hold their consistency even after considering the influence of other variables that are recognized to have a substantial impact on cash holdings and their marginal value. These variables include firm size, financial constraints, corporate governance, and company types based on investment characteristics and market behavior. Table 6 offers a summarized view of our estimation results, while we omit reporting estimates for control variables to maintain brevity.
Table 6.
Robustness tests.
Firm size can indeed exert an influence on both the level and the marginal value of cash holdings. Smaller firms often maintain larger cash holdings as a precautionary measure, serving as a buffer against various risks. As firms expand in size, the incremental value of each additional dollar of cash held tends to diminish. This phenomenon is typically attributed to factors such as economies of scale and the availability of alternative funding sources for larger firms. The second column in Panel A and Panel B of Table 6 presents estimates for our variable of interest, Firm Age. The results reinforce our earlier observations, underscoring that as firms age, they exhibit a counteractive effect on both the magnitude of cash holdings and the marginal value of cash.
We also control for characteristics of companies, such as value vs. growth. Growth companies tend to maintain higher levels of cash holdings compared to value companies. This can be attributed to the fact that growth-oriented companies place a greater emphasis on innovation, expansion, and potential investment opportunities, which require a buffer of liquid assets. In contrast, value companies, despite often having stable cash flows, may prioritize dividend payments or debt reduction over accumulating substantial cash holdings. We divided our sample of companies into quantiles based on their market-to-book ratios. Companies with high market-to-book ratios are categorized as growth companies, while those with low market-to-book ratios are classified as value companies. The estimates of our variable of interest are summarized in the third column of Table 6. As depicted in the table, firm age demonstrates an inverse impact on both the level and the marginal value of cash holdings, consistent with our previous findings.
Financially constrained firms and unconstrained firms exhibit differing approaches to cash holdings. Financially constrained firms, often facing challenges in accessing external financing due to factors like credit constraints or market conditions, tend to maintain higher levels of cash holdings. This precautionary measure helps them navigate uncertain situations and meet their financial obligations without relying heavily on borrowing. In contrast, unconstrained firms, with greater access to external funding and lower financial risk, might prioritize deploying their excess cash into more lucrative investments or returning value to shareholders through dividends or share buybacks. These firms might hold comparatively lower levels of cash, as they can tap into capital markets when needed without the same constraints. The cash holdings strategies of these two types of firms reflect their respective financial positions and risk tolerances, with constrained firms emphasizing liquidity as a safeguard and unconstrained firms focusing on optimizing their capital utilization and returns.
To control for financial constraints, we utilized the financial constraints database associated with Hoberg and Maksimovic (2015). We categorized firms into financially constrained and unconstrained groups based on the “delaycon” variable, where higher values indicate a greater similarity to firms known to be at risk of delaying their investments due to liquidity issues. The estimation results, after controlling for financial constraints, are summarized in the fourth column of Table 6. Once again, these results align with our prior observations, highlighting that a firm’s age inversely impacts both the amount of cash holdings and the incremental value attributed to cash.
Previous studies, such as Dittmar and Mahrt-Smith (2007) and Pinkowitz et al. (2006), have shown that firms with poor corporate governance tend to experience a significant devaluation of their cash assets. Effective governance practices foster transparency, accountability, and prudent risk management in cash management decisions. In contrast, weak governance can lead to issues such as opacity in fund management, inadequate risk assessment, and inefficient capital allocation. We measured corporate governance using the G index and the CCG index as outlined by Frankenreiter et al. (2021). By employing the G index, we segmented our dataset into two distinct groups and subsequently recalibrated our regression outcomes. A concise overview of regression estimates is presented in the final column of Table 6. The results from these robustness tests consistently reveal the same pattern: older firms tend to maintain smaller cash holdings compared to their younger counterparts. Moreover, the additional value of holding cash appears to diminish for these older firms, reinforcing the key findings illustrated in Table 3, Table 4 and Table 5.
As a result, this study confidently concludes that firm age exerts a significantly negative influence on the level of cash holdings. In essence, the level of cash holdings decreases as firms mature, reflecting a clear trend. Furthermore, it demonstrates that as firms age, they place less importance on having additional cash on hand, illustrating the diminishing marginal value of cash holdings.
4.4. Endogeneity Issues
Firm characteristics, such as firm performance, can both affect and be affected by firm age. When firm age is included as an independent variable, it introduces the potential for endogeneity. This results in a bidirectional causality between the dependent and independent variables, leading to a correlation between the independent variable and the error term. This, in turn, can yield biased and inconsistent parameter estimates, ultimately jeopardizing the validity of the results. To address this issue, Grieser and Hadlock (2019) recommend employing dynamic panel-data GMM estimators when strict exogeneity assumptions are violated. In a similar vein, Flannery and Hankins (2013) propose using the least squares dummy variable estimator to mitigate biases associated with fixed effects.
To address possible endogeneity problem, we also estimate our Equations (2) and (3) using three estimators: Blundell–Bond estimator (BB), Arellano–Bover/Blundell–Bond system GMM estimator (SYS GMM), and least square dummy variable estimator (LSDV). Blundell–Bond estimator allows models with low-order moving-average correlation in the idiosyncratic errors, whereas SYS GMM allows unobserved panel-level effects to be correlated with the lags of the dependent variable. The LSDV estimator performs linear regression while controlling for the effects of a categorical variable. The estimation results for Equations (2) and (3) using these three methods are summarized in Table 7 and Table 8, respectively.
Table 7.
Dynamic Panel: Cash Ratio.
Table 8.
Dynamic Panel: Marginal Value of Cash.
The findings presented in Table 7 reveal that the estimated coefficient for firm age is not only statistically significant but also negative, indicating that firm cash holdings have an inverse relationship with firm age, regardless of the estimation methods used. The estimates for the other independent variables remain consistent across the different estimation techniques. Notably, the coefficient for the additional independent variable, the lag cash ratio, is positive and statistically significant. This suggests positive autocorrelation, meaning that an increase in the cash ratio in the previous period is associated with a corresponding increase in the cash ratio in the current period.
The estimation results of our excess return regression Equation (2) as a dynamic equation are summarized in Table 8. The estimates on the control variables are consistent with prior literature Bates et al. (2018). The coefficient of our interest is the coefficient on the interaction term (Firm Age). The results show that the estimate is negative and statistically significant in all three estimation techniques. The negative sign indicates that marginal cash value is negative as firms age. It suggests that our primary premise of the paper is robust to different estimation techniques. The coefficient on the past excess returns ( is also negative and statistically significant. This indicates a negative autocorrelation, i.e., if excess returns deviate from the average value in one period, it tends to revert towards the mean in the following periods.
5. Concluding Remarks
Cash holdings play a pivotal role for firms, offering a cushion to navigate financial challenges, seize investment opportunities, and provide flexibility for strategic decision-making. However, maintaining excessive cash can result in adverse outcomes, including reduced returns and elevated agency costs. The framework of the marginal value of cash holdings underscores the significance of balancing the advantages and drawbacks associated with holding cash. This study delves into the interplay between cash holdings, the marginal value of cash holdings, and the age of U.S. firms.
Our study reveals that cash holdings exhibit variations among firms of different age groups, driven by distinctions in risk preferences, available investment opportunities, and external financing constraints. Younger firms tend to maintain larger cash holdings to finance investments, sustain operations, and guard against financial distress. In contrast, older firms tend to hold less cash due to a reduced need for investments, well-established financial avenues, and a scarcity of growth opportunities. Moreover, our findings suggest that the marginal value of cash holdings may fluctuate across different age groups of firms due to differences in the availability of investment opportunities, the level of uncertainty, information asymmetry, and financial constraints. We have accounted for firm characteristics, such as firm size, growth versus value orientation, financial constraints, and corporate governance, and can confirm that firm age significantly and negatively impacts both the level and the marginal value of cash, which diminishes as firms age. It is worth noting that our results remain consistent for both the level and the marginal value of cash holdings, even after addressing potential endogeneity concerns.
In summary, our study highlights that the level and the marginal value of cash holdings may indeed vary across different age groups of firms. This underscores the importance of considering firm age when determining the optimal level of cash holdings. Further research is warranted to delve into the drivers of these differences and their implications for firm performance and shareholder value.
In this study, we have not incorporated an analysis of macroeconomic factors, such as interest rates, in our examination of the dynamics of the level and marginal value of cash holdings. Ki and Adhikari (2022) have suggested that macroeconomic factors can significantly influence both the level and value of cash holdings, in addition to firm-specific factors. For instance, as market interest rates rise, the expected return on cash holdings may increase, potentially leading to a decrease in the level of cash holdings due to a preference for short-term investments. This, in turn, could increase the value of cash holdings, driven by the higher opportunity cost associated with holding cash.
Furthermore, changes in macroeconomic parameters can also impact a firm’s operational growth strategy. However, the exploration of these potential impacts on cash holdings and operational strategies is a task that we defer to future research.
Author Contributions
Conceptualization, Y.K.; Methodology, R.A.; Software, R.A.; Formal analysis, R.A.; Investigation, Y.K. and R.A.; Resources, Y.K. and R.A.; Data curation, R.A.; Writing—original draft, Y.K.; Writing—review & editing, Y.K. and R.A.; Visualization, R.A.; Supervision, Y.K. All authors have read and agreed to the published version of the manuscript.
Funding
This research received no external funding.
Data Availability Statement
The data presented in this study are available on request from the second author.
Acknowledgments
We express our gratitude for the insightful suggestions provided by three anonymous reviewers, whose feedback has greatly contributed to the enhancement of our paper.
Conflicts of Interest
The authors declare no conflict of interest.
Appendix A. Variables Definitions
The data item number in the table below refers to the Compustat data item number.
| Variables | Definition |
| Dependent Variable | |
| Cash Ratio | CHE/AT. The ratio of cash and marketable securities to total assets. |
| is the excess return calculated as ith stock returns minus ith stock’s benchmark returns at year t. The ith stock’s benchmark returns is one of the 25 Fama–French portfolios formed on size and book-to-market-matched portfolio returns to which stock i belongs at the beginning of the year t. | |
| Vi,t | Vi,t is the value of ith firm in year t computed in one of the three different ways. The first measure of value (V1) is the sum of the market value of equity and debt (CSHPRI × PRCC_F + AT − CEQ) scaled book value of total assets (AT). The second measure of value (V2) is the sum of the market value of equity and the book value of debt (CSHPRI × PRCC_F + DLTT + DLC) scaled by the book value of total assets (AT). The third measure of value (V3) is the market value of equity (CSHPRI × PRCC_F) scaled by the book value of total assets (AT). |
| Independent Variables | |
| L. Cash Ratio | The one-period lagged cash ratio. |
| MB Ratio | Market-to-Book ratio = (AT − CEQ + PRCC_F*CSHO)/AT. The ratio of the market value of total assets plus the book value of total liabilities to the book value of total assets. |
| Firm Size | Firm size = Log(AT). Natural logarithm of the book value of total assets. |
| CF Ratio | Cash flow to assets = (OIBDP − XINT − TXT − DVC)/AT. Operating income before depreciation less interest expense, taxes, and dividend divided by total assets. |
| NWC Ratio | Net working capital to total assets = (WECAP − CHE)/AT. Current assets excluding cash and marketable securities less current liabilities divided by book value of total assets. |
| Capex Ratio | Capital expenditures to total assets = CAPX/TA. The ratio of capital expenditure to book value of total assets. |
| Lev. Ratio | Leverage = (DLTT + DLC)/AT. The ratio of short-term and long-term debt to total assets. |
| RD/Sales | R&D expenditure to sales = XRD/SALE. Research and Development expense as a percent of total sales. |
| Acq. Ratio | Acquisitions to total assets = AQC/AT. The ratio of total acquisition to total assets or 0 if missing. |
| Dividend | Dividend payout ratio = 1 or 0. 1 if dividend payout > 0 or if a positive dividend is reported. 0 otherwise. |
| ΔC is the change in cash plus marketable securities (CHE) over the fiscal year t − 1 to t, scaled by the market value of equity (CSHPRI × PRCC_F) at the beginning of the year. | |
| Number of years covered in Compustat. Alternatively, the number of years covered in the CRSP database. | |
| It is an interaction term calculated as . | |
| is the change in earnings before extraordinary items (IB + XINT + TXDI + ITCI) over the fiscal year t − 1 to t, scaled by the market value of equity at the beginning of the year. | |
| is the change in non-cash assets (AT − CHE) over the fiscal year t − 1 to t, scaled by the market value of equity at the beginning of the year. | |
| is the change in research and development expenses (XRD or zero if missing) over the fiscal year t − 1 to t, scaled by the market value of equity at the beginning of the year. | |
| is the change in interest expenses (XINT) over the fiscal year t − 1 to t, scaled by the market value of equity at the beginning of the year. | |
| is the change in common dividends (DVC) over the fiscal year t − 1 to t, scaled by the market value of equity at the beginning of the year. | |
| is net financing defined as total equity issuance (SSTK) minus repurchase (PRSTKC) plus debt issuance (DLTIS) minus debt redemption (DLTR)) for the fiscal year t − 1 to t, scaled by the market value of equity at the beginning of the year. | |
| is leverage measured as total debt (DLTT + DLC) over the sum of total debt and the market value of equity. | |
Note
| 1 | http://mba.tuck.dartmouth.edu/pages/faculty/ken.french/data_library.html (accessed on 1 March 2023). |
References
- Almeida, Heitor, Murillo Campello, and Michael S. Weisbach. 2004. The cash flow sensitivity of cash. The Journal of Finance 59: 1777–804. [Google Scholar] [CrossRef]
- Alzoubi, Tariq. 2019. Firms’ life cycle stage and cash holding decisions. Academy of Accounting and Financial Studies Journal 23: 1–8. [Google Scholar]
- Atif, Muhammad, and Searat Ali. 2021. Environmental, social and governance disclosure and default risk. Business Strategy and the Environment 30: 3937–59. [Google Scholar] [CrossRef]
- Bates, Thomas W., Ching-Hung Chang, and Jianxin Daniel Chi. 2018. Why has the value of cash increased over time? Journal of Financial and Quantitative Analysis 53: 749–87. [Google Scholar] [CrossRef]
- Bates, Thomas W., Kathleen M. Kahle, and René M. Stulz. 2009. Why do US firms hold so much more cash than they used to? The Journal of Finance 64: 1985–2021. [Google Scholar] [CrossRef]
- Baum, Christopher F., Mustafa Caglayan, Neslihan Ozkan, and Oleksandr Talavera. 2006. The impact of macroeconomic uncertainty on non-financial firms’ demand for liquidity. Review of Financial Economics 15: 289–304. [Google Scholar] [CrossRef]
- Chen, Qi, Xiao Chen, Katharine Schipper, Yongxin Xu, and Jian Xue. 2012. The sensitivity of corporate cash holdings to corporate governance. The Review of Financial Studies 25: 3610–44. [Google Scholar] [CrossRef]
- Chung, Ji-Woong, Boochun Jung, and Duri Park. 2020. Has the value of cash increased over time? Accounting & Finance 60: 2263–99. [Google Scholar]
- Colombelli, Alessandra, Jackie Krafft, and Marco Vivarelli. 2016. To be born is not enough: The key role of innovative start-ups. Small Business Economics 47: 277–91. [Google Scholar] [CrossRef]
- Cowling, Marc, Weixi Liu, and Ning Zhang. 2018. Did firm age, experience, and access to finance count? SME performance after the global financial crisis. Journal of Evolutionary Economics 28: 77–100. [Google Scholar] [CrossRef]
- Cucculelli, Marco. 2018. Firm age and the probability of product innovation. Do CEO tenure and product tenure matter? Journal of Evolutionary Economics 28: 153–79. [Google Scholar] [CrossRef]
- Denis, David J., and Valeriy Sibilkov. 2010. Financial constraints, investment, and the value of cash holdings. The Review of Financial Studies 23: 247–69. [Google Scholar] [CrossRef]
- Dickinson, Victoria. 2011. Cash flow patterns as a proxy for firm life cycle. The Accounting Review 86: 1969–94. [Google Scholar] [CrossRef]
- Dittmar, Amy, and Jan Mahrt-Smith. 2007. Corporate governance and the value of cash holdings. Journal of Financial Economics 83: 599–634. [Google Scholar] [CrossRef]
- Dittmar, Amy, Jan Mahrt-Smith, and Henri Servaes. 2003. International corporate governance and corporate cash holdings. Journal of Financial and Quantitative Analysis 38: 111–33. [Google Scholar] [CrossRef]
- Drobetz, Wolfgang, Michael Halling, and Henning Schröder. 2015. Corporate life-cycle dynamics of cash holdings. Paper Presented at the 28th Australasian Finance and Banking Conference, Sydney, Australia, 16–18 December. Swedish House of Finance Research Paper No. 15-07. [Google Scholar] [CrossRef]
- Eulaiwi, B., A. Al-Hadi, S. M. Hussain, and K. H. Al-Yahyaee. 2020. Investment Committee, Corporate Cash Holdings, and Corporate Life Cycle. International Review of Finance 20: 757–69. [Google Scholar] [CrossRef]
- Faff, R., W. C. Kwok, E. J. Podolski, and G. Wong. 2016. Do corporate policies follow a life-cycle? Journal of Banking & Finance 69: 95–107. [Google Scholar]
- Fama, Eugene F., and Kenneth R. French. 1993. Common risk factors in the returns on stocks and bonds. Journal of Financial Economics 33: 3–56. [Google Scholar] [CrossRef]
- Faulkender, Michael, and Rong Wang. 2006. Corporate financial policy and the value of cash. The Journal of Finance 61: 1957–90. [Google Scholar] [CrossRef]
- Ferreira, Miguel A., and Antonio S. Vilela. 2004. Why do firms hold cash? Evidence from EMU countries. European Financial Management 10: 295–319. [Google Scholar] [CrossRef]
- Filatotchev, Igor, Steve Toms, and Mike Wright. 2006. The firm’s strategic dynamics and corporate governance life-cycle. International Journal of Managerial Finance 2: 256–79. [Google Scholar] [CrossRef]
- Flannery, Mark J., and Kristine Watson Hankins. 2013. Estimating dynamic panel models in corporate finance. Journal of Corporate Finance 19: 1–19. [Google Scholar] [CrossRef]
- Fort, T. C., J. Haltiwanger, R. S. Jarmin, and J. Miranda. 2013. How firms respond to business cycles: The role of firm age and firm size. IMF Economic Review 61: 520–59. [Google Scholar] [CrossRef]
- Frankenreiter, Jens, Cathy Hwang, Yaron Nili, and Eric Talley. 2021. Cleaning corporate governance. U. Pa. L. Rev. 170: 1. [Google Scholar]
- Gao, Janet, Yaniv Grinstein, and Wenyu Wang. 2017. Cash Holdings, Precautionary Motives, and Systematic Uncertainty. SSRN. [Google Scholar] [CrossRef]
- Graham, John R., and Mark T. Leary. 2018. The evolution of corporate cash. The Review of Financial Studies 31: 4288–344. [Google Scholar] [CrossRef]
- Grieser, William D., and Charles J. Hadlock. 2019. Panel-data estimation in finance: Testable assumptions and parameter (in) consistency. Journal of Financial and Quantitative Analysis 54: 1–29. [Google Scholar] [CrossRef]
- Hackbarth, Dirk, Jianjun Miao, and Erwan Morellec. 2006. Capital structure, credit risk, and macroeconomic conditions. Journal of Financial Economics 82: 519–50. [Google Scholar] [CrossRef]
- Han, Seungjin, and Jiaping Qiu. 2007. Corporate precautionary cash holdings. Journal of Corporate Finance 13: 43–57. [Google Scholar] [CrossRef]
- Harford, Jarrad, Satter Mansi, and William F. Maxwell. 2008. Corporate Governance and Firm Cash Holdings in the US. Journal of Financial Economics 87: 535–55. [Google Scholar] [CrossRef]
- Hasan, Mostafa Monzur, and Ahsan Habib. 2017. Corporate life cycle, organizational financial resources and corporate social responsibility. Journal of Contemporary Accounting & Economics 13: 20–36. [Google Scholar]
- Hoberg, Gerard, and Vojislav Maksimovic. 2015. Redefining financial constraints: A text-based analysis. The Review of Financial Studies 28: 1312–52. [Google Scholar] [CrossRef]
- Huynh, Kim P., and Robert J. Petrunia. 2007. Firm Size Dynamics: Age Effects and Financial Frictions. Journal of Economic Dynamics and Control 5: 1003–13. [Google Scholar]
- Jensen, Michael C. 1986. Agency costs of free cash flow, corporate finance, and takeovers. The American Economic Review 76: 323–29. [Google Scholar]
- Ki, YoungHa, and Ramesh Adhikari. 2022. Corporate cash holdings and exposure to macroeconomic conditions. International Journal of Financial Studies 10: 105. [Google Scholar] [CrossRef]
- Krafft, Jackie, Yiping Qu, Francesco Quatraro, and Jacques-Laurent Ravix. 2014. Corporate governance, value and performance of firms: New empirical results on convergence from a large international database. Industrial and Corporate Change 23: 361–97. [Google Scholar] [CrossRef][Green Version]
- Kusnadi, Yuanto. 2011. Do corporate governance mechanisms matter for cash holdings and firm value? Pacific-Basin Finance Journal 19: 554–70. [Google Scholar] [CrossRef]
- Lee, Kin-Wai, and Cheng-Few Lee. 2009. Cash holdings, corporate governance structure and firm valuation. Review of Pacific Basin Financial Markets and Policies 12: 475–508. [Google Scholar] [CrossRef]
- Lim, Jaemin, and Sang Cheol Lee. 2019. Relationship between the characteristics of Ceos and excess cash holdings of firms. Emerging Markets Finance and Trade 55: 1069–90. [Google Scholar] [CrossRef]
- Liu, Yixin, and David C. Mauer. 2011. Corporate cash holdings and CEO compensation incentives. Journal of Financial Economics 102: 183–98. [Google Scholar] [CrossRef]
- Liu, Yixin, David C. Mauer, and Yilei Zhang. 2014. Firm cash holdings and CEO inside debt. Journal of Banking & Finance 42: 83–100. [Google Scholar]
- Liu, Yuanyuan, Jing Li, Guanchun Liu, and Chien-Chiang Lee. 2021. Economic policy uncertainty and firm’s cash holding in China: The key role of asset reversibility. Journal of Asian Economics 74: 101318. [Google Scholar] [CrossRef]
- Malmendier, Ulrike, and Geoffrey Tate. 2008. Who makes acquisitions? CEO overconfidence and the market’s reaction. Journal of Financial Economics 89: 20–43. [Google Scholar] [CrossRef]
- Martínez-Sola, Cristina, Pedro J. García-Teruel, and Pedro Martínez-Solano. 2013. Corporate cash holding and firm value. Applied Economics 45: 161–70. [Google Scholar] [CrossRef]
- Mohd-Ashhari, Zariyawati, and Diana-Rose Faizal. 2018. Determinants and performance of cash holding: Evidence from small business in Malaysia. International Journal of Economics, Management and Accounting 26: 457–73. [Google Scholar]
- Nikolov, Boris, and Toni M. Whited. 2014. Agency conflicts and cash: Estimates from a dynamic model. The Journal of Finance 69: 1883–921. [Google Scholar] [CrossRef]
- O’Connor, Thomas, and Julie Byrne. 2015. Governance and the corporate life-cycle. International Journal of Managerial Finance 11: 23–43. [Google Scholar] [CrossRef]
- Opler, Tim, Lee Pinkowitz, René Stulz, and Rohan Williamson. 1999. The determinants and implications of corporate cash holdings. Journal of Financial Economics 52: 3–46. [Google Scholar] [CrossRef]
- Pellegrino, Gabriele. 2018. Barriers to innovation in young and mature firms. Journal of Evolutionary Economics 28: 181–206. [Google Scholar] [CrossRef]
- Pinkowitz, Lee, René Stulz, and Rohan Williamson. 2006. Does the contribution of corporate cash holdings and dividends to firm value depend on governance? A cross-country analysis. The Journal of Finance 61: 2725–51. [Google Scholar] [CrossRef]
- Reed, Jonathan Henry. 2020. The Effects of Firm Age and Firm Size on Strategic Agility and Performance. Doctoral dissertation, Florida Institute of Technology, Melbourne, FL, USA. [Google Scholar]
- Saunders, Anthony, and Sascha Steffen. 2011. The costs of being private: Evidence from the loan market. The Review of Financial Studies 24: 4091–122. [Google Scholar] [CrossRef]
- Schaller, Huntley. 1993. Asymmetric information, liquidity constraints, and Canadian investment. Canadian Journal of Economics 26: 552–74. [Google Scholar] [CrossRef]
- Sethi, Maheswar, and Rabindra Kumar Swain. 2019. Determinants of cash holdings: A study of manufacturing firms in India. International Journal of Management Studies 6: 11–26. [Google Scholar] [CrossRef]
- Uyar, Ali, and Cemil Kuzey. 2014. Determinants of corporate cash holdings: Evidence from the emerging market of Turkey. Applied Economics 46: 1035–48. [Google Scholar] [CrossRef]
- Van Stel, André, Ana Millán, José Maria Millán, and Concepción Román. 2018. The relationship between start-up motive and earnings over the course of the entrepreneur’s business tenure. Journal of Evolutionary Economics 28: 101–23. [Google Scholar] [CrossRef]
- Wang, Yanchao, Yu Ji, Xu Chen, and Chunlei Song. 2014. Inflation, operating cycle, and cash holdings. China Journal of Accounting Research 7: 263–76. [Google Scholar] [CrossRef]
- Wasiuzzaman, Shaista. 2014. Analysis of corporate cash holdings of firms in Malaysia. Journal of Asia Business Studies 8: 118–35. [Google Scholar] [CrossRef]
Disclaimer/Publisher’s Note: The statements, opinions and data contained in all publications are solely those of the individual author(s) and contributor(s) and not of MDPI and/or the editor(s). MDPI and/or the editor(s) disclaim responsibility for any injury to people or property resulting from any ideas, methods, instructions or products referred to in the content. |
© 2023 by the authors. Licensee MDPI, Basel, Switzerland. This article is an open access article distributed under the terms and conditions of the Creative Commons Attribution (CC BY) license (https://creativecommons.org/licenses/by/4.0/).