Abstract
This study analyzes the volatility spillover effects in the US stock market (S&P500) and cryptocurrency market (BGCI) using intraday data during the COVID-19 pandemic. As the potential drivers of portfolio diversification, we measure the asymmetric volatility transmission on both markets. We apply MGARCH-BEKK and the algorithm-based machine learning model. The negative shocks to returns impact the S&P500 and the cryptocurrency market more than the positive shocks on both markets. This study also indicates evidence of unidirectional cross-market asymmetric volatility transmission from the cryptocurrency market to the S&P500 during the COVID-19 pandemic. The research findings show the potential benefit of portfolio diversification between the S&P500 and BGCI.
JEL Classification:
C32; C58; C63
1. Introduction
The cryptocurrency market reshaped the traditional concepts of the financial markets. Blockchain technology using computer science knowledge created a financial revolution, impacting the financial markets from every perspective. It can be noticed that cryptocurrencies have received considerable attention from scholars, investors, and policymakers. As of April 2021, the global market capitalization of cryptocurrency was approximately $1983 billion1. The cryptocurrency market is becoming widespread. The cryptocurrency market is still new, despite this growth. It is therefore interesting to examine the relationship between the stock market and the cryptocurrency market and analyze the spillover effects within them. Scholars and industry practitioners have many debates about this topic. Symitsi and Chalvatzis (2018) found unilateral volatility transmission from energy and technology stocks to Bitcoin. Conrad et al. (2018) found that Bitcoin volatility is impacted by the S&P500 volatility.
Our research is the first study that combines the machine learning approach and the MGARCH-BEKK model to study the strength and linkage of volatility transmission between the cryptocurrency and US stock markets. The current literature mainly focuses on the application of the various GARCHs on the volatility transmission of the financial markets (Wang and Ngene 2020; Ji et al. 2019; Mensi et al. 2019). There is little literature applying the machine learning approach in finance research. Bertomeu et al. (2021) identify and interpret the patterns present in ongoing accounting misstatements. They use an algorithmic machine learning approach to address the importance of a wide set of variables to detect material misstatements. However, there is a lack of research using machine learning in the study of volatility transmission. In our study, we use an advanced machine learning method to conduct the robustness test in support of the empirical findings.
With the broader application of big data in industry and academia, machine learning has become an effective algorithmic technology in analyzing data and developing automated applications. Machine learning is a learning process that is conducted in an intelligent manner for the purpose of making comprehensive data-driven decisions. Witten et al. (2005) point out that the data-driven systems are effectively boosted by machine learning algorithms in terms of classification analysis, regression, data clustering, and dimensionality reduction. Machine learning algorithms can process and train a model to learn the trends, and using that knowledge to make predictions or inferences from real-world data. It is different from classical statistical methods in two ways. First, the classical statistical methods mainly focus on inference to discover relationships between the variables describing the effects of the model with no white noise (Bzdok et al. 2018). In contrast, machine learning concentrates on prediction to find the future movement patterns (Witten et al. 2005). Additionally, the algorithmic process is also helpful to capture the complex relationships in a forecasting context. Secondly, machine learning algorithms can deal with large and wide datasets at a fast pace. Classical statistical methods are useful for datasets with fewer input variables and comparatively smaller sizes.
The algorithmic machine learning approach attracts the attention of scholars and practitioners in finance (Warin and Stojkov 2021). However, there is a lack of research using the generalized additive model (GAM) in finance (Hastie and Tibshirani 1987). Machine learning models have a strong ability to learn the previous price movement patterns in both short or long time periods and using the learned information to predict the future price movements. In our study, we use the generalized additive 2 model () to estimate the impact power of one market on another one in line with the forecasting framework. This model is intelligible and provides more accurate results when ranking the impact features. The algorithm-based machine learning approach is accompanied with the study of robustness. We evaluate the impact feature of the regression coefficients in the machine learning model (Lou et al. 2012, 2013) in support of an investigation of the volatility dynamics between the S&P500 and the Bloomberg Galaxy Crypto Index (BGCI).
Our research question is about whether there are intraday volatility interactions between the crypto and the stock markets. To answer this question, we employ MGARCH-BEKK (Engle and Kroner 1995) and a machine learning framework to investigate volatility transmission between the BGCI and S&P500. Our intraday analysis addresses the fundamental mechanism between the markets from the perspective of asymmetric estimation of the volatility spillover. The intraday data is superior to the daily data in studying the dynamic relationships of the cryptocurrency market (Wang and Ngene 2020), because it helps us to find patterns in prices at shorter time intervals.
Several empirical studies analyzed the stock price movements across different stock markets. Previous studies (Cardona et al. 2017; Bollerslev et al. 1988; Kroner and Ng 1998) have shown how returns are related between stock markets and examine their influence on pricing and trading strategies.
The global linkage of emerging markets allows for the information and shocks to flow easily across the markets as demonstrated by Li and Majerowska (2008). The integration of stock markets reduces the benefits of portfolio diversification.
We question how the volatility of the cryptocurrency market is affected by the stock market. Symitsi and Chalvatzis (2018) pointed out that there is unilateral volatility from stocks to Bitcoin to some extent. Market integration influences volatility in stock markets and the risk of the assets. Therefore, it is important to analyze volatility and its transmission. Shi et al. (2020) found that the price volatility of Ethereum, Ripple, Dash, Stellar, Bitcoin, and Litecoin are related. Aslanidis et al. (2021) assessed market linkages across seventeen major cryptocurrencies by employing the daily returns from August 2015 to July 2020 using principal component analysis and a vector autoregression framework. The results suggested strong linkages between returns and volatility.
There are some researchers who have tried to examine the volatility behavior and interactions in cryptocurrency markets. Yousaf and Ali (2020) identified no significant volatility spillover between cryptocurrencies during the pre-COVID-19 period but found bidirectional volatility spillover during the COVID-19 pandemic using the DCC-GARCH model. Canh et al. (2019) found substantial volatility interactions among the cryptocurrencies with the DCC-GARCH model.
Bouri et al. (2018) found volatility spillover in the bitcoin market. Cardona et al. (2017) found volatility spillover in North and South American stock markets using MGARCH-BEKK models. Liu and Serletis (2019) found volatility spillover across cryptocurrencies and financial markets in the United States, Germany, the United Kingdom and Japan.
The intraday analysis is better suitable for the cryptocurrency market. However, previous researchers have focused on the daily volatility analysis instead of intraday volatilities analysis. Using MGARCH-BEKK framework, Worthington and Higgs (2004) found return spillovers in the major stock markets of Asia. Their study revealed weaker cross-volatility spillover than the spillover from own markets.
Most of the studies have focused on stock markets to examine volatility relationships but a few studies examine volatility dynamics across cryptocurrencies. There are a few such studies on cryptocurrencies and equity markets during the recent period. This paper tries to further the cryptocurrency literature in numerous ways. Firstly, it uses a multivariate asymmetric GARCH model to examine the intraday asymmetric volatility spillover. Secondly, it studies the most recent period, during the COVID-19 pandemic. Thirdly, it uses high-frequency (hourly) intraday data to examine the linkage. Fourth, it is the first study to apply a machine learning approach to the study of the return and volatility transmission between the S&P500 and BGCI using the MGARCH-BEKK (1,1) model.
2. Preliminary Examination
This study utilizes the intraday hourly closing value of the Bloomberg Galaxy Crypto Index and S&P500 from 1 June 2020 to 11 December 2020. The Bloomberg Galaxy Crypto Index (BGCI) is a benchmark index for cryptocurrencies in the US. S&P500 is one of the most commonly referenced equity indices. It tracks the performance of stock prices of the 500 largest companies.
Returns are measured as the difference between the natural logarithm of closing prices.
Figure 1 and Figure 2 display the returns of the share price indices. They indicate volatility clustering in the data.
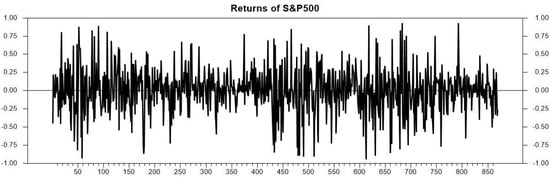
Figure 1.
Returns of S&P500.
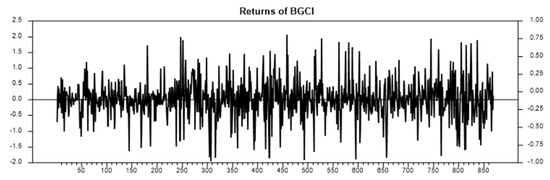
Figure 2.
Returns of BGCI.
Table 1 summarizes the returns. The Jarque–Bera statistics suggest that the returns are non-normal. Excess kurtosis suggests the returns are leptokurtic. Multivariate GARCH (MGARCH) is a valid model to analyze volatility transmission (Li 2007) with the dataset.

Table 1.
Summary Statistics.
3. Methodology
In accordance with the discussions of preliminary data analysis and the literature review, we developed a framework consisting of the time series model and a machine learning approach. Based on the earlier literature, we aimed to test the hypothesis that there exists a bidirectional volatility transmission between the BGCI and S&P500. The MGARCH-BEKK model (Engle and Kroner 1995) provides a convenient way to analyze the cross-market spillover. The application of machine learning is a promising methodology in asset pricing, corporate governance, international finance and accounting (Warin and Stojkov 2021, etc.). We used the algorithm-based as an alternative model for the robustness test. It helped to identify the importance of individual features to evaluate the strength and linkages between the S&P500 and the BGCI. There is no existing research on applying a machine learning model to the study of volatility transmission across the financial markets. Our study is the first to implement it in support of the empirical findings.
3.1. MGARCH-BEKK Model
Volatility transmission is mainly examined by the MGARCH-VEC, DCC-GARCH, and MGARCH-BEKK models (Bauwens et al. 2006). The MGARCH-VEC and DCC-GARCH models have limitations. The MGARCH-VEC model requires estimation of several parameters and a positive conditional variance matrix, while the DCC-GARCH model requires a positive conditional correlation matrix. These models lack usefulness in analyzing cross-market volatility spillover. We, therefore, employed the following MGARCH-BEKK model developed by Engle and Kroner (1995) to overcome the above problems in analyzing the volatility spillover:
Kroner and Ng (1998) developed the BEKK model to examine the asymmetric volatility.
The diagonal parameters of matrices V and W capture their own stock market’s shocks and volatility, while the off-diagonal elements of the matrices assess volatility transmission effects across the markets. The matrix K measures the asymmetric volatility response.
3.2. Generalized Additive Models (GAMs)
Lou et al. (2012) proposed a new method, presenting a large-scale empirical comparison of methods for traditional learning generalized additive models (GAMs)2. Lou, and others, explained the different shape models that influence the additive model. In 2013, Lou, Caruana, Gehrke and Hooker developed the model by adding selected terms of interacting pairs of features to traditional GAMs. This new model was intelligible and accurate for ranking all possible pairs of variables. We applied this new model to test the interactions between the stock market and cryptocurrency market.
In the above equation, shows n size, where is the response variable and has n features. is the prediction value on region and is a sorted set of possible values for variable , where . is the lookup table for sum of weight on cuts ( and is the lookup table for sum of targets on cuts ( The cut points have the lowest RSS that can replace the feature values to obtain the best , assigning weight as , to assess the strength of the interaction.
4. Empirical Analysis
In this study, we used a unit root test to test for nonstationarity. We examined volatility spillover effects with the MGARCH model. Lastly, we conducted the robustness test using the machine learning approach to examine volatility transmission among the S&P500 and the cryptocurrency market.
4.1. Unit Root Test
We used the augmented Dickey–Fuller Test (ADF)3 to check for stationarity in the data. The test is presented below.
Here, r denotes the return series. Table 2 contains the results of the unit root test.
Table 2.
Unit root test.
The results reported in Table 2 show that the return series are stationary. Now, we proceed to examine the volatility linkages.
4.2. MGARCH-BEKK Effects
The results of the MGARCH-BEKK are presented in Table 3. The stock indices of the BGCI and S&P500 are indexed 1 and 2, respectively.
Table 3.
Asymmetric MGARCH.
Multivariate ARCH and Q statistics tests suggested that the asymmetric BEKK model is a suitable model. The study implements the fluctuations test proposed by Nyblom (1989). This test is recommended for detecting possible changes in the parameters or structural breaks when observations are obtained sequentially in time. The results of the test are presented in Table 4.
Table 4.
Results of the fluctuations test.
All the parameters reported in Table 4 are statistically insignificant, which suggests that there is no structural break and that the estimated MGARCH-BEKK model is a proper model.
The matrices V and W, shown in Table 3, refer to the volatility relationships between the stock indices. The diagonal elements in matrix V and in matrix W measure the ARCH and GARCH effects respectively. As shown in Table 3, the parameters v11 and v22 suggest the existence of ARCH effects, while the statistically significant values of parameters w11 and w22 indicate the presence of a GARCH effect. The statistically significant own market GARCH parameter implies their own volatility influences the conditional variance. The negative ARCH parameter of the BGCI shows that greater past shocks in BGCI have had less effect on its current volatility.
The statistically insignificant off-diagonal elements of matrix V and W indicate that there are no shock and volatility transmissions between the markets. Own markets volatility spillover, as measured by GARCH parameters, are statistically significant. The volatility is more pronounced in the BGCI (0.972) than in the S&P500 (0.969). The current conditional volatility of both indices depends on their own past volatility. It does not depend on past volatility of the other index.
We detected evidence of asymmetric responses for S&P500 and BGCI, suggesting that the negative news induced more volatility. There exists a moderate dictation of asymmetric volatility transmission from the BGCI to the S&P500 implying that the good news in the crypto market causes more volatility in S&P500 than the bad news. The absence of bidirectional shocks and volatility spillover suggests an absence of interdependence between the markets. It implies that it is difficult to predict the volatility of one market using information from the other market.
4.3. Robustness Test
We use the algorithm-based for the robustness test for both returns and volatility between the S&P500 and BGCI. Table 5 reflects the importance of the relationships between the explanatory variables and the target variable in terms of the returns. In the forecasting machine learning model, the importance of the explanatory variables is ranked in terms of their contributions to explaining the target variable. Two financial indexes, RSP and RBGCI, are constructed as the target variables in the forecasting model separately. We observed that the S&P500 gained a negative power to explain BGCI (−0.005) and that the BGCI also has a negative explanatory power to the S&P500 (−0.014). The most important explanatory feature is ranked at 100%. The least important feature is ranked at 0. The results of Table 5 fall below 0 indicating that both indexes lack connectedness from the perspective of returns.
Table 5.
Feature importance on returns.
Table 6 further identifies the connectedness in terms of volatility. The BGCI had a stronger positive power in explaining the S&P500 (0.1773) than the S&P500 to explain the BGCI (0.028), inferring that there is asymmetrical volatility transmission between the BGCI and S&P500. Both markets contributed explanatory power in explaining the volatility transmission to each other. Our results are robust to volatility transmission.
Table 6.
Feature importance on volatility.
5. Summary
This is the first study combining both a machine learning approach and a MGARCH-BEKK to identify the volatility spillover and transmission across markets. We answered our research question to find that there is insignificant volatility spillover across the stock indices. The empirical findings provide the implication for practitioners and researchers in portfolio diversification and policy study. More importantly, the study explores the application of the new technology— in finance beyond the classical time series approaches.
The MGARCH-BEKK model found a lack of volatility spillover between the markets. The MGARCH-BEKK results showed that the past shocks and volatility of own markets have more influence on the recent volatility. The algorithm machine learning approach confirmed that there was no positive impact power between the returns of S&P500 and the BGCI. We detected the volatility spillover from the BGCI to the S&P500 is slightly higher than the transmission in the opposite direction. The study detected the unidirectional low magnitude asymmetric responses spillover from the BGCI to S&P500. The analysis demonstrated the evidence of asymmetric responses in both markets. The analysis suggests that the past volatility of own markets has useful information in forecasting volatility. The empirical results of show that our findings are robust.
Overall, we discovered a lack of interdependence in volatility, indicating a possible portfolio diversification advantage for investors. Asset allocation or hedging will be useful to portfolio managers. Our results also provide a theoretical framework for policymakers when making regulations.
Author Contributions
Conceptualization, P.J. and J.W.; methodology, P.J., J.W. and M.B.; software, P.J. and J.W.; validation, P.J., J.W. and M.B.; formal analysis, P.J. and J.W.; investigation, P.J. and J.W.; resources, P.J., J.W. and M.B.; data curation, P.J. and J.W.; writing—original draft preparation, P.J., J.W. and M.B.; writing—review and editing, P.J., J.W. and M.B.; visualization, P.J., J.W. and M.B.; supervision, P.J., J.W. and M.B.; project administration, P.J., J.W. and M.B. All authors have read and agreed to the published version of the manuscript.
Funding
This research received no external funding.
Institutional Review Board Statement
Not applicable.
Informed Consent Statement
Not applicable.
Data Availability Statement
The data presented in this study are available on request from the corresponding author. The data are not publicly available due to privacy concern.
Conflicts of Interest
The authors declare no conflict of interest.
Notes
| 1 | CoinMarketCap, April 2021. |
| 2 | Hastie and Tibshirani (1987) create the Generalized Additive Models that combine generalized linear models and additive models. |
| 3 | Dickey and Fuller (1979, 1981) proposed ADF test. |
References
- Aslanidis, Nektarios, Aurelio Bariviera, and Alejandro Perez-Laborda. 2021. Are cryptocurrencies becoming more interconnected? Economics Letters 199: 109725. [Google Scholar] [CrossRef]
- Bauwens, Luc, Sébastien Laurent, and Jeroen VK Rombouts. 2006. Multivariate Garch Models: A Survey. Journal of Applied Econometrics 21: 79–109. [Google Scholar] [CrossRef] [Green Version]
- Bertomeu, Jeremy, Edwige Cheynel, Eric Floyd, and Wenqiang Pan. 2021. Using Machine Learning to Detect Misstatements. Review of Accounting Studies 26: 468–519. [Google Scholar] [CrossRef]
- Bollerslev, Tim, Robert Engle, and Jeffrey Wooldridge. 1988. A Capital Asset Pricing Model with Time-Varying Covariances. Journal of Political Economy 96: 116–31. [Google Scholar] [CrossRef]
- Bouri, Elie, Mahamitra Das, Rangan Gupta, and David Roubaud. 2018. Spillovers between Bitcoin and other assets during bear and bull markets. Applied Economics 50: 5935–49. [Google Scholar] [CrossRef] [Green Version]
- Bzdok, Danilo, Naomi Altman, and Martin Krzywinski. 2018. Statistics versus machine learning. Nature Methods 15: 233–34. [Google Scholar] [CrossRef]
- Canh, Nguyen Phuc, Udomsak Wongchoti, Su Dinh Thanh, and Nguyen Trung Thong. 2019. Systematic risk in cryptocurrency market: Evidence from DCC-MGARCH model. Finance Research Letters 29: 90–100. [Google Scholar] [CrossRef]
- Cardona, Laura, Marcela Gutiérrez, and Diego A. Agudelo. 2017. Volatility transmission between US and Latin American stock markets: Testing the decoupling hypothesis. Research in International Business and Finance 39: 115–27. [Google Scholar] [CrossRef] [Green Version]
- Conrad, Christian, Anessa Custovic, and Eric Ghysels. 2018. Long- and Short-Term Cryptocurrency Volatility Components: A GARCH-MIDAS Analysis. Journal of Risk and Financial Management 11: 23. [Google Scholar] [CrossRef]
- Dickey, David A., and Wayne A. Fuller. 1979. Distribution of the Estimators for Autoregressive Time Series With a Unit Root. Journal of the American Statistical Association 74: 427–31. [Google Scholar]
- Dickey, David A., and Wayne A. Fuller. 1981. Likelihood Ratio Statistics for Autoregressive Time Series with a Unit Root. Econometrica 49: 1057–72. [Google Scholar]
- Engle, Robert F., and Kenneth F. Kroner. 1995. Multivariate Simultaneous Generalized ARCH. Economic Theory 11: 122–50. [Google Scholar]
- Hastie, Trevor, and Robert Tibshirani. 1987. Generalized Additive Models: Some Applications. Journal of the American Statistical Association 82: 371–86. [Google Scholar]
- Ji, Qiang, Elie Bouri, Chi Keung Marco Lau, and David Roubaud. 2019. Dynamic connectedness and integration in cryptocurrency markets. International Review of Financial Analysis 63: 257–72. [Google Scholar]
- Kroner, F. Kroner, and Victor K. Ng. 1998. Modeling Asymmetric Comovements of Asset Returns. Review of Financial Studies 11: 817–44. [Google Scholar]
- Li, Hong. 2007. International linkages of the Chinese stock exchanges: A multivariate GARCH analysis. Applied Financial Economics 17: 285–97. [Google Scholar]
- Li, Hong, and Ewa Majerowska. 2008. Testing stock market linkages for Poland and Hungary: A multivariate GARCH approach. Research in International Business and Finance 22: 247–66. [Google Scholar]
- Liu, Jinan, and Apostolos Serletis. 2019. Volatility in the Cryptocurrency Market. Open Economies Review 30: 779–811. [Google Scholar]
- Lou, Yin, Rich Caruana, and Johannes Gehrke. 2012. Intelligible Models for Classification and Regression. Paper presented at 18th ACM SIGKDD International Conference on Knowledge Discovery and Data Mining, Beijing, China, August 12–16; pp. 150–58. [Google Scholar]
- Lou, Yin, Rich Caruana, Johannes Gehrke, and Giles Hooker. 2013. Accurate Intelligible Models with Pairwise Interactions. Paper presented at 19th ACM SIGKDD International Conference on Knowledge Discovery and Data Mining, Chicago, IL, USA, August 11–14; pp. 623–31. [Google Scholar]
- Mensi, Walid, Yun-Jung Lee, Khamis Hamed AI-Yahyaee, Ahmet Sensoy, and Seong-Min Yoon. 2019. Intraday downward/upward multifractality and long memory in Bitcoin and Ethereum markets: An asymmetric multifractal detrended fluctuation analysis. Finance Research Letters 31: 19–25. [Google Scholar]
- Nyblom, Jukka. 1989. Testing for the Constancy of Parameters Over Time. Journal of the American Statistical Association 84: 223–30. [Google Scholar]
- Shi, Yongjing, Aviral Kumar Tiwari, Giray Gozgor, and Zhou Lu. 2020. Correlations among cryptocurrencies: Evidence from multivariate factor stochastic volatility model. Research in International Business and Finance 53: 101231. [Google Scholar]
- Symitsi, Efthymia, and Konstantinos Chalvatzis. 2018. Return, volatility and shock spillovers of Bitcoin with energy and technology companies. Economics Letters 170: 127–30. [Google Scholar]
- Wang, Jinghua, and Geoffrey Ngene. 2020. Does the Bitcoin Still Own Its Dominant Power? An Intraday Analysis. International Review of Financial Analysis 71: 101551. [Google Scholar]
- Warin, Thierry, and Aleksandar Stojkov. 2021. Machine Learning in Finance: A Metadata-Based Systematic Review of the Literature. Journal of Risk and Financial Management 14: 302. [Google Scholar]
- Witten, Ian H., Eibe Frank, Mark A. Hall, and Christopher Pal. 2005. Data Mining: Practical Machine Learning Tools and Techniques, 4th ed. Burlington: Morgan Kaufmann. [Google Scholar]
- Worthington, Andrew, and Higgs Higgs. 2004. Transmission of equity returns and volatility in Asian developed and emerging markets: A multivariate GARCH analysis. International Journal of Finance & Economics 9: 71–80. [Google Scholar]
- Yousaf, Imran, and Shoaib Ali. 2020. The COVID-19 outbreak and high frequency information transmission between major cryptocurrencies: Evidence from the VAR-DCC-GARCH approach. Borsa Istanbul Review 20: S1–S10. [Google Scholar]
Publisher’s Note: MDPI stays neutral with regard to jurisdictional claims in published maps and institutional affiliations. |
© 2022 by the authors. Licensee MDPI, Basel, Switzerland. This article is an open access article distributed under the terms and conditions of the Creative Commons Attribution (CC BY) license (https://creativecommons.org/licenses/by/4.0/).