Abstract
We attempted to comprehensively decode the connectedness among the abbreviation of five emerging market countries (BRICS) stock markets between 1 August 2002 and 31 December 2019 not only in time domain but also in frequency domain. A continuously varying spillover index based on forecasting error variance decomposition within a generalized abbreviation of vector-autoregression (VAR) framework was computed. With the help of spectral representation, heterogeneous frequency responses to shocks were separated into frequency-specific spillovers in five different frequency bands to reveal differentiated linkages among BRICS markets. Rolling sample analyses were introduced to allow for multiple changes during the sample period. It is found that return spillovers dominated by the high frequency band (within 1 week) part declined with the drop of frequencies, while volatility spillovers dominated by the low frequency band (above 1 quarter) part grew with the decline in frequencies; the dynamics of spillovers were influenced by crucial systematic risk events, and some similarities implied in the spillover dynamics in different frequency bands were found. From the perspective of identifying systematic risk sources, China’s stock market and Russia’s stock market, respectively, played an influential role for return spillover and volatility spillover across BRICS markets.
1. Introduction
The study of financial market spillovers is a hotly debated topic in financial economics. In the past few decades, the literature has extensively studied the question of how financial firms are interconnected. Focusing on studies of causality effects, co-movement, spillovers, connectedness, and systemic risk, researchers primarily attempt to answer this question through measuring the aggregate effects. An understanding of the magnitude and direction of linkages and spillovers is an essential part of policymakers’ information set (El Ghini and Saidi 2017). Financial contagion from one country might directly cause the welfare loss for another. Two types of spillovers about financial markets are widely investigated. One is the spillovers across different financial markets for a specific country, such as spillovers across stock, bond, and foreign exchange markets (Diebold and Yilmaz 2012; Narayan et al. 2014; Cronin 2014). The other is the spillovers for a specific financial market across different countries, such as the stock market spillovers among advanced or emerging economies (Miyakoshi 2003; Diebold and Yilmaz 2009; Zhou et al. 2012; Gamba-Santamaria et al. 2017) and foreign exchange market spillovers among European countries (Bubák et al. 2011; Antonakakis 2012).
A bulk of studies have explored the integration and spillover effect among stock markets. These studies not only focus on the mutual influence and linkage between the stock market and other financial markets (Wang and Liu 2016; Xia et al. 2019) but also explore the return spillovers among stock markets in different countries (Zhou et al. 2012; Yarovaya et al. 2016; Bissoondoyal-Bheenick et al. 2018) as well as volatility spillovers within different sectors (Jiang et al. 2019). The central intent behind this paper is to comprehensively explore the spillovers of stock markets among the BRICS in time and frequency domains. It is worth noting that, although many studies have confirmed the spillovers between developed and emerging markets, less attention has been paid to investigating the potential dynamics of spillovers among emerging markets economies (EMEs), especially in the BRICS. An exception is the Panda and Thiripalraju (2018), which examines the spillovers of stock markets among the BRICS by using the VAR Granger causality test to capture the return spillover effect as well as EGARCH model to capture the volatility spillover effect and its asymmetry. However, their study has obvious shortcomings that Granger causality approach and EGARCH model cannot measure the magnitude of spillovers, whereas they could only confirm the existence of spillovers. This shortcoming impedes the deep understanding about spillovers across stock markets in the BRICS.
The aim of our work is to comprehensively understand the linkages and connectedness among stock markets in the BRICS not only in time domain but also in frequency domain. To overcome the shortcomings in the existing literature, a continuously varying spillover index based on N-step-ahead forecasting error variance decompositions within a generalized VAR framework was computed. Considering that heterogeneous frequency responses to shocks are simply aggregated and, thus, a lot of useful information is lost, the spillover in time domain was deconstructed into those in five different frequency bands corresponding to the periods from 1 day to 1 week, 1 week to 1 month, 1 month to 1 quarter, 1 quarter to 1 year and 1 year above with the help of spectral representation to reveal differentiated linkages among the BRICS markets. Furthermore, many changes, such as the Subprime Crisis, Europe’s Sovereign Debt Crisis and quantitative easing, took place during the years in our sample. It seems unlikely that any single fixed parameter mode would apply over the entire sample. Thus, rolling sample analyses were introduced as important complements. We uncovered a series of intriguing findings, which complement the existing literature and have important implications for portfolio managers and regulators.
The most interesting finding is that return spillovers significantly declined with the drop of frequencies, while volatility spillovers grew with the decline in frequencies. The short-term (within 1 week) return spillover corresponding to a high-frequency part as well as long-term (above 1 quarter) volatility spillover corresponding to a low-frequency part contributed most to the total spillover. Analyses of both the full sample and rolling sample confirmed this intriguing finding.
Another important finding is that the dynamics of spillovers were influenced by crucial systematic risk events. Taking the overall return spillovers for example, some segmented characteristics were easy to find: before the Subprime Crisis, the overall return spillovers fluctuated to climb up; during the Subprime Crisis, the overall return spillovers zoomed up and the maximum peak happened in this time; during the period from 2011 to 2015, the overall return spillovers descended with fluctuations; during the period from 2016 to 2017, the overall return spillovers oscillated violently, with the situation rising up first and going down after; since 2018, the overall return spillovers picked up the vibrating uptrend again. It is worth noting that there was no general pattern or universal law for the influence of risk events on overall, net and pairwise spillovers.
Moreover, from the perspective of identifying systematic important stock markets, China’s stock market and Russia’s stock market were probably influential spillover sources for return linkage and volatility connectedness among the BRICS markets, respectively.
The major contributions of our work are twofold.
First, the variation features of return spillover and volatility spillover across stock markets in the BRICS within different frequency bands were uncovered. In practice, because systemic spillovers threaten the stability of global stock market system, identifying the frequency-specific source of instability is of importance for regulators who are looking for tools to monitor this kind of negative effects. For the first time, we deconstructed the aggregated spillover across stock markets in the BRICS into frequency-specific spillovers and pinned down the dominated risk frequency sources.
Second, net pairwise spillovers in the frequency domain provided new thoughts for portfolio managers who aim at allocating stock assets across the BRICS markets. As pointed out by Tiwari et al. (2018), diversification opportunities are different in different frequencies. Based on the frequency decomposition of net pairwise spillover, investors are finally capable of accomplish more accurate portfolio rebalance in accordance with their differing expectations as well as disparate frequency and pace of daily trading.
The remainder of this paper is organized as follows. The first section reviews relevant literature on stock market spillovers. The following section describes how to calculate the continuously varying spillover index in time and frequency domains. The section after that introduces the data as well as the calculation of daily volatility. Then, a new section reporting unconditional patterns and conditional dynamics is conducted. The final section makes a brief conclusion.
2. Related Literature
A large number of studies have already analyzed the transmission mechanism and spillover channel of stock markets. As the largest economic entity in the world, the U.S. stock market is believed to be an important source of global stock market spillovers, which is consistent with many existing empirical evidences. Eun and Shim (1989) conduct a VAR model to study the stock market transfer structure of nine countries and find that the U.S. stock market lies in the core of the overall structure of international stock market system and has a significant impact on other stock markets. Hamao et al. (1990) find that the U.S. stock market plays a leading role in the conduction of fluctuations through examining the volatility spillover effects among stock markets in the United States, the United Kingdom and Japan. Theodossiou and Lee (1993) show that significant volatility correlations lie in global stock markets and the U.S. stock market plays an important role in volatility transmission. Raddant and Kenett (2021) reveal the interconnectedness in the global financial market.
Subsequent research turns to investigate the spillover between developed and emerging market economies. Soydemir (2000) explores the linkage structure of stock markets between developed and developing countries, which finds that there is a close connection between international trade and stock market interaction. Zhou et al. (2012) investigate daily indices of 11 stock markets including China, the United States and the United Kingdom, etc., and confirm the volatility spillover effect between China’s stock market and worldwide major markets. Yang and Zhou (2016) employ a recursive VAR approach testing volatility spillovers across major financial markets based on the VIX data and discuss the influence of quantitative easing. Nguyen and Le (2021) analyze the return spillover from the US and Japanese stock markets to the Vietnamese stock market from a frequency-domain perspective. Fang et al. (2021) discuss financial spillovers and spillbacks between China and G7 countries.
Recently, a bulk strand of literature focuses on searching for stock market spillovers among emerging economies probably due to two potential reasons: first, emerging economies, especially the BRICS, play an increasing role in global economy, and thus, stock markets in emerging economies have become important alternatives for global asset allocation and diversification; second, the rise in regional economic and trade organizations, such as the South Asian Association for Regional Cooperation (SAARC) and African Growth and Opportunity Act (AGOA), makes the economic and financial conditions more close to each other in related emerging countries group and, thus, promotes the international integration of stock markets. Yarovaya et al. (2016) explore the volatility spillovers across 21 stock markets in four major international regions and conclude that markets are more susceptible to domestic and region-specific volatility shocks than to inter-regional contagion. Jebran et al. (2017) investigate the asymmetric volatility spillover among Asian emerging markets in the pre- and post-Subprime Crisis through the lens of the extended EGARCH model. Dedi and Yavas (2016) find significant return co-movements among stock markets in countries of sample groups and claim that Germany, the United Kingdom and Russia play important roles. Hung (2019) studies the daily returns and volatility spillovers in common stock prices between China and four other countries in Southeast Asia based on a GARCH-BEKK model, which spans the period including the pre- and post-2008 Global Financial Crisis. In addition, the spillovers among different types of financial markets in recent studies are also discussed extensively1. Jiang et al. (2020) utilize the long-memory Copula-CoVaR-MODWT method to reveal the time-frequency linkage of risk spillovers between oil and BRICS stock markets. Liu and Hamori (2020) examine the spillovers of return and volatility transmitted from fossil energies and several important financial variables to renewable stock markets in the US and Europe. Wang (2020) investigates the frequency dynamics of volatility spillovers among crude oil and international stock markets.
In methodology, Diebold and Yilmaz (2012) establish the basic framework for generalized spillover measurement based on forecast error variance decompositions in time domain. Baruník and Křehlík (2018) upgrade the framework into a new connectedness measurement that arise due to heterogeneous frequency responses to shocks. Since then, many studies attempt to explore frequency spillovers by using the approach proposed by Baruník and Křehlík (2018). Tiwari et al. (2018) analyze the volatility spillovers across stock, sovereign bonds, credit default swaps (CDS) and currency markets in time and frequency domains. Xia et al. (2019) examine the dynamics of information spillovers among economic policy uncertainty (EPU), stock market and the housing markets of first-, second- and third-tier cities in China. Zeng et al. (2019) compare the information/price discovery abilities of four commonly used hedging assets, i.e., Bitcoin, crude oil, gold as well as USD, and find that USD and crude oil are major return and volatility spillover contributors, respectively. Jiang et al. (2019) employ the time-frequency connectedness framework, examining the frequency spillovers of stock volatilities across 12 industries in China. Qarni and Gulzar (2019) compare the frequency dynamics of intra-European Monetary Union (EMU) and intra-non-EMU European Union (EU) stock markets’ return spillover during the European Sovereign Debt Crisis. Tiwari et al. (2020) disclose that the agriculture sector is the most affected by shocks from other markets, while industrial inputs at all frequencies appear to be the main source of volatility transmission. Zhang et al. (2020) explore the relationship between natural gas prices and macroeconomic indicators and discover that total long-term return spillover is most important in the global financial crisis. In addition to finding the fact of differential response between return spillovers and volatility spillovers, Zhang and Hamori (2021) also reveal that the impact of COVID-19 on the oil and stock markets exceeds that of the 2008 Financial Crisis.
3. Measuring Spillovers in Time and Frequency Domains
3.1. Measurement of Spillovers inTime Domain
In a multivariable covariance stationary process described by the VAR(p) model
where Yt denotes stock market indices in the BRICS at time t = 1, 2, …, T; n represents the number of variables; B1, B2, …, Bp refers to the coefficient matrices; p stands for the lag order; εt delegates the white noise with covariance matrix ∑.
As long as the roots of the matrix lag-polynomial |B(z)| lie outside the unit circle, the aforementioned VAR(p) could be rearranged as the following vector moving average representation
where ψ(L) = [B(L)]−1.
Within the generalized VAR framework of Koop et al. (1996) and Pesaran and Shin (1998), H-step-ahead forecasting error variance decompositions denoted as were given as
where ∑ was the variance–covariance matrix of error vector ε, σjj was the standard deviation of the error term in the jth equation, and ei was the selection vector, in which the ith element equals 1 and others equals 0. In order to calculate the spillover index, each entry of variance decomposition matrix was normalized by the row sum as
Based on Equation (4), the total spillover index could be constructed as
For stock market i who received spillovers from market j, the directional spillover could be written as
In analogy, the spillover transmitted from market i to market j was obtained as
Furthermore, the directional spillovers transmitted from all other markets to market j and spillovers transmitted from market j to all others were, respectively, calculated as follows
Then, the net spillover and net pairwise spillover were, respectively, given as
3.2. Measurement of Spillovers inFrequency Domain
A natural way to describe the frequency dynamics of spillovers was to consider the spectral representation of variance decomposition based on frequency responses to shocks. Let the moving average coefficients ψh calculated at h = 1, 2, …, H horizons approximate ψ(L). A frequency response function obtained from a Fourier transform of the moving average coefficients ψh could be expressed as ψ(e−iω) = ∑he−iωhψh. The spectral density of Yt at frequency ω was formulized as
The generalized causation spectrum over frequencies ω∊ (−π, π) defined by Baruník and Křehlík (2018), (ϯ(ω))j,k, denoted the portion of the spectrum of variable j at a given frequency ω caused by shocks in variable k. As long as Yt was wide-sense stationary with σkk−1∑∞h=0|(ψh∑)j,k|<+∞, the spectral representation of variance decomposition from j to k could be expressed as
where the weighting function was defined as
The within connectedness CWd and the frequency connectedness CFd on the frequency band d = (a,b): a, b∊ (−π, π), a < b was, respectively, obtained by
where Tr{·} was the trace operator, and ∑d referred to the sum of all elements of the d matrix.
In order to obtain the theoretical infinite coefficients of vector moving average representation, a finite horizon H approximation was used due to the fact that the error from the approximation disappeared as H grew (Lütkepohl 2007). The coefficients were then computed through the standard recursive scheme. The spectral quantities were estimated using standard discrete Fourier transforms.
4. Data
The data used to calculate spillovers comprised five leading emerging stock market indices, namely, IBOVESPA (Brazil), RTS (Russia), JALSH (South Africa), SHCI (China) and SENSEX (India). The time spanned from August 1, 2002 to December 31, 2019. All data came from the Wind Financial Terminal, a mainland China’s leading financial database. To measure returns of stock markets, the first difference of the natural logs of daily closing prices was calculated. Let represent the closing price of stock market, then the daily return would be . To measure volatilities of stock markets, the methodology proposed by Yang and Zhang (2000) was employed. The reason why we choose the Yang–Zhang historical volatility estimator is that it has the minimum estimation error and is independent of drift and opening gaps. Let , and denote the open price, high price and low price in turn. Then, the daily time-varying volatility of stock market could be calculated as follows: , where , and n is the sample size, and are volatilities of open price and closing price, denotes an estimator proposed by Rogers and Satchell (1991) and Rogers et al. (1994). More details about volatility calculation could be found in Yang and Zhang (2000).
Figure 1 plots the correlogram of returns and volatilities. Clearly, all correlations were statistically significant. Correlations of volatilities among stock markets in the BRICS were higher than correlations of returns. Comparatively speaking, the correlations between China’s stock market and other markets were the weakest, while the correlations between South Africa’s stock market and other markets were the strongest. However, it is worth noting that a higher contemporaneous correlation does not necessarily indicate connectedness in the sense that the literature tries to measure it.
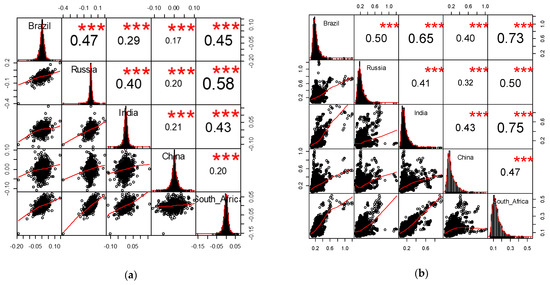
Figure 1.
Correlogram: return and volatility. (a)Return correlations across the BRICS; (b) volatility correlations across the BRICS. *** represents significance at 1% level.
5. Empirical Results
5.1. Unconditional Patterns: The Full-Sample Spillover Analysis
Two five-variable VAR systems consisting of daily returns and volatilities calculated from IBOVESPA, RTS, JALSH, SHCI and SENSEX were, respectively, estimated according to the AIC standard choosing the optimal lag length within the maximum value of 20. Then, a 100-period-ahead (H) forecasting error variance decomposition was constructed to obtain the full-sample spillover tables for returns and volatilities in time domain.
One conspicuous finding illustrated in Table 1 and Table 2 is that the overall volatility spillover of full sample (35.061) was larger than the overall return spillover (34.474). In terms of net spillovers, India’s and China’s stock markets, from which spillovers were larger than spillovers to them, were transmitters, while Brazil’s and South Africa’s stock markets, whose net spillovers were positive, were receivers, no matter in return spillover or in volatility spillover. Russia’s stock market received net return spillover, while it transmitted net volatility spillover. In magnitude, Brazil’s stock market was the biggest receiver of not only net return spillover but also net volatility spillover. China’s and Russia’s stock markets were, respectively, the biggest transmitters of net return spillover and net volatility spillover.

Table 1.
Return spillover table of full sample: time domain.
Table 2.
Volatility spillover table of full sample: time domain.
In terms of net pairwise return spillover, Brazil’s stock market received spillovers from all others; Russia’s stock market received spillovers from China’s and India’s stock markets; India’s stock market received spillover from China’s stock market that transmitted spillovers of similar magnitude to all other markets; South Africa’s stock market received spillovers from all others except for Brazil’s stock market. In magnitude, India’s stock market had the greatest impact on Brazil’s, Russia’s and South Africa’s stock markets.
In terms of net pairwise volatility spillovers, Brazil’s stock market received spillovers from others except for China’s stock market; India’s stock market received spillovers from others except for Brazil’s stock market; China’s stock market received spillovers from Brazil’s and Russia’s stock markets; South Africa’s stock market received spillovers from Russia’s and China’s stock markets; Russia’s stock market transmitted spillovers to all other markets. In magnitude, Russia’s stock market had the greatest impact on Brazil’s and South Africa’s stock markets. South Africa’s and Brazil’s stock markets were the most influential transmitters for India’s and China’s stock markets, respectively.
As pointed out by Baruník and Křehlík (2018), in time domain, heterogeneous frequency responses to shocks are simply aggregated, and thus, it is insufficient to reveal differentiated linkages among the BRICS markets within different frequency bands. For this reason, we, respectively, deconstructed the spillovers in time domain into those in five different frequency bands corresponding to the periods from 1 day to 1 week, 1 week to 1 month, 1 month to 1 quarter, 1 quarter to 1 year and 1 year above, which is an important extension for the traditional short-, medium-, and long-term connectedness analysis.
An important finding in Table 3 is that the overall return spillovers significantly declined with the drop of frequencies. The overall return spillover in the frequency band corresponding to the period from 1 day to 1 week amounted to 74.45% (25.665/34.474) of total overall spillover. The overall return spillover in the frequency band corresponding to the period from 1 week to 1 month accounted for 19.39% (6.685/34.474). Whereas, the summation of overall return spillovers within lower frequency bands only contributed 6.16% (calculated as 1–74.45%–19.39%) to the total overall spillover.
Table 3.
Return spillover table of full sample: frequency domain.
In the frequency band corresponding to the period from 1 day to 1 week, Brazil’s, India’s and China’s stock markets were transmitters of net return spillover, while Russia’s and South Africa’s stock markets were receivers of net return spillover. China’s and Russia’s stock markets were the most important transmitter and receiver in magnitude, respectively. China’s stock market transmitted net pairwise return spillovers to all other markets, while Russia’s stock market received net pairwise return spillovers from others. China’s stock market was the most influential transmitter for Brazil’s and India’s stock markets. Brazil’s stock market had the most noticeable impact on Russia’s stock market. The net spillover from China’s stock market to South Africa’s stock market was very close to that from Brazil’s stock market to South Africa’s stock market.
In the frequency band corresponding to the period from 1 week to 1 month, Russia’s, India’s and China’s stock markets were transmitters of net return spillover, while Brazil’s and South Africa’s stock market were receivers of net return spillover. The net return spillovers transmitted from India’s and China’s stock markets got very close numerically. Brazil’s stock market received the most return spillover. For all other markets, Brazil’s stock market was the receiver of net pairwise return spillover while China’s stock market was still the transmitter. India’s stock market was the most powerful return spillover transmitter for Brazil’s and South Africa’s stock markets. China’s stock market had the greatest impact on India’s stock market, both of which were important return spillover transmitters for Russia’s stock market.
Within the frequency bands corresponding to the periods from 1 month to 1 quarter, from 1 quarter to 1 year and longer than 1 year, the interested characteristics of net spillover and net pairwise spillover were very similar to those in the frequency band corresponding to the period from 1 week to 1 month. One nuance is that China’s stock market became the greatest transmitter of net return spillover.
As for volatility spillover displayed in Table 4, the most notable feature is that the overall volatility spillovers grew with the decline in frequencies. The proportions of overall volatility spillovers in total overall spillover from high frequency to low frequency bands were 0.43, 7.62, 14.13, 46.69 and 31.13% in turn.
Table 4.
Volatility spillover table of full sample: frequency domain.
In the frequency band corresponding to the period from 1 day to 1 week, Brazil’s stock market was the most important transmitter, while South Africa’s stock market was the greatest receiver, even though all spillovers were very small in magnitude.
In the frequency band corresponding to the period from 1 week to 1 month, Russia’s, India’s and China’s stock markets were transmitters of net volatility spillover, while Brazil’s and South Africa’s stock markets were receivers of net volatility spillover. Brazil’s and India’s stock markets were the most remarkable receiver and transmitter, respectively. In terms of net pairwise volatility spillover, Brazil’s stock market received spillovers from markets other than China’s stock market. Russia’s stock market transmitted net volatility spillovers to markets other than India’s stock market. South Africa’s stock market received net spillovers from markets other than Brazil’s stock market. China’s stock market only received net volatility spillover from Russia’s stock market. India’s stock market, who was the most important volatility spillover transmitter for Brazil’s, South Africa’s and Russia’s stock markets, only received net spillover from China’s stock market.
In the frequency band corresponding to the period from 1 month to 1 quarter, the features of net volatility spillover were similar to those in the frequency band corresponding to the period from 1 week to 1 month with the exception that Russia’s stock market replacing India’s stock market in magnitude became the most noticeable transmitter. The directions of net pairwise volatility spillovers were basically the same as those in the frequency band corresponding to the period from 1 week to 1 month, with a little difference that China’s stock market received net spillovers from not only Russia’s stock market but also Brazil’s stock market. In magnitude, China’s and India’s stock markets were still the most important net volatility spillover transmitters for India’s and Russia’s stock markets, respectively. However, Russia’s stock market was the largest net volatility spillover transmitter for South Africa’s stock market that transmitted the most net volatility spillover to Brazil’s stock market. In addition, Brazil’s stock market had the biggest impact of net volatility spillover on China’s stock market.
In the frequency band corresponding to the period from 1 quarter to 1 year, the features of net volatility spillover behave the same as those in the frequency band corresponding to the period from 1 month to 1 quarter. In terms of net pairwise volatility spillover, Brazil’s stock market received net spillovers from markets other than China’s stock market; Russia’s stock market transmitted net spillovers to all other markets; South Africa’s stock market received net spillovers from markets other than Brazil’s stock market; China’s stock market received net spillovers from Brazil’s and Russia’s stock markets; India’s stock market received net spillovers from China’s and Russia’s stock markets. Russia’s stock market had the most remarkable net impact on Brazil’s and South Africa’s stock markets. Brazil’s stock market was the most influential transmitter of net spillover for China’s stock market that transmitted the largest net volatility spillover to India’s stock market.
In the frequency band corresponding to the period longer than 1 year, Russia’s and India’s stock markets were transmitters of net volatility spillover while Brazil’s, China’s and South Africa’s stock markets were receivers of net volatility spillover. Brazil’s and Russia’s stock markets were the most remarkable receiver and transmitter, respectively. The net pairwise volatility spillover showed the same directional features as those in the frequency band corresponding to the period from 1 quarter to 1 year. In magnitude, Russia’s stock market was the most noticeable net volatility spillover transmitter for Brazil’s, India’s and South Africa’s stock markets. Meanwhile, Brazil’s stock market was the most powerful transmitter of net volatility spillover for China’s stock market.
5.2. Conditioning and Dynamics I: The Rolling-Sample Overall Spillover Analysis
Although full sample results provide a useful summary of “average” spillover behavior, they still likely miss potential important secular and cyclical movements. Diebold and Yilmaz (2012) estimate volatility spillovers using 200-day rolling samples. Considering a longer period of forecasting error variance decomposition was used in our work, a larger rolling window size of 300days was employed to balance the rolling sample estimates and the need of time-varying characteristics. In large systems, a small-sample bias may occur; hence, we used a parametric bootstrap as suggested in Engsted and Pedersen (2014) to obtain unbiased estimates of connectedness measures.
Figure 2 shows the overall return spillovers of rolling sample in time domain. Some segmented characteristics were easy to find: before the Subprime Crisis, the overall return spillovers fluctuated to climb up; during the Subprime Crisis, the overall return spillovers zoomed up and the maximum peak happened in this time; during the period from 2011 to 2015, the overall return spillovers descended with fluctuations; during the period from 2016 to 2017, the overall return spillovers oscillated violently with the situation rising up first and going down after; since 2018, the overall return spillovers picked up the vibrating uptrend again. Before 2011, the centroid of overall return spillovers was going up. However, after 2011, the centroid went down slowly.
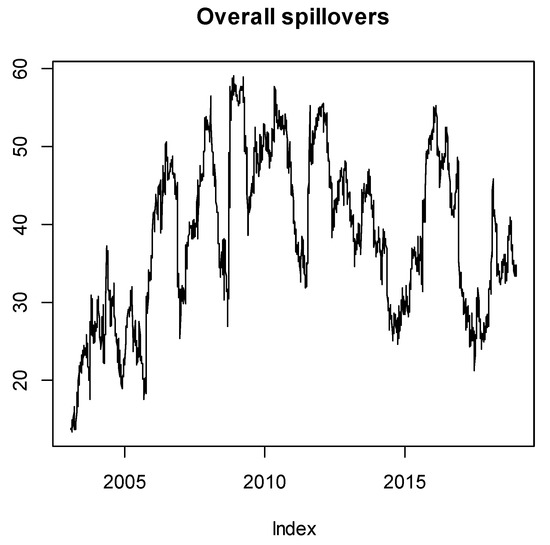
Figure 2.
Overall return spillovers of rolling sample: time domain.
Figure 3, Figure 4, Figure 5, Figure 6 and Figure 7 display the overall return spillovers of rolling sample in frequency domain. The most noticeable feature is that the dynamics of overall return spillovers in different frequencies exhibited some similarities: the overall return spillovers during the Subprime Crisis increased significantly; during the period from 2009 to the first half of 2013, the overall return spillovers ran in high level and kept steady uptrend; since the third quarter of 2013, the overall return spillovers began to descend remarkably.
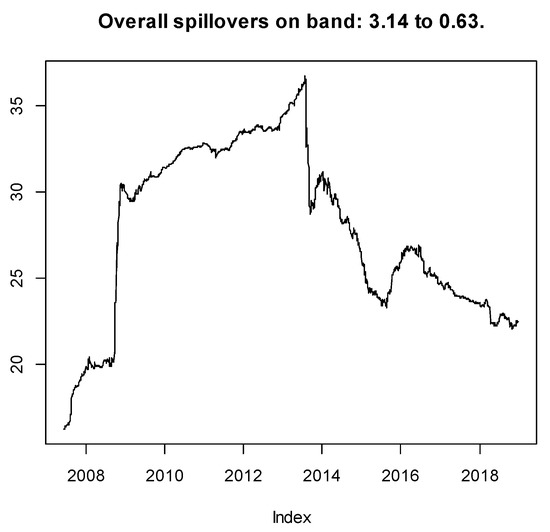
Figure 3.
Overall return spillovers of rolling sample corresponding to the frequency band from 1 day to 1 week.
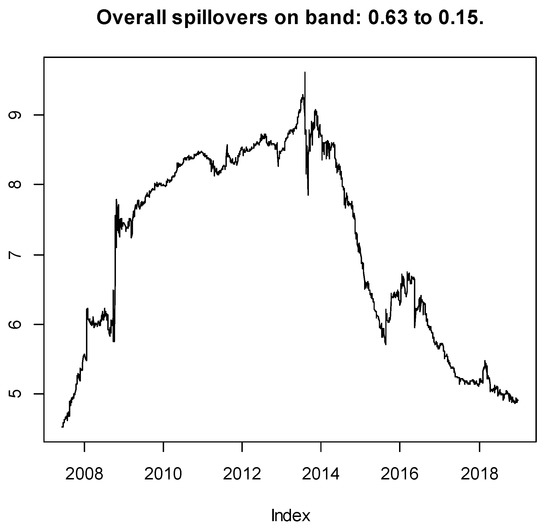
Figure 4.
Overall return spillovers of rolling sample corresponding to the frequency band from 1 week to 1 month.
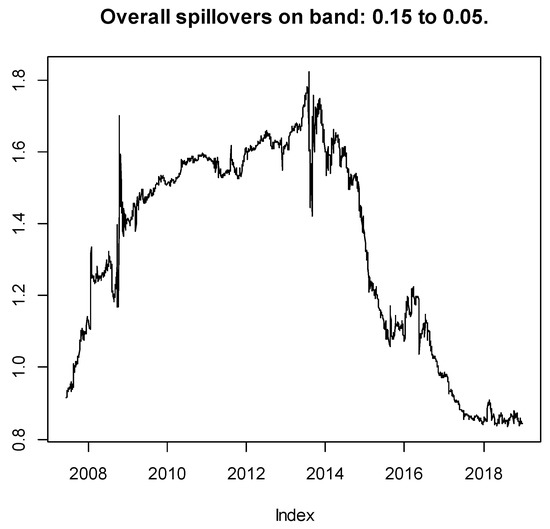
Figure 5.
Overall return spillovers of rolling sample corresponding to the frequency band from 1 month to 1 quarter.
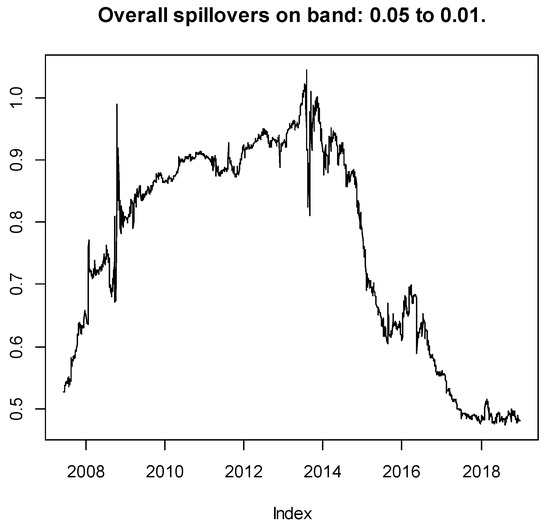
Figure 6.
Overall return spillovers of rolling sample corresponding to the frequency band from 1 quarter to 1 year.
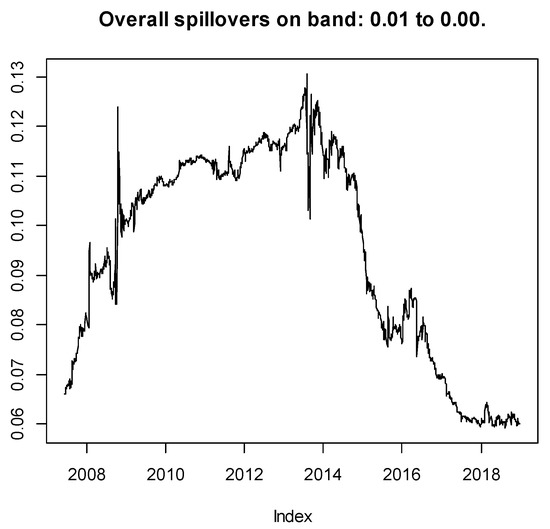
Figure 7.
Overall return spillovers of rolling sample corresponding to the frequency band longer than 1 year.
Figure 8 presents the overall volatility spillovers of rolling sample in time domain. Some similarities of the overall volatility spillover dynamics to the overall return spillover dynamics could be barely found: before 2011, the overall volatility spillovers fluctuated to climb up; during the Subprime Crisis, the overall volatility spillovers rapidly increased; during the period from 2011 to 2015, the overall volatility spillovers rose up first and went down after vibrated with high amplitudes; since 2017, the overall volatility spillovers regained the vibrating uptrend. Before 2011, the centroid of overall return spillovers was going up. However, after 2011, the centroid went down slowly.
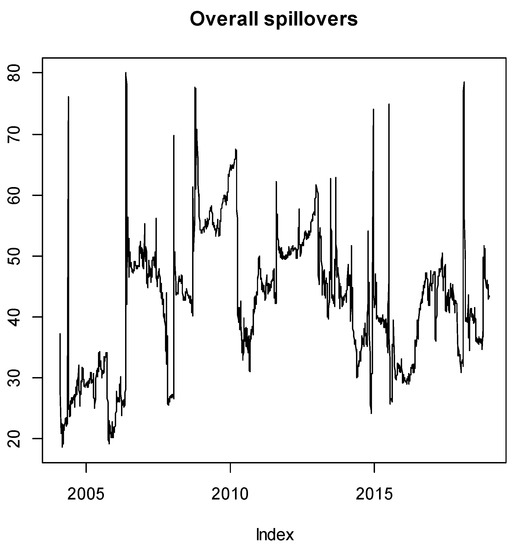
Figure 8.
Overall volatility spillovers of rolling sample: time domain.
Figure 9, Figure 10, Figure 11, Figure 12 and Figure 13 reveal the overall volatility spillovers of rolling sample in frequency domain. The dynamics of overall volatility spillovers in the frequency band corresponding to the period from 1 day to 1 week were very similar to those in the frequency band corresponding to the period from 1 week to 1 month where the general tendency kept rising and the overall volatility spillovers significantly strengthened during the Subprime Crisis. In the medium term (from 1 month to 1 quarter), the tendency of overall volatility spillovers was not obvious, whereas the amplitude was relatively high. The intrinsic tendency of overall volatility spillover dynamics in the frequency band corresponding to the periods from 1 quarter to 1 year and 1 year above was very similar to that implied in the overall return spillovers in time domain.
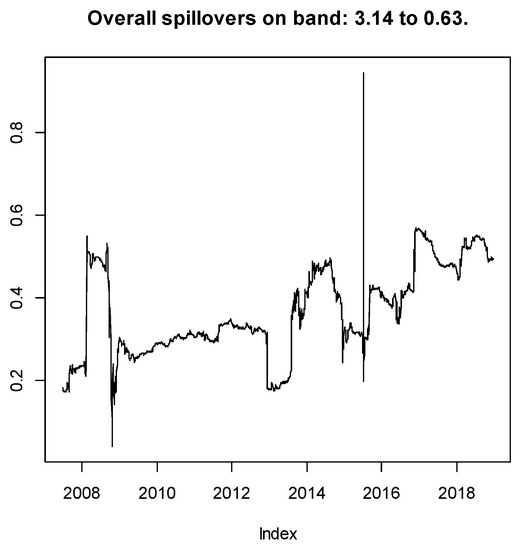
Figure 9.
Overall volatility spillovers of rolling sample corresponding to the frequency band from 1 day to 1 week.
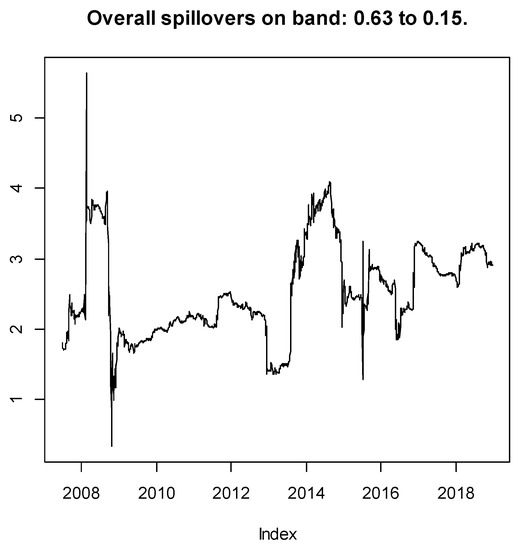
Figure 10.
Overall volatility spillovers of rolling sample corresponding to the frequency band from 1 week to 1 month.
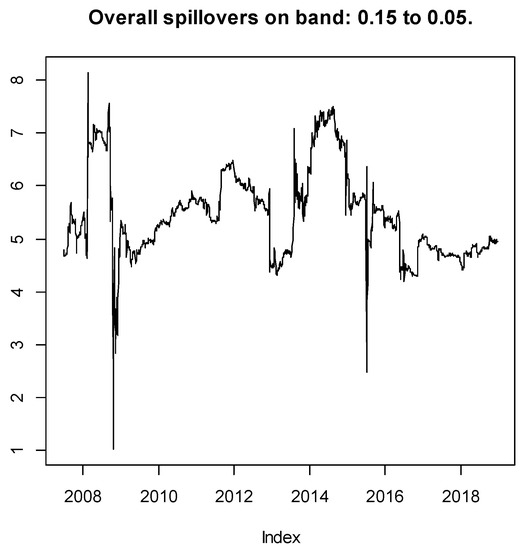
Figure 11.
Overall volatility spillovers of rolling sample corresponding to the frequency band from 1 month to 1 quarter.
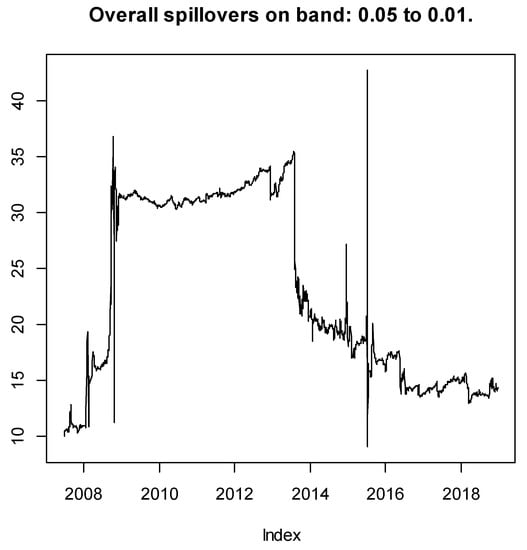
Figure 12.
Overall volatility spillovers of rolling sample corresponding to the frequency band from 1 quarter to 1 year.
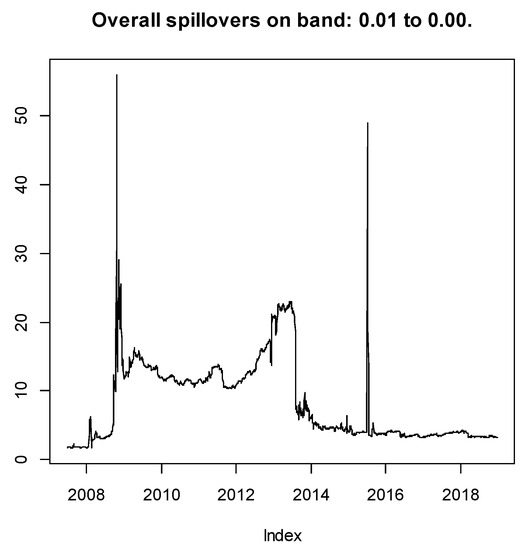
Figure 13.
Overall volatility spillovers of rolling sample corresponding to the frequency band longer than 1 year.
5.3. Conditioning and Dynamics II: The Rolling-Sample Net Spillover Analysis
Figure 14 illustrates the net return spillovers of rolling sample in time domain. In most time, Brazil’s, Russia’s and South Africa’s stock markets received net spillovers from others, while China’s and India’s stock markets transmitted net spillovers to others. Brazil’s and China’s stock markets were the most influential receiver and transmitter, respectively. In addition, there were several identified impulses whose occurrence dates revealing no significant regularities were not the same.
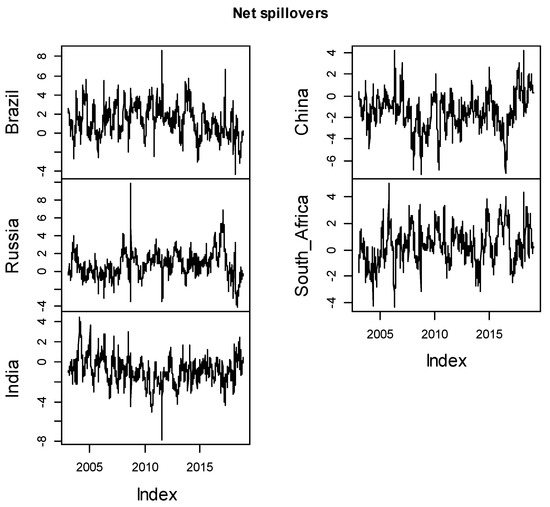
Figure 14.
Net return spillovers of rolling sample: time domain.
Figure 15, Figure 16, Figure 17, Figure 18 and Figure 19 depict the net return spillovers of rolling sample in frequency domain. The net return spillover dynamics of Russia’s stock market in the frequency band corresponding to the period from 1 day to 1 week behaved just like the overall spillover dynamics, which means Russia’s stock market dominated the BRICS stock markets and should be paid more attention to no matter for short-term investment or regulation. The dynamics of net return spillovers in the frequency bands other than that corresponding to the period from 1 day to 1 week demonstrated part of similarities to some extent. In comparison, the low-frequency (longer than 1 week) dynamics of net return spillovers of Russia’s and South Africa’s stock markets and their high-frequency (1 day to 1 week) dynamics showed some opposite characteristics, which implies that an uptrend of net return spillovers in the short term was usually accompanied by an downtrend of net return spillovers in the long term.
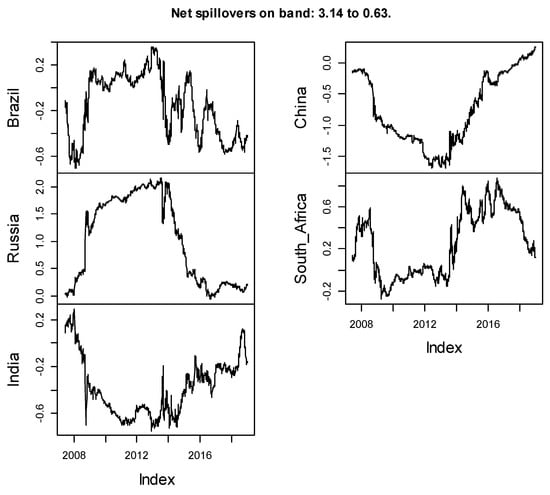
Figure 15.
Net return spillovers of rolling sample corresponding to the frequency band from 1 day to 1 week.
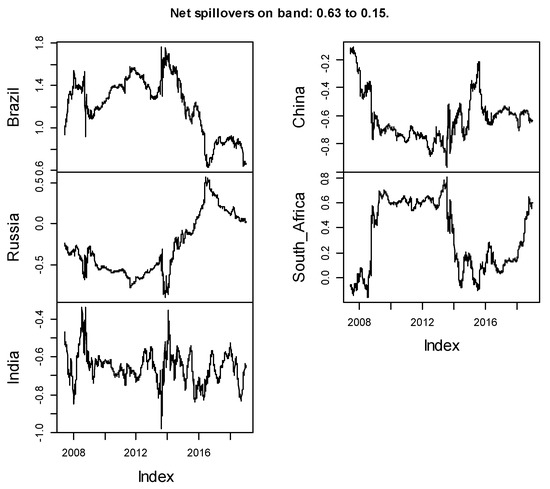
Figure 16.
Net return spillovers of rolling sample corresponding to the frequency band from 1 week to 1 month.
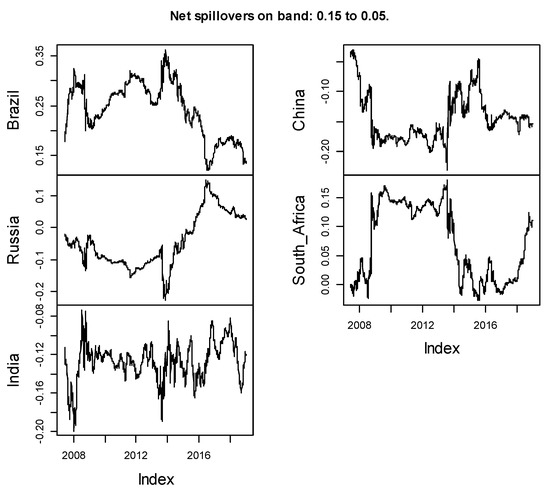
Figure 17.
Net return spillovers of rolling sample corresponding to the frequency band from 1 month to 1 quarter.
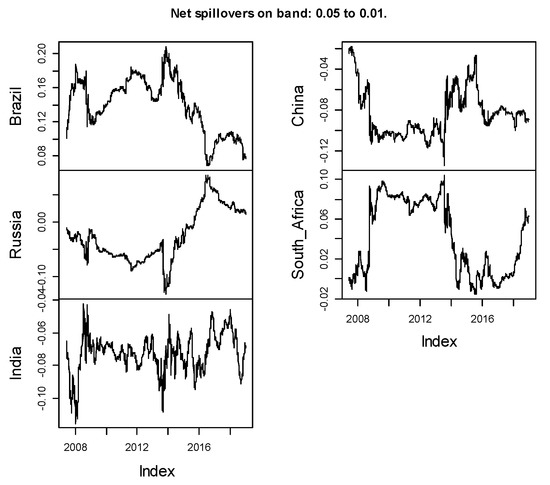
Figure 18.
Net return spillovers of rolling sample corresponding to the frequency band from 1 quarter to 1 year.
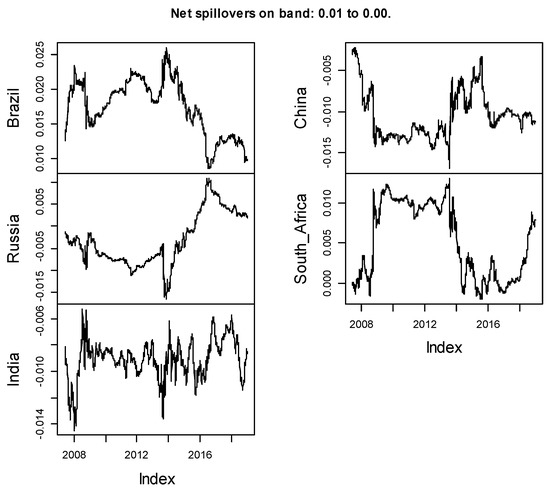
Figure 19.
Net return spillovers of rolling sample corresponding to the frequency band longer than 1 year.
Figure 20 presents the net volatility spillovers of rolling sample in time domain. Although no remarkable trends and clustering could be identified from an overall point of view, some local features were relatively obvious: during the Subprime Crisis, the net volatility spillovers of Russia’s stock market kept positive for about 2 to 3 quarters, which implies that Russia’s stock market was heavily influenced by other markets; from the first half of 2011 to 2012, a positive impulse of the net volatility spillovers in Brazil’s stock market lasting for about 2 to 3 quarters could be identified, which means Brazil’s stock market was an important spillover receiver during this time; since 2016, a fluctuated uptrend in the net volatility spillovers of India’s stock market became very clear, which illustrates that India’s stock market was more and more influenced by other markets.
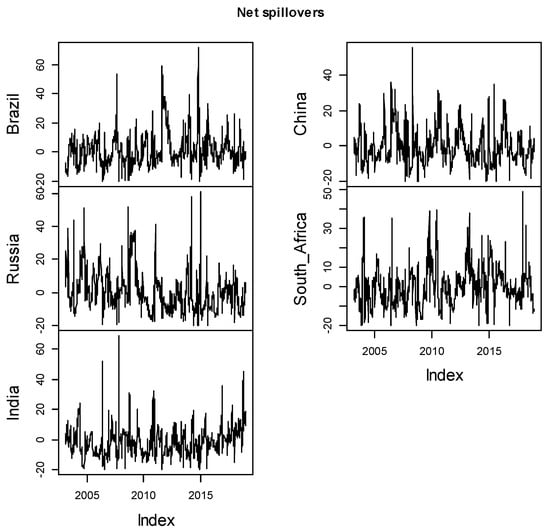
Figure 20.
Net volatility spillover of rolling sample: time domain.
Figure 21, Figure 22, Figure 23, Figure 24 and Figure 25 manifest the net volatility spillovers of rolling sample in frequency domain. Although the basic tendencies implied in the net volatility spillovers in frequency domain other than that corresponding to the period from 1 day to 1 week showed some similarities, no opposite features as found in net return spillovers could be confirmed.
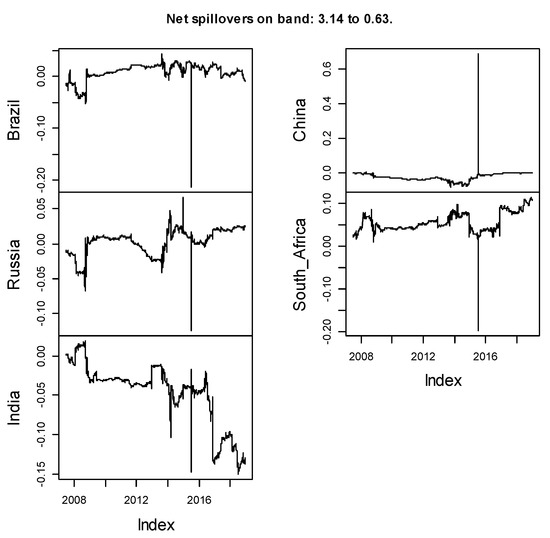
Figure 21.
Net volatility spillovers of rolling sample corresponding to the frequency band from 1 day to 1 week.
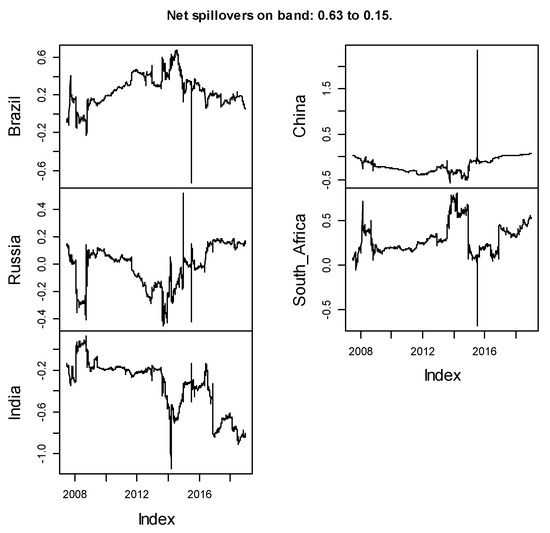
Figure 22.
Net volatility spillovers of rolling sample corresponding to the frequency band from 1 week to 1 month.
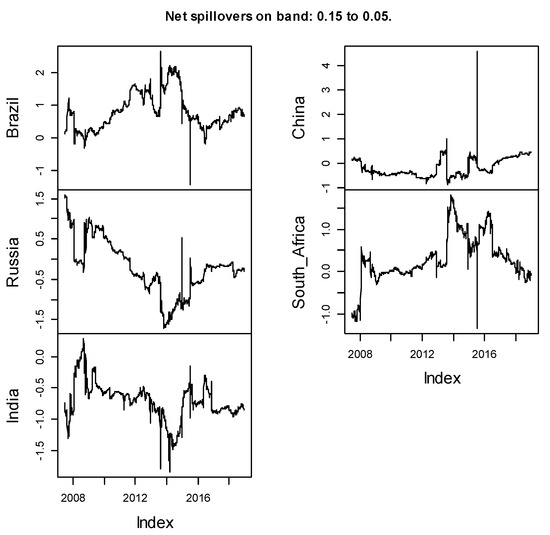
Figure 23.
Net volatility spillovers of rolling sample corresponding to the frequency band from 1 month to 1 quarter.
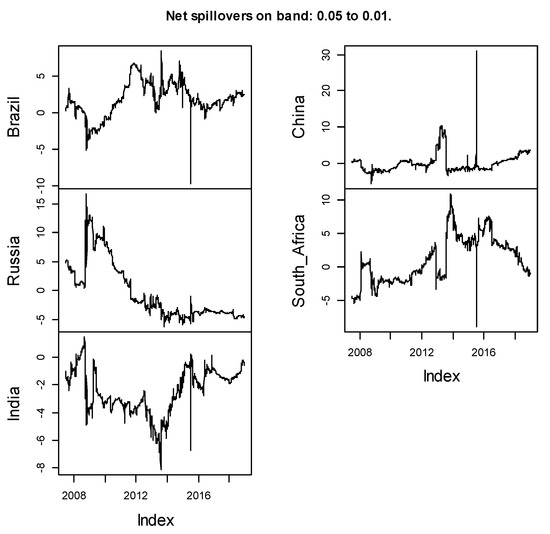
Figure 24.
Net volatility spillovers of rolling sample corresponding to the frequency band from 1 quarter to 1 year.
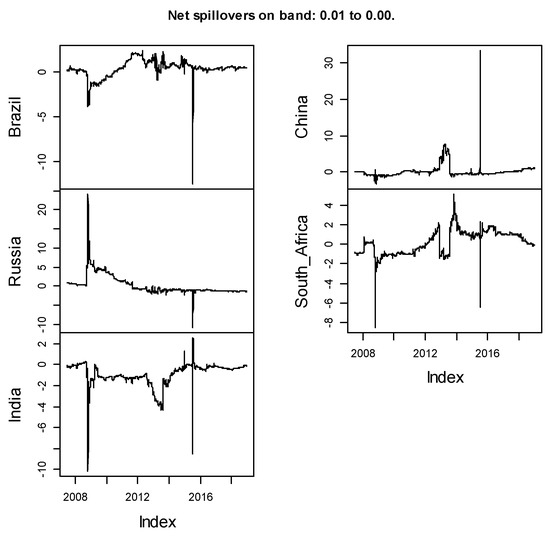
Figure 25.
Net volatility spillovers of rolling sample corresponding to the frequency band longer than 1 year.
In addition, compared with return spillovers, volatility spillovers tended to exhibit sharp jumps more frequently. As Baker et al. (2015) point out, this is probably because jumps caused by non-policy events (e.g., macroeconomics news) lead to higher future stock volatility.
5.4. Conditioning and Dynamics III: The Rolling-Sample Pairwise Spillover Analysis
Figure 26 shows the pairwise return spillovers of rolling sample in time domain. In general, most net pairwise return spillovers of Brazil’s stock market were negative, which implies that Brazil’s stock market received net return spillovers from other markets in most time. Certainly, in some local specific periods, positive net pairwise return spillovers also showed up, which means Brazil’s stock market transmitted net return spillovers to others occasionally. China’s and India’s stock markets transmitted net return spillover to South Africa’s stock market and net pairwise return spillover dynamics between China’s and South Africa’s stock markets showed some likeness to those between India’s and South Africa’s stock markets. In most time, China’s stock market transmitted net return spillovers to Russia’s and India’s stock markets.
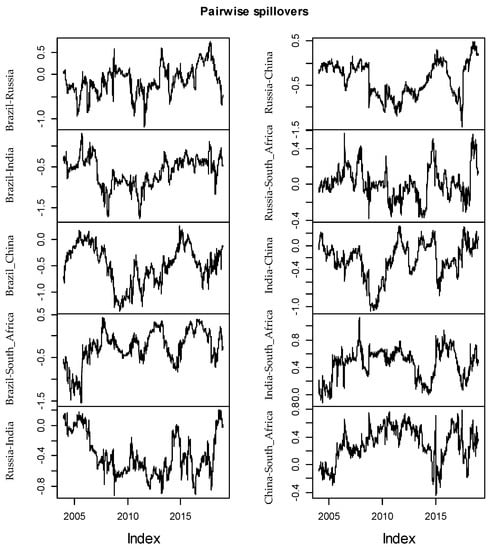
Figure 26.
Pairwise return spillovers of rolling sample: time domain.
Figure 27, Figure 28, Figure 29, Figure 30 and Figure 31 illustrate the net pairwise return spillovers of rolling sample in frequency domain. The most striking feature is that the dynamics of net pairwise return spillovers in the frequency bands corresponding to the periods from 1 week to 1 month, from1 month to 1 quarter, from 1 quarter to 1 year and longer than 1 year were very similar to each other. Moreover, the dynamics of net return spillovers between Brazil’s and Russia’s stock markets showed some likeness to the overall return spillover dynamics.
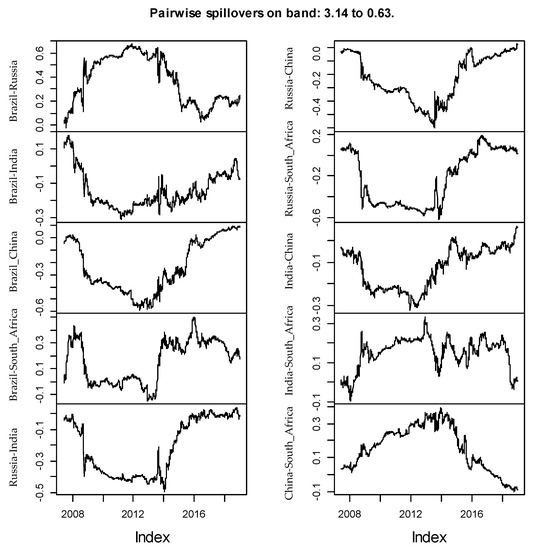
Figure 27.
Pairwise return spillovers of rolling sample corresponding to the frequency band from 1 day to 1 week.
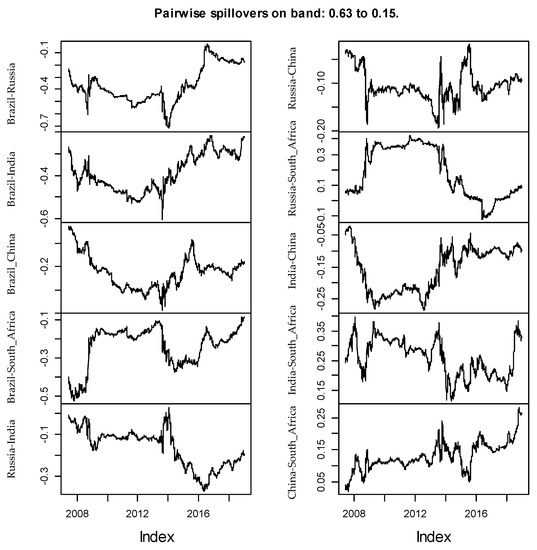
Figure 28.
Pairwise return spillovers of rolling sample corresponding to the frequency band from 1 week to 1 month.

Figure 29.
Pairwise return spillovers of rolling sample corresponding to the frequency band from 1 month to 1 quarter.
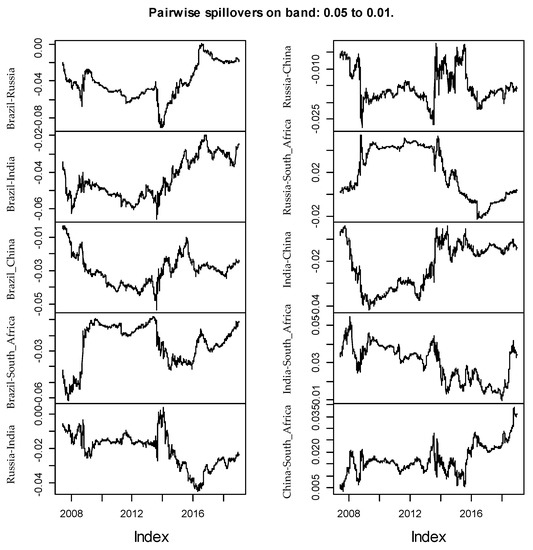
Figure 30.
Pairwise return spillovers of rolling sample corresponding to the frequency band from 1 quarter to 1 year.
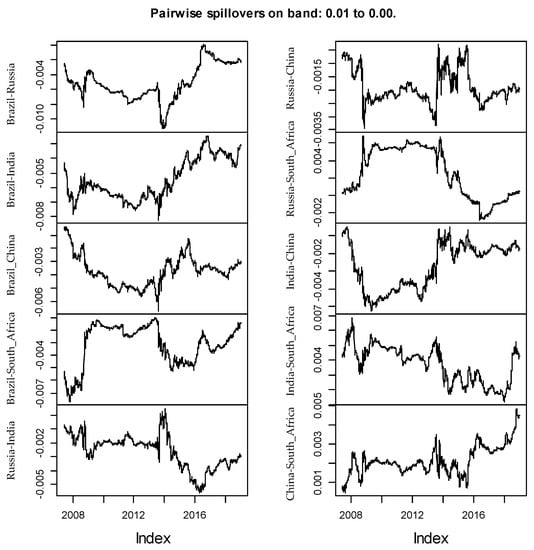
Figure 31.
Pairwise return spillovers of rolling sample corresponding to the frequency band longer than 1 year.
In the frequency band corresponding to the period from 1 day to 1 week, some similarities and differences compared with those findings in time domain could be easily found: in terms of similarities, Brazil’s stock market still received net return spillovers from India’s and China’s stock markets with similar fluctuation tendencies; besides, China’s stock market transmitted net return spillovers to South Africa’s stock market; in terms of differences, Brazil’s stock market was no longer a receiver of net pairwise return spillover from Russia’s stock market but became a transmitter. Meanwhile, Russia’s stock market received net return spillovers from India’s and China’s stock markets.
In other frequency bands, Brazil’s stock market was still a receiver of net pairwise return spillovers. India’s stock market transmitted a net return spillover to Russia’s stock market. China’s stock market transmitted net return spillovers to India’s, Russia’s and South Africa’s stock markets. India’s stock market transmitted a net return spillover to South Africa’s stock market.
Figure 32 presents the net pairwise volatility spillovers of rolling sample in time domain. Although no obvious trends and cyclicity could be identified, some style features were still easy to find. First, during Europe’s Sovereign Debt Crisis, Russia’s stock market was the receiver of net pairwise volatility spillovers, which is easy to understand. As the only one in the BRICS who lied in the storm center of the Sovereign Debt Crisis, Russia’s stock market acted very sensitively to other markets and was easily influenced by the volatility from others. Second, haunted by her weak economy in 2012, Brazil’s stock market was easily infected by rumors and shocks and, thus, received net volatility spillovers from others.
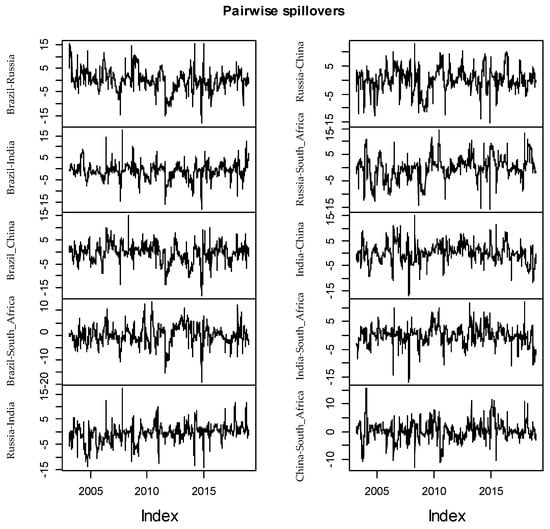
Figure 32.
Pairwise volatility spillovers of rolling sample: time domain.
Figure 33, Figure 34, Figure 35, Figure 36 and Figure 37 demonstrate the net pairwise volatility spillovers of rolling sample in frequency domain. The most attractive feature is that the intrinsic tendencies of net pairwise volatility dynamics showed some similarities, especially those in the frequency bands corresponding to the periods from 1 month to 1 quarter, from 1 quarter to 1 year and longer than 1 year. To a large extent, net pairwise volatility spillovers of rolling sample in frequency domain supported those findings of full sample in frequency domain.
Figure 33.
Pairwise volatility spillovers of rolling sample corresponding to the frequency band from 1 day to 1 week.
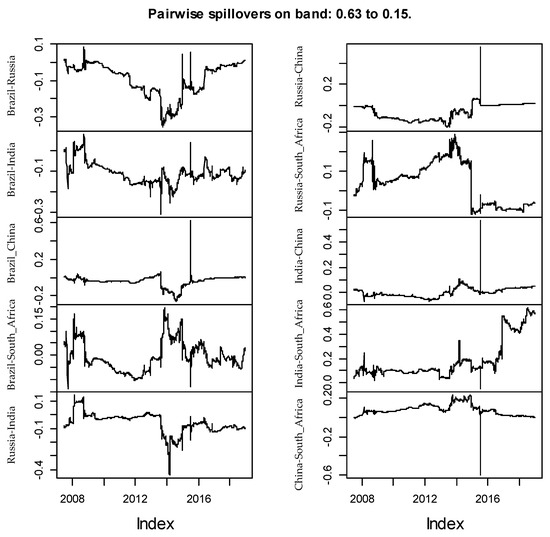
Figure 34.
Pairwise volatility spillovers of rolling sample corresponding to the frequency band from 1 week to 1 month.
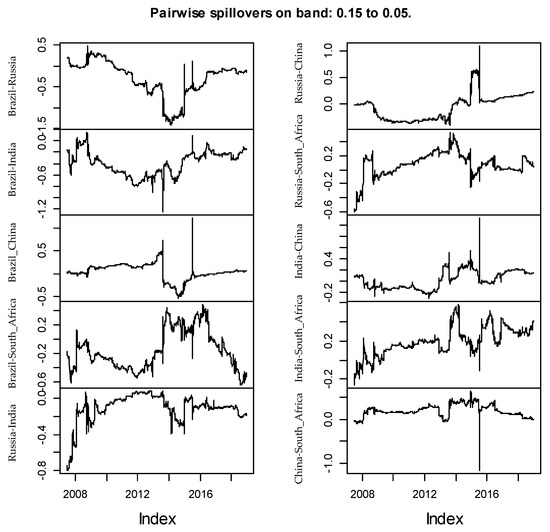
Figure 35.
Pairwise volatility spillovers of rolling sample corresponding to the frequency band from 1 month to 1 quarter.
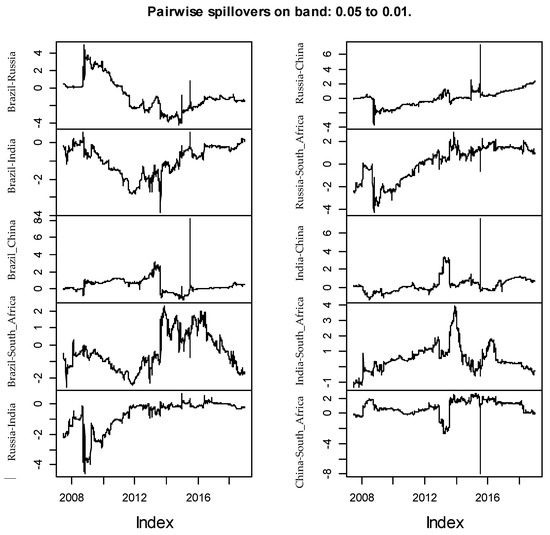
Figure 36.
Pairwise volatility spillovers of rolling sample corresponding to the frequency band from 1 quarter to 1 year.
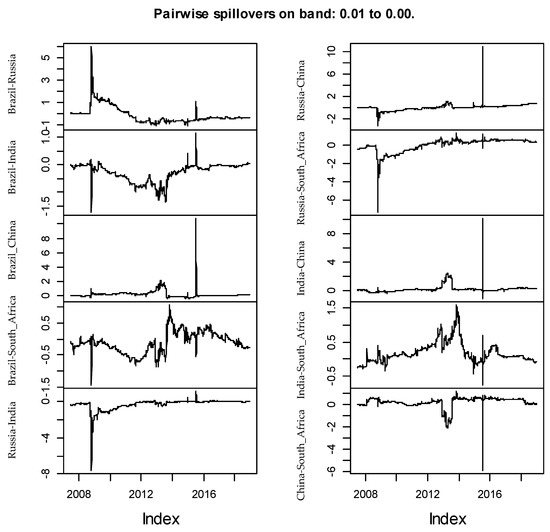
Figure 37.
Pairwise volatility spillovers of rolling sample corresponding to the frequency band longer than 1 year.
It is worth noting that the pairwise spillovers revealed the same changing features with frequencies as those in overall spillovers, which are return spillovers declined with the drop of frequencies, while volatility spillovers grew with the decline in frequencies. What we found is consistent with Engle et al. (2013) and easy to understand: short-term factors, or short-term exogenous shock, may result in the co-movement of stock markets, which indicates higher high-frequency return spillovers; however, it is economic fundamentals whose variation needs a relatively long time to show up that mainly determine the stock market volatility in the long term, which explains stronger low-frequency volatility linkages.
In fact, the net pairwise spillovers have important implications. In terms of portfolio allocation/diversification and risk management, net pairwise spillover should be paid more attention to by portfolio managers and arbitragers. Net pairwise spillovers in frequency domain provided new thoughts for portfolio managers who aim at allocating stock assets across the BRICS markets. Due to the fact that diversification opportunities are different in different frequencies (Tiwari et al. 2018). Based on the frequency decomposition of net pairwise spillover, investors are finally capable of accomplish more accurate portfolio rebalance in accordance with their differing expectations as well as disparate frequency and pace of daily trading.
6. Conclusions
We have comprehensively explored the stock market spillovers of returns and volatility among the BRICS not only in time domain but also in frequency domain. Within the framework of a generalized VAR consisting of five leading emerging stock market indices, 100-step-ahead forecasting error variance decomposition was employed to construct the continuously varying spillover index in time domain.
In contrast to the previous research about stock market spillovers among the BRICS, the aggregated time domain spillover was decomposed into five different frequency domain spillovers corresponding to the periods from 1 day to 1 week, from 1 week to 1 month, from 1 month to 1 quarter, from 1 quarter to 1 year and 1 year above.
The most interesting finding is that return spillovers significantly declined with the drop of frequencies, while volatility spillovers grew with the decline in frequencies. The high-frequency (corresponding to the period within 1 week) return spillover as well as low-frequency (corresponding to the period above 1 quarter) volatility spillover contributed most to the total spillover. Analyses of both full sample and rolling sample confirmed this intriguing finding. In practice, with the development of information technology, such as 5G, as well as the application of computer-aided trading, not only the information transmission goes faster but also the portfolio rebalancing process becomes more and more frequent. Thus, short-term high-frequency return spillover across stock markets in the BRICS should be paid close attention to. As for volatility spillovers, due to the fact that not many volatility derivative tools for the BRICS markets have been developed, the linkage of volatilities still need time to accumulate, and thus, long-term low-frequency volatility spillover is more important. In addition, diversification opportunities are different in different frequencies, as pointed out by Tiwari et al. (2018).
Another important finding is that the dynamics of spillovers were heavily influenced by crucial systematic risk events, such as the Subprime Crisis, Europe’s Sovereign Debt Crisis and even quantitative easing, even though there was no general pattern or universal law for the influence of risk events on overall, net and pairwise spillovers. Taking the overall return spillovers, for example, some segmented characteristics were easy to find: before the Subprime Crisis, the overall return spillovers fluctuated to climb up; during the Subprime Crisis, the overall return spillovers zoomed up and the maximum peak happened in this time; during the period from 2011 to 2015, the overall return spillovers descended with fluctuations; during the period from 2016 to 2017, the overall return spillovers oscillated violently, with the situation rising up first and going down after; since 2018, the overall return spillovers picked up the vibrating uptrend again. It is worth noting that there was no general pattern or universal law for the influence of risk events on overall, net and pairwise spillovers.
Moreover, from the perspective of identifying the systematic important stock markets, China’s stock market and Russia’s stock market were probably influential spillover sources for return linkage and volatility connectedness among the BRICS markets, respectively. In terms of market integration, the magnitude of spillover has important meanings. If the spillover is high, the BRICS stock market system will be heavily infected by fluctuations and shocks. The authorities have to take various measures to smooth the negative effect of external shocks. The policy combination should keep a close watch on frequency-specific risk sources. The coordination of international regulatory policies about stock markets in the BRICS should be more oriented to neutralize the negative effects of short-term return spillover and long-term volatility spillover.
Furthermore, as many scholars consider the spillover effect across different markets, quantifying the portfolio benefits of diversification is an important extension. We will leave it for the future work.
Funding
This research was funded by the National Social Science Funds of China (20BTJ015).
Institutional Review Board Statement
Not applicable.
Informed Consent Statement
Not applicable.
Data Availability Statement
All data came from the Wind Financial Terminal, a mainland China’s leading financial database.
Acknowledgments
The author would like to thank all anonymous referees and the editor for their valuable suggestions.
Conflicts of Interest
The authors declare no conflict of interest.
References
- Antonakakis, Nikolaos. 2012. Exchange return co-movements and volatility spillovers before and after the introduction of euro. Journal of International Financial Markets, Institutions and Money 22: 1091–109. [Google Scholar] [CrossRef]
- Baker, Scott, Nicholas Bloom, Steven J. Davis, and Marco Sammon. 2015. What triggers stock market jumps? Paper presented at the ASSA Meetings, Boston, MA, USA, January 4. [Google Scholar]
- Baruník, Jozef, and Tomáš Křehlík. 2018. Measuring the frequency dynamics of financial connectedness and systemic risk. Journal of Financial Econometrics 16: 271–96. [Google Scholar] [CrossRef]
- Bissoondoyal-Bheenick, Emawtee, Robert Brooks, Wei Chi, and Hung Xuan Do. 2018. Volatility spillover between the US, Chinese and Australian stock markets. Australian Journal of Management 43: 263–85. [Google Scholar] [CrossRef]
- Bubák, Vít, Evžen Kočenda, and Filip Žikeš. 2011. Volatility transmission in emerging European foreign exchange markets. Journal of Banking & Finance 35: 2829–41. [Google Scholar]
- Cronin, David. 2014. The interaction between money and asset markets: A spillover index approach. Journal of Macroeconomics 39: 185–202. [Google Scholar] [CrossRef]
- Dedi, Lidija, and Burhan F. Yavas. 2016. Return and volatility spillovers in equity markets: An investigation using various GARCH methodologies. Cogent Economics & Finance 4: 1266788. [Google Scholar]
- Diebold, Francis X., and Kamil Yilmaz. 2009. Measuring financial asset return and volatility spillovers, with application to global equity markets. The Economic Journal 119: 158–71. [Google Scholar] [CrossRef]
- Diebold, Francis X., and Kamil Yilmaz. 2012. Better to give than to receive: Predictive directional measurement of volatility spillovers. International Journal of Forecasting 28: 57–66. [Google Scholar] [CrossRef]
- El Ghini, Ahmed, and Youssef Saidi. 2017. Return and volatility spillovers in the Moroccan stock market during the financial crisis. Empirical Economics 52: 1481–504. [Google Scholar] [CrossRef]
- Engle, Robert F., Eric Ghysels, and Bumjean Sohn. 2013. Stock market volatility and macroeconomic fundamentals. Review of Economics and Statistics 95: 776–97. [Google Scholar] [CrossRef]
- Engsted, Tom, and Thomas Q. Pedersen. 2014. Bias-Correction in Vector Autoregressive Models: A Simulation Study. Econometrics 2: 45–71. [Google Scholar] [CrossRef]
- Eun, Cheol S., and Sangdal Shim. 1989. International transmission of stock market movements. Journal of Financial and Quantitative Analysis 24: 241–56. [Google Scholar] [CrossRef]
- Fang, Yi, Zhongbo Jing, Yukun Shi, and Yang Zhao. 2021. Financial spillovers and spillbacks: New evidence from China and G7 countries. Economic Modelling 94: 184–200. [Google Scholar] [CrossRef]
- Gamba-Santamaria, Santiago, Jose Eduardo Gomez-Gonzalez, Jorge Luis Hurtado-Guarin, and Luis Fernando Melo-Velandia. 2017. Stock market volatility spillovers: Evidence for Latin America. Finance Research Letters 20: 207–16. [Google Scholar] [CrossRef]
- Hamao, Yasushi, Ronald W. Masulis, and Victor Ng. 1990. Correlations in price changes and volatility across international stock markets. The Review of Financial Studies 3: 281–307. [Google Scholar] [CrossRef]
- Hung, Ngo Thai. 2019. Return and volatility spillover across equity markets between China and Southeast Asian countries. Journal of Economics, Finance and Administrative Science 24: 66–81. [Google Scholar] [CrossRef]
- Jebran, Khalil, Shihua Chen, Irfan Ullah, and Sultan Sikandar Mirza. 2017. Does volatility spillover among stock markets varies from normal to turbulent periods? Evidence from emerging markets of Asia. The Journal of Finance and Data Science 3: 20–30. [Google Scholar] [CrossRef]
- Jiang, Junhua, Vanja Piljak, Aviral Kumar Tiwari, and Janne Äijö. 2019. Frequency volatility connectedness across different industries in China. Finance Research Letters 37: 101376. [Google Scholar] [CrossRef]
- Jiang, Yonghong, Jinqi Mu, He Nie, and Lanxin Wu. 2020. Time-frequency analysis of risk spillovers from oil to BRICS stock markets: A long-memory Copula-CoVaR-MODWT method. International Journal of Finance & Economics, 1–19. [Google Scholar] [CrossRef]
- Koop, Gary, M. Hashem Pesaran, and Simon M. Potter. 1996. Impulse response analysis in non-linear multivariate models. Journal of Econometrics 74: 119–47. [Google Scholar] [CrossRef]
- Liu, Tiantian, and Shigeyuki Hamori. 2020. Spillovers to Renewable Energy Stocks in the US and Europe: Are They Different? Energies 13: 3162. [Google Scholar] [CrossRef]
- Lütkepohl, Helmut. 2007. New Introduction to Multiple Time Series Analysis. Berlin and Heidelberg: Springer. [Google Scholar]
- Miyakoshi, Tatsuyoshi. 2003. Spillovers of stock return volatility to Asian equity markets from Japan and the US. Journal of International Financial Markets, Institutions and Money 13: 383–99. [Google Scholar] [CrossRef]
- Narayan, Paresh Kumar, Seema Narayan, and K. P. Prabheesh. 2014. Stock returns, mutual fund flows and spillover shocks. Pacific-Basin Finance Journal 29: 146–62. [Google Scholar] [CrossRef]
- Nguyen, Minh Kieu, and Dinh Nghi Le. 2021. Return Spillover from the US and Japanese Stock Markets to the Vietnamese Stock Market: A Frequency-Domain Approach. Emerging Markets Finance and Trade 57: 47–58. [Google Scholar] [CrossRef]
- Panda, Pradiptarathi, and M. Thiripalraju. 2018. Return and volatility spillovers among stock markets: BRICS countries experience. Afro-Asian Journal of Finance and Accounting 8: 148–66. [Google Scholar] [CrossRef]
- Pesaran, H. Hashem, and Yongcheol Shin. 1998. Generalized impulse response analysis in linear multivariate models. Economics Letters 58: 17–29. [Google Scholar] [CrossRef]
- Qarni, Muhammad Owais, and Saqib Gulzar. 2019. Intra-EMU and non-EMU, EU stock markets’ return spillover: Evidence from ESDC. Empirica 47: 543–77. [Google Scholar] [CrossRef]
- Raddant, Matthias, and Dror Y. Kenett. 2021. Interconnectedness in the global financial market. Journal of International Money and Finance 110: 102280. [Google Scholar] [CrossRef]
- Rogers, L. Christopher G., and Stephen E. Satchell. 1991. Estimating variance from high, low and closing prices. The Annals of Applied Probability 1: 504–12. [Google Scholar] [CrossRef]
- Rogers, Leonard CG, Stephen E. Satchell, and Y. Yoon. 1994. Estimating the volatility of stock prices: A comparison of methods that use high and low prices. Applied Financial Economics 4: 241–47. [Google Scholar] [CrossRef]
- Soydemir, Gökçe. 2000. International transmission mechanism of stock market movements: Evidence from emerging equity markets. Journal of Forecasting 19: 149–76. [Google Scholar] [CrossRef]
- Theodossiou, Panayiotis, and Unro Lee. 1993. Mean and volatility spillovers across major national stock markets: Further empirical evidence. Journal of Financial Research 16: 337–50. [Google Scholar] [CrossRef]
- Tiwari, Aviral Kumar, Juncal Cunado, Rangan Gupta, and Mark E. Wohar. 2018. Volatility spillovers across global asset classes: Evidence from time and frequency domains. The Quarterly Review of Economics and Finance 70: 194–202. [Google Scholar] [CrossRef]
- Tiwari, Aviral Kumar, Samia Nasreen, Muhammad Shahbaz, and Shawkat Hammoudeh. 2020. Time-frequency causality and connectedness between international prices of energy, food, industry, agriculture and metals. Energy Economics 85: 104529. [Google Scholar] [CrossRef]
- Wang, Xunxiao. 2020. Frequency dynamics of volatility spillovers among crude oil and international stock markets: The role of the interest rate. Energy Economics 91: 104900. [Google Scholar] [CrossRef]
- Wang, Yu, and Lei Liu. 2016. Spillover effect in Asian financial markets: A VAR-structural GARCH analysis. China Finance Review International 6: 150–76. [Google Scholar] [CrossRef]
- Xia, Tongshui, Chen-Xi Yao, and Jiang-Bo Geng. 2019. Dynamic and frequency-domain spillover among economic policy uncertainty, stock and housing markets in China. International Review of Financial Analysis 67: 101427. [Google Scholar] [CrossRef]
- Yang, Dennis, and Qiang Zhang. 2000. Drift-independent volatility estimation based on high, low, open, and close prices. The Journal of Business 73: 477–92. [Google Scholar] [CrossRef]
- Yang, Zihui, and Yinggang Zhou. 2016. Quantitative easing and volatility spillovers across countries and asset classes. Management Science 63: 333–54. [Google Scholar] [CrossRef]
- Yarovaya, Larisa, Janusz Brzeszczyński, and Chi Keung Marco Lau. 2016. Intra-and inter-regional return and volatility spillovers across emerging and developed markets: Evidence from stock indices and stock index futures. International Review of Financial Analysis 43: 96–114. [Google Scholar] [CrossRef]
- Zeng, Sheng, Xinchun Liu, Xiafei Li, Qi Wei, and Yue Shang. 2019. Information dominance among hedging assets: Evidence from return and volatility directional spillovers in time and frequency domains. Physica A: Statistical Mechanics and its Applications 536: 122565. [Google Scholar] [CrossRef]
- Zhang, Wenting, and Shigeyuki Hamori. 2021. Crude oil market and stock markets during the COVID-19 pandemic: Evidence from the US, Japan, and Germany. International Review of Financial Analysis 74: 101702. [Google Scholar] [CrossRef]
- Zhang, Yulian, Xie He, Tadahiro Nakajima, and Shigeyuki Hamori. 2020. Oil, Gas, or Financial Conditions-Which One Has a Stronger Link with Growth? The North American Journal of Economics and Finance 54: 101220. [Google Scholar] [CrossRef]
- Zhou, Xiangyi, Weijin Zhang, and Jie Zhang. 2012. Volatility spillovers between the Chinese and world equity markets. Pacific-Basin Finance Journal 20: 247–70. [Google Scholar] [CrossRef]
Publisher’s Note: MDPI stays neutral with regard to jurisdictional claims in published maps and institutional affiliations. |
© 2021 by the author. Licensee MDPI, Basel, Switzerland. This article is an open access article distributed under the terms and conditions of the Creative Commons Attribution (CC BY) license (http://creativecommons.org/licenses/by/4.0/).