Nationwide Desert Highway Assessment: A Case Study in China

Abstract
:
1. Introduction
2. Principle and Method for Desert Highway Assessment
2.1. Principles of Desert Highway Assessment
- Service principle: Desert highway assessment will serve the highway engineer in China. The objective of the assessment is clear, namely to provide the basic science data for balancing the highway construction and the protection of the natural environmental, to further promote the sustainable development of desert regions [10].
- Practicability principle: The desert highway assessment process can comprehensively reflect the natural characteristics. It studies the effect of natural environment factors on the highway construction from the viewpoint of a real highway engineer. At the same time it synthesizes the differences between desert highways and general highways with respect to the route design, subgrade, pavement, and protection works.
- Dialectical principle: All the factors, such as the sand physiognomy, sand strength, temperature annual difference, and the vegetation will affect the desert highway construction. They are related and correlative. The desert highway assessment divides the nationwide desert highway regions in China according to their similarity and the differences between natural factors. The regional divisions should not conflict with each other.
- Absolute consistency: Every natural unit forms along history little by little. The desert highway assessment should discuss the reason and process of the desert region and pave the way for regional division. Only under the absolute consistency principle, can the correlative consistency of the divided or united desert unit be guaranteed during the highway region division.
- Relative consistency: The relative consistency requires that the internal consistency should be maintained for the desert highway division. Different region unit levels are different in their consistency.
- Combination of comprehensive and dominant factors: Any desert region is combined with several natural geological factors. The desert highway assessment should pay attention to analyze their modes of interaction, to process these factors and to recognize the real discipline of the regional differences. At the same time, the dominant factor should be distinguished among all other factors. This principle is balanced between the comprehensive and dominant factor.
- Similar characteristics of highway engineering in desert regions: The principle of similar characteristics of highway engineering in desert regions is basic to define the indicators and level of highway desert assessment. The so-called highway engineering characteristics in desert regions are the general and global characteristics of all highway engineering under the effects of natural geological factors.
2.2. Methods for Desert Highway Assessment
- The balance between the comprehensive principle and the dominant factor principle: The comprehensive principle requires us to analyze and to combine all the factors for defining the assessment index, which affect the highway engineering in desert regions. Further the important factors are selected such as the sand dune height, the blown sand strength, the vegetation coverage ratio and the annual average temperature difference, which are keys for the construction, maintenance, and running management of highway engineering [11,12].
- The balance between the dominant indicator and the auxiliary indicators: For the desert highway assessment, there are several key factors to highway construction. It is impossible to apply all the factors for the highway desert division, which is also unnecessary. The dominant indicator uses the compromise mathematical function to express both the comprehensive character and the dominant character. The comprehensive state index of the desert highway is defined as the dominant indicator for region division. At the same time four auxiliary indicators are adopted to revise the division boundaries, which are defined as the sand dune height, the blown sand strength, the vegetation coverage ratio and the annual average temperature difference [13].
3. Index System of Highway Desert Assessment in China
3.1. The Definition of Important Indicators
- The sand dune height: The sand dune height is one of the most significant indicators for analyzing the physiognomy features of blown sand regions. It can reflect the time of formation of the desert physiognomy and the scale of the sand dune growth. Generally the longer the time of formation of the sand dune is, the more height the sand dune has, due to the sand movement and sand accumulation under wind for a long time. On the contrary, the newly grown sand dunes are short with less sand accumulation. The sand dune height can also reflect the active strength of sand dune movement. Under the same wind flow and natural situation, the height difference is dominant in the active strength of the sand dune movement.The sand dune height affects the route design, construction and the later management of the highway engineering operations. The sand dune height directly affects the route layout of the highway and at the same time causes blown sand damage to the highway. During the later running management and maintenance, it is more difficult to maintain the highway in the desert environment, so the effect of the sand dune height on the highway is crucial to recommend the route layout plan and protect the highway from the desert damage.The height of sand dunes is expressed by the average value of all sand dune heights in a region. According to the 1:25,000,000 digital elevation model in China, the sand dune height distribution is not uniform, however most sand dune heights are within a fixed range, so the average height of sand dunes in a region can be adopted to represent the wave distribution of sand dunes.
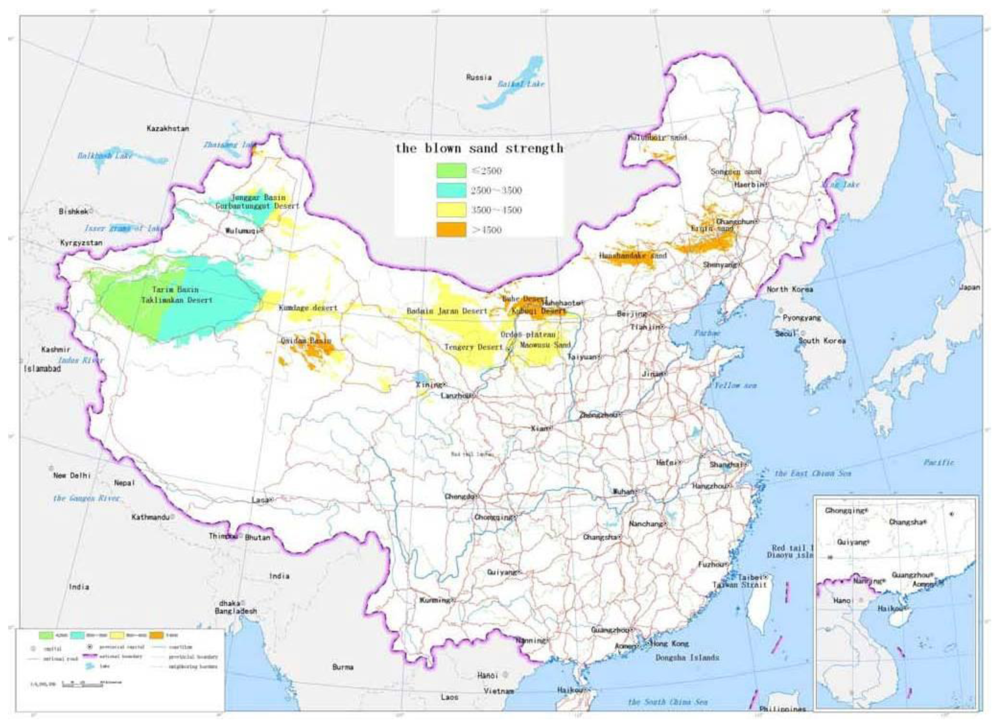
- The blown sand strength: The blown sand strength is defined as the cumulative velocity record of the blown sand during a rated time (month, season or year). It depends on the observation times and the observed value of the wind velocity every time, so its unit is m/(s·time unit). For the desert highway assessment in China, the time unit is 30 years and its unit is m/(s·year). The blown sand strength is one of the most important indicators for blown sand movement and is proportional to the wind velocity. It is crucial to the design of the desert highway and also to the subsequent management and maintenance. It will affect the route layout of the highway and causes desert damage. During the construction of highways in desert regions, more attention should be paid to the blown sand strength. It is defined by the sand diameter, the ground characteristics and the water content of the sand. The blown sand strength can indirectly reflect the wind velocity. This is the first time the blown sand strength is adopted as one of the indicators for desert highway assessment, which can direct the route layout of the highway and its latter running management and maintenance.
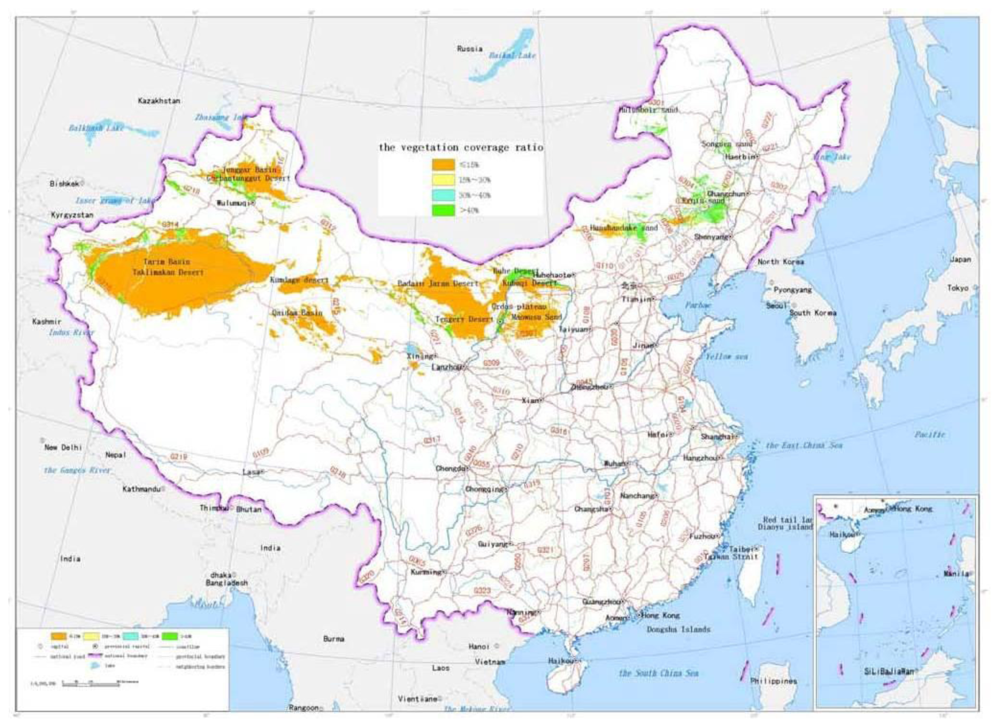
- The vegetation coverage ratio: Vegetation is a general term for the plant life of a region. The vegetation coverage ratio is defined as the percent of the planimetric area of the vegetation (leaves, branches and stems) on the statistical region area. In desert regions, vegetation is rare, so the ratio is low and in some desert regions there is even no vegetation. However, the vegetation coverage can reflect the stability of a sand dune. Furthermore it affects the design, construction and protection of the highway, so it is crucial to evaluate the effect of the vegetation on the highway construction, recommend the optimal route layout and build different level protective measures into the highway engineering plans.
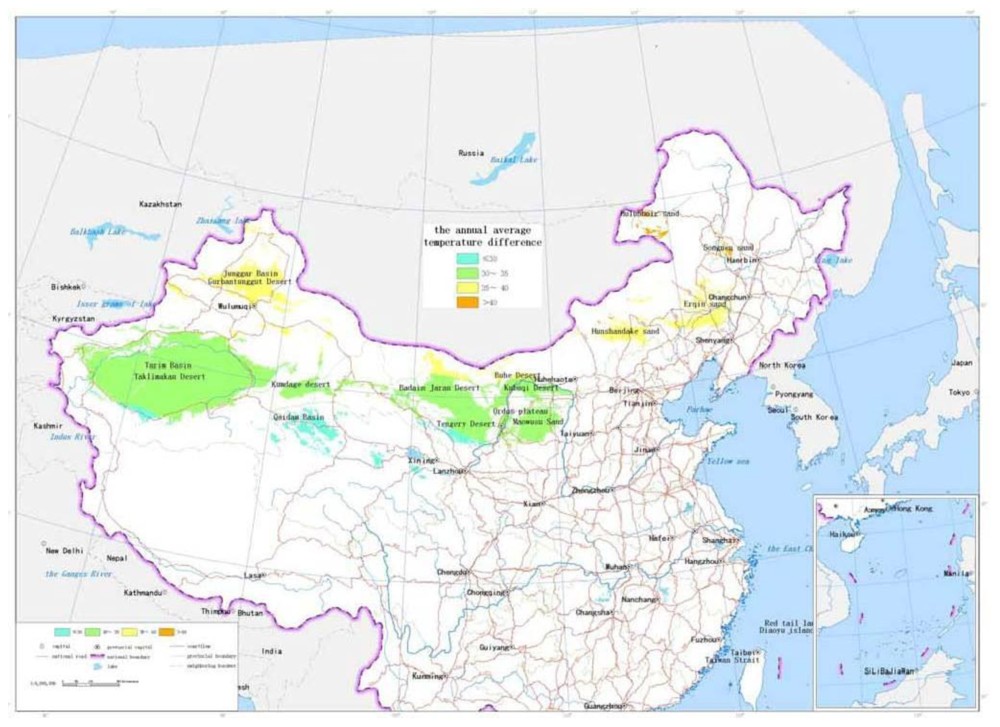
- The annual average temperature difference: The annual average temperature difference means the difference between the maximum and the minimum of the average annual temperature in a region. It reflects the climate effect on the highway construction. The highway will have a route layout exposed to the natural climate, which includes the temperature and rainfall. In a general region, with the periodical changes of the temperature, the moisture in the subgrade will undergo frost and thaw cycles, so there can be frost boiling damage, but in the desert regions the rainfall is rare, so the effect of the rainfall on the subgrade is small and the temperature changes affect the pavement more. The asphalt pavement can suffer fatigue cracking under repeated exposure to high and low temperature cycles. At the same time, the high temperatures will lead to the asphalt ageing. The characteristics of the asphalt and its mixtures are different under high or low temperature. The requirements for asphalt in desert regions are high because the differences between the maximum and minimum temperatures are large. The annual average temperature difference in desert region directly affects the structure of the highway and its pavement material selection.
3.2. Mathematical Equation
3.3. Calculation Process of the Four Auxiliary Indicators
- The sand dune height: The dedicated analysis tool for the sand dune height is developed based on the ArcInfo9.1 software and GIS module. The unit is selected as 5 kilometers square. Digital Elevation Model of 1:25 desert region in China are traversed one unit by one unit. The maximum value and average difference of elevation of every unit are calculated, which forms the distribution data of the sand dune height in China. According to Table 1, the scale value is calculated and the map of the sand dune height is drawn, as shown in Figure 2.
- The blown sand strength: The weather data from the local weather stations in the desert regions are collected. The cumulative annual average strength of blown sand was calculated for a 30 year period. With the software ArcInfo9.1 and its “Geostatistical Analysis” module, the spatial distribution of blown sand strength is analyzed by the Cregeen interpolation method [17], which borrows from the spatial variation theory. Further the isopleth map of the blown sand strength is drawn. The average strength of blown sand in every region unit can then be calculated. According to the calculated results and the criteria of Table 1, the level value of every region unit is obtained and the map of the blown sand strength is drawn, as shown in Figure 3.
- The vegetation coverage ratio: According to the 1:1,000,000 map of vegetation coverage in China, the percentage of vegetation coverage in every region unit can be calculated using the ArcInfo9 software. According to the calculated results and the criteria of Table 1, the level value of every region unit is obtained and the map of the vegetation coverage is formed, as shown in Figure 4.
- The annual average temperature difference: The weather data are collected from the local weather stations in the desert regions. The annual average temperature difference is also calculated for 30 years. The maximum and minimum annual average temperatures in every region unit are obtained. With the software ArcInfo9.1 and its “Geostatistical Analysis” module, the spatial distribution of the annual average temperature in every region unit is analyzed. Further the isopleth map of the annual average temperature difference is drawn. The temperature difference in every region unit can be calculated. According to the calculated results and the criteria of Table 1, the level value of every region unit is obtained and the map of the annual average temperature difference is formed, as shown in Figure 5.
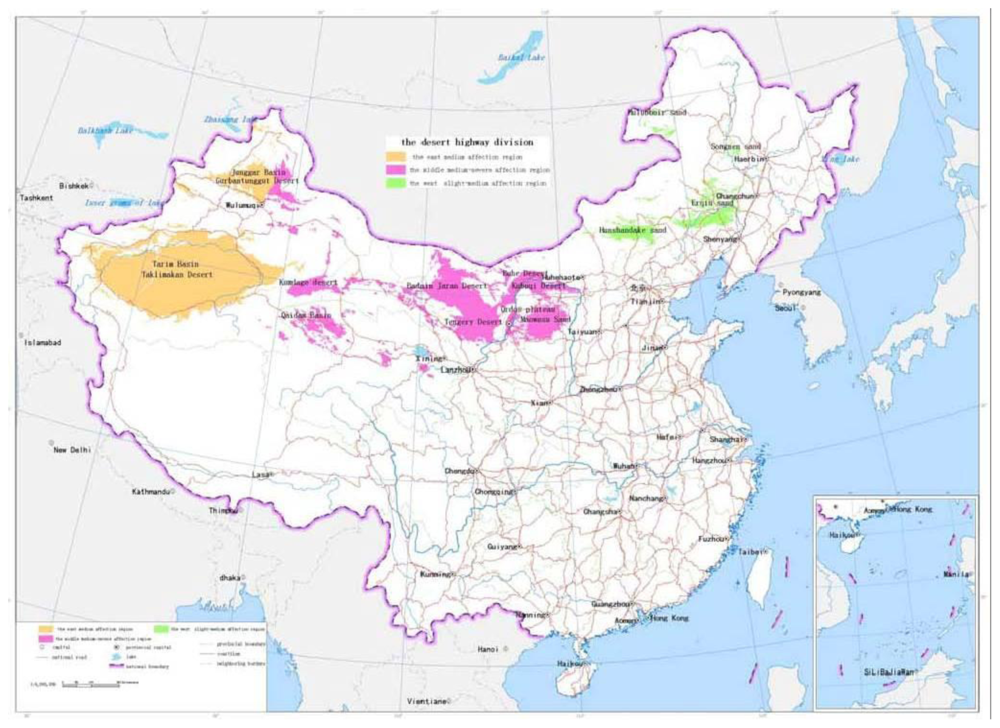
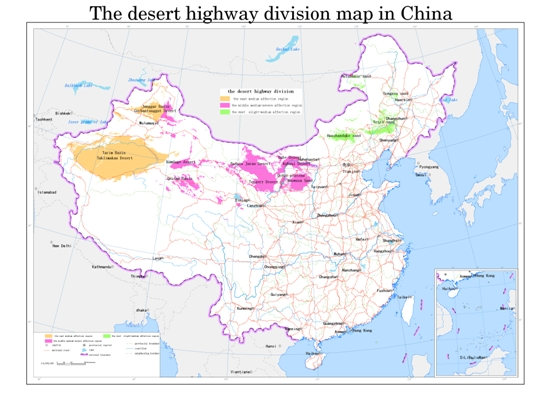
4. Natural Region Division Map for Desert Highway Assessment in China
5. Project Application
6. Conclusions
Acknowledgements
References
- Lamprey, HF. Report on the Desert Encroachment Reconnaissance in Northern Sudan; National Council for Research, Ministry of Agriculture, Food and Resources: Khartoum, Sudan, 1975. [Google Scholar]
- Mainguet, M. Desertification: Natural Background and Human Mismanagement; Springer: Berlin, Germany, 1994; p. 314. [Google Scholar]
- Food and Agriculture Organization of the United Nations/United Nations Environment Programme (FAO/UNEP), Provisional Methodology for Assessment and Mapping of Desertification; FAO: Rome, Italy, 1984; p. 84.
- Dong, Y. Study on the assessment of hazard degree and analysis of development trend of sandy desertification in China. J. Desert Res 1996, 16, 127–131. [Google Scholar]
- Del Valle, HF; Elissalde, NO; Gagliardini, DA. Desertification assessment and mapping in the arid and semi-arid regions of Patagonia (Argentina). Desertification Control Bull 1997, 31, 6–11. [Google Scholar]
- Food and Agriculture Organization of the United Nations/United Nations Environment Programme/Universidad de Chile. Centro Agricultura y Medio Ambiente (FAO/UNEP/AGRIMED), Unified Methodology for Assessing and Monitoring Desertification in Latin America: Indicators of Desertification; FAO/UNEP/AGRIMED: Santiago, Chile, 1998; p. 170, (mimeo).
- Zhu, Z; Chen, G. Sandy Desertification in China; Scientific Press: Beijing, China, 1994; p. 250. [Google Scholar]
- Wang, J; Dong, G; Li, W; Wang, L; Tang, H. Primary study on the multi-layer remote sensing information extraction of desertification land types by using decision tree technology. J. Desert Res 2000, 20, 243–247. [Google Scholar]
- Li, B. Specifications for Design of Highway Subgrades JTG D30-2004; Ministry of Communications of the People’s Republic of China, China Communication Press: Beijing, China, 2004. [Google Scholar]
- Wei, H; Wang, J; Xu, X; Ding, F. Analysis of grain size of different sand dunes types in Kumtag Desert. J Soil Water Conserv 2007, 21, 6–9. (in Chinese). [Google Scholar]
- Chen, JM; Menges, CH; Leblanc, SG. Globalmapping of foliage clumping index using multi-angular satellite data. Remote Sens. Environ 2005, 97, 447–457. [Google Scholar]
- Chopping, MJ; Su, L; Rango, A; Martonchik, J; Peters, D; Laliberte, A. Remote sensing of woody shrub cover in desert grasslands using MISR with a geometric-optical canopy reflectance model. Remote Sens. Environ 2007, 112, 19–34. [Google Scholar]
- Wen, X; Li, B; Zheng, Y; Zhang, D. Climate variability in the Salawusu River valley of the Ordos Plateau (Inner Mongolia, China) during marine Isotope Stage 3. J. Quat. Sci 2009, 24, 61–74. [Google Scholar]
- Yang, X; Liu, T. Palaeoenvironments in deserts of northwest China around 30 ka B.P. Quat Sci 2003, 23, 25–30, (in Chinese with English abstract). [Google Scholar]
- Yang, X; Liu, T; Xiao, H. Evolution of megadunes and lakes in the Badain Jaran Desert, Inner Mongolia, China during the last 31000 years. Quat. Int 2003, 104, 99–112. [Google Scholar]
- Chinese Committee for Implementing UN Convention to Combat Desertification (CCICCD), China Country Paper to Combat Desertification; China Forestry Publishing House: Beijing, China, 1997; p. 40.
- Yang, X; Zhang, K; Jia, B; Ci, L. Desertification assessment in China: An overview. J. Arid Environ 2005, 63, 517–531. [Google Scholar]


| Comprehensive characteristics state | Unit | Desertification intensity classification
| |||
|---|---|---|---|---|---|
| Slight | Medium | Severe | Extremely severe | ||
| 1 | 3 | 6 | 10 | ||
| Sand dune height(H) | m | <=2 | 2~20 | 20~60 | >60 |
| Vegetation coverage ratio (P) | % | >=40 | 40~30 | 30~15 | <15 |
| Blown sand strength (F) | m/(s·year) | <=2,500 | 2,500~3,500 | 3,500~4,500 | >4,500 |
| Annual average temperature difference (T) | °C | <=30 | 30~35 | 35~40 | >40 |
| Sand dune height | Vegetation coverage ratio | Blown sand strength | Annual average temperature difference | Total | |
|---|---|---|---|---|---|
| Contribution coefficient | 0.3 | 0.3 | 0.28 | 0.12 | 1 |
| Desert Comprehensive state index | ≤3 | 3~6 | 7~10 |
|---|---|---|---|
| Level of effect on highway construction | slight | medium | severe |
| Name | Main Criteria and index value | Range |
|---|---|---|
| I the east medium effect region | The comprehensive state index is within the region [0 6] and the region [4 6] is dominant. | Hulun Beir Sandy Land Nenjiang sandy land Horqin Sandy Land Hunshandake Sand Land |
| II the middle medium-severe effect region | The comprehensive state index is within the region [3 10] and the region [4 6] is dominant. | Mu Us Sandy Land Kubuqi Desert Ulan Bub Sandy Land Tengger Desert Badan Jilin desert Desert of Gansu Corridor Kumtag Desert Desert of Qaidam Basin Eastern of Gurbantunggute Desert |
| III the west slight-medium effect region | The comprehensive state index is within the region [0 6] and the region [0 3] is dominant. | Middle and Western of Gurbantunggute Desert Taklimakan Desert |
© 2011 by the authors; licensee MDPI, Basel, Switzerland This article is an open-access article distributed under the terms and conditions of the Creative Commons Attribution license (http://creativecommons.org/licenses/by/3.0/).
Share and Cite
Mao, X.; Wang, F.; Wang, B. Nationwide Desert Highway Assessment: A Case Study in China. Int. J. Environ. Res. Public Health 2011, 8, 2734-2746. https://doi.org/10.3390/ijerph8072734
Mao X, Wang F, Wang B. Nationwide Desert Highway Assessment: A Case Study in China. International Journal of Environmental Research and Public Health. 2011; 8(7):2734-2746. https://doi.org/10.3390/ijerph8072734
Chicago/Turabian StyleMao, Xuesong, Fuchun Wang, and Binggang Wang. 2011. "Nationwide Desert Highway Assessment: A Case Study in China" International Journal of Environmental Research and Public Health 8, no. 7: 2734-2746. https://doi.org/10.3390/ijerph8072734
APA StyleMao, X., Wang, F., & Wang, B. (2011). Nationwide Desert Highway Assessment: A Case Study in China. International Journal of Environmental Research and Public Health, 8(7), 2734-2746. https://doi.org/10.3390/ijerph8072734