Article

Overflowing Disparities: Examining the Availability of Litter Bins in New York City

by
Nadav L. Sprague
*,
Ariana N. Gobaud
,
Christina A. Mehranbod
,
Christopher N. Morrison
,
Charles C. Branas
and
Ahuva L. Jacobowitz
Department of Epidemiology, Mailman School of Public Health, Columbia University, New York, NY 10032, USA
*
Author to whom correspondence should be addressed.
Int. J. Environ. Res. Public Health 2022, 19(9), 5107; https://doi.org/10.3390/ijerph19095107
Submission received: 17 March 2022 / Revised: 17 April 2022 / Accepted: 19 April 2022 / Published: 22 April 2022

Abstract

:
In the 1980s, activists’ concerns about the disproportionate placements of landfills in low-income communities ignited the environmental justice movement. Today, similar issues of environmental injustice—the limited availability of litter bins across New York City (NYC) neighborhoods—remain unresolved. This study examines the association between NYC neighborhood income and litter bin availability. The NYC Department of Sanitation 2020 Litter Bin Inventory and archival measures of neighborhood composition and socioeconomic status were aggregated within NYC census tract neighborhoods. Multilevel Bayesian conditional autoregressive Poisson models estimated the prevalence rate ratio for counts of litter bins according to median household income in each census tract, accounting for spatial autocorrelation. Bivariate associations identified that census tracts with higher median household income had a greater prevalence of litter bins than census tracts with lower median household income; however, spatial autocorrelation attenuated the relationship between median household income and availability of litter bins. Further research is necessary to identify the spatially structured condition that accounted for the observed effect. The results warrant further investigation of both perceived and actual disparities in litter bin availability.

1. Introduction

While many studies have examined the environmental injustice issues surrounding waste management, none have investigated the disparities in litter bin distribution [1]. In the United States, waste management sites are more likely to be placed near Black and low-income communities [1,2]. Environmental health risks are associated with high exposure from working or living near waste management sites, such as landfills, incineration sites, and sites with hazardous waste [1,3,4]. Exposure to waste management sites is associated with adverse birth outcomes [5], respiratory issues [6], all cancers [1], and higher mortality [1]. In the 1980s, civil rights activists’ concerns about the disproportionate placement of landfills in low-income and Black communities sparked the environmental justice movement and related research [7].
Today, environmental justice concerns are being voiced about litter bin availability in New York City (NYC) [8]. In August of 2018, the New York City Sanitation Department (DSNY) removed 223 litter bins from Harlem, a neighborhood with a greater proportion of low-income residents [8,9]. Similar to the roots of the environmental justice movement, local residents and leaders raised sanitation and public health concerns associated with the removal of these litter bins [8]. Despite complaints, in July of 2020, DSNY faced budget cuts, resulting in increased concerns by Harlem residents about overflowing litter bins and litter in the streets [10,11].
Some studies have found that increased litter bin availability is associated with decreased litter in the streets [12,13,14]. One study that interviewed residents of Mexico City, Mexico (n = 300) found limited litter bin availability to be one of the four primary causes of street litter [13]. Another study conducted a systematic observation of individuals (n = 9757) in outdoor public locations across the United States and found that the presence of litter bins reduced individuals’ littering behaviors; in contrast, the presence of street litter increased individuals’ littering behaviors [15,16].
Disparities in litter bin availability pose a public health problem, as there are numerous and significant neighborhood health implications to excessive trash and street litter. First, litter attracts rodents, cockroaches, and other pests that may trigger asthmatic or allergic reactions [17,18]. They may also carry vector-borne diseases (such as rat-bite fever, salmonella, and leptospirosis) [17,18,19]. Second, litter is harmful to local flora, fauna, and overall ecological health [20]. Third, some studies suggest that street litter causes injuries such as punctures, tripping, loss of balance or control, and collisions [21]. Fourth, research also suggests that increased neighborhood litter may be associated with increased fear, perceived risk, and actual crime [22,23,24]. Increased street litter has also been linked to a decrease in both neighborhood park use and physical activity for adults [25,26]. Finally, litter in neighborhoods has a negative financial impact on the community, such as reducing home values and detracting potential customers from businesses [27,28].
Current concerns about the removal of litter bins from low-income communities in NYC make this research question both relevant and community influenced. This study is exploratory and novel as it is the first to examine environmental injustices associated with the limited availability of street litter bins. We will investigate the prevalence of street litter bins in NYC relative to neighborhood median household income using two models—a Multilevel Bayesian Poisson model and a Multilevel Bayesian model with the addition of a conditional autoregressive random effect. This paper innovatively examines the association between litter bin count and median household income, adjusting for relevant covariates.

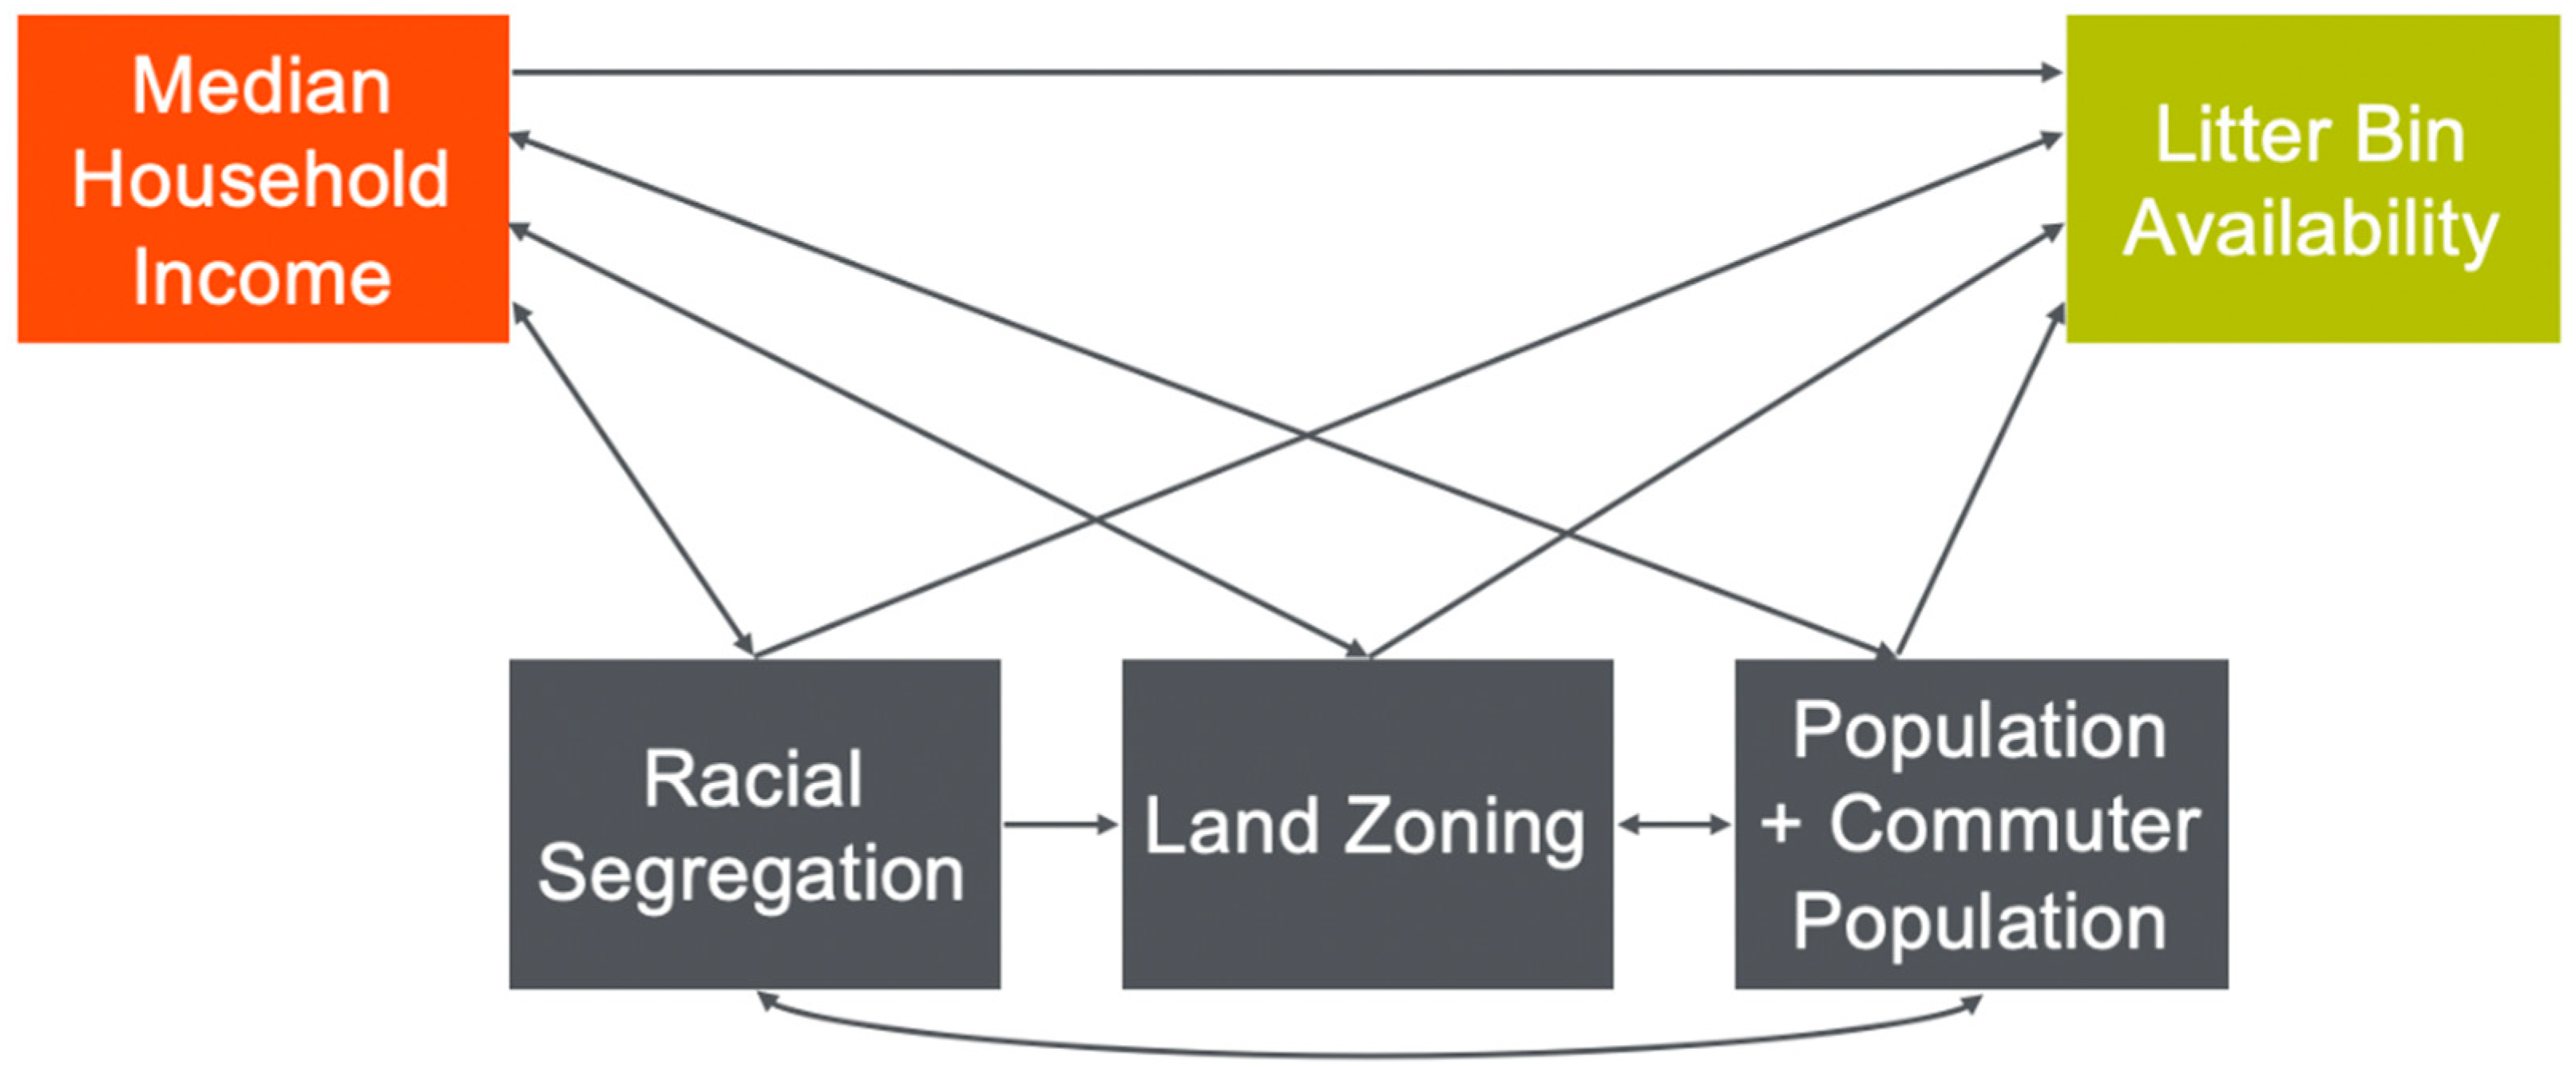
2. Theoretical Framework

We present our theoretical framework in Figure 1. Low-income communities have historically faced environmental justice issues more than their high-income counterparts, have less social capital, and have less available time to advocate for community-level environmental improvements [29,30,31]. As such, we identify census tract-level median household income as the primary independent variable [1,4,32]. Based on the current literature, we hypothesize that high-income census tracts have greater litter bin availability than low-income census tracts [33,34].
We also theorize that median household income may be indirectly associated with litter bin availability through racial segregation, land zoning, population, and commuter population. In the United States, there are well-documented racial disparities in median household income [35]. These racial economic disparities have allowed for the preservation of racial segregation [36]. In turn, the legacy and presence of racial segregation in the US has limited the amount of recourses for certain communities, thus influencing a community’s median household income [36]. As such, we present bidirectional associations (represented by the double-headed arrows) between median household income and racial segregation in Figure 1 [37,38]. Additionally, in the United States, land zoning has either inadvertently or overtly been used to promote economic segregation [39,40]. Therefore, in our theoretical framework, we present bidirectional relationships between median household income and land zoning. Since the 1960s, there have been claims that the misuse of land zoning has contributed to the prevention of equitable access to urban infrastructure and has created clusters of poverty within NYC [41,42]. Thus, it is reasonable to infer that land zoning is associated litter bin availability. There are well documented associations between median household income and population density [39]. We also expect that increases in population density are associated with increases in litter bin availability.

3. Materials and Methods

3.1. Study Design

We conducted a cross-sectional analysis to estimate the prevalence of litter bins in NYC, which has a population of approximately 8.4 million people [43]. The unit of analysis was census tract; we included 2101 census tracts in our study.

3.2. Dependent Variable

The main dependent variable was a count of litter bins in NYC census tracts. We obtained litter bin information through NYC Open Data [44]. The DSNY collects data on litter bin location, counts, and type for litter bins owned or tracked by DSNY (i.e., Business Improvement Districts, non-profit organizations, and private companies) via quarterly surveys. The data do not include litter bins owned by other city, state, or federal agencies (including the NYC Department of Parks). For this analysis, we used the 2020 2nd quarter dataset (data collected between April and June 2020). We geocoded litter bins with valid ID numbers in ArcGIS V.10.7.1. All street litter bins with valid ID numbers were successfully geocoded. Litter bin locations were snapped to the nearest roadway section, as denoted in TIGER Line files for roadways in NYC [45].

3.3. Independent Variable

We considered median household income as the main independent variable and investigated its association with litter bin access. We obtained median household income data on the census tract level from the 2019 American Community Survey (ACS) 5-year estimates [46].
Other independent measures included racial segregation, population, commuter-adjusted population, and land use. We measured racial segregation through two different indices: (1) the Index of Concentration at Extremes (ICE) and (2) Massey’s Index of Dissimilarity. The ICE measures racial segregation on a larger scale (i.e., census tracts), whereas the Massey’s Index of Dissimilarity measures racial segregation using a smaller scale (i.e., census block-groups). We calculated the ICE using ACS data by subtracting the total population of non-Hispanic White residents by the population of non-Hispanic Black residents and dividing by the total population. The ICE ranges from −1 to 1, where −1 is a segregated census tract of only non-Hispanic Black residents, 0 is a fully integrated census tract, and 1 is a segregated census tract of only non-Hispanic White residents [47]. Massey’s Index of Dissimilarity measures the percentage of a group’s population that would have to change residence for each neighborhood to have the same percentage of that group as the metropolitan area overall [48]. The index ranges from 0 (complete integration) to 1 (complete segregation). We accessed census tract population data from the 2019 ACS [46]. We measured the number of people living in, working in, or both living and working in each census tract through the commuter-adjusted population. We calculated the commuter-adjusted population by adding the total census tract population with the total number of workers of each census tract and then subtracting the total number of workers that live in that census tract from that value [49]. The total number of workers of each census tract was obtained from the Census Transportation Planning Product’s Census Tract Flows Dataset and the total number of workers that live in that census tract was collected from the 2019 ACS [46,50]. We used county parcel files provided by the US Census Bureau to calculate the percentage of land area that is retail, industrial, and green space within census tracts [45].

3.4. Statistical Analysis
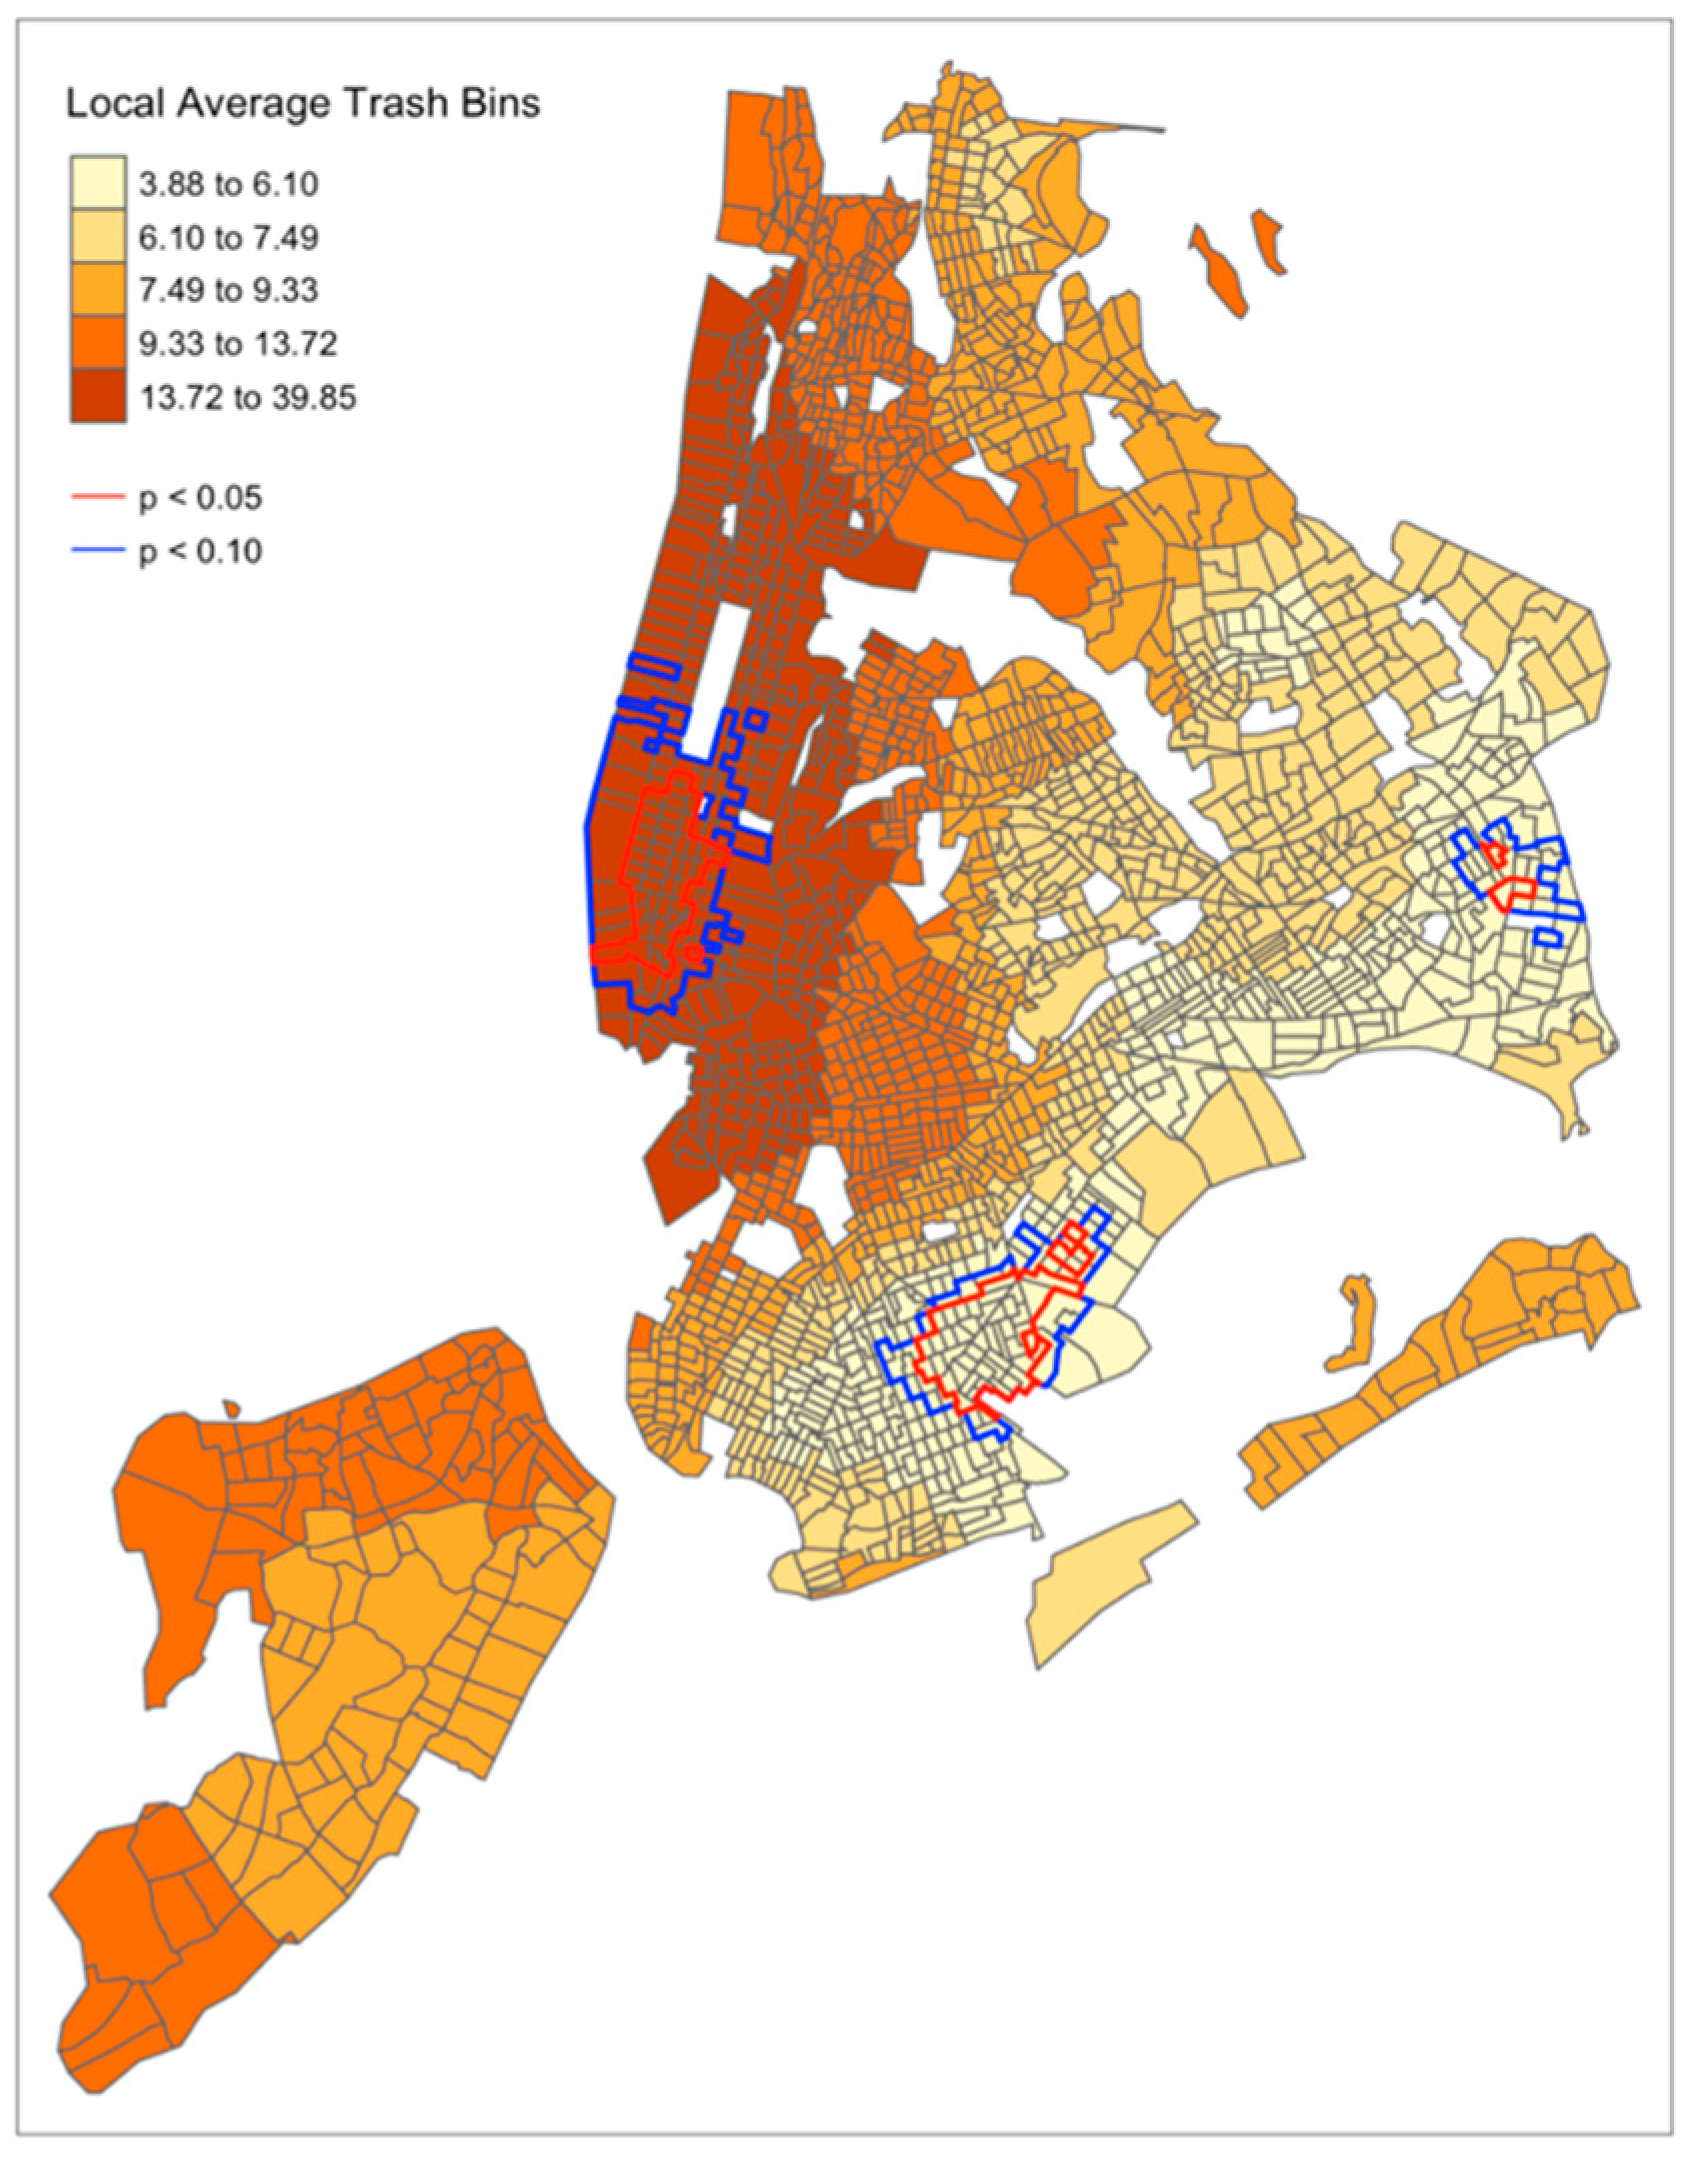
Multilevel Bayesian Poisson models estimated the prevalence rate ratio for counts of litter bins in each census tract. Model 1 examined the association between litter bin count and median household income, adjusting for relevant covariates. The total length of all roadways (miles) per census tract was included as an offset term to account for the differing sizes of each census tract [45]. Model 2 was specified similarly to Model 1, with the addition of a conditional autoregressive random effect:
log ( λ i ) = log ( e i ) + X i β + θ i
exp ( θ i ) ~   g a m m a ( a , a )
over   dispersion   parameter : k = 1 a
where λi is the underlying Poisson mean for the litter bin count at the census tract i. Xi represents the covariates and β represents the coefficients. θit denotes the extra residual term for site i.
The conditional autoregressive random effect accounts for spatial dependencies [51,52,53] that arise because nearby census tracts are more likely to have similar values than distal census tracts [54]. As such, Model 2 accounts for the phenomenon that areas close to one another are similar, whereas Model 1 does not take this into account. All statistical analyses were conducted in R and RStudio [55] using the R-INLA package, which provides asymptotic approximations of the Markov Chain Monte Carlo simulation obtained from a full Bayesian procedure. Maps were created using R and RStudio [55] to visually display the test of spatial dependence of litter bin count by census tract in NYC as well as the correlation between count of litter bins and median household income.

4. Results

Table 1 presents the distribution of selected characteristics on the census tract level (n = 2101). The count of litter bins per census tract ranged from 0 to 117, with a mean of 11.2 litter bins (SD = 13.9). The mean census tract-level population was 4012 (SD = 2181.3) and mean commuter-adjusted population was 3649 (SD = 4455.2). The mean median household income was USD 67,291.90 (SD = USD 33,041.50). The mean ICE was 0.1 (SD = 0.7), suggesting a large variation in racial segregation on the census tract level. The mean dissimilarity index was 0.3 (SD = 0.2), suggesting a smaller variation in racial segregation on the census block groups than the census tracts.
Figure 2 depicts the spatial dependence of litter bin count by census tract in NYC. Census tracts with significant spatial autocorrelation at an alpha of 0.05 are outlined in red and census tracts with significant spatial autocorrelation at an alpha of 0.10 are outlined in blue. Figure 3 depicts the correlation between the count of litter bins in a census tract and median household income. There are significant correlations between median household income and litter bin availability in census tracts located in Manhattan, Brooklyn, Queens, and the Bronx, outlined in red at an alpha of 0.05 and outlined in blue at an alpha of 0.10.
The model results can be found in Table 2. In Model 1, we observed a positive association between median household income and litter bin availability (prevalence rate ratio (PRR) = 1.13; 95% CI: 1.11–1.15). A USD 10,000 increase in census tract median household income was associated with a 13% increase in the count of litter bins per census tract when adjusting for other covariates. In Model 2, median household income was no longer significantly associated with litter bin count once spatial dependencies were accounted for (PRR = 0.95; 95% CI = 0.88–1.03).

5. Discussion

This exploratory analysis examined the potential inequities in street litter bin availability in NYC census tracts. The bivariate associations identified that census tracts with higher median household income had a greater prevalence of litter bins than census tracts with lower median household income. However, in fully adjusted models that control for theoretically relevant covariates and spatial dependencies, median household income was not associated with litter bin availability.
Our findings show that there are more litter bins in high-income areas than low-income ones. However, this relationship was attenuated when controlling for relevant covariates and the spillover influence of neighborhoods that were close to one another: spatial autocorrelation. As such, this analysis may suggest that NYC equitably distributes litter bins throughout the city. However, the explanation of spatial autocorrelation attenuating the relationship between median household income and litter bin availability may be more nuanced. The disparities of litter bin availability found in our initial models may be an effect of larger, more structural income-related disparities in New York City. In the United States, both median household income and litter bin availability are spatially dependent [56]. In our study, we found that a spatially structured condition accounts for the observed effect of disparities in access to litter bins. Similarly, other spatial analyses have documented the clustering of both high-poverty and low-poverty counties throughout the United States [57], meaning that spatially structured conditions also partially account for disparities in median household income. Research suggests that governmental policies (e.g., taxation, zoning, and minimum floor space requirements) induce and sustain the spatial sorting and clustering by income [56].
Additionally, commuter population appeared to have the strongest relationship with litter bin availability in both models. For large metropolitan cities in the United States, including New York City, low-income residents tend to have longer commute times than higher-income residents [58,59]. In these large cities, the higher-income areas have higher commuter populations than the lower-income areas [59]. As such, disparities in litter bin availability may be an effect of the relationship between neighborhood median household income and commuter population. More research is warranted to understand the relationship between neighborhood income, commuter population, and litter bin availability.
While this analysis suggests that New York City may equitably distribute litter bins, it is also important to note the importance of residents’ environmental health perceptions. Harlem residents clearly voiced concerns about overflowing trash in their neighborhoods [8,10]. A large body of evidence suggests that perceptions of environmental exposures may have equal or greater effects on the outcome than the actual exposure [60,61,62,63,64,65]. For example, one study that investigated the perceived and actual weather exposures on adults’ walking behavior found that the effect of the actual exposure (extreme temperatures) was dependent on the perceived exposure (individual’s perceptions on extreme weather being a barrier to walking) [64]. Another study that examined the effects of perceived and actual indoor and outdoor air quality found that environmental exposure perceptions had a significant impact on health outcomes, even in areas with the same levels of air pollution [65]. While it quantitatively appears that New York City is equitably distributing litter bins, the perceptions of litter bin availability at the local level are equally important. Additional qualitative and quantitative research is warranted to understand community members’ perceptions on litter bin availability disparities, as the perceptions may have an equal or greater effect than what can be measured in terms of exposure. Local authorities should also hold community forums to understand community members’ concerns and collaboratively identify appropriate solutions.
This study should be interpreted with its limitations in mind. First, the DSNY dataset did not include litter bins that were owned by other city, state, or federal agencies. These additional litter bins that are not included may or may not be equally distributed across NYC. Future studies should include litter bins tracked by the DSNY dataset, as well as other city, state, and federal agencies. Second, the data used in this analysis were cross-sectional as the only publicly available data were from the second quarter of 2020. Every year the DSNY’s budget fluctuates and over time the distribution of litter bins may also fluctuate. DSNY only publicly provides the most up to date data; however, future investigations should be longitudinal in nature. Next, we were unable to distinguish litter bin type due to limited data publicly provided by DSNY. Having this information is important as there is evidence that litter bins with lids or a covering are more effective in reducing street litter than litter bins without [66]. Finally, this study only examined litter bin availability in NYC and cannot be generalized beyond that region. Future studies should be conducted in other metropolitan areas, both nationally and globally, to understand how they compare to NYC.
The analyses in this study were preliminary, and therefore future studies are required to further understand the multidimensional and complex dimensions of litter bin access disparities. For example, future studies should explore the health outcomes and consequences of the distribution of litter bins in NYC statistically. Additional research directions include investigating environmental health perceptions of litter bin availability through conducting community focus groups and then developing a larger-scale questionnaire based on the focus groups’ results. However, future research is required before we would be able to draw conclusions on what efforts can be undertaken by multiple actors in municipal solid waste management to achieve sustainable and equitable development in NYC.

6. Conclusions

Residents and community leaders have voiced concern about the removal of litter bins in low-income NYC neighborhoods. We observed that median household income was significantly associated with the availability of litter bins in our initial models that did not account for spatial autocorrelation; however, this relationship was no longer significant after accounting for spatial autocorrelation. As such, disparities in litter bin availability may be an effect of structural income-related disparities in New York City, such as inequitable governmental housing policies and economic disparities in commuter time. Further, while New York City may equitably distribute litter bins, perceptions on environmental exposures may have equal or greater health effects than the actual environmental exposure. As such, future research should investigate environmental perceptions of litter bin availability on health.

Author Contributions

Conceptualization, N.L.S., A.L.J. and C.C.B.; Methodology, N.L.S., A.N.G., C.A.M., C.N.M., C.C.B. and A.L.J.; Software, A.N.G., and C.A.M.; Validation, A.N.G. and C.A.M.; Formal Analysis, A.N.G. and C.A.M.; Investigation, N.L.S., A.N.G., C.A.M. and A.L.J.; Resources, A.N.G. and C.A.M.; Data Curation, A.N.G. and C.A.M.; Writing—Original Draft Preparation, N.L.S.; Writing—Review and Editing, N.L.S., A.N.G., C.A.M., C.N.M., C.C.B. and A.L.J.; Visualization, A.N.G.; Supervision, C.N.M., C.C.B. and A.L.J.; Project Administration, N.L.S.; Funding Acquisition, N.L.S. and C.C.B. All authors have read and agreed to the published version of the manuscript.

Funding

This work was supported, in part, by National Institute of Environmental Health Sciences T32 ES007322. This work was also supported by the Centers for Disease Control and Prevention (R49-CE003094). This content is solely the responsibility of the authors and does not necessarily represent the official views of the Centers for Disease Control and Prevention.

Institutional Review Board Statement

Not applicable.

Informed Consent Statement

Not applicable.

Data Availability Statement

Publicly available datasets were analyzed in this study. These data can be found here: https://opendata.cityofnewyork.us/ (accessed on 31 December 2020).

Acknowledgments

We thank the following individuals for assistance with data analysis and manuscript preparation: Parisa Tehranifar, Domonique Reed, Erica Lee, Nadine Alexander, Gloria Hu, Aleya Khalifa, Shabnaz Siddiq, and Stephen Uong.

Conflicts of Interest

The authors declare no conflict of interest.

References

  1. Martuzzi, M.; Mitis, F.; Forastiere, F. Inequalities, inequities, environmental justice in waste management and health. Eur. J. Public Health 2010, 20, 21–26. [Google Scholar] [CrossRef]
  2. Henderson, S.; Wells, R. Environmental Racism and the Contamination of Black Lives: A Literature Review. J. Afr. Am. Stud. 2021, 25, 134–151. [Google Scholar] [CrossRef]
  3. WHO. Population Health and Waste Management: Scientifc Data and Policy Options; WHO: Geneva, Switzerland, 2007. [Google Scholar]
  4. Banzhaf, S.; Ma, L.; Timmins, C. Environmental justice: The economics of race, place, and pollution. J. Econ. Perspect. 2019, 33, 185–208. [Google Scholar] [CrossRef] [Green Version]
  5. Elliott, P.; Briggs, D.; Morris, S.; de Hoogh, C.; Hurt, C.; Jensen, T.K.; Maitland, I.; Richardson, S.; Wakefield, J.; Jarup, L. Risk of adverse birth outcomes in populations living near landfill sites. BMJ 2001, 323, 363–368. [Google Scholar] [CrossRef] [Green Version]
  6. Yu, Y.; Yu, Z.; Sun, P.; Lin, B.; Li, L.; Wang, Z.; Ma, R.; Xiang, M.; Li, H.; Guo, S. Effects of ambient air pollution from municipal solid waste landfill on children’s non-specific immunity and respiratory health. Environ. Pollut. 2018, 236, 382–390. [Google Scholar] [CrossRef]
  7. Bullard, R.D. Dumping in Dixie: Race, Class, and Environmental Quality; Avalon Publishing-(Westview Press): Boulder, CO, USA, 2008. [Google Scholar]
  8. Hu, W. Harlem’s Trash Bins Were Overflowing. So the City Took 223 Away. New York Times, 20 August 2018. Available online: https://www.nytimes.com/2018/08/19/nyregion/harlem-litter-baskets-sanitation-department-nyc.html(accessed on 7 January 2021).
  9. New York Neighborhood Data Profiles. Available online: https://furmancenter.org/neighborhoods/ (accessed on 7 January 2021).
  10. Harlem Residents Fed Up With Overflowing Trash Bins Take Clean Up Effort Into Their Own Hands. CBS New York, 11 August 2020. Available online: https://www.cbsnews.com/newyork/news/harlem-residents-fed-up-with-overflowing-trash-bins-take-clean-up-effort-into-their-own-hands/(accessed on 7 January 2021).
  11. Bauman, A. Trash Piling Up Over NYC After Sanitation Department’s Budget Slashed By Over $100 Million. CBS New York, 29 July 2020. Available online: https://www.cbsnews.com/newyork/news/trash-collection-nyc-sanitation-department-budget-cuts/(accessed on 7 January 2021).
  12. Schultz, P.; Stein, S. Executive Summary—Litter in America: National Findings and Recommendations; Keep America Beautiful: Stamford, CT, USA, 2009. [Google Scholar]
  13. Muñoz-Cadena, C.E.; Lina-Manjarrez, P.; Estrada-Izquierdo, I.; Ramón-Gallegos, E. An Approach to Litter Generation and Littering Practices in a Mexico City Neighborhood. Sustainability 2012, 4, 1733–1754. [Google Scholar] [CrossRef] [Green Version]
  14. Bator, R.J.; Bryan, A.D.; Wesley Schultz, P. Who gives a hoot?: Intercept surveys of litterers and disposers. Environ. Behav. 2011, 43, 295–315. [Google Scholar] [CrossRef] [Green Version]
  15. Schultz, P.W.; Bator, R.J.; Large, L.B.; Bruni, C.M.; Tabanico, J.J. Littering in context: Personal and environmental predictors of littering behavior. Environ. Behav. 2013, 45, 35–59. [Google Scholar] [CrossRef] [Green Version]
  16. Keizer, K.; Lindenberg, S.; Steg, L. The spreading of disorder. Science 2008, 322, 1681–1685. [Google Scholar] [CrossRef] [Green Version]
  17. Bonnefoy, X.; Kampen, H.; Sweeney, K. Public Health Significance of Urban Pests; World Health Organization: Geneva, Switzerland, 2008. [Google Scholar]
  18. CDC. Healthy Housing Reference Manual; U.S. Department of Health and Human Services: Washington, DC, USA, 2006.
  19. CDC. Diseases Directly Transmitted by Rodents. Available online: https://www.cdc.gov/rodents/diseases/direct.html (accessed on 29 November 2020).
  20. Pickett, S.T.; Cadenasso, M.L.; Grove, J.M.; Nilon, C.H.; Pouyat, R.V.; Zipperer, W.C.; Costanza, R. Urban ecological systems: Linking terrestrial ecological, physical, and socioeconomic components of metropolitan areas. Annu. Rev. Ecol. Syst. 2001, 32, 127–157. [Google Scholar] [CrossRef] [Green Version]
  21. Campbell, M.L.; Peters, L.; McMains, C.; de Campos, M.C.R.; Sargisson, R.J.; Blackwell, B.; Hewitt, C.L. Are our beaches safe? Quantifying the human health impact of anthropogenic beach litter on people in New Zealand. Sci. Total Environ. 2019, 651, 2400–2409. [Google Scholar] [CrossRef]
  22. LaGRANGE, R.L.; FERRARO, K.F.; SUPANCIC, M. Perceived Risk and Fear of Crime: Role of Social and Physical Incivilities. J. Res. Crime Delinq. 1992, 29, 311–334. [Google Scholar] [CrossRef]
  23. Perkins, D.D.; Taylor, R.B. Ecological assessments of community disorder: Their relationship to fear of crime and theoretical implications. Am. J. Community Psychol. 1996, 24, 63–107. [Google Scholar] [CrossRef]
  24. Brown, B.B.; Perkins, D.D.; Brown, G. Crime, New housing, and housing incivilities in a first-ring suburb: Multilevel relationships across time. Hous. Policy Debate 2004, 15, 301–345. [Google Scholar] [CrossRef]
  25. Shenassa, E.D.; Liebhaber, A.; Ezeamama, A. Perceived Safety of Area of Residence and Exercise: A Pan-European Study. Am. J. Epidemiol. 2006, 163, 1012–1017. [Google Scholar] [CrossRef] [Green Version]
  26. Gobster, P.H. Managing Urban Parks for a Racially and Ethnically Diverse Clientele. Leis. Sci. 2002, 24, 143–159. [Google Scholar] [CrossRef]
  27. Beautiful, K.A. National Visible Litter Survey and Litter Cost Study; Keep America Beautiful: Stamford, CT, USA, 2009. [Google Scholar]
  28. Lockwood, B.; Wyant, B.R.; Grunwald, H.E. Locating Litter: An Exploratory Multilevel Analysis of the Spatial Patterns of Litter in Philadelphia. Environ. Behav. 2021, 53, 601–635. [Google Scholar] [CrossRef]
  29. Massey, R. Environmental Justice: Income, Race, and Health; Global Development and Environment Institute: Somerville, MA, USA, 2004; pp. 1–26. [Google Scholar]
  30. Dominguez, S.; Arford, T. It is all about who you know: Social capital and health in low-income communities. Health Sociol. Rev. 2010, 19, 114–129. [Google Scholar] [CrossRef]
  31. Ravensbergen, F.; VanderPlaat, M. Barriers to citizen participation: The missing voices of people living with low income. Community Dev. J. 2010, 45, 389–403. [Google Scholar] [CrossRef]
  32. Cotton, M. Environmental justice as scalar parity: Lessons from nuclear waste management. Soc. Justice Res. 2018, 31, 238–259. [Google Scholar] [CrossRef] [Green Version]
  33. Jenkins, G.R.; Yuen, H.K.; Rose, E.J.; Maher, A.I.; Gregory, K.C.; Cotton, M.E. Disparities in quality of park play spaces between two cities with diverse income and race/ethnicity composition: A pilot study. Int. J. Environ. Res. Public Health 2015, 12, 8009–8022. [Google Scholar] [CrossRef] [Green Version]
  34. Guo, H.; Hobbs, B.F.; Lasater, M.E.; Parker, C.L.; Winch, P.J. System dynamics-based evaluation of interventions to promote appropriate waste disposal behaviors in low-income urban areas: A Baltimore case study. Waste Manag. 2016, 56, 547–560. [Google Scholar] [CrossRef] [Green Version]
  35. Manduca, R. Income inequality and the persistence of racial economic disparities. Sociol. Sci. 2018, 5, 182–205. [Google Scholar] [CrossRef] [Green Version]
  36. Dawkins, C.J. Space and the measurement of income segregation. J. Reg. Sci. 2007, 47, 255–272. [Google Scholar] [CrossRef]
  37. Nuru-Jeter, A.M.; LaVeist, T.A. Racial segregation, income inequality, and mortality in US metropolitan areas. J. Urban Health 2011, 88, 270–282. [Google Scholar] [CrossRef] [Green Version]
  38. Lobmayer, P.; Wilkinson, R.G. Inequality, residential segregation by income, and mortality in US cities. J. Epidemiol. Community Health 2002, 56, 183–187. [Google Scholar] [CrossRef] [Green Version]
  39. Rothwell, J.; Massey, D.S. The effect of density zoning on racial segregation in US urban areas. Urban Aff. Rev. 2009, 44, 779–806. [Google Scholar] [CrossRef] [Green Version]
  40. Shertzer, A.; Twinam, T.; Walsh, R.P. Zoning and segregation in urban economic history. Reg. Sci. Urban Econ. 2021, 94, 103652. [Google Scholar] [CrossRef]
  41. Jacobs, J. The Death and Life of Great American Cities; Random House: New York, NY, USA, 1961. [Google Scholar]
  42. Brown, G.; Sanders, S.; Reed, P. Using public participatory mapping to inform general land use planning and zoning. Landsc. Urban Plan. 2018, 177, 64–74. [Google Scholar] [CrossRef]
  43. Department of City Planning. Planning-Population-NYC Population. Available online: https://www1.nyc.gov/site/planning/planning-level/nyc-population/nyc-population.page#:~:text=The%20enumerated%20population%20of%20New,people%20since%20the%202010%20Census (accessed on 7 January 2021).
  44. NYC Open Data, DSNY Litter Basket Inventory. Available online: https://opendata.cityofnewyork.us/ (accessed on 7 January 2021).
  45. U.S. Census Bureau. 2017 TIGER/Line Shapefiles (Machinereadable Data Files); U.S. Census Bureau: Suitland, MD, USA, 2017.
  46. U.S. Census Bureau. American Community Survey (ACS); U.S. Census Bureau: Suitland, MD, USA, 2019.
  47. Krieger, N.; Feldman, J.M.; Waterman, P.D.; Chen, J.T.; Coull, B.A.; Hemenway, D. Local residential segregation matters: Stronger association of census tract compared to conventional city-level measures with fatal and non-fatal assaults (total and firearm related), using the index of concentration at the extremes (ICE) for racial, economic, and racialized economic segregation, Massachusetts (US), 1995–2010. J. Urban Health 2017, 94, 244–258. [Google Scholar]
  48. Massey, D.S.; Denton, N.A. The dimensions of residential segregation. Soc. Forces 1988, 67, 281–315. [Google Scholar] [CrossRef]
  49. McKenzie, B.; Koerber, W.; Fields, A.; Benetsky, M.; Rapino, M. Commuter-Adjusted Population Estimates: ACS 2006-10; Journey to Work and Migration Statistics Branch; U.S. Census Bureau: Washington, DC, USA, 2010.
  50. Bureau of Transportation Statistics. Census Transportation Planning Product’s Census Tract Flows Dataset. Available online: https://ctpp.transportation.org/ (accessed on 12 January 2021).
  51. Amsalu, E.; Liu, M.; Li, Q.; Wang, X.; Tao, L.; Liu, X.; Luo, Y.; Yang, X.; Zhang, Y.; Li, W.; et al. Spatial-temporal analysis of tuberculosis in the geriatric population of China: An analysis based on the Bayesian conditional autoregressive model. Arch. Gerontol. Geriatr. 2019, 83, 328–337. [Google Scholar] [CrossRef] [PubMed]
  52. Dormann, C.F.; McPherson, J.M.; Araújo, M.B.; Bivand, R.; Bolliger, J.; Carl, G.; Davies, R.G.; Hirzel, A.; Jetz, W.; Daniel Kissling, W. Methods to account for spatial autocorrelation in the analysis of species distributional data: A review. Ecography 2007, 30, 609–628. [Google Scholar] [CrossRef] [Green Version]
  53. Wang, Y.; Kockelman, K.M. A Poisson-lognormal conditional-autoregressive model for multivariate spatial analysis of pedestrian crash counts across neighborhoods. Accid. Anal. Prev. 2013, 60, 71–84. [Google Scholar] [CrossRef]
  54. Griffith, D.A. Spatial Autocorrelation: A Primer; Association of American Geographers: Washington, DC, USA, 1987. [Google Scholar]
  55. R Core Team. RStudio: Integrated Development for R; RStudio, Inc.: Boston, MA, USA, 2015; Volume 42, p. 84. Available online: http://www.rstudio.com (accessed on 22 January 2021).
  56. Frank, A.I. Using Measures of Spatial Autocorrelation to Describe Socio-Economic and Racial Residential Patterns in US Urban Areas; Taylor & Francis: New York, NY, USA, 2003; Volume 13. [Google Scholar]
  57. Holt, J.B. The topography of poverty in the United States: A spatial analysis using county-level data from the Community Health Status Indicators project. Prev. Chronic Dis. 2007, 4, A111. [Google Scholar]
  58. Salon, D. Neighborhoods, cars, and commuting in New York City: A discrete choice approach. Transp. Res. Part A Policy Pract. 2009, 43, 180–196. [Google Scholar] [CrossRef] [Green Version]
  59. Shen, Q. Spatial and social dimensions of commuting. J. Am. Plan. Assoc. 2000, 66, 68–82. [Google Scholar] [CrossRef]
  60. Clarkson, J.J.; Hirt, E.R.; Jia, L.; Alexander, M.B. When perception is more than reality: The effects of perceived versus actual resource depletion on self-regulatory behavior. J. Personal. Soc. Psychol. 2010, 98, 29. [Google Scholar] [CrossRef]
  61. Allgood, S.; Walstad, W.B. The effects of perceived and actual financial literacy on financial behaviors. Econ. Inq. 2016, 54, 675–697. [Google Scholar] [CrossRef]
  62. Cho, G.; Rodríguez, D.A.; Khattak, A.J. The role of the built environment in explaining relationships between perceived and actual pedestrian and bicyclist safety. Accid. Anal. Prev. 2009, 41, 692–702. [Google Scholar] [CrossRef]
  63. Baliatsas, C.; Bolte, J.; Yzermans, J.; Kelfkens, G.; Hooiveld, M.; Lebret, E.; van Kamp, I. Actual and perceived exposure to electromagnetic fields and non-specific physical symptoms: An epidemiological study based on self-reported data and electronic medical records. Int. J. Hyg. Environ. Health 2015, 218, 331–344. [Google Scholar] [CrossRef] [PubMed] [Green Version]
  64. Carlson, S.A.; Whitfield, G.P.; Davis, R.T.; Peterson, E.L.; Fulton, J.E.; Berrigan, D. Associations between Perceptions and Measures of Weather and Walking, United States—2015. Int. J. Environ. Res. Public Health 2021, 18, 8398. [Google Scholar] [CrossRef] [PubMed]
  65. Oh, H.-J.; Jeong, N.-N.; Sohn, J.-R.; Kim, J. Personal exposure to indoor aerosols as actual concern: Perceived indoor and outdoor air quality, and health performances. Build. Environ. 2019, 165, 106403. [Google Scholar] [CrossRef]
  66. Kelley, C.; Ambikapathi, R. Litter-Free Baltimore; The Abell Foundation: Baltimore, MD, USA, 2016. [Google Scholar]
Figure 1. Theoretical framework.
Ijerph 19 05107 g001
Figure 2. Mapping test of spatial dependence of litter bin count by census tract in New York City.
Ijerph 19 05107 g002
Figure 3. Mapping correlation between count of litter bins and median household income.
Ijerph 19 05107 g003
Table 1. Descriptive statistics for 2101 census tracts in New York City *.
VariableMeanStandard DeviationMinimumMaximum
Litter Baskets11.213.90.0117.0
Median Household Income67,291.933,041.59939.0250,001.0
Population 4012.02181.336.028,272.0
Commuter Population3649.04455.278.052,767.0
ICE **0.10.7−1.01.0
Dissimilarity Index0.30.20.01.0
% Retail0.43.70.096.8
% Industrial0.33.40.069.4
% Green space4.110.50.0100.0
* Data are from 2019 ACS, ** ICE = Index of Concentration at Extremes.
Table 2. Multilevel Bayesian conditional autoregressive Poisson models estimating the prevalence rate ratio for counts of litter bins.
VariableModel 1 1Model 2 2
PRR95% CIPRR95% CI
Median Household Income1.131.111.150.950.881.03
ICE *1.081.061.090.920.821.03
Dissimilarity Index 1.081.061.091.040.991.09
Population1.081.071.091.040.981.10
Commuter Population1.261.251.271.141.061.22
% Retail0.990.981.001.010.961.06
% Industrial0.800.780.820.880.840.93
% Green space0.760.750.770.790.750.83
Bold numeric values indicate statistical significance (p < 0.05). * ICE = Index of Concentration at Extremes. 1 Model 1 estimated the prevalence rate ratio for counts of litter bins by median household income in each census tract, adjusting for confounders. 2 Model 2 estimated the prevalence rate ratio for counts of litter bins by median household income in each census tract, adjusting for covariates and accounting for spatial dependencies.
Publisher’s Note: MDPI stays neutral with regard to jurisdictional claims in published maps and institutional affiliations.

