Review

Machine Learning, Deep Learning, and Mathematical Models to Analyze Forecasting and Epidemiology of COVID-19: A Systematic Literature Review

by
Farrukh Saleem
1,*,
Abdullah Saad AL-Malaise AL-Ghamdi
1,
Madini O. Alassafi
2 and
Saad Abdulla AlGhamdi
3
1
Department of Information System, Faculty of Computing and Information Technology, King Abdulaziz University, Jeddah 21589, Saudi Arabia
2
Department of Information Technology, Faculty of Computing and Information Technology, King Abdulaziz University, Jeddah 21589, Saudi Arabia
3
Ministry of Health, King Abdulaziz Hospital, Jeddah 22421, Saudi Arabia
*
Author to whom correspondence should be addressed.
Int. J. Environ. Res. Public Health 2022, 19(9), 5099; https://doi.org/10.3390/ijerph19095099
Submission received: 25 February 2022 / Revised: 11 April 2022 / Accepted: 20 April 2022 / Published: 22 April 2022
(This article belongs to the Special Issue Advances in Spatial Epidemiology of COVID-19)

Abstract

:
COVID-19 is a disease caused by SARS-CoV-2 and has been declared a worldwide pandemic by the World Health Organization due to its rapid spread. Since the first case was identified in Wuhan, China, the battle against this deadly disease started and has disrupted almost every field of life. Medical staff and laboratories are leading from the front, but researchers from various fields and governmental agencies have also proposed healthy ideas to protect each other. In this article, a Systematic Literature Review (SLR) is presented to highlight the latest developments in analyzing the COVID-19 data using machine learning and deep learning algorithms. The number of studies related to Machine Learning (ML), Deep Learning (DL), and mathematical models discussed in this research has shown a significant impact on forecasting and the spread of COVID-19. The results and discussion presented in this study are based on the PRISMA (Preferred Reporting Items for Systematic Reviews and Meta-Analyses) guidelines. Out of 218 articles selected at the first stage, 57 met the criteria and were included in the review process. The findings are therefore associated with those 57 studies, which recorded that CNN (DL) and SVM (ML) are the most used algorithms for forecasting, classification, and automatic detection. The importance of the compartmental models discussed is that the models are useful for measuring the epidemiological features of COVID-19. Current findings suggest that it will take around 1.7 to 140 days for the epidemic to double in size based on the selected studies. The 12 estimates for the basic reproduction range from 0 to 7.1. The main purpose of this research is to illustrate the use of ML, DL, and mathematical models that can be helpful for the researchers to generate valuable solutions for higher authorities and the healthcare industry to reduce the impact of this epidemic.

1. Introduction

The outbreak of a deadly disease called coronavirus (COVID-19) has had a significant global impact. As such, the World Health Organization (WHO) has declared it a pandemic [1]. It has affected all spheres of life; moreover, people from poor nations to developed nations are trapped indoors by the pandemic. In this situation, information and communication technologies (ICT) play an important part in connecting communities, implementing the policies, and guiding the communities by analyzing the large datasets generated from COVID-19. Within a few months after the first COVID-19 case was discovered in Wuhan, China, several researchers published articles, discussing this virus and its impact on society [2,3,4,5]. Moreover, the use of computing technologies has generated substantial support to deal with the virus. Current technological developments such as smart applications [6], Artificial Intelligence (AI) [7], Machine Learning (ML) [8], Deep Learning (DL) [9], and big data analytics [10] have led to numerous solutions, epidemiology analysis, and other clinical findings from the collected data sets. These computing technologies are also assisting healthcare and governmental agencies in controlling the spread of the virus, creating social distancing awareness, and predicting potential growth, positive cases, and mortality rates. To understand the current situation, this study mainly focused on reviewing the published papers related to ML and DL techniques. In addition, we integrated some other factors such as epidemiology, reproduction number, and virus doubling time factors in this study, which make it a different SLR than presented previously [11].
Researchers are trying to make good use of the datasets related to COVID-19 patients such as patients’ demographic data, clinical information, chest X-rays (CXR), and Computed Tomography (CT) images. For example, ML techniques assisted in preparing a learning system, and predicting the future concerns about COVID-19, using a training data set to acquire knowledge from the collected dataset [12]. It is also helpful to estimate the future trend and potential infection rate [13]. On the other side, DL implementation is providing more support by predicting the clinical findings using CXR and CT scan images [14,15]. For instance, analyzing medical images can provide irregularities in those images by highlighting different spots and predicting infected and normal patients [16]. Therefore, these computing strategies are assisting medical and governmental agencies to generate multiple findings using COVID-19 dataset, for example, severity detection, virus spreading and control, creating policies and guidelines for the communities, helping in medicine and vaccine development.
Previously, computing scholars proposed productive health solutions to deal with different diseases and treatments [17,18,19,20,21,22]. Similarly, integration of the computing and health industries led to ideas for controlling the spread of the virus, suggestions for future virus containment, and pattern identification from real-world data. In addition, the COVID-19 pandemic has also opened many challenges that have ultimately triggered further development and integration of medical and technology fields. Whereas, ML and DL techniques helped to overcome those challenges by providing various solutions to assist the medical industry and higher authorities.
This research provides a systematic literature review and analysis of ML, DL, and mathematical models for different purposes such as predicting future cases, analyzing previous infected cases, estimating basic reproduction numbers and virus doubling time. This research discussed the number of developments and solutions provided by multiple scholars around the world. Furthermore, we discussed a number of common datasets, statistical models, and techniques to understand different factors such as infection growth rates, reproduction rates, and doubling time. The main motivation for this paper is to present a comprehensive review for the research and medical community on the current development and future challenges of ML and DL approaches for COVID-19. The summary of ML and DL techniques for prediction, detection, and treatment of COVID-19 are some of the major findings of this study. Overall, this study reviewed selected studies and contributed in the following ways:
  • The main research categories can be identified in this area of study;
  • Review of machine learning and deep learning techniques for understanding previous data and predicting future cases;
  • Review of different mathematical models for time series analysis and estimating epidemiological factors;
  • Identification of validation strategies and evaluation metrics have been used for model performance.
Accordingly, the paper is organized as follows: Section 2 discusses the methodology and search strategy applied in this study. Comprehensive analysis of ML, DL, and mathematical models applied on COVID-19 dataset is presented in Section 3. Finally, Section 4 concludes this study by highlighting future work.

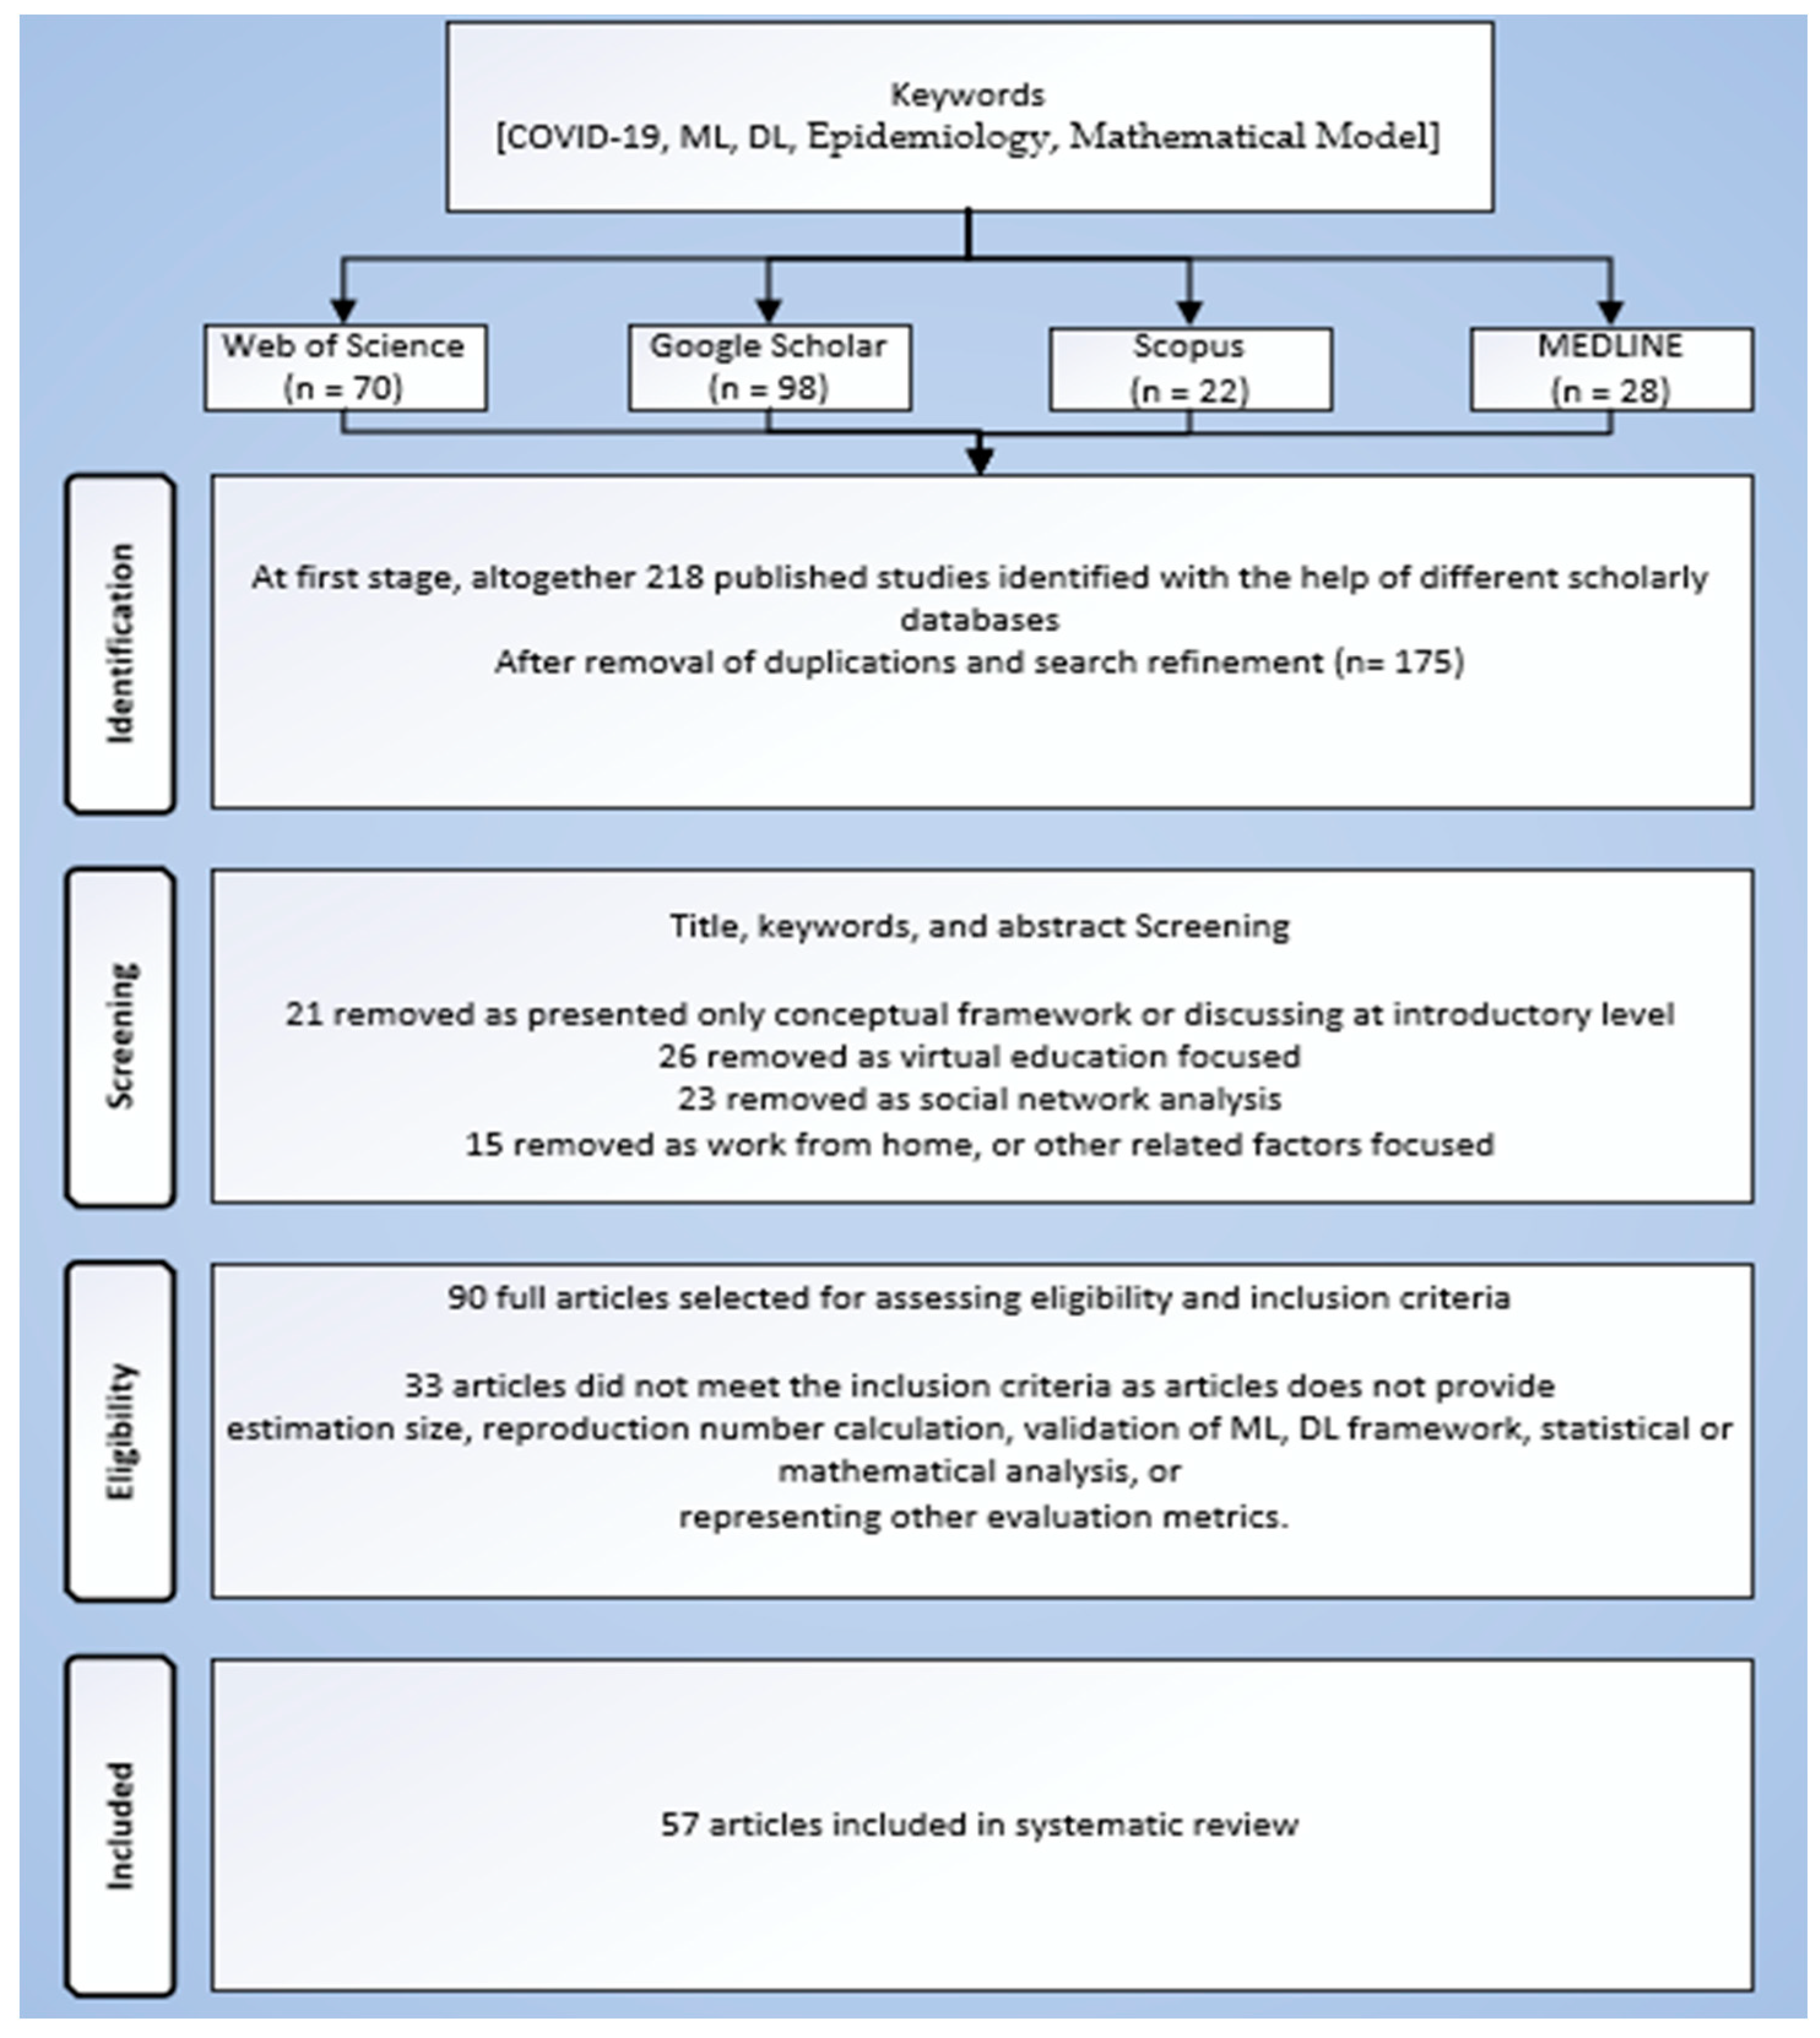
2. Methodology and Search Strategy

This research is mainly focused on SLR methodology. SLR is a systematic approach to organize, present, and synthesize previously published papers that can help readers to understand the current situation and potential developments in a specific field of research. Therefore, this research identified published papers that describe the COVID-19 epidemiology, use of ML and DL approaches for prediction and identification, basic reproduction rate, and virus doubling time in different regions. The subsequent sections are further describing the step-wise approach used in this article.

2.1. Protocol and Registration

The systematic approach used in this study is based on the PRISMA guidelines [23]. The paper title and abstract are written as per the pre-defined guidelines. The review objectives in the introduction section were defined accordingly. The main inclusion and exclusion criteria are also discussed in Section 2.2, whereas the representation of the SLR used in this study is depicted in Figure 1.

2.2. Search Strategy

We performed the searching process using different digital libraries, such as: (i) Web of Science; (ii) Scopus; (iii) Google Scholar; and (iv) Medline, up to the beginning of April 2022. This process was mainly applied under the supervision of one researcher and one clinician. Both researchers performed this task together to perform the initial screening process from computing and medical perspectives. At the first step, the following keywords were used: “COVID-19”, “novel coronavirus”, epidemiological features”, “ML or DL model prediction for COVID-19”. An enormous number of articles are available on these databases due to the large interest of researchers in this area of study. Therefore, papers were selected on the bases of explained inclusion and exclusion criteria. In the next step, the papers refined by excluding out of the scope topics, for example, social network analysis, virtual education, or work from home focused papers.

2.3. Inclusion and Exclusion Criteria

We included the number of studies using specific inclusion criteria. As this research area has recorded an enormous list of publications, therefore, the inclusion criteria are important to be defined, and are also mentioned in the PRISMA guidelines document. The inclusion criteria were applied as follows: (1) the selected studies should be published in English; (2) the article must have applied and measured any of the epidemiological factors (i.e., size of estimation, epidemic doubling time, basic reproduction number, demographic features, clinical characteristics); and (3) the implementation of a ML or DL approach to identify, analyze previous cases, and predict future rate of infection and recovery. In addition, some articles were excluded due to several reasons as follows: (1) duplicate entities; (2) title, keywords, and abstract screening; (3) non-peer reviewed articles; and (4) opinion or conceptual framework focused articles.

2.4. Identified Research Questions

As per the above discussion, this SLR will answer the following research questions:
  • What are the main research categories that can be identified in this area of study?
  • Which machine learning and deep learning techniques were proposed for predicting the future COVID-19 cases?
  • Which mathematical models were used for time series analysis and for calculating different epidemiological factors?
  • What validation strategies and evaluation metrics were used for measuring the model performance?

2.5. Quality Assessment

Finally, the quality check process was applied by two researchers to assess the quality of the contents presented in selected studies. The main purpose of this step was to measure the quality of papers and their impact on this SLR. We used eight quality evaluation questions [24] to evaluate each article as follows: (i) objective relevance; (ii) usefulness; (iii) experimental procedure; (iv) model validation and efficiency; (v) dataset importance; (vi) availability of research limitation; (vii) discussion on future aspects; and (viii) presentation of model evaluation metrics.

3. Results and Discussion

After reviewing and analyzing the selected case studies, this section describes the major findings and discussion, as presented in different sub-sections.

3.1. Characteristics of Selected Articles

The first section elaborates on the major characteristics of reviewed articles. After going through the long procedure, we short-listed 57 studies out of 218 (first search) based on their relevance to the main objectives of this study. Prior to answering the main research questions, the following are some highlights of selected articles.

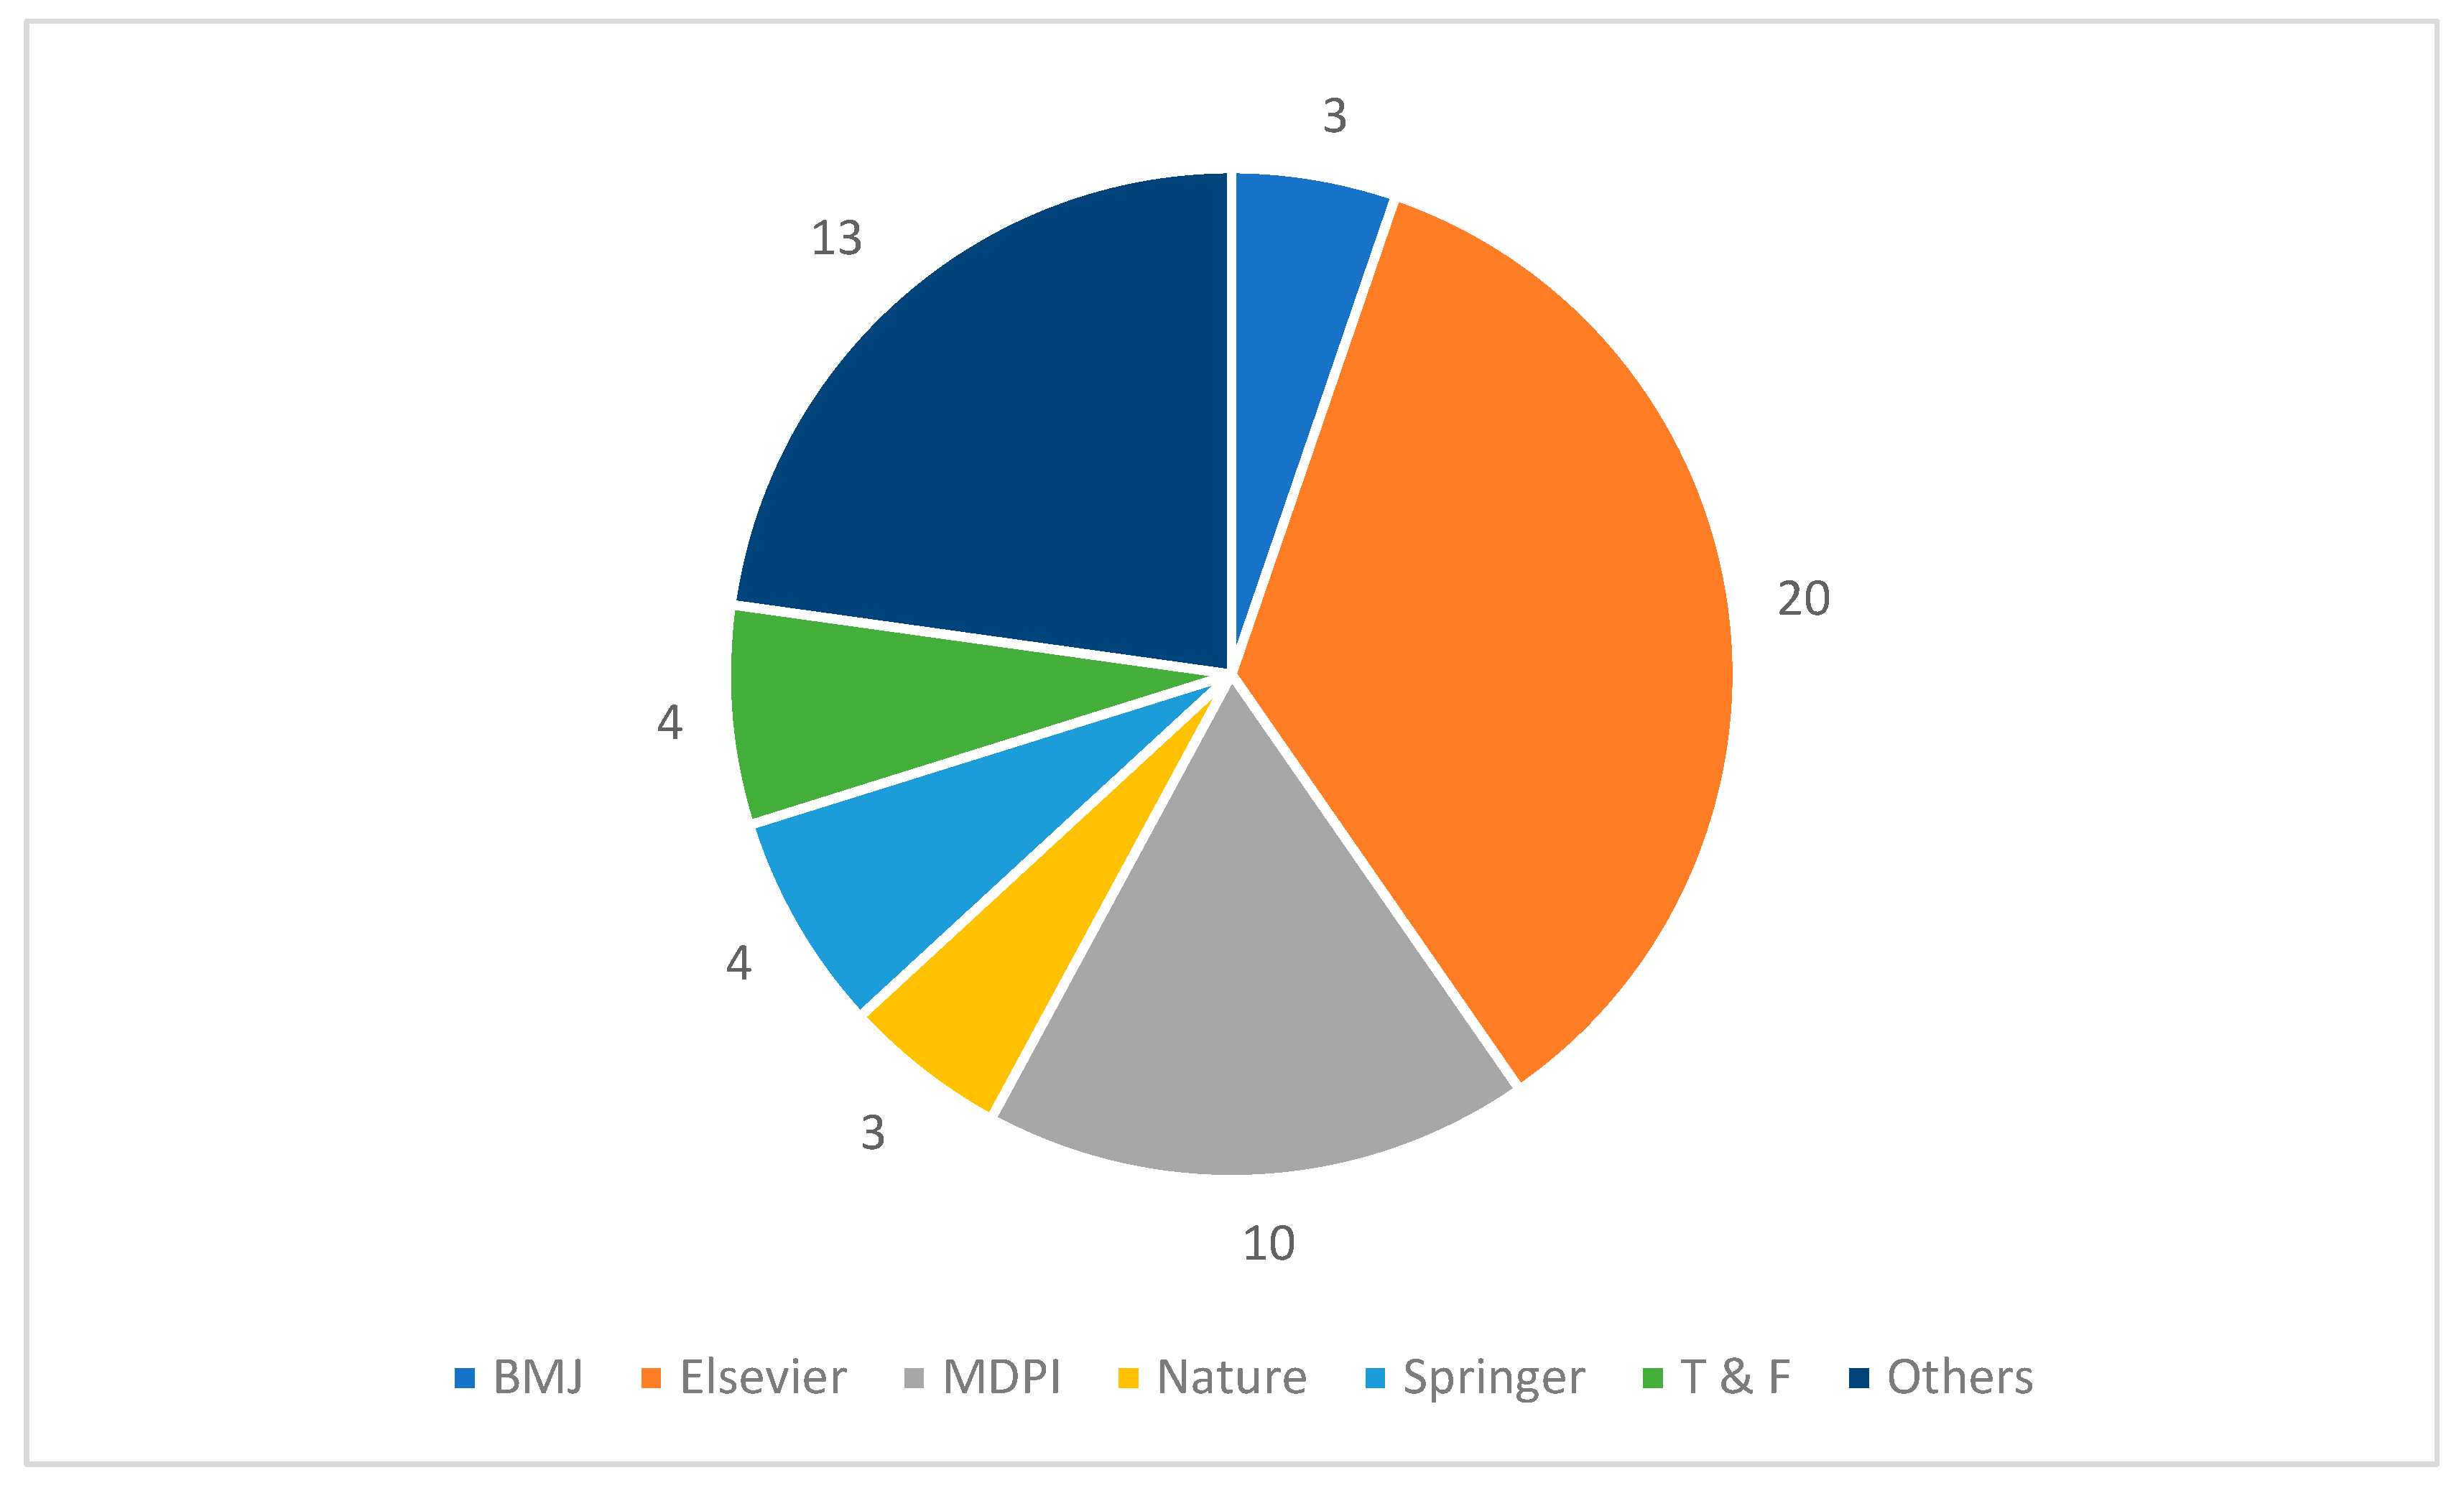
3.1.1. Journal-Wise Categorization

Given the large number of publications in this area of research, the selection process was not basically dependent on journal venue, rather it was based on the inclusion criteria. Therefore, the researchers’ main focus was to include articles on the bases of defined rules without considering the journal venue. However, all searching databases are well-known for academic and applied research publications. Figure 2 illustrates the selected paper’s publishing venues. Most of the selected papers were published in Elsevier (20), which is one of the prominent venues for publishing quality papers. Furthermore, 10 selected articles belong to MDPI, which is one of the largest publishing venues in academic research. In the other category, we put remaining journals such as Frontiers, Wiley, IEEE, and others.

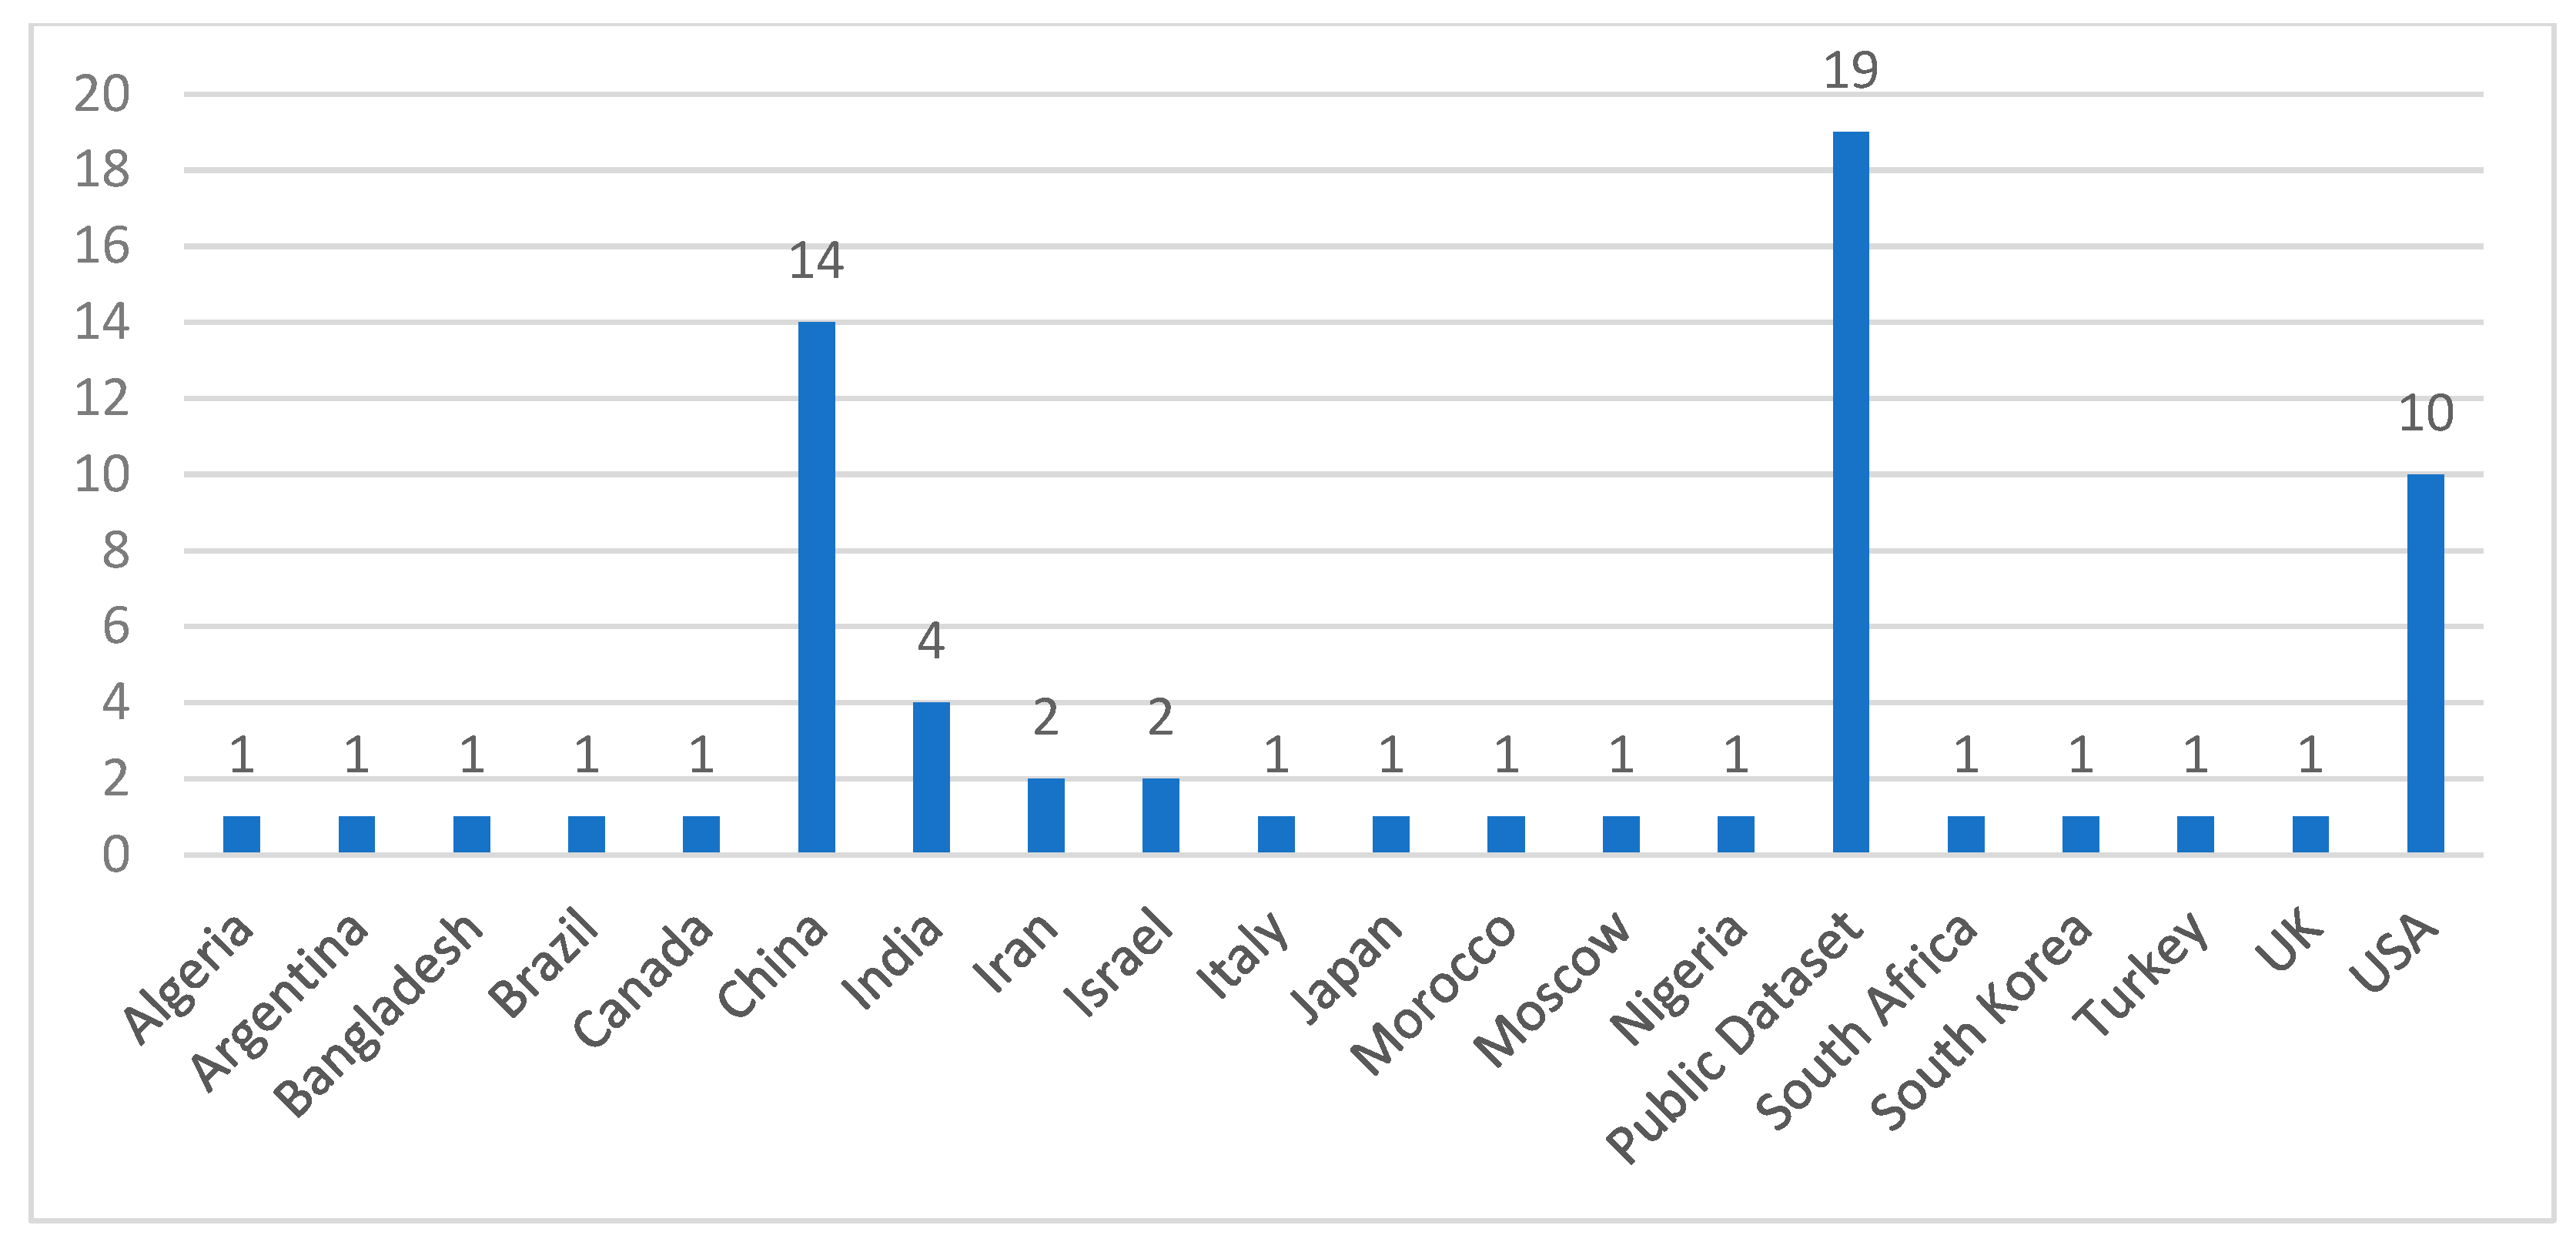
3.1.2. Country-Wise Statistics

We usually selected papers that proposed, implemented, and validated the prediction model using ML, DL, mathematical, or regression techniques and applied the model to the real datasets. The population of the selected case studies belonged to 19 different countries, where the COVID-19 dataset had in particular been collected and applied for different purposes, as depicted in Figure 3. Mainly, most of the studies were associated with the population of China (22%), which has been the focal point of this disease. The researchers from that region have published a number of articles related to predicting techniques [25], estimation of disease-related factors [26], and impact of prevention strategies [27]. The number of studies selected from the United States of America (USA) and the Indian regions constituted 15% and 6%, respectively. In addition, we put some studies under the public dataset category. This category represents the used dataset that either belongs to multiple regions or has been collected from an online portal (i.e., Kaggle, GitHub, and others). A large number of countries and real-world data provided a suitable ground to review the current scenario and future aspects in this area of research.

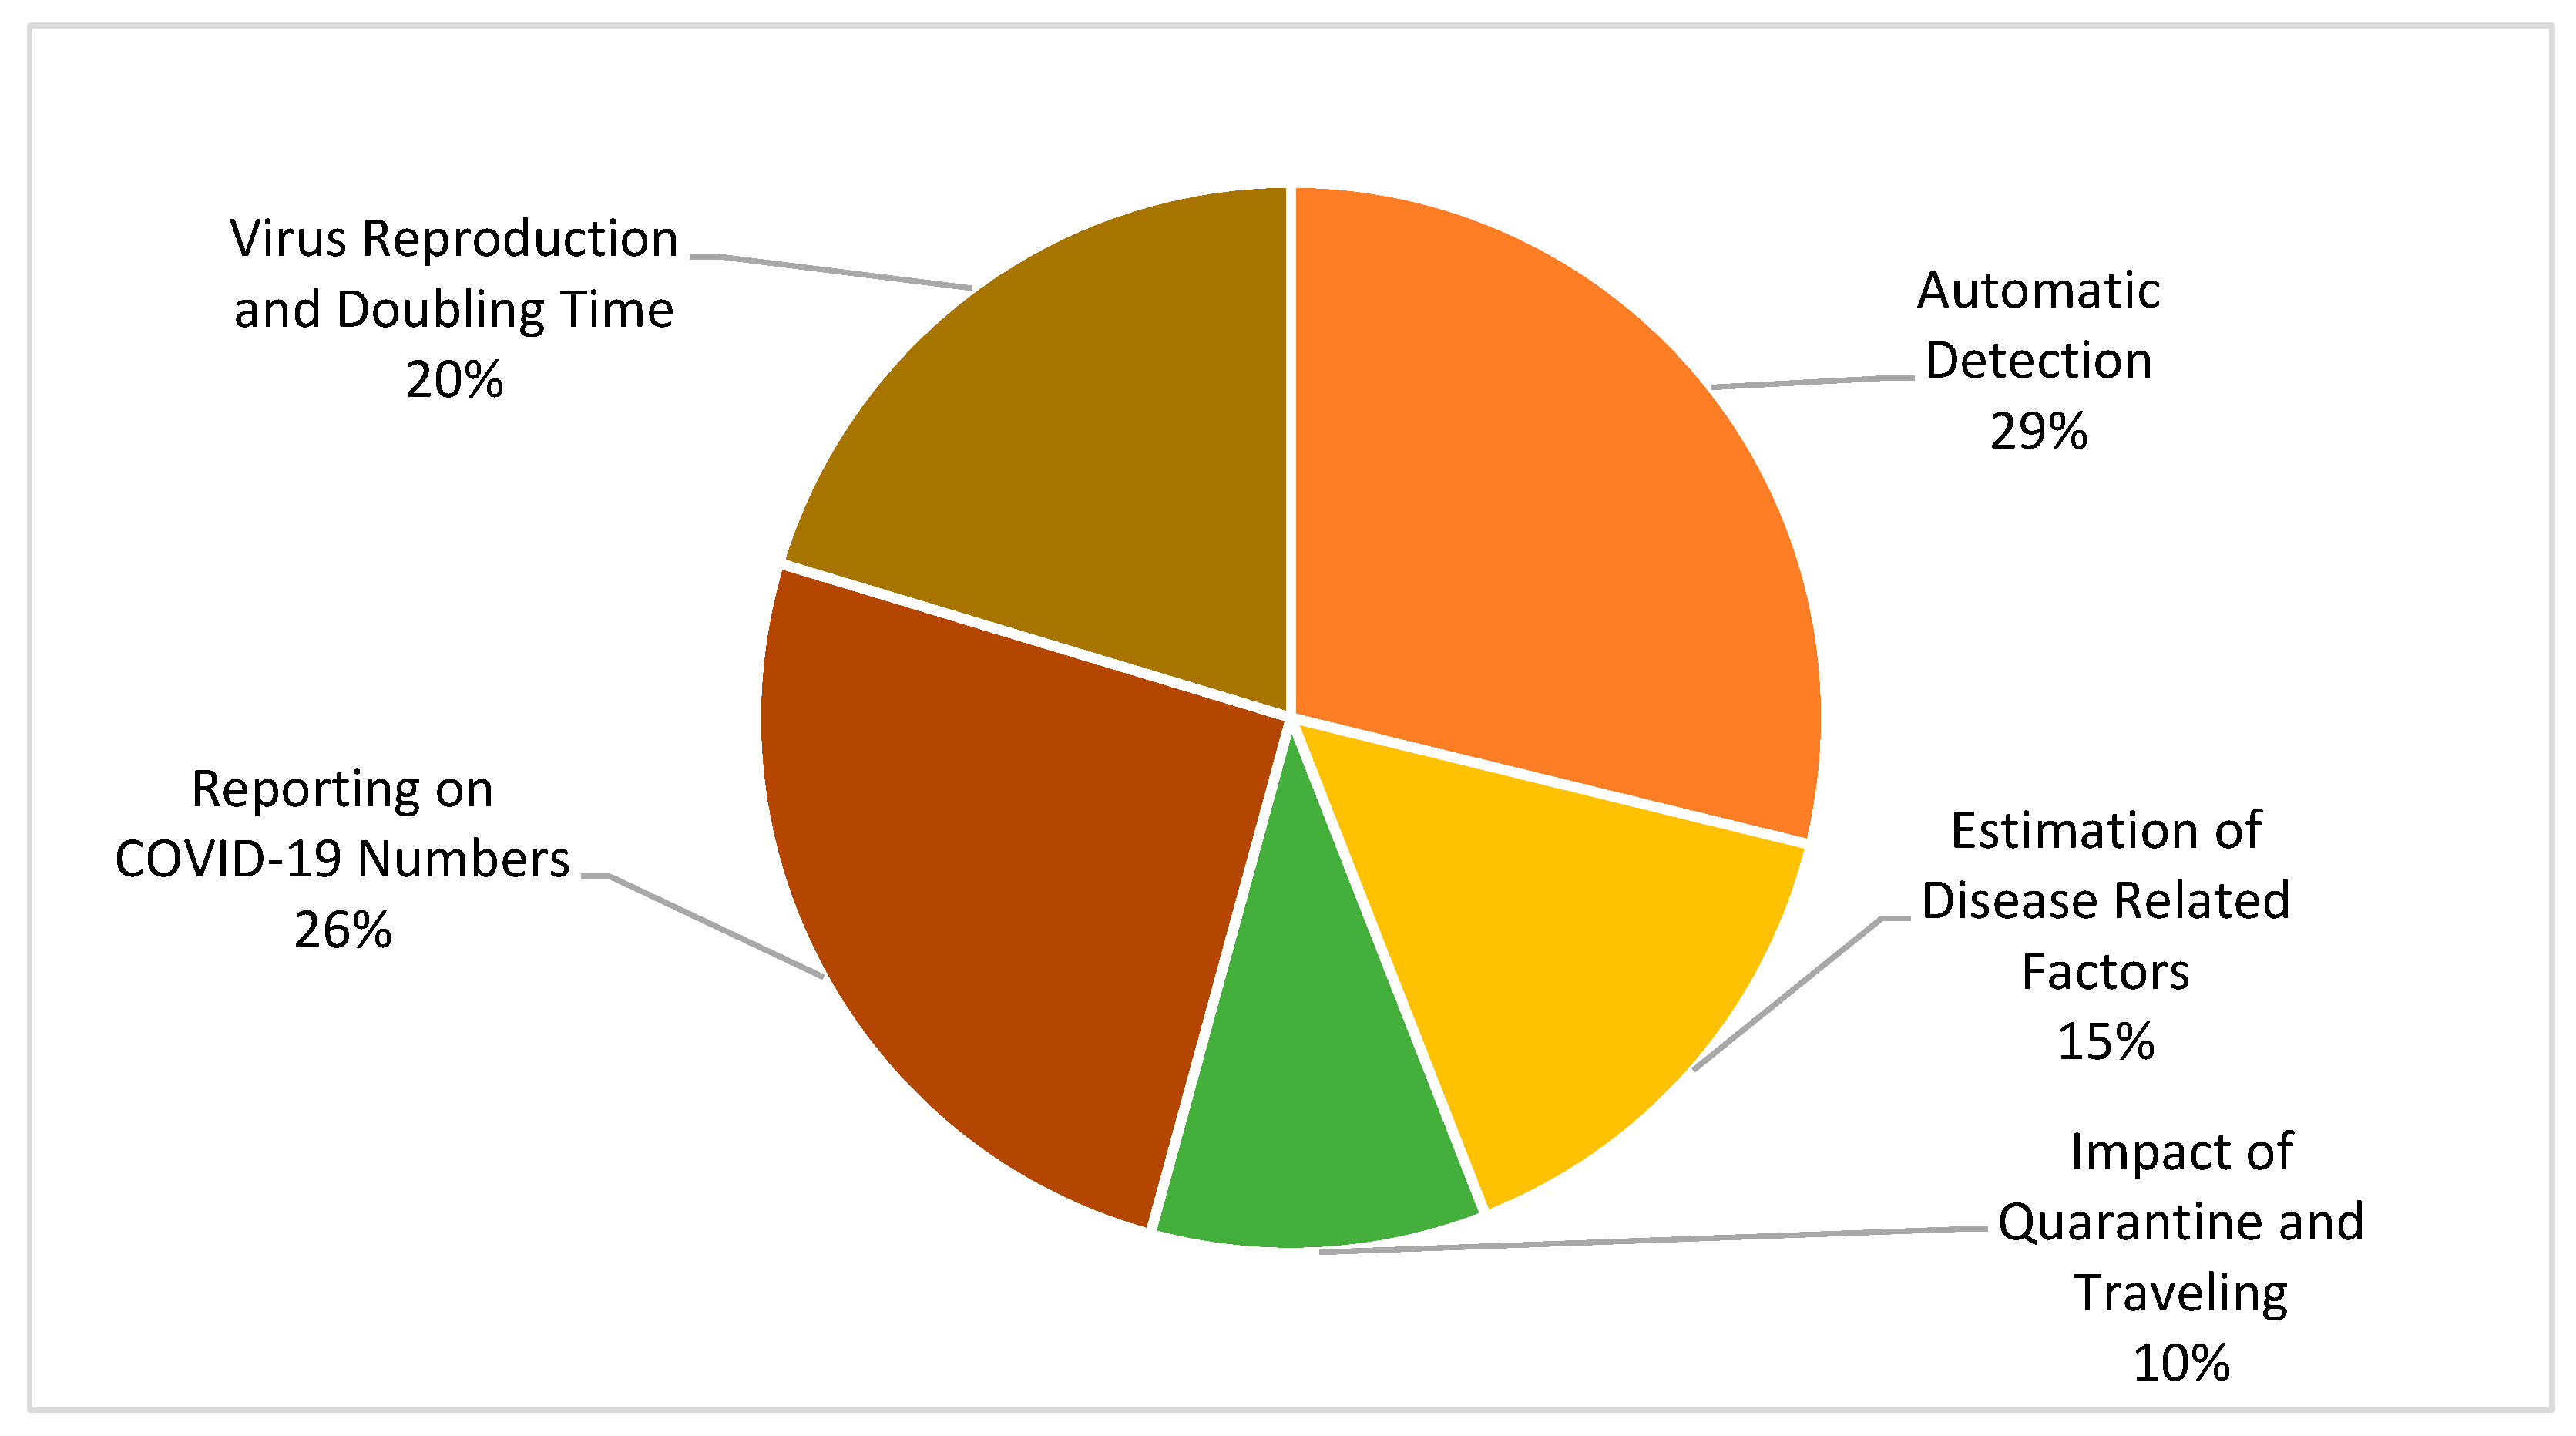
3.2. Research Domain

Most of the selected studies applied prediction strategies using different kinds of models. In brief, we avoid putting most of them under the prediction category and presented them in five categories based on the main research questions mentioned in those articles. Table 1 represents the five domains classification of selected articles as follows: (i) Automated Detection; (ii) Estimation of Disease Related Factors; (iii) Impact of Quarantine and Traveling; (iv) Reporting on COVID-19 Numbers; and (v) Virus Reproduction and Doubling Time. For instance, the “Automatic Detection” category combines different prediction models implemented for automating the process of diagnosing and treatment [28]. In addition, the number of studies that belongs to this category are helpful for automatic feature extraction and improving the learning process. For the most part, those articles used CT and CXR images that played a vital role in the early diagnosis and treatment of COVID-19 disease [29].
Furthermore, the category “Estimation of Disease-Related Factors” comprises multiple studies that demonstrated other factors and their correlation with COVID-19 disease. For example, a study defined the prevalence of depression and anxiety and its associated risk factors in the patients already infected by COVID-19 [30]. High temperature & humidity [31], and geo-location [26], are some other external factors used in the selected studies to measure their impact on COVID-19 spread or control. This classification table is useful for the researchers to find a group of research papers associated with the mentioned domain.
Table 1. Classification of Selected Research Articles.
Research Domain Classification Authors
Automatic Detection[15,28,29,32,33,34,35,36,37,38,39,40,41,42,43,44]
Estimation of Disease-Related Factors[25,26,30,31,45,46,47,48,49]
Impact of Quarantine and Traveling[27,50,51,52,53,54]
Reporting on COVID-19 Numbers[55,56,57,58,59,60,61,62,63,64,65,66,67,68,69]
Virus Reproduction and Doubling Time[64,65,66,70,71,72,73,74,75,76,77,78]
Predicting COVID-19 is handled in different ways and perspectives, from its detection to prevention there are so many areas where researchers have proposed computing solutions. The categories shown in Figure 4 portray the percentage of selected articles in different domains. “Virus Reproduction and Doubling Time” is the third largest category in this SLR and comprises 20% of the 57 articles. These articles reported epidemic doubling time and basic reproduction rate using previous data [73]. Overall, these estimates were useful for governmental authorities to prepare a number of guidelines for breaking the chain of COVID-19 infection.

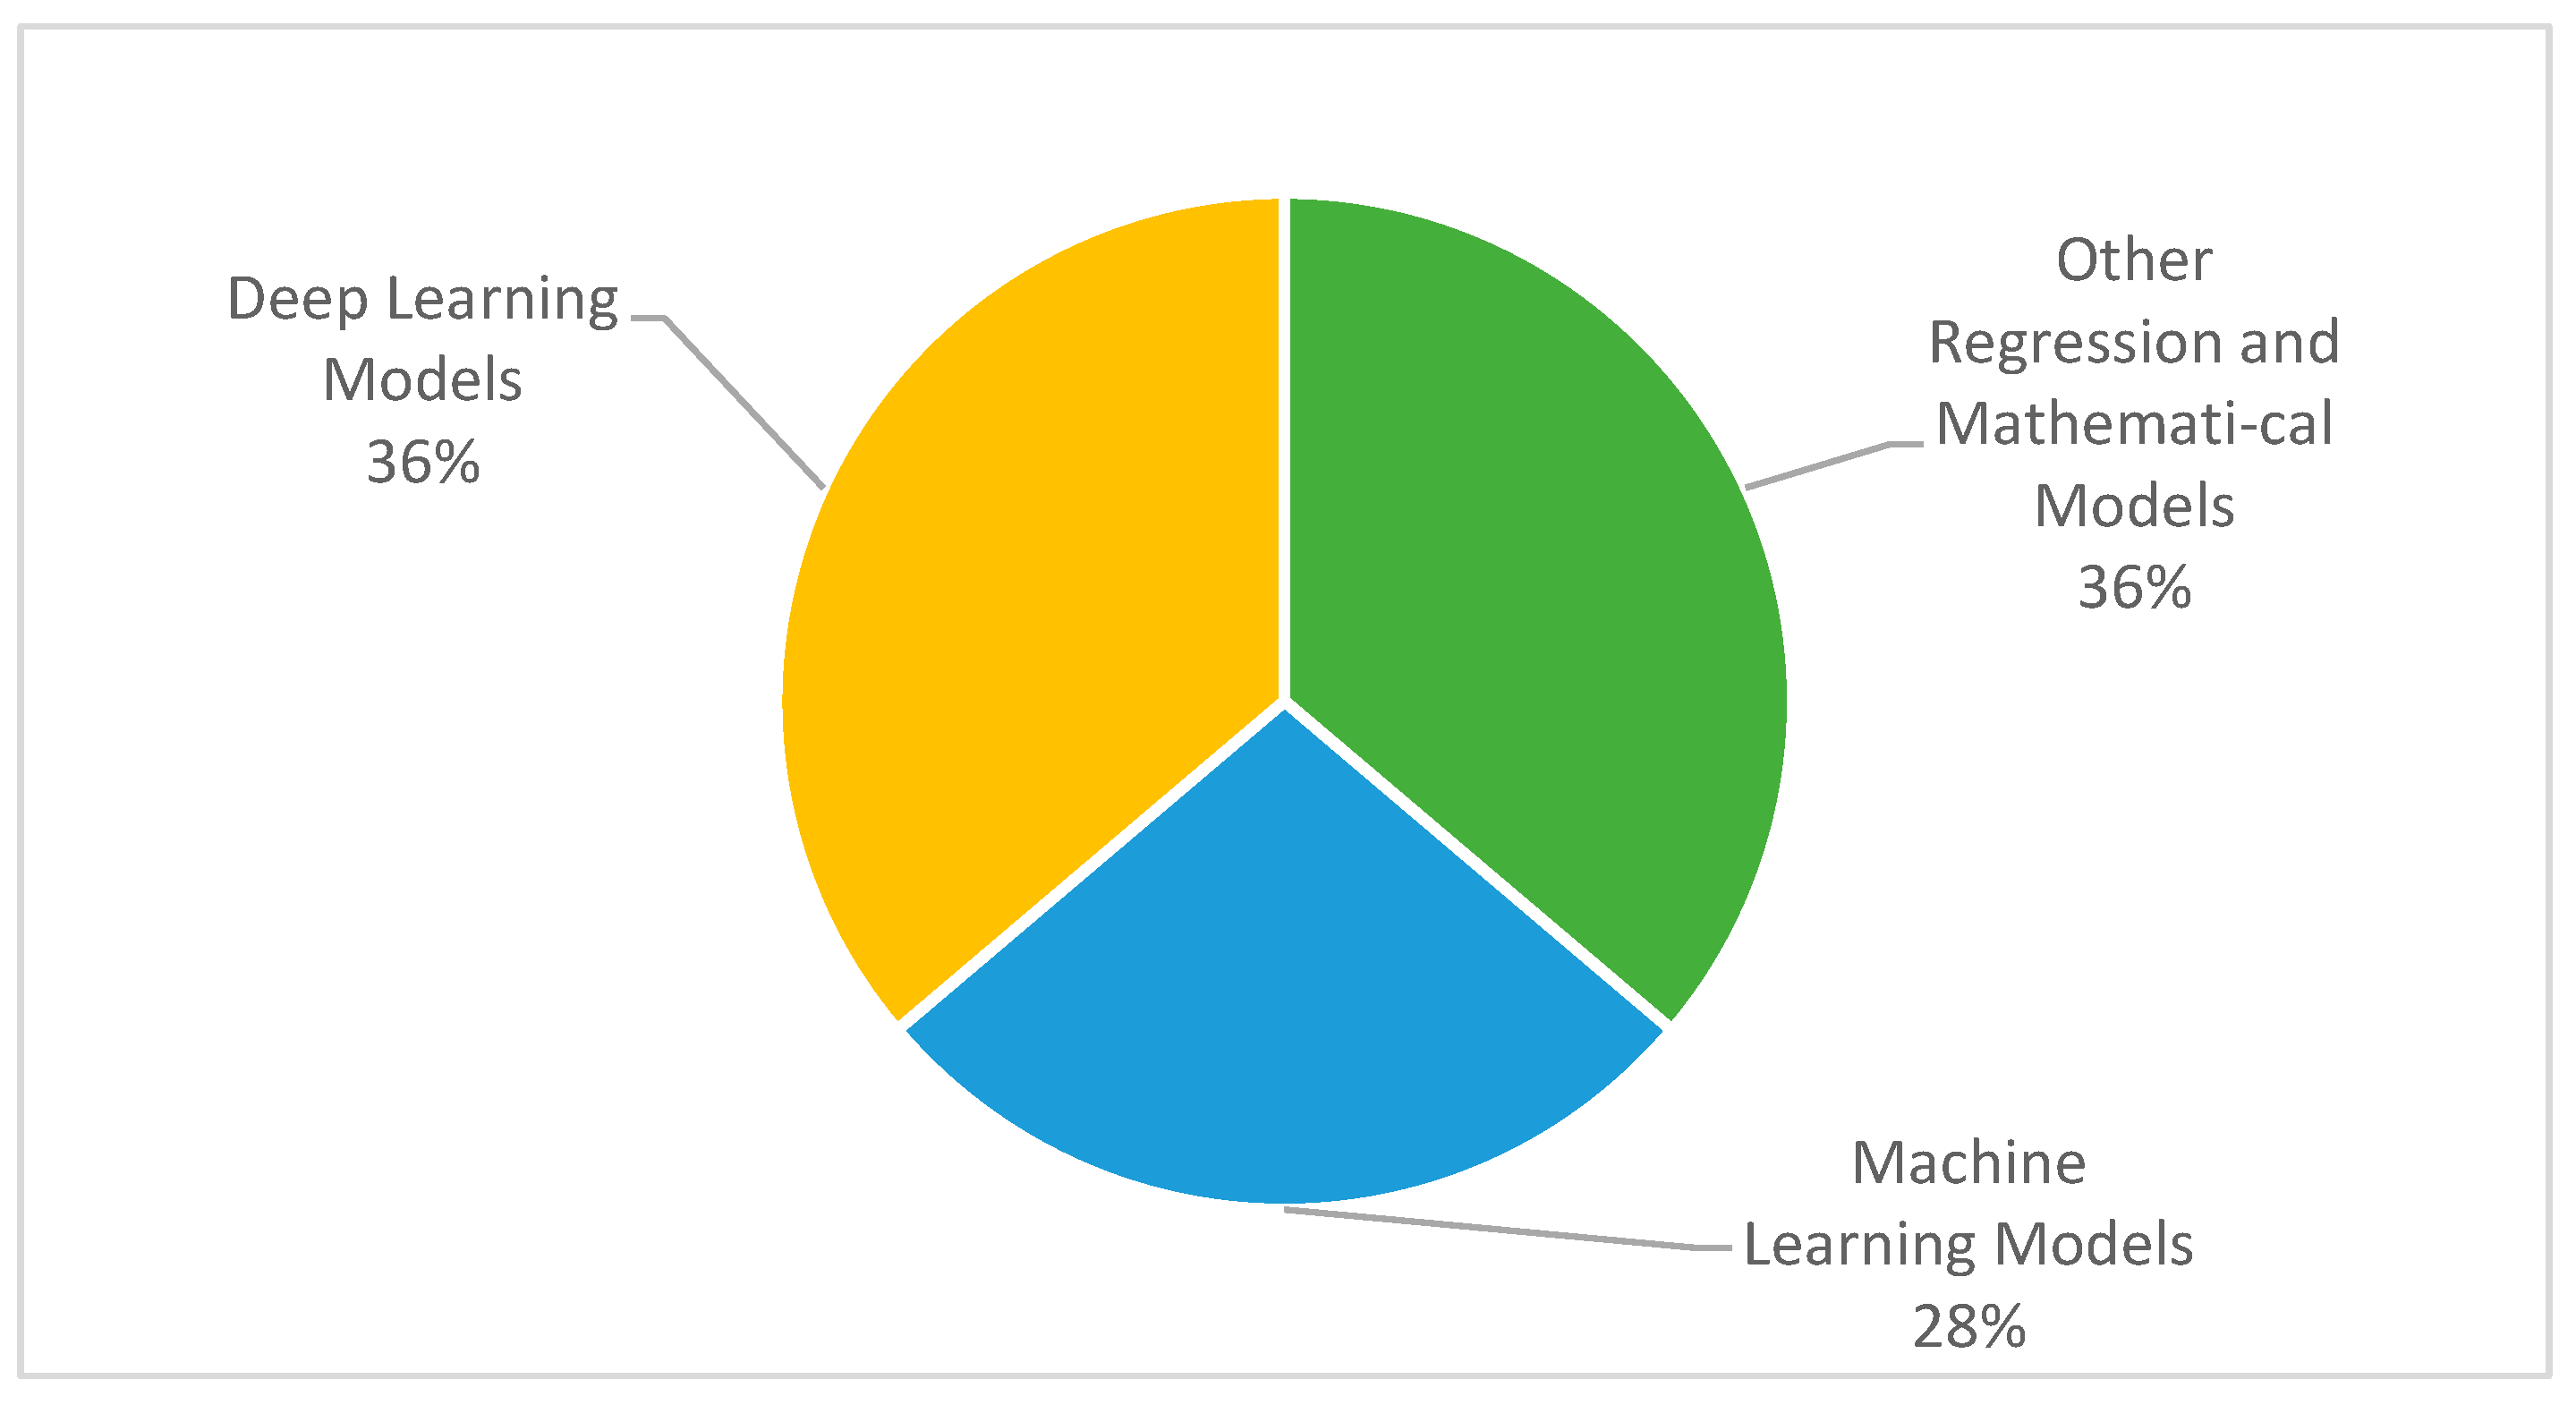
3.3. Types of Modeling Applied for Modeling COVID-19 Cases

The number of research domains discussed above has applied ML, DL, mathematical, or regression models. For the medical image classification task, DL techniques are considered feasible and suitable for automatic feature extraction and finding out the hidden patterns from those images. On the other side, a large number of ML algorithms are applied for the classification, identification, and analyze of COVID-19 cases. Figure 5 represents that 28% of the selected papers applied ML techniques, whereas 36% implemented DL, or other mathematical models, respectively.
The mapping of each article with modeling techniques is shown in Table 2. It can be evident from this table that all kinds of models are almost equally important and proposed several solutions while dealing with COVID-19. It summarizes that 21 out of the 57 selected articles used DL approaches, 16 out of the 57 employed ML, and a final 21 articles used other regression or mathematical models. Whilst the regression model is one of the ML techniques, we put regression models in the “Others” category, due to their dynamics, variety, and association with mathematical and statistical approaches. A detailed review of each type of modeling is presented in the subsequent sections.

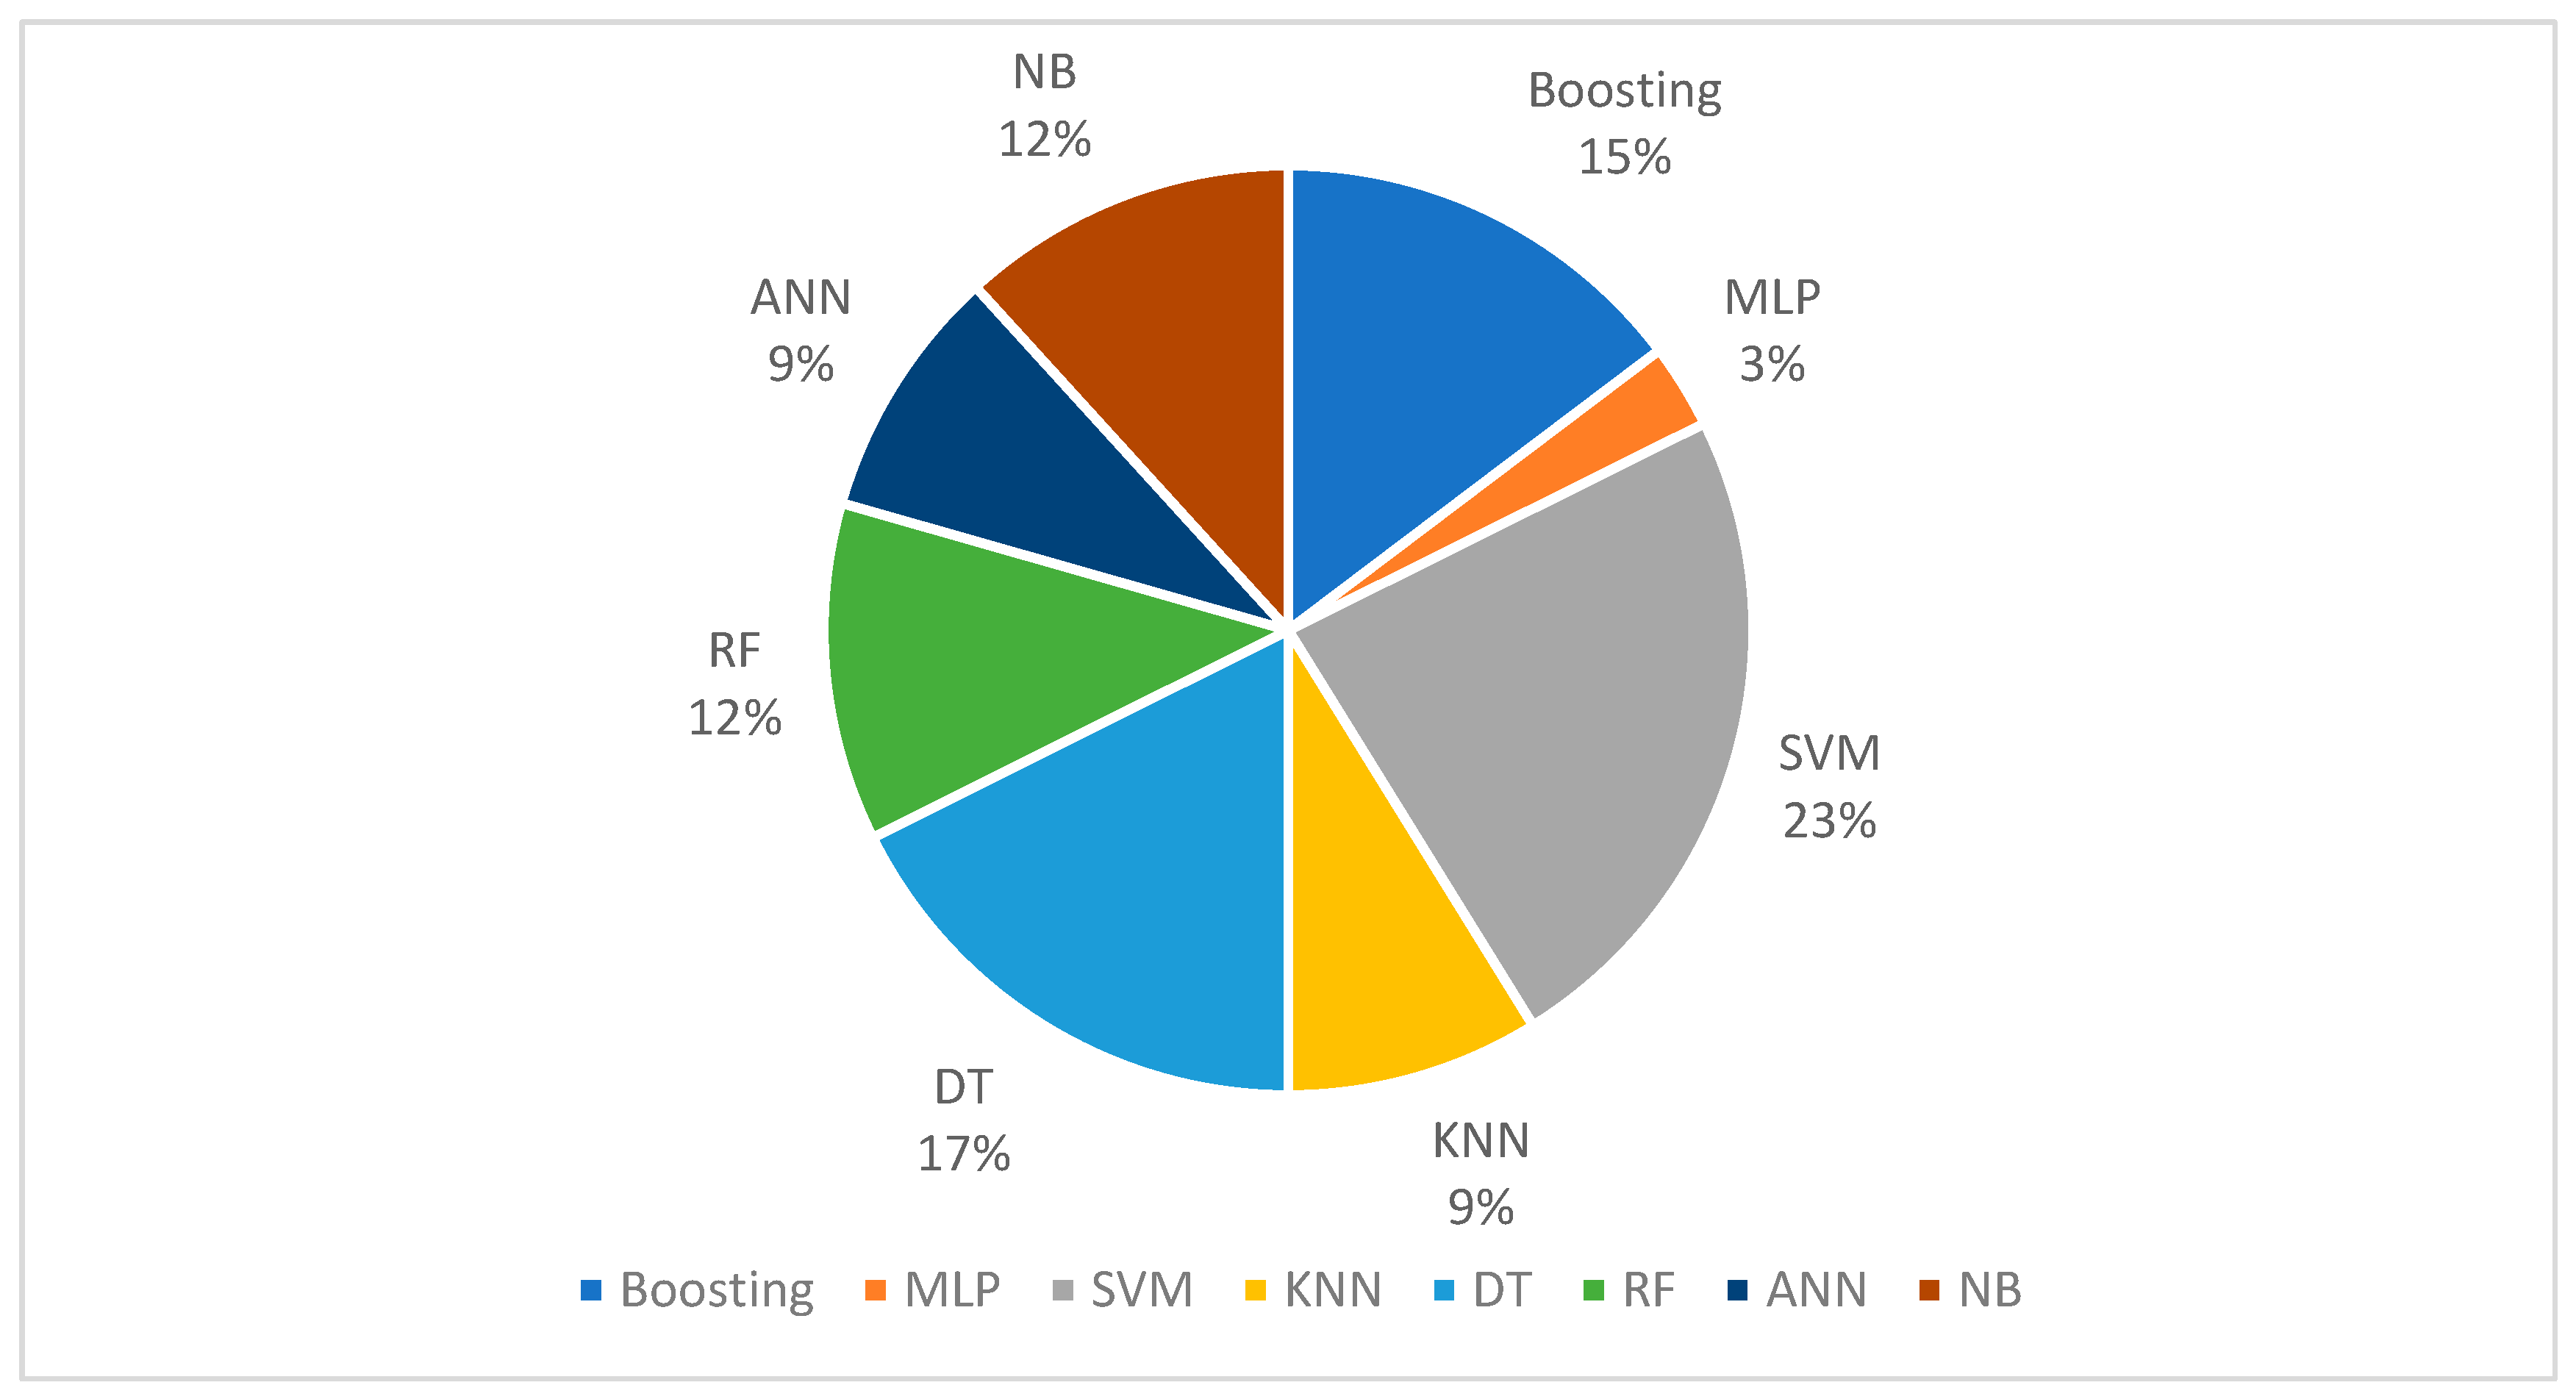
3.3.1. Machine Learning Models

Of the selected studies, 28% of the studies implemented ML techniques to propose learning procedures or to develop prediction models. As shown in Figure 6, over 23% of the articles employed support vector machines (SVM), whereas 17% Decision Trees (DT), 15% Boosting, 12% Naïve Bayes (NB) and Random Forest (RF), 9% Artificial Neural Net (ANN) and K-Nearest Neighbor (KNN), and MLP implemented recorded the lowest %, at 3%. Previous studies highlighted the importance of the ML algorithm for multi-purpose solution building, which was further justified through measured accuracy of the models. For instance, research was applied to the multi-region datasets for (i) predicting the spread of virus in different regions; (ii) virus transmission rate; (iii) ending point; (iv) weather conditions and their association with the virus [55].
Early assessment and identification of COVID-19 is helpful for effective treatment and it can also reduce the healthcare cost. A study used multi-ML models for predicting the infection status in different states of India [67]. Overall, 5004 patients were recorded with a cross-validation approach used for model implementation. For this, the ensemble model proposed using different classifiers such as SVM, DT, and NB. The model outperformed (accuracy: 0.94) as compared to other studies 0.85 [79] and 0.91 [80].
The use of ML approaches for COVID-19 disease recorded several frameworks. One study analyzed the multiple symptoms to identify risk factors for clinical evaluation of COVID-19 patients [49]. The study used 166 patients of different age groups including demographic features, disease history, and other test information. The study applied a multi-model (ANN, SVM, and Boosting) approach, in which ANN outperformed other classifiers with 96% accuracy. Moreover, it is also useful for real-time forecasting purposes, as discussed in a study applied to the time series data collected from Johns Hopkins [56]. The model provided predictions for the next 3 weeks and the results were suitable for the higher authorities to plan resources and prepare policy accordingly. In the same way, another study proposed a model using SVM and DT that forecasted the next six months in Algeria [57].
Scholars suggested ideas to support the government by predicting numbers on potential virus growth using different variables. In the study, factors such as weather, temperature, pollution, gross domestic product, and population density were used to develop a prediction model [25]. The collected dataset was associated with the different states of the USA. SVM, DT, and regression-based models were applied in this study to forecast the spread of the virus. SVM performance showed 95% more variation than other models. The study further suggested that population density can be a critical factor to analyze the size of the spread. The author explored a good factor, but comparing this factor in high and low population regions can provide better results. In addition, the impact of quarantine was measured using data collected from three countries (Italy, South Korea, and the USA) [51]. The study recommended that strict government policies for isolation played a significant role in halting the virus’ spread.
The review process in this study identified several facts about ML techniques. According to the studies selected in this paper, the most useful model is SVM, which has been used in 23% of articles. DT (17%) and Boosting (15%) stand in second and third place. Based on the review performed on selected case studies, the ML approach is useful to predict future growth [55], severity detection [47], analyzing CT radiomic features [63], CT images’ classification [37], measuring the impact of social restrictions on virus spread [27], the importance of travel restrictions in reducing virus spread [52], measuring depression and anxiety in COVID-19 infected people [30], and using population density as the main factor for prediction [25]. The model evaluation has shown extraordinary performance in different studies, such as for severity detection (Classifier: SVM, Accuracy: 81%, China) [47], CT images classification accuracy (Classifier: SVM, Accuracy: 99.68%, China) [37] (Classifier SVM, Accuracy: 92.1%, Multi-region) [55], and spatial visualization (Boosting, R2: 0.72, China) [26].

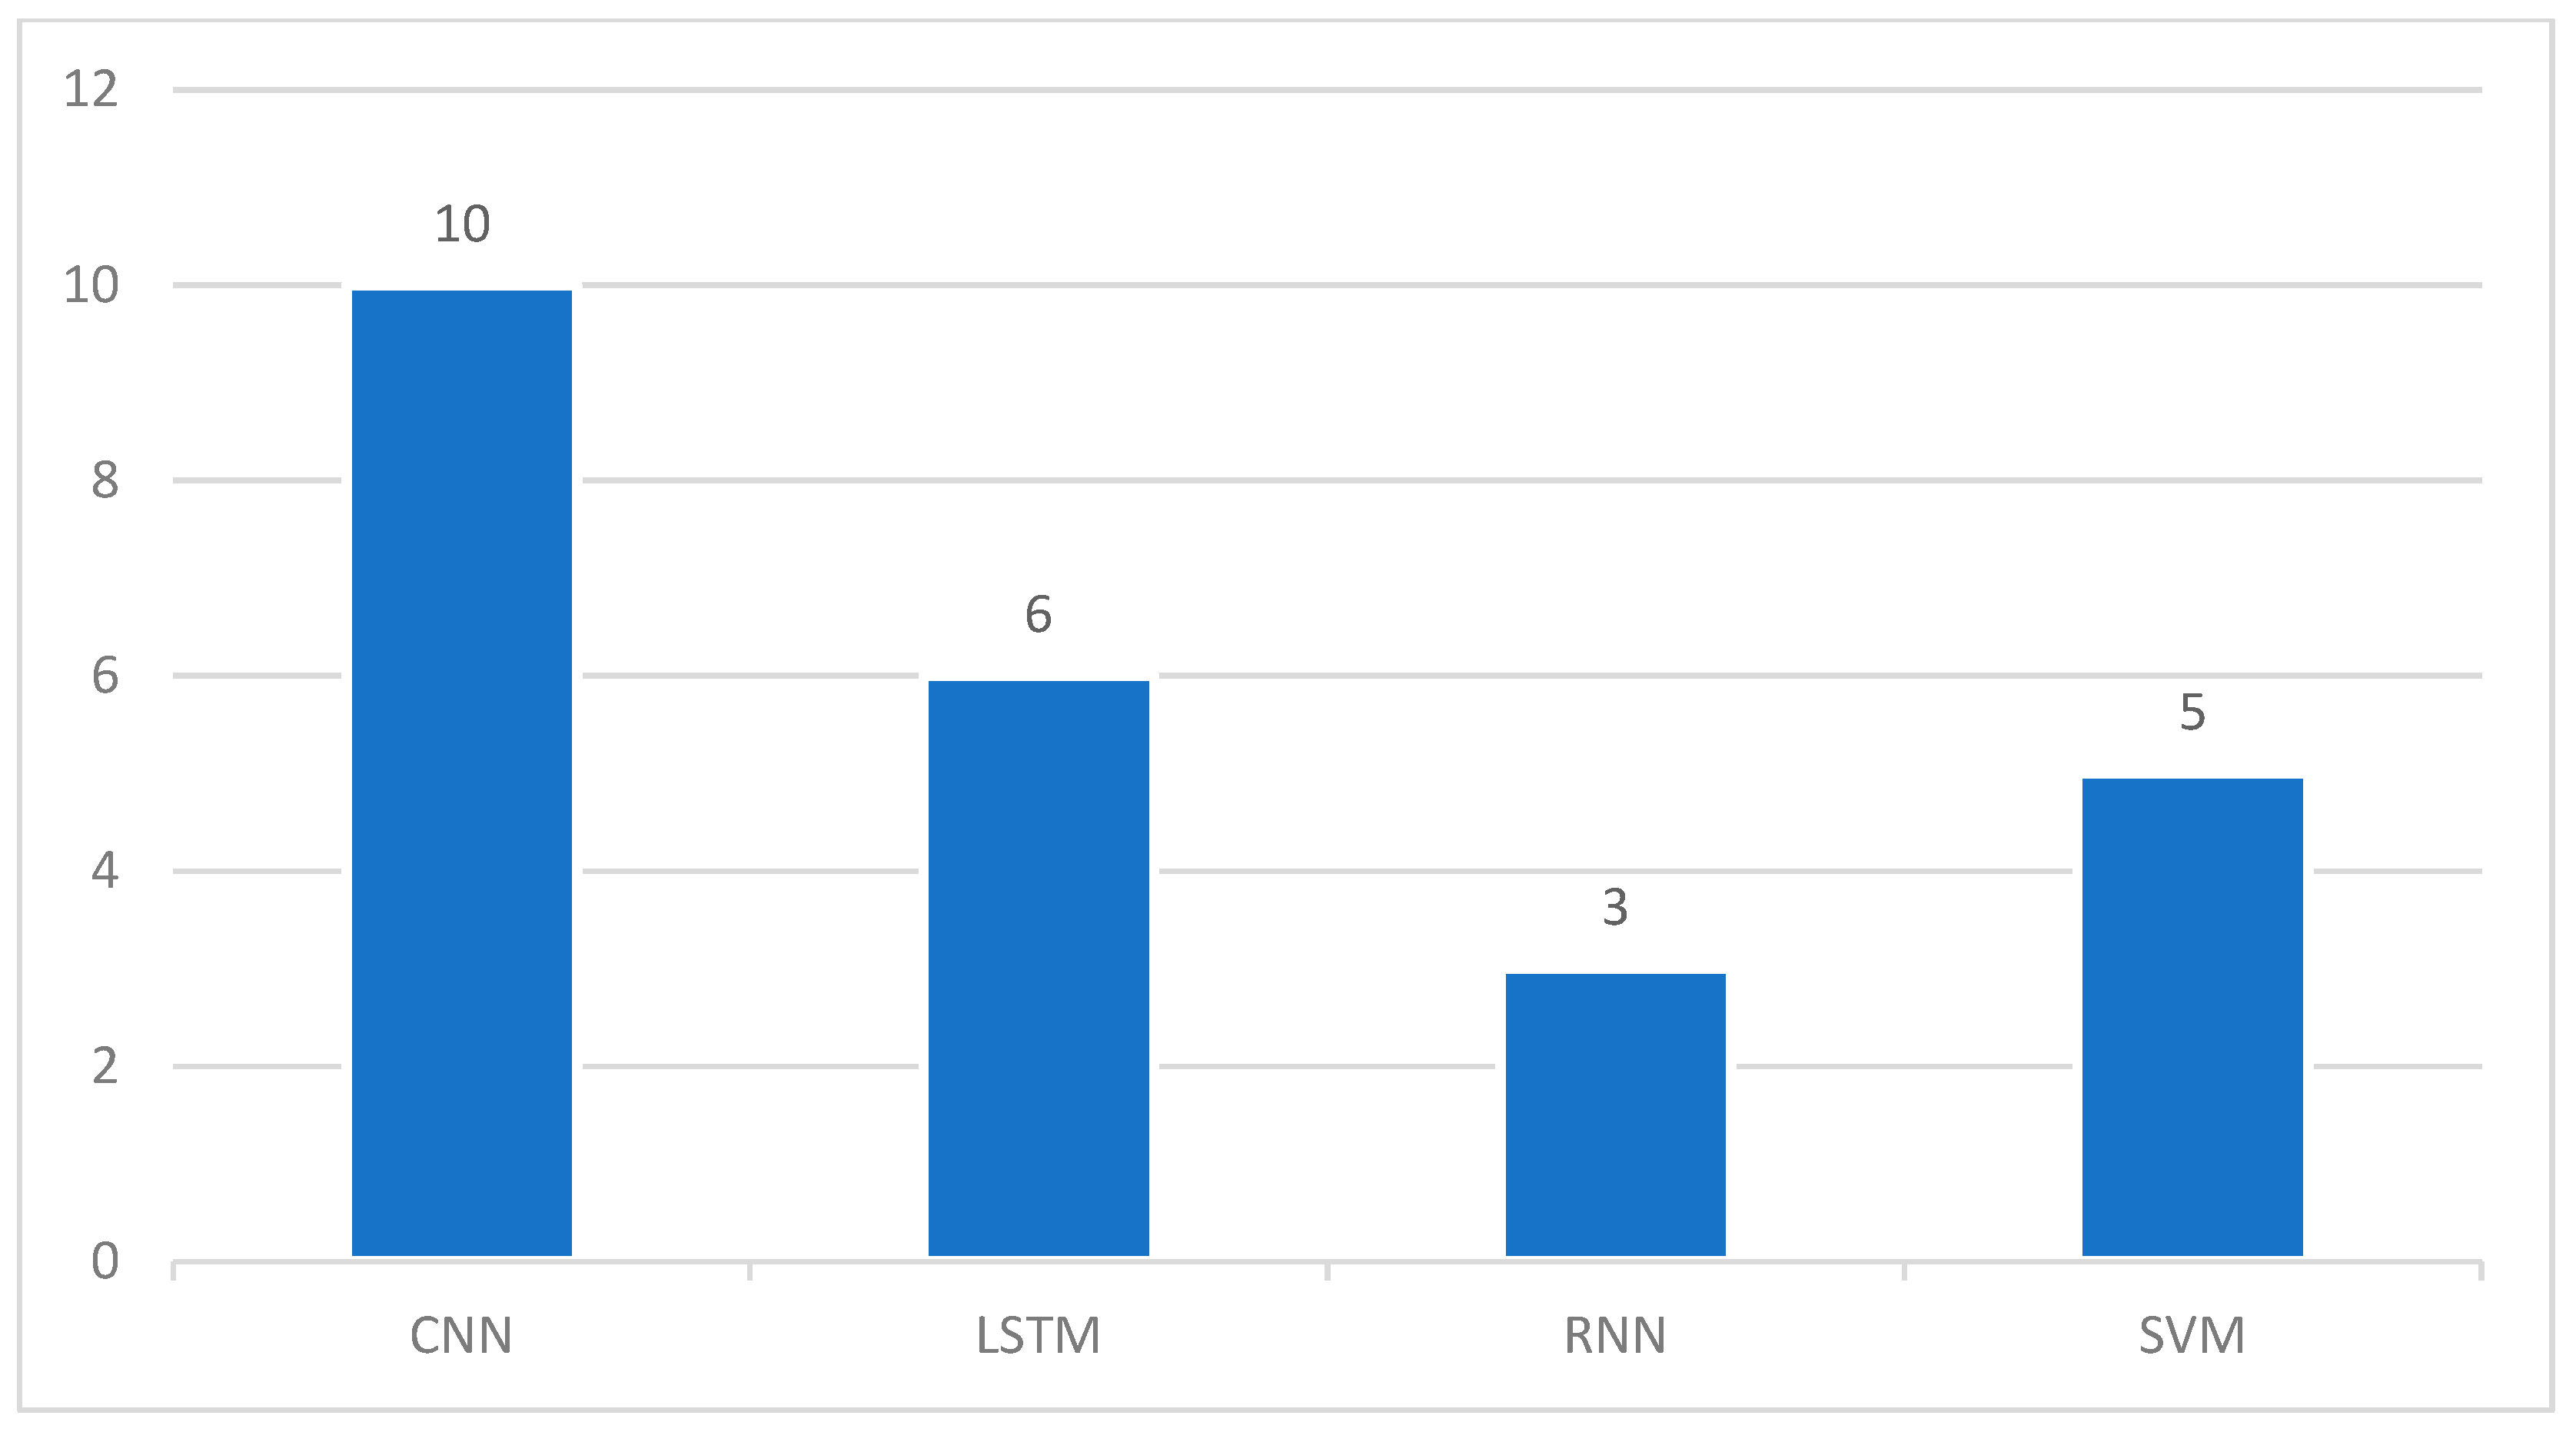
3.3.2. Deep Learning Models

Another major development presented in this SLR study is to review published papers that performed DL techniques to automate the COVID-19 detection process and predict a number of cases. Fast diagnostic methods and deep analysis can help and control COVID-19 spread and that is strongly supported by DL methods. In this SLR, based on the review performed on the selected cases, Figure 7 elaborates on the DL models and the number of times they are used in selected studies. The figure explains the usefulness of the Convolutional Neural Network (CNN) model as it has been used in 10 different articles from the selected studies. Although LSTM is the modified version of Recurrent Neural Network (RNN), to be more specific, we kept them separated and used the same name as mentioned in the studies. Altogether LSTM and RNN were used in nine different articles.
The use of a CNN-based deep neural system for medical image classification has been known for its better feature extractions’ capabilities [15,29]. A research team proposed and used 10 different types of CNN-based models to classify the images into infected and non-infected groups [32]. For this, 1020 CT images, and 108 patients’ records were used for the model implementation and validation process. ResNet-101 and Xception showed the best performance with accuracy measured as 99.51% and 99.02%, respectively, although high accuracy could be tested by adding more images from different classes. In addition, research applied the CNN technique to distinguish the infected and non-infected person using their CXR images. For better accuracy and automatic feature detection, transfer learning with CNN approach applied which helped to achieve accuracy, sensitivity, and specificity as 96.78%, 98.66%, and 96.46%, respectively [28].
As per the recommendations collected from different studies, DL approaches could be helpful in several situations. Commonly, different studies used CNN methods to classify CT and CXR images (Classes: COVID-19 infected, viral pneumonia patients, normal patients) [34,36,44], whereas model accuracy recorded more than 90%. In addition, these strategies most of the time used a split validation approach. Another study proposed CNN-based architecture (STM-RENet) to analyze and identify radiographic patterns and textural variations in CXR images of COVID-19 infected people [39]. The proposed model achieved an accuracy of 96.53%, which can be adapted for detecting COVID-19 infected patients. COVID-Net, a CNN-based network system for automation in clinical decisions [35], detection of COVID-19 using SVM classifiers [42], and predicting severe and critical cases based on clinical data of patients using SVM classifiers [33] are some other valuable researches that can provide potential feedback to the medical and higher authorities.
The idea of providing a more robust forecast is presented in a research paper with the help of the LSTM framework and mathematical epidemic model [64]. The paper proposed a model that can predict the number of cases on daily bases for the next 15 days with reasonable interpretation. Similarly, another integration was presented using LSTM and Auto-Regressive Integrated Moving Average (ARIMA) techniques, that can forecast for the next 60 days [65]. LSTM has been applied in another study that used time series analysis, evaluated the model, and forecast the number of cases for the next 15 days, applied to the Moscow dataset [59].
The implementation of DL models assisted positively in this epidemic situation to encounter the issues related to automatic infection detection using CT or CXR [43], finding out hidden features [48], forecasting for the next few days [68], and correlating external factors with COVID-19-like social restrictions [27], or spatiotemporal data [50]. According to the selected studies, the range of forecasting provided was from 15 to 60 days. The most common evaluation metrics used were RMSE and MAPE. In addition, for classification tasks the common evaluation metrics used were sensitivity, specificity, and accuracy, which most of the time measured more than 90% [38,41].

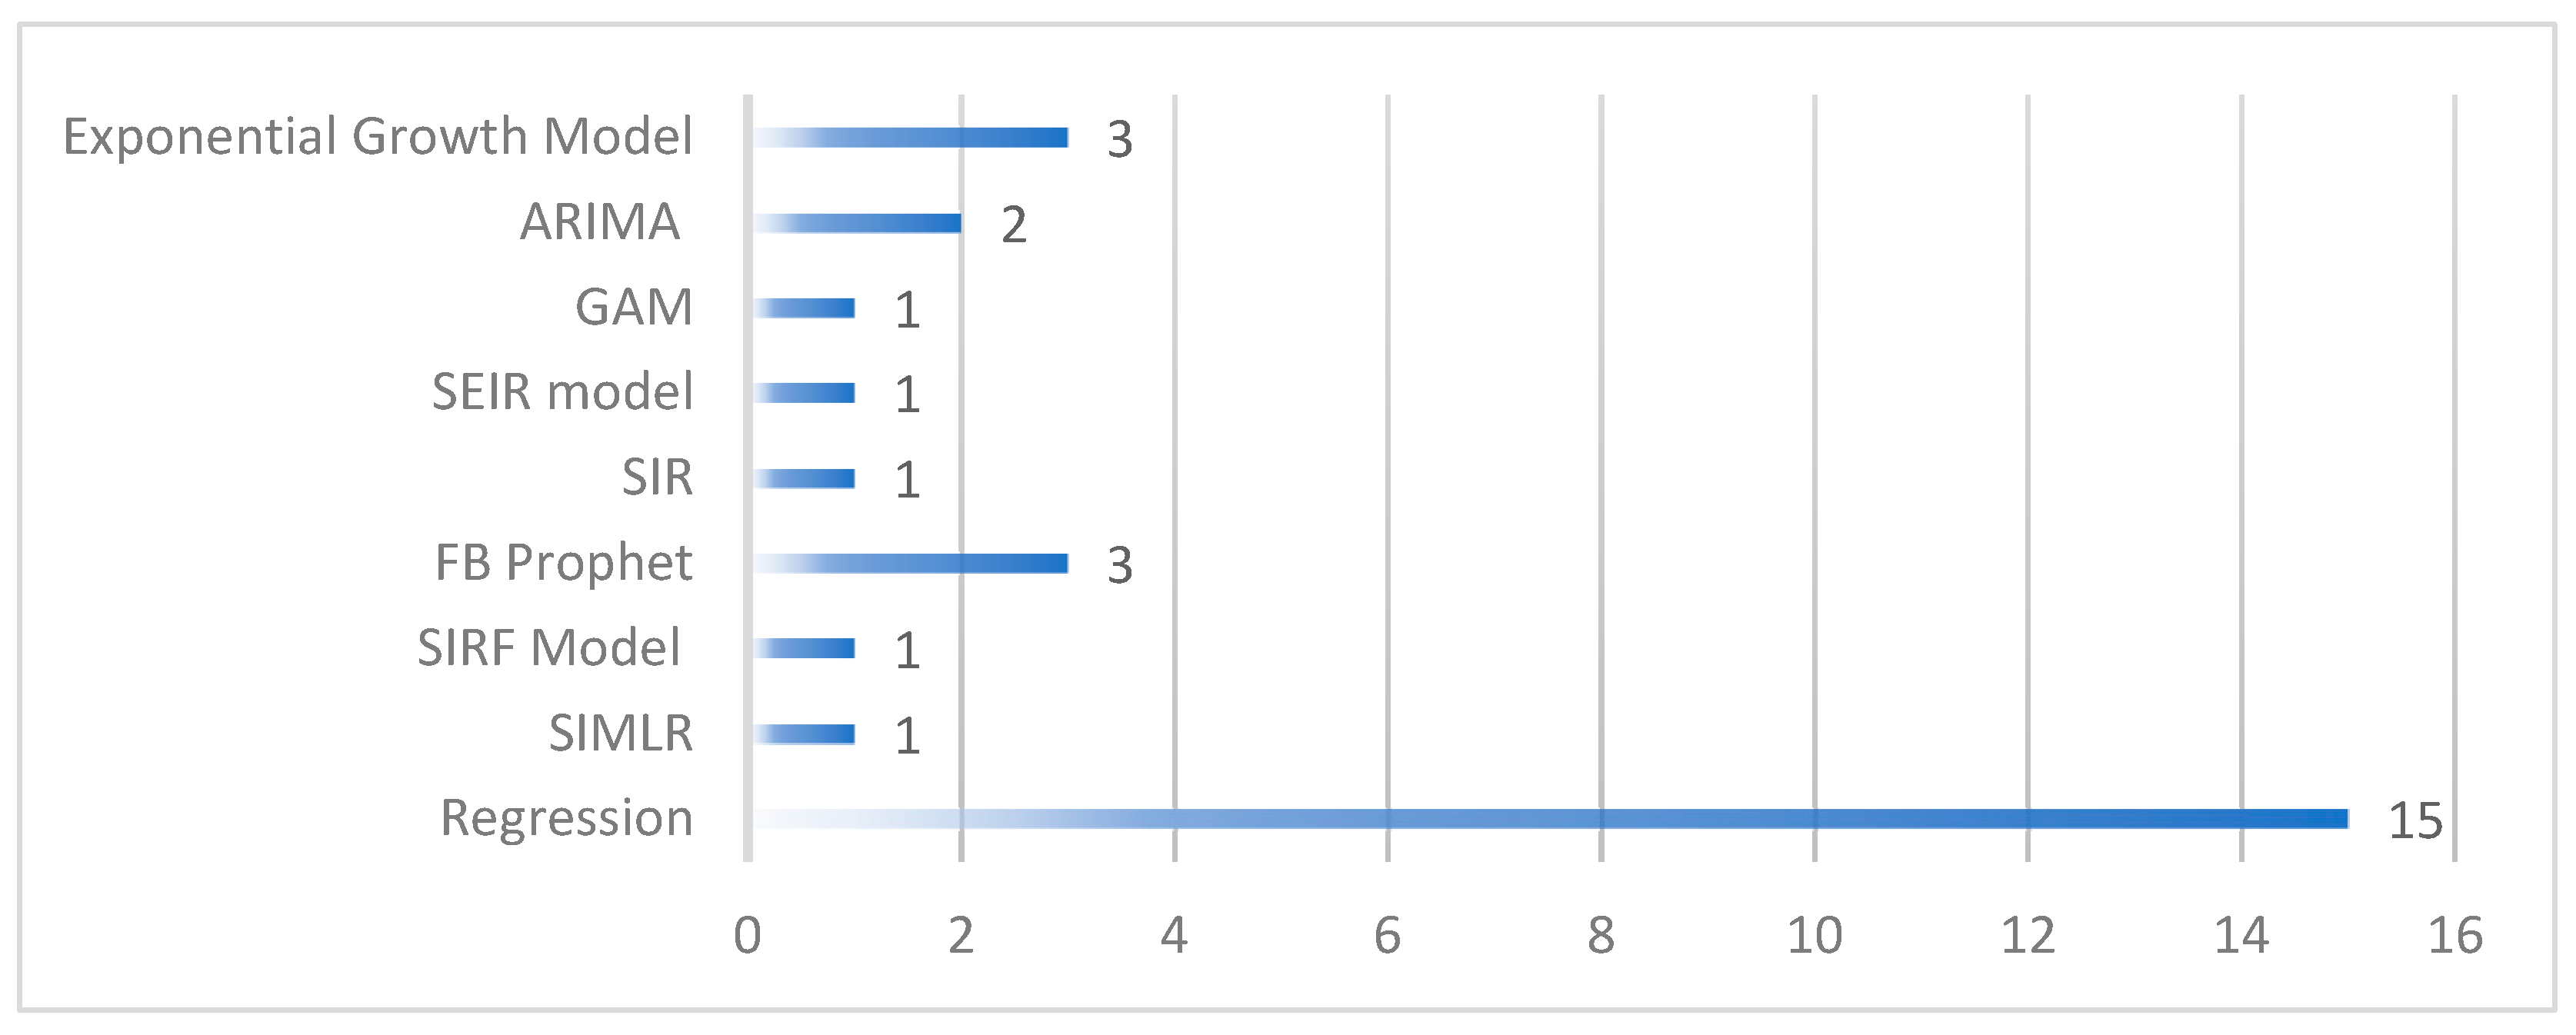
3.3.3. Others (Regression and Mathematical Models)

This category combines different mathematical, statistical, regression, and compartmental models that provided a number of solutions in this epidemic situation. These compartmental models use groups of populations and employ mathematical equations using different disease-related factors [24]. These models are also helpful for early prediction, growth rate, number of deaths, and recoveries, which ultimately can provide assistance to higher authorities in controlling the situation. Figure 8 represents the number of models covered in this category and used in selected case studies. Regression analysis (15) is at the top, which has been proved several times to apply time series analysis and forecast for future infections. In addition, the exponential growth model, the SIR Model (Susceptible, Infectious, Recovered), and its extended version such as SEIR (Susceptible, Exposed, Infectious, Recovered), SIRF (Susceptible, Infectious, Recovered, Fatalities), and SIMLR (Susceptible, Infected, Machine Learning, Recovered) are used in selected cases.
SIMLR is an extension of the basic epidemiological SIR model that is integrated with the ML approach, applied to track the changes in policies and guidelines applied by governmental authorities [58]. The main purpose of this model was to forecast one to four weeks in advance in Canada and the United States. The results generated and presented a comparison of MAPE in different states. Using a dataset up to July 6, 2021 (India and Israel) the SIRF model was proposed, which extended the basic SIR model by adding fatalities data and can forecast for the next 100 days [60]. In addition, the third extended version found in the selected studies is SEIR, integrating with the “exposed” parameter. This study proposed a simulation-based approach applied to the past 300 days’ data from China to see the impact of prevention strategies [53].
Multiple regression models were applied in a study to predict the number of positive cases in the next few days [25,30]. The idea was to strengthen government policies in order to reduce the number of infected people [66]. For forecasting purposes, the study collected data (22 January 2020, to 12 July 2021), where the study suggested that if the current number of cases are 5000, it can be doubled in the next 5 days. Similarly, the linear regression method was applied to estimate the basic reproduction rate based on the data (1 March–18 May 2020) collected from different regions of the United States [46]. The main idea of this study was to analyze the impact of face-coverings in different states. The result estimated that the total number of infections at the end of May could reach up to 252,000, which shows the positive impact of face coverings. The regression model was applied in different studies and highlighted multiple factors, such as higher temperature, which would help to reduce the transmission rate in China and the USA [31], while the study conducted in Brazil did not support the same idea [45]. Some other time series forecasting models such as FB Prophet applied in Bangladesh (estimation size: 8 March 2020 to 14 October 2021) [61], India and Israel (estimation size: July 6, 2021) [60], ARIMA in China (estimation size: 22 January 2020 to 7 April 2020) [69] are some useful models that can help their country’s representatives to prepare guidelines and prevention strategies.

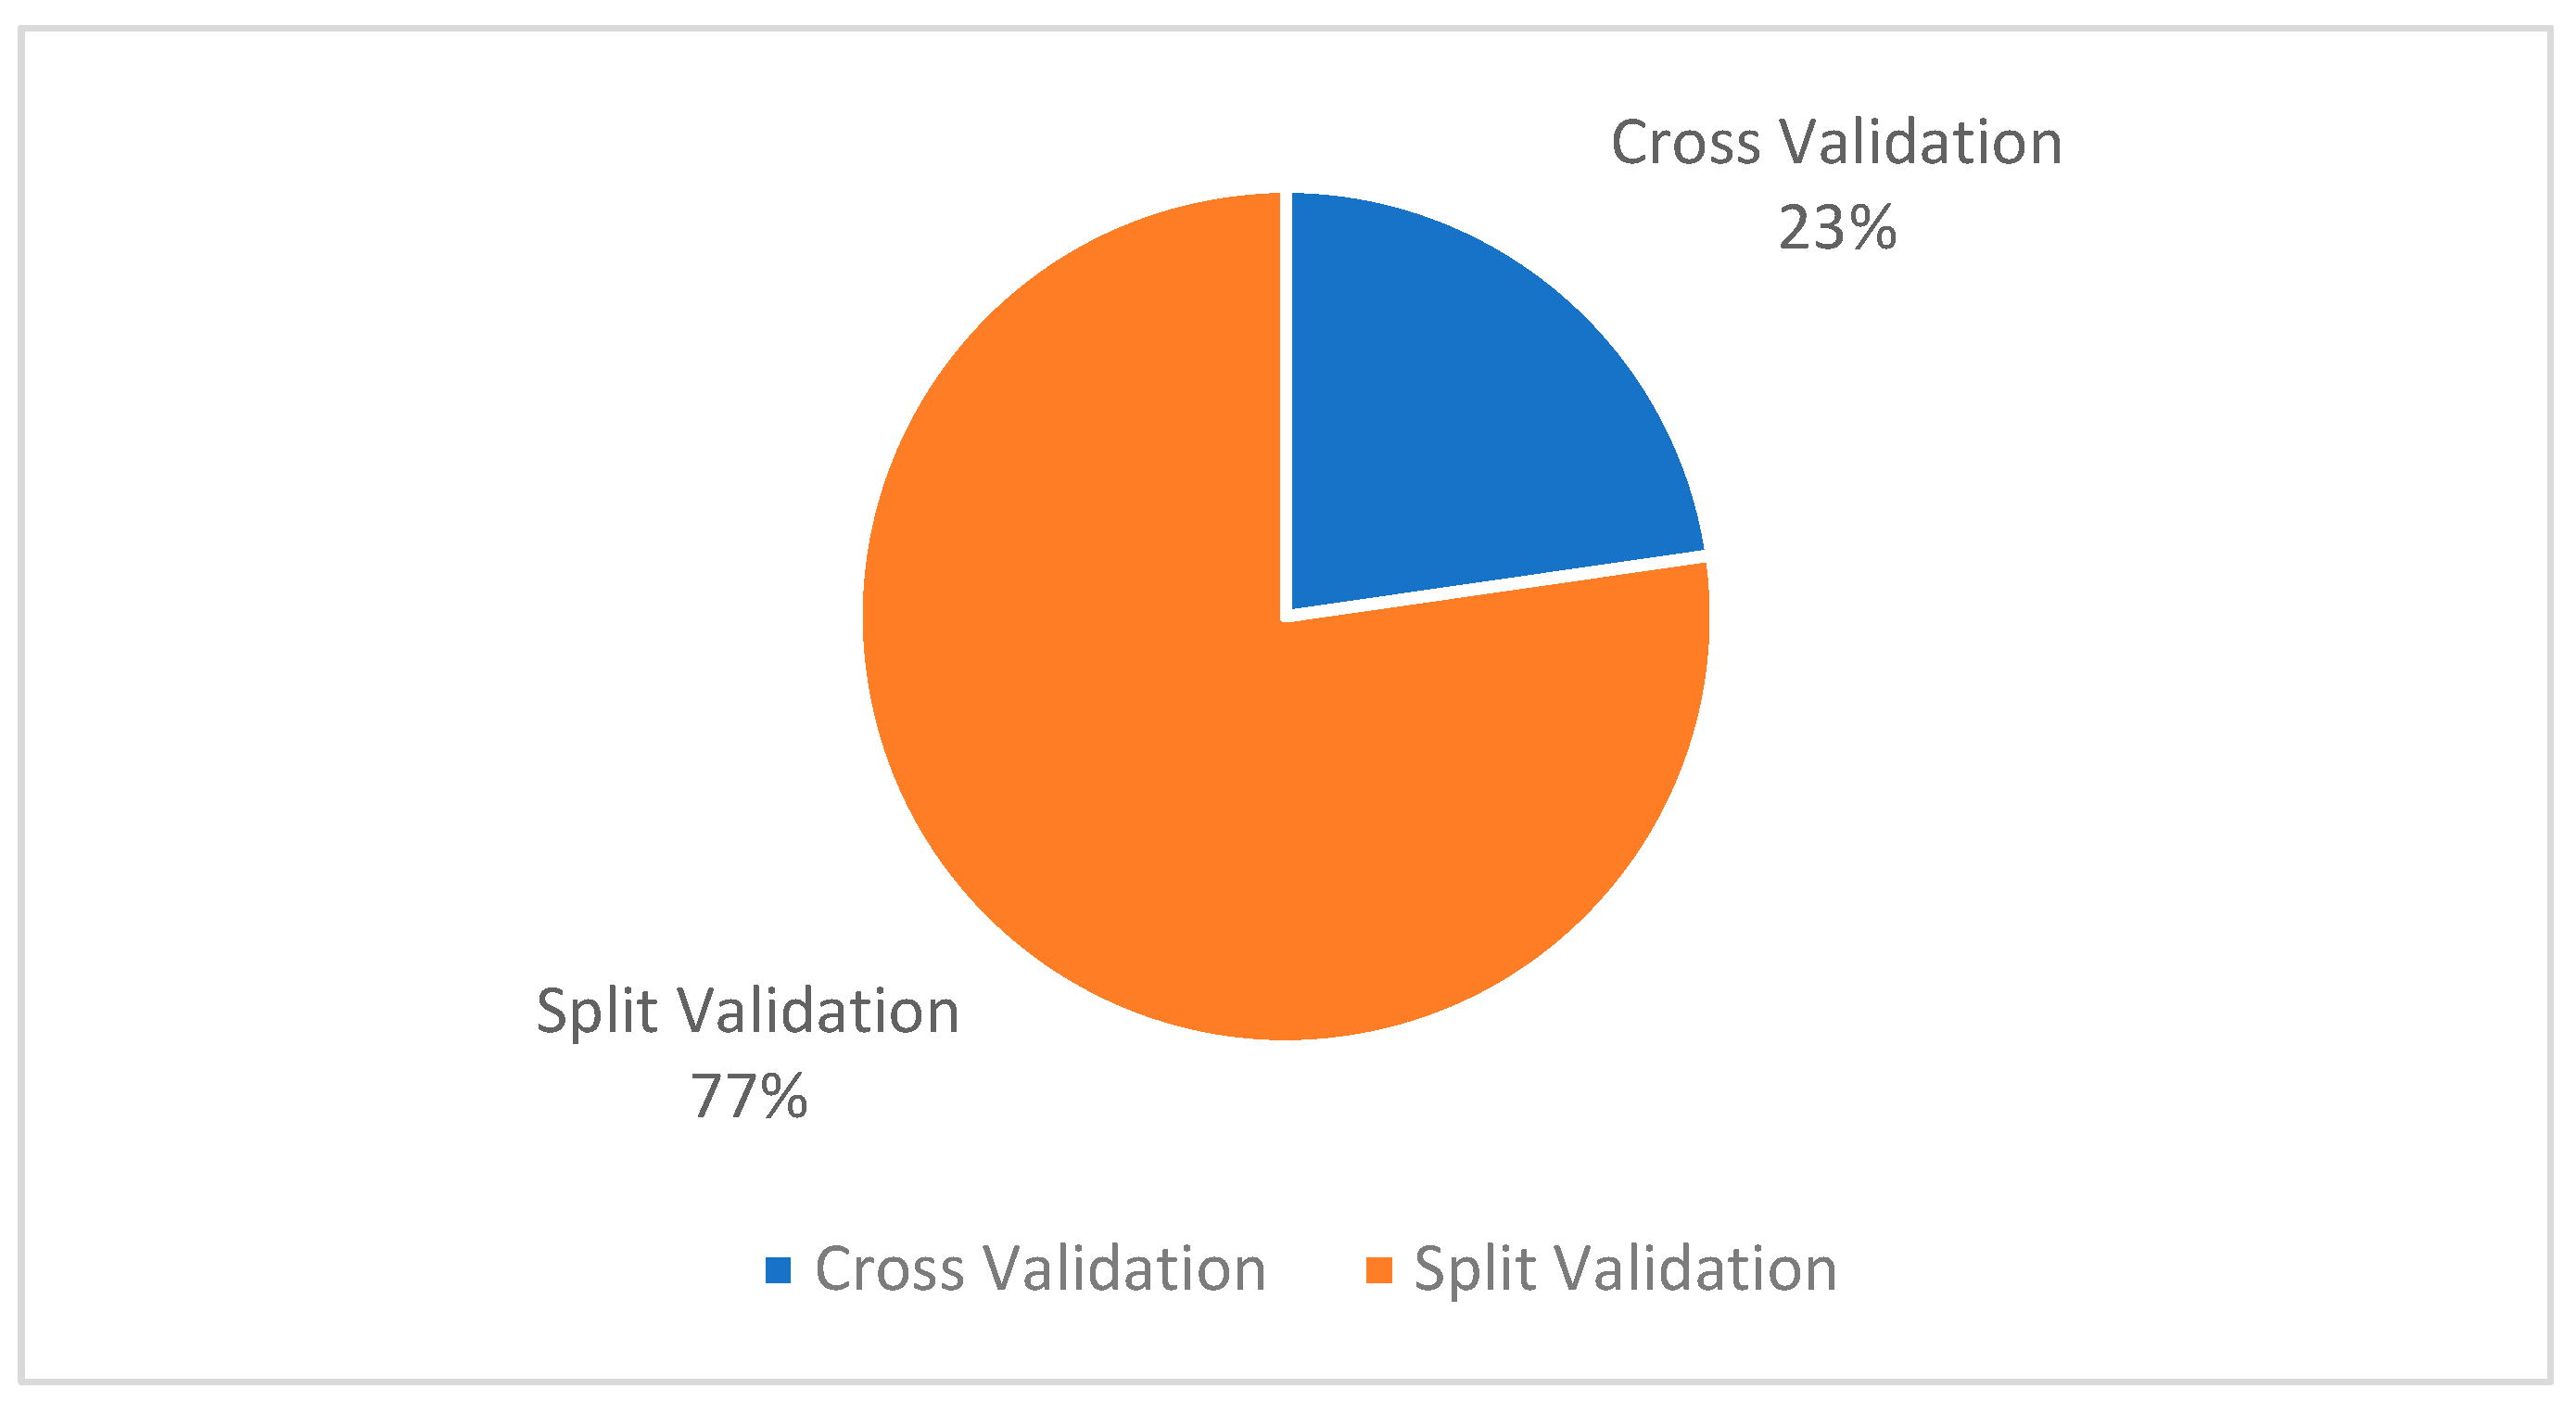
3.3.4. Model Validation Strategy

In this section, we elaborate on the number of validation strategies applied in selected case studies and their ratio, to understand the most favorable validation method in the current situation. As shown in Figure 9, most of the selected studies employed split validation (77%) strategies. One of the reasons behind split validation could be the availability of a smaller number of datasets. As per the importance and quality of cross-validation strategy discussed in previous studies [81], it could be a critical point for the future researchers to: (i) encourage dataset availability on the public platforms; (ii) assess the difference between both validation strategies.

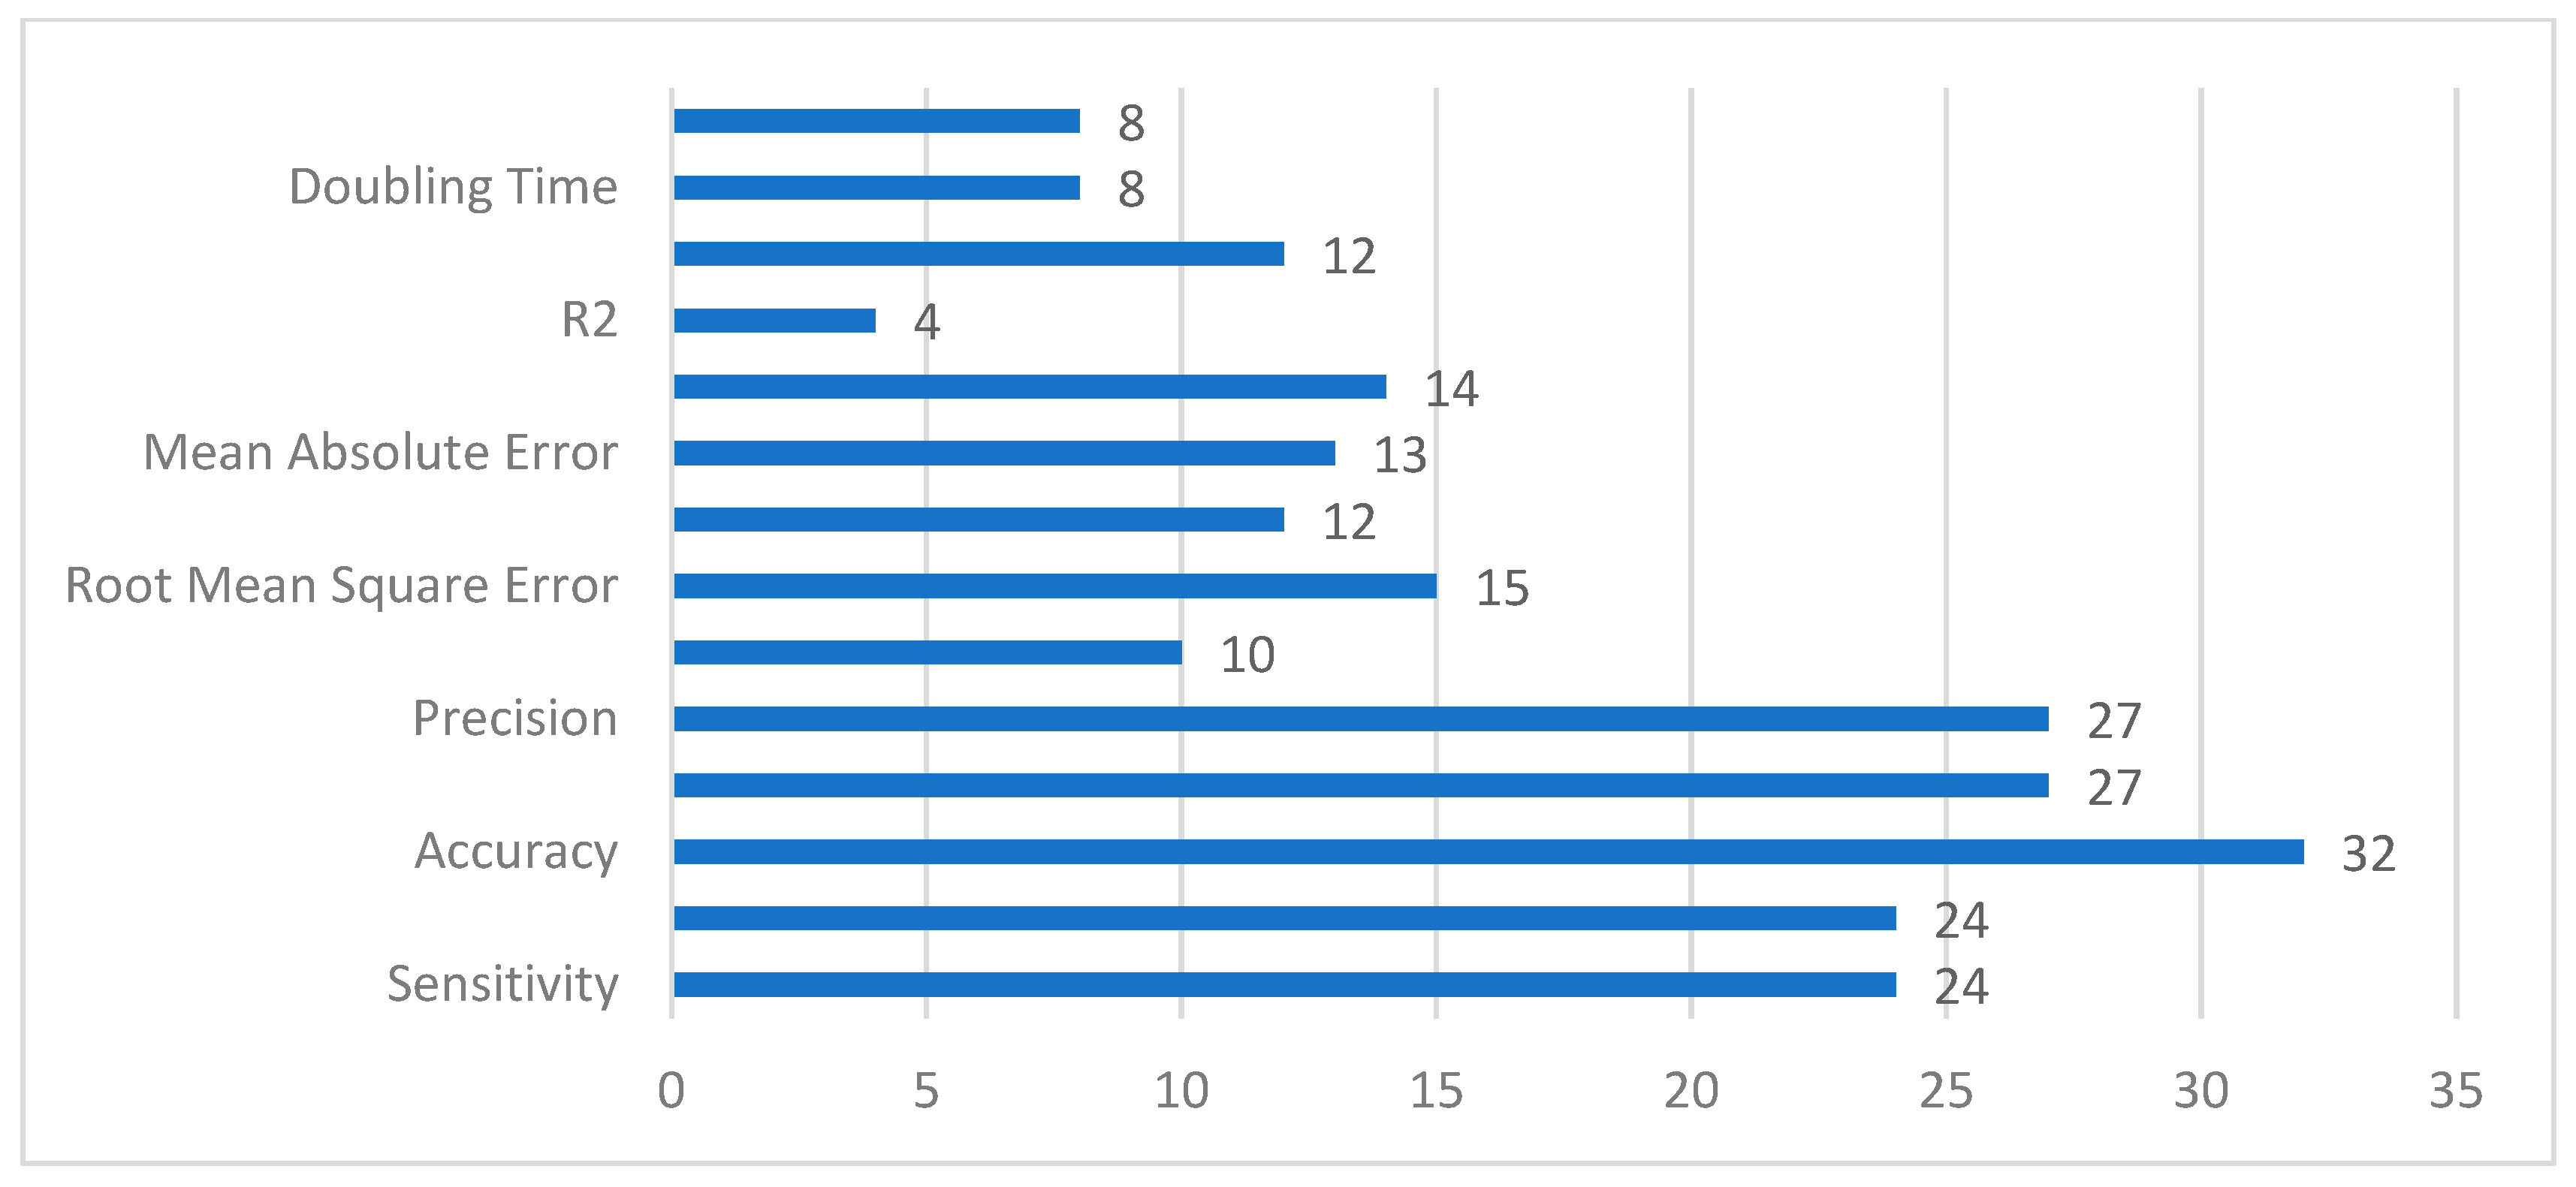
3.3.5. Quality Evaluation Metrics Used in Selected Studies

The evaluation metrics allowed researchers to quantify the work presented in any study. It also allowed the author to present the results in an efficient manner. However, the selection of the evaluation metrics is an important aspect, which is based on the type of model employed in that study. The list of quality metrics used for model evaluation in selected studies is depicted in Figure 10. The important thing to mention here, these numbers are not representing the best or worst evaluation metric, they are just presented to highlight the number of potential metrics that could be used, based on the type of forecasting model. Commonly, after reviewing all papers, we can say that growth rate, doubling time, R0, R2, MAPE, MAE, MSE, and RMSE are evaluation metrics that are useful (but not limited to) for time series, regression, compartmental models, or for other mathematical models. The remaining are possible evaluation metrics when we employed other ML or DL methods.

3.4. Epidemiologic Characteristics and Transmission Factors

This section describes epidemiological and transmission factors reviewed from the selected case studies. We present the major findings in two sub-sections: (i) Epidemic Doubling Time; and (ii) Basic Reproduction number as presented in subsequent sections.

3.4.1. Estimated Period and Doubling Time

The epidemic’s exponential growth within a short period is reported from all over the world. Different studies proposed solutions to reduce, control, and mitigate the impact of COVID-19. The main purpose of those studies was to provide some useful numbers to the higher authorities for preparing controlling strategies as illustrated in Table 3. Therefore, research conducted in India using the data collected from February 2020 to March 2021, estimated that the epidemic doubled in size every 1.7 to 46.2 days. The minimum and maximum numbers were calculated based on the infected cases in different districts [70]. Using linear regression and SVM approaches, an analysis was conducted on multi-region data, where the mathematical model estimated the size on the basis that if the number of positive cases is 5000, it will double in size every 5 days, whereas 163,840,000 cases would be doubled in 140 days. The equation presented multiple scenarios using different datasets, to make the government aware about the severity level of the epidemic [66].
Using a similar strategy (the exponential growth model) estimated the doubling size in China was every 3.6 days [75], whereas another Chinese study concluded that the doubling size was every 4.2 days [74]. The number of studies presented and reviewed in this study conducted in different regions highlighted multiple factors for the governmental agencies. According to the selected cases, the interval for doubling time occurs between 1.7 to 140 days, based on the number of infected people and estimation size. The recommendations list collected from different articles are compiled and presented in the following table.

3.4.2. Basic Reproduction Number (R0)

Basic reproduction number estimation plays a significant role and directly impacts different factors such as procedures, guidelines, travel restrictions, quarantine process, and other related factors. Table 4 represents the R0, identified in selected case studies. Generally, a larger reproduction rate would have a large number of infected people in the future. Mainly, the exponential growth model, SIR, ARIMA, and other mathematical models are used for measuring the rate of reproduction number. In addition, the interval of ranges based on the given studies occurs between 0 to 7.1. In which, 0 is the ideal case discussed in the paper related to some districts in India, which recorded less than 40 isolated cases and no local transmission of infection reported [70].
The highest R0 estimate of 7.1 was measured for the New Jersey, USA, in a study published recently [72], which indicates the virus transmission varies in different states. Another recent study used SIR and applied it to the dataset collected from Spain with ranges for R0 from 0.48 to 5.89. As mentioned in the study, the minimum value is clearly identifying the impact of lockdown as the R0 dropped from 5.89 (before lockdown) to 0.48 (after lockdown) [73].

4. Conclusions

As we are aware, the pandemic has had an impact on the entire world. This research discussed the role of ML and DL techniques that can assist medical and governmental agencies. This SLR reviewed a number of papers to identify ML, DL, and mathematical models that can predict the potential impact, transmission growth rate, and virus identification. The research identifies that understanding epidemiology and forecasting models are important to mitigate the impact of this epidemic situation. As for now, the virus transmission is continuing to spread around the world, and the integration of multiple strategies can help to control the situation. In the future, we need to select the most recent papers, while presenting the work using different SLR tools. We discussed a number of key findings that can be helpful for policymakers and future researchers. This type of study should be conducted in the future to understand, analyze, and collect the recent advancement in this area of research.

Author Contributions

Conceptualization, F.S. and A.S.A.-M.A.-G.; model, F.S.; literature review, M.O.A., S.A.A.; dataset review, M.O.A., S.A.A. and A.S.A.-M.A.-G.; Search strategy, F.S. and A.S.A.-M.A.-G.; ML and DL analysis, F.S. and A.S.A.-M.A.-G.; writing—original draft preparation, F.S., A.S.A.-M.A.-G. and M.O.A.; writing—review and editing, F.S., A.S.A.-M.A.-G. and M.O.A.; visualization, F.S.; supervision, A.S.A.-M.A.-G.; project administration, M.O.A. All authors have read and agreed to the published version of the manuscript.

Funding

This Project was funded by the Deanship of Scientific Research (DSR) at King Abdulaziz University, Jeddah, under grant no. GCV19-7-1441. The authors, therefore, acknowledge with thanks DSR for technical and financial support.

Institutional Review Board Statement

Not applicable.

Informed Consent Statement

Not applicable.

Data Availability Statement

Not applicable.

Conflicts of Interest

The authors declare no conflict of interest. In addition, the funders had no role in the design of the study; in the collection, analyses, or interpretation of data; in the writing of the manuscript, or in the decision to publish the results.

References

  1. WHO. WHO Director-General’s Opening Remarks at the Media Briefing on COVID-19. 11 March 2020. Available online: https://www.who.int/dg/speeches/detail/who-director-general-s-opening-remarks-at-the-media-briefing-on-COVID-19---11-march-2020 (accessed on 15 August 2020).
  2. The Novel Coronavirus Pneumonia Emergency Response Epidemiology Team. The epidemiological characteristics of an outbreak of 2019 novel coronavirus diseases (COVID-19) in China. Zhonghua Liu Xing Bing Xue Za Zhi 2020, 41, 145. [Google Scholar]
  3. Wang, D.; Yin, Y.; Hu, C.; Liu, X.; Zhang, X.; Zhou, S.; Jian, M.; Xu, H.; Prowle, J.; Hu, B. Clinical course and outcome of 107 patients infected with the novel coronavirus, SARS-CoV-2, discharged from two hospitals in Wuhan, China. Crit. Care 2020, 24, 188. [Google Scholar] [CrossRef] [PubMed]
  4. Yang, X.; Yu, Y.; Xu, J.; Shu, H.; Liu, H.; Wu, Y.; Zhang, L.; Yu, Z.; Fang, M.; Yu, T. Clinical course and outcomes of critically ill patients with SARS-CoV-2 pneumonia in Wuhan, China: A single-centered, retrospective, observational study. Lancet Respir. Med. 2020, 8, 475–481. [Google Scholar] [CrossRef] [Green Version]
  5. Xu, J.; Yang, X.; Yang, L.; Zou, X.; Wang, Y.; Wu, Y.; Zhou, T.; Yuan, Y.; Qi, H.; Fu, S. Clinical course and predictors of 60-day mortality in 239 critically ill patients with COVID-19: A multicenter retrospective study from Wuhan, China. Crit. Care 2020, 24, 394. [Google Scholar] [CrossRef]
  6. Alshaikh, K.; Maasher, S.; Bayazed, A.; Saleem, F.; Badri, S.; Fakieh, B. Impact of COVID-19 on the Educational Process in Saudi Arabia: A Technology–Organization–Environment Framework. Sustainability 2021, 13, 7103. [Google Scholar] [CrossRef]
  7. Li, L.; Qin, L.; Xu, Z.; Yin, Y.; Wang, X.; Kong, B.; Bai, J.; Lu, Y.; Fang, Z.; Song, Q. Artificial intelligence distinguishes COVID-19 from community acquired pneumonia on chest CT. Radiology 2020, 296, E65–E71. [Google Scholar] [CrossRef]
  8. Debnath, S.; Barnaby, D.P.; Coppa, K.; Makhnevich, A.; Kim, E.J.; Chatterjee, S.; Tóth, V.; Levy, T.J.; Paradis, M.D.; Cohen, S.L. Machine learning to assist clinical decision-making during the COVID-19 pandemic. Bioelectron. Med. 2020, 6, 14. [Google Scholar] [CrossRef]
  9. Zeroual, A.; Harrou, F.; Dairi, A.; Sun, Y. Deep learning methods for forecasting COVID-19 time-Series data: A Comparative study. Chaos Solitons Fractals 2020, 140, 110121. [Google Scholar] [CrossRef]
  10. Wang, C.J.; Ng, C.Y.; Brook, R.H. Response to COVID-19 in Taiwan: Big data analytics, new technology, and proactive testing. JAMA 2020, 323, 1341–1342. [Google Scholar] [CrossRef]
  11. Alyasseri, Z.A.A.; Al-Betar, M.A.; Doush, I.A.; Awadallah, M.A.; Abasi, A.K.; Makhadmeh, S.N.; Alomari, O.A.; Abdulkareem, K.H.; Adam, A.; Damasevicius, R. Review on COVID-19 diagnosis models based on machine learning and deep learning approaches. Expert Syst. 2022, 39, e12759. [Google Scholar] [CrossRef]
  12. Ardabili, S.F.; Mosavi, A.; Ghamisi, P.; Ferdinand, F.; Varkonyi-Koczy, A.R.; Reuter, U.; Rabczuk, T.; Atkinson, P.M. COVID-19 outbreak prediction with machine learning. Algorithms 2020, 13, 249. [Google Scholar] [CrossRef]
  13. Li, Q.; Feng, W.; Quan, Y.-H. Trend and forecasting of the COVID-19 outbreak in China. J. Infect. 2020, 80, 469–496. [Google Scholar] [PubMed] [Green Version]
  14. Huang, L.; Han, R.; Ai, T.; Yu, P.; Kang, H.; Tao, Q.; Xia, L. Serial quantitative chest ct assessment of COVID-19: Deep-learning approach. Radiol. Cardiothorac. Imaging 2020, 2, e200075. [Google Scholar] [CrossRef] [PubMed] [Green Version]
  15. Ismael, A.M.; Şengür, A. Deep learning approaches for COVID-19 detection based on chest X-ray images. Expert Syst. Appl. 2020, 164, 114054. [Google Scholar] [CrossRef] [PubMed]
  16. Muhammad, L.J.; Algehyne, E.A.; Usman, S.S.; Mohammed, I.A.; Abdulkadir, A.; Jibrin, M.B.; Malgwi, Y.M. Deep Learning Models for Predicting COVID-19 Using Chest X-Ray Images. In Trends and Advancements of Image Processing and Its Applications; Springer: Berlin/Heidelberg, Germany, 2022; pp. 127–144. [Google Scholar]
  17. Yu, K.-H.; Beam, A.L.; Kohane, I.S. Artificial intelligence in healthcare. Nat. Biomed. Eng. 2018, 2, 719–731. [Google Scholar] [CrossRef]
  18. Seto, E.; Leonard, K.J.; Cafazzo, J.A.; Barnsley, J.; Masino, C.; Ross, H.J. Developing healthcare rule-based expert systems: Case study of a heart failure telemonitoring system. Int. J. Med. Inform. 2012, 81, 556–565. [Google Scholar]
  19. Cresswell, K.; Cunningham-Burley, S.; Sheikh, A. Health care robotics: Qualitative exploration of key challenges and future directions. J. Med. Internet Res. 2018, 20, e10410. [Google Scholar] [CrossRef]
  20. Bengtsson, E. Computerized cell image processing in healthcare. In Proceedings of the 7th International Workshop on Enterprise networking and Computing in Healthcare Industry, 2005. HEALTHCOM 2005, Busan, Korea, 23–25 June 2005; pp. 11–17. [Google Scholar]
  21. Esteva, A.; Robicquet, A.; Ramsundar, B.; Kuleshov, V.; DePristo, M.; Chou, K.; Cui, C.; Corrado, G.; Thrun, S.; Dean, J. A guide to deep learning in healthcare. Nat. Med. 2019, 25, 24–29. [Google Scholar] [CrossRef]
  22. Gerup, J.; Soerensen, C.B.; Dieckmann, P. Augmented reality and mixed reality for healthcare education beyond surgery: An integrative review. Int. J. Med. Educ. 2020, 11, 1–18. [Google Scholar] [CrossRef] [Green Version]
  23. Sarkis-Onofre, R.; Catalá-López, F.; Aromataris, E.; Lockwood, C. How to properly use the PRISMA Statement. Syst. Rev. 2021, 10, 117. [Google Scholar] [CrossRef]
  24. Hassan, A.; Prasad, D.; Rani, S.; Alhassan, M. Gauging the Impact of Artificial Intelligence and Mathematical Modeling in Response to the COVID-19 Pandemic: A Systematic Review. BioMed Res. Int. 2022, 2022, 7731618. [Google Scholar] [CrossRef] [PubMed]
  25. Gupta, A.; Gharehgozli, A. Developing a Machine Learning Framework to Determine the Spread of COVID-19. SSRN. 2020. Available online: https://ssrn.com/abstract=3635211 (accessed on 20 March 2022).
  26. Wu, C.; Zhou, M.; Liu, P.; Yang, M. Analyzing COVID-19 using multisource data: An integrated approach of visualization, spatial regression, and machine learning. GeoHealth 2021, 5, e2021GH000439. [Google Scholar] [CrossRef] [PubMed]
  27. Naemi, M.; Naemi, A.; Ekbatani, R.Z.; Ebrahimi, A.; Schmidt, T.; Wiil, U.K. Modeling and Evaluating the Impact of Social Restrictions on the Spread of COVID-19 Using Machine Learning. In Smart and Sustainable Technology for Resilient Cities and Communities; Springer: Berlin/Heidelberg, Germany, 2022; pp. 107–118. [Google Scholar]
  28. Apostolopoulos, I.D.; Mpesiana, T.A. Covid-19: Automatic detection from x-ray images utilizing transfer learning with convolutional neural networks. Phys. Eng. Sci. Med. 2020, 43, 635–640. [Google Scholar] [CrossRef] [PubMed] [Green Version]
  29. Ozturk, T.; Talo, M.; Yildirim, E.A.; Baloglu, U.B.; Yildirim, O.; Acharya, U.R. Automated detection of COVID-19 cases using deep neural networks with X-ray images. Comput. Biol. Med. 2020, 121, 103792. [Google Scholar] [CrossRef]
  30. Nie, X.-D.; Wang, Q.; Wang, M.-N.; Zhao, S.; Liu, L.; Zhu, Y.-L.; Chen, H. Anxiety and depression and its correlates in patients with coronavirus disease 2019 in Wuhan. Int. J. Psychiatry Clin. Pract. 2021, 25, 109–114. [Google Scholar] [CrossRef]
  31. Wang, J.; Tang, K.; Feng, K.; Lv, W. High temperature and high humidity reduce the transmission of COVID-19. BMJ Open 2020. Available online: https://www.scienceopen.com/document_file/ff8b579c-26ff-4c3c-9aa5-a141bc8e35f6/PubMedCentral/ff8b579c-26ff-4c3c-9aa5-a141bc8e35f6.pdf (accessed on 15 January 2022). [CrossRef] [Green Version]
  32. Ardakani, A.A.; Kanafi, A.R.; Acharya, U.R.; Khadem, N.; Mohammadi, A. Application of deep learning technique to manage COVID-19 in routine clinical practice using CT images: Results of 10 convolutional neural networks. Comput. Biol. Med. 2020, 121, 103795. [Google Scholar] [CrossRef]
  33. Sun, L.; Liu, G.; Song, F.; Shi, N.; Liu, F.; Li, S.; Li, P.; Zhang, W.; Jiang, X.; Zhang, Y. Combination of four clinical indicators predicts the severe/critical symptom of patients infected COVID-19. J. Clin. Virol. 2020, 128, 104431. [Google Scholar] [CrossRef]
  34. Song, Y.; Zheng, S.; Li, L.; Zhang, X.; Zhang, X.; Huang, Z.; Chen, J.; Wang, R.; Zhao, H.; Chong, Y.; et al. Deep Learning Enables Accurate Diagnosis of Novel Coronavirus (COVID-19) with CT Images. IEEE/ACM Trans. Comput. Biol. Bioinform. 2021, 18, 2775–2780. [Google Scholar] [CrossRef]
  35. Wang, L.; Lin, Z.Q.; Wong, A. COVID-Net: A tailored deep convolutional neural network design for detection of COVID-19 cases from chest X-ray images. Sci. Rep. 2020, 10, 19549. [Google Scholar] [CrossRef]
  36. Xu, X.; Jiang, X.; Ma, C.; Du, P.; Li, X.; Lv, S.; Yu, L.; Ni, Q.; Chen, Y.; Su, J. A deep learning system to screen novel coronavirus disease 2019 pneumonia. Engineering 2020, 6, 1122–1129. [Google Scholar] [CrossRef] [PubMed]
  37. Barstugan, M.; Ozkaya, U.; Ozturk, S. Coronavirus (COVID-19) classification using ct images by machine learning methods. arXiv 2020, arXiv:2003.09424. [Google Scholar]
  38. Al Rahhal, M.M.; Bazi, Y.; Jomaa, R.M.; AlShibli, A.; Alajlan, N.; Mekhalfi, M.L.; Melgani, F. COVID-19 Detection in CT/X-ray Imagery Using Vision Transformers. J. Pers. Med. 2022, 12, 310. [Google Scholar] [CrossRef] [PubMed]
  39. Khan, S.H.; Sohail, A.; Khan, A.; Lee, Y.-S. COVID-19 detection in chest X-ray images using a new channel boosted CNN. Diagnostics 2022, 12, 267. [Google Scholar] [CrossRef]
  40. Sarki, R.; Ahmed, K.; Wang, H.; Zhang, Y.; Wang, K. Automated Detection of COVID-19 through Convolutional Neural Network using Chest x-ray images. PLoS ONE 2022, 17, e0262052. [Google Scholar] [CrossRef]
  41. Mousavi, Z.; Shahini, N.; Sheykhivand, S.; Mojtahedi, S.; Arshadi, A. COVID-19 detection using chest X-ray images based on a developed deep neural network. SLAS Technol. 2022, 27, 63–75. [Google Scholar] [CrossRef]
  42. Sethy, P.K.; Behera, S.K.; Ratha, P.K.; Biswas, P. Detection of Coronavirus Disease (COVID-19) Based on Deep Features and Support Vector Machine. 2020. Available online: https://pdfs.semanticscholar.org/9da0/35f1d7372cfe52167ff301bc12d5f415caf1.pdf (accessed on 10 January 2022).
  43. Nour, M.; Cömert, Z.; Polat, K. A novel medical diagnosis model for COVID-19 infection detection based on deep features and Bayesian optimization. Appl. Soft Comput. 2020, 97, 106580. [Google Scholar] [CrossRef]
  44. Aggarwal, S.; Gupta, S.; Alhudhaif, A.; Koundal, D.; Gupta, R.; Polat, K. Automated COVID-19 detection in chest X-ray images using fine-tuned deep learning architectures. Expert Syst. 2022, 39, e12749. [Google Scholar] [CrossRef]
  45. Prata, D.N.; Rodrigues, W.; Bermejo, P.H. Temperature significantly changes COVID-19 transmission in (sub) tropical cities of Brazil. Sci. Total Environ. 2020, 729, 138862. [Google Scholar] [CrossRef]
  46. Li, Y.; Zhang, R.; Zhao, J.; Molina, M.J. Understanding transmission and intervention for the COVID-19 pandemic in the United States. Sci. Total Environ. 2020, 748, 141560. [Google Scholar] [CrossRef]
  47. Yao, H.; Zhang, N.; Zhang, R.; Duan, M.; Xie, T.; Pan, J.; Peng, E.; Huang, J.; Zhang, Y.; Xu, X. Severity detection for the coronavirus disease 2019 (COVID-19) patients using a machine learning model based on the blood and urine tests. Front. Cell Dev. Biol. 2020, 8, 683. [Google Scholar] [CrossRef] [PubMed]
  48. Loey, M.; Manogaran, G.; Taha, M.H.N.; Khalifa, N.E.M. A hybrid deep transfer learning model with machine learning methods for face mask detection in the era of the COVID-19 pandemic. Measurement 2021, 167, 108288. [Google Scholar] [CrossRef] [PubMed]
  49. Kocadagli, O.; Baygul, A.; Gokmen, N.; Incir, S.; Aktan, C. Clinical prognosis evaluation of COVID-19 patients: An interpretable hybrid machine learning approach. Curr. Res. Transl. Med. 2022, 70, 103319. [Google Scholar] [CrossRef] [PubMed]
  50. Wang, L.; Xu, T.; Stoecker, T.; Stoecker, H.; Jiang, Y.; Zhou, K. Machine learning spatio-temporal epidemiological model to evaluate Germany-county-level COVID-19 risk. Mach. Learn. Sci. Technol. 2021, 2, 35031. [Google Scholar] [CrossRef]
  51. Dandekar, R.; Barbastathis, G. Quantifying the effect of quarantine control in COVID-19 infectious spread using machine learning. medRxiv 2020, 1–13. [Google Scholar] [CrossRef] [Green Version]
  52. Ogundokun, R.O.; Lukman, A.F.; Kibria, G.B.M.; Awotunde, J.B.; Aladeitan, B.B. Predictive modelling of COVID-19 confirmed cases in Nigeria. Infect. Dis. Model. 2020, 5, 543–548. [Google Scholar] [CrossRef]
  53. Zou, Y.; Yang, W.; Lai, J.; Hou, J.; Lin, W. Vaccination and Quarantine Effect on COVID-19 Transmission Dynamics Incorporating Chinese-Spring-Festival Travel Rush: Modeling and Simulations. Bull. Math. Biol. 2022, 84, 30. [Google Scholar] [CrossRef]
  54. Andariesta, D.T.; Wasesa, M. Machine learning models for predicting international tourist arrivals in Indonesia during the COVID-19 pandemic: A multisource Internet data approach. J. Tour. Futures 2022, 1–17. [Google Scholar] [CrossRef]
  55. Yadav, M.; Perumal, M.; Srinivas, M. Analysis on novel coronavirus (COVID-19) using machine learning methods. Chaos Solitons Fractals 2020, 139, 110050. [Google Scholar] [CrossRef]
  56. Singh, V.; Poonia, R.C.; Kumar, S.; Dass, P.; Agarwal, P.; Bhatnagar, V.; Raja, L. Prediction of COVID-19 corona virus pandemic based on time series data using Support Vector Machine. J. Discrete Math. Sci. Cryptogr. 2020, 23, 1583–1597. [Google Scholar] [CrossRef]
  57. Lounis, M.; Khan, F.M. Predicting COVID-19 cases, deaths and recoveries using machine learning methods. Eng. Appl. Sci. Lett. 2021, 4, 43–49. [Google Scholar] [CrossRef]
  58. Vega, R.; Flores, L.; Greiner, R. SIMLR: Machine Learning inside the SIR model for COVID-19 Forecasting. Forecasting 2022, 4, 72–94. [Google Scholar] [CrossRef]
  59. Pavlyutin, M.; Samoyavcheva, M.; Kochkarov, R.; Pleshakova, E.; Korchagin, S.; Gataullin, T.; Nikitin, P.; Hidirova, M. COVID-19 Spread Forecasting, Mathematical Methods vs. Machine Learning, Moscow Case. Mathematics 2022, 10, 195. [Google Scholar] [CrossRef]
  60. Shwetha, S.; Sunagar, P.; Rajarajeswari, S.; Kanavalli, A. Ensemble Model to Forecast the End of the COVID-19 Pandemic. In Proceedings of the Third International Conference on Communication, Computing and Electronics Systems, Coimbatore, India, 28–29 October 2021; Springer: Singapore, 2022; pp. 815–829. [Google Scholar]
  61. Babu, M.A.; Ahmmed, M.M.; Ferdousi, A.; Mostafizur Rahman, M.; Saiduzzaman, M.; Bhatnagar, V.; Raja, L.; Poonia, R.C. The mathematical and machine learning models to forecast the COVID-19 outbreaks in Bangladesh. J. Interdiscip. Math. 2022, 1–20. [Google Scholar] [CrossRef]
  62. Krivorotko, O.; Sosnovskaia, M.; Vashchenko, I.; Kerr, C.; Lesnic, D. Agent-based modeling of COVID-19 outbreaks for New York state and UK: Parameter identification algorithm. Infect. Dis. Model. 2022, 7, 30–44. [Google Scholar] [CrossRef]
  63. Shiri, I.; Salimi, Y.; Pakbin, M.; Hajianfar, G.; Avval, A.H.; Sanaat, A.; Mostafaei, S.; Akhavanallaf, A.; Saberi, A.; Mansouri, Z. COVID-19 prognostic modeling using CT radiomic features and machine learning algorithms: Analysis of a multi-institutional dataset of 14,339 patients. Comput. Biol. Med. 2022, 145, 105467. [Google Scholar] [CrossRef]
  64. Masum, M.; Masud, M.A.; Adnan, M.I.; Shahriar, H.; Kim, S. Comparative study of a mathematical epidemic model, statistical modeling, and deep learning for COVID-19 forecasting and management. Socio-Econ. Plan. Sci. 2022, 80, 101249. [Google Scholar] [CrossRef]
  65. Rguibi, M.A.; Moussa, N.; Madani, A.; Aaroud, A.; Zine-Dine, K. Forecasting COVID-19 Transmission with ARIMA and LSTM Techniques in Morocco. SN Comput. Sci. 2022, 3, 133. [Google Scholar] [CrossRef]
  66. Khan, M.A.; Khan, R.; Algarni, F.; Kumar, I.; Choudhary, A.; Srivastava, A. Zhao 2020. Ain Shams Eng. J. 2022, 13, 101574. [Google Scholar] [CrossRef]
  67. Guleria, P.; Ahmed, S.; Alhumam, A.; Srinivasu, P.N. Empirical Study on Classifiers for Earlier Prediction of COVID-19 Infection Cure and Death Rate in the Indian States. Healthcare 2022, 10, 85. [Google Scholar] [CrossRef]
  68. Ayris, D.; Imtiaz, M.; Horbury, K.; Williams, B.; Blackney, M.; See, C.S.H.; Shah, S.A.A. Novel Deep Learning Approach to Model and Predict the spread of COVID-19. Intell. Syst. Appl. 2022, 14, 200068. [Google Scholar] [CrossRef]
  69. Chyon, F.A.; Suman, M.N.H.; Fahim, M.R.I.; Ahmmed, M.S. Time series analysis and predicting COVID-19 affected patients by ARIMA model using machine learning. J. Virol. Methods 2022, 301, 114433. [Google Scholar] [CrossRef] [PubMed]
  70. Shil, P.; Atre, N.M.; Patil, A.A.; Tandale, B.V.; Abraham, P. District-wise estimation of Basic reproduction number (R0) for COVID-19 in India in the initial phase. Spat. Inf. Res. 2022, 30, 37–45. [Google Scholar] [CrossRef]
  71. Zhao, S.; Musa, S.S.; Lin, Q.; Ran, J.; Yang, G.; Wang, W.; Lou, Y.; Yang, L.; Gao, D.; He, D. Estimating the unreported number of novel coronavirus (2019-nCoV) cases in China in the first half of January 2020: A data-driven modelling analysis of the early outbreak. J. Clin. Med. 2020, 9, 388. [Google Scholar] [CrossRef] [PubMed] [Green Version]
  72. Mallela, A.; Neumann, J.; Miller, E.F.; Chen, Y.; Posner, R.G.; Lin, Y.T.; Hlavacek, W.S. Bayesian Inference of State-Level COVID-19 Basic Reproduction Numbers across the United States. Viruses 2022, 14, 157. [Google Scholar] [CrossRef]
  73. Hyafil, A.; Moriña, D. Analysis of the impact of lockdown on the reproduction number of the SARS-Cov-2 in Spain. Gac. Sanit. 2022, 35, 453–458. [Google Scholar] [CrossRef] [PubMed]
  74. Chinazzi, M.; Davis, J.T.; Ajelli, M.; Gioannini, C.; Litvinova, M.; Merler, S.; Pastore y Piontti, A.; Mu, K.; Rossi, L.; Sun, K. The effect of travel restrictions on the spread of the 2019 novel coronavirus (COVID-19) outbreak. Science 2020, 368, 395–400. [Google Scholar] [CrossRef] [Green Version]
  75. Zhao, Q.; Chen, Y.; Small, D.S. Analysis of the epidemic growth of the early 2019-nCoV outbreak using internationally confirmed cases. MedRxiv 2020, 1–10. [Google Scholar] [CrossRef]
  76. Grabowski, F.; Kochańczyk, M.; Lipniacki, T. The spread of SARS-CoV-2 variant Omicron with a doubling time of 2.0–3.3 days can be explained by immune evasion. Viruses 2022, 14, 294. [Google Scholar] [CrossRef]
  77. Herng, L.C.; Singh, S.; Sundram, B.M.; Zamri, A.S.S.M.; Vei, T.C.; Aris, T.; Ibrahim, H.; Abdullah, N.H.; Dass, S.C.; Gill, B.S. The effects of super spreading events and movement control measures on the COVID-19 pandemic in Malaysia. Sci. Rep. 2022, 12, 2197. [Google Scholar] [CrossRef]
  78. Simoy, M.I.; Aparicio, J.P. Socially structured model for COVID-19 pandemic: Design and evaluation of control measures. Comput. Appl. Math. 2021, 41, 1–23. [Google Scholar] [CrossRef]
  79. Agbelusi, O.; Olayemi, O.C. Prediction of mortality rate of COVID-19 patients using machine learning techniques in nigeria. Int. J. Comput. Sci. Softw. Eng. 2020, 9, 30–34. [Google Scholar]
  80. An, C.; Lim, H.; Kim, D.-W.; Chang, J.H.; Choi, Y.J.; Kim, S.W. Machine learning prediction for mortality of patients diagnosed with COVID-19: A nationwide Korean cohort study. Sci. Rep. 2020, 10, 18716. [Google Scholar] [CrossRef] [PubMed]
  81. Yadav, S.; Shukla, S. Analysis of k-fold cross-validation over hold-out validation on colossal datasets for quality classification. In Proceedings of the 2016 IEEE 6th International Conference on Advanced Computing (IACC), Bhimavaram, India, 27–28 February 2016; pp. 78–83. [Google Scholar]
Figure 1. Study Selection Workflow based on PRISMA.
Ijerph 19 05099 g001
Figure 2. Selected Studies Publishing Journals.
Ijerph 19 05099 g002
Figure 3. Region of Selected Studies.
Ijerph 19 05099 g003
Figure 4. Research Domain Classification.
Ijerph 19 05099 g004
Figure 5. Types of Modeling in Selected Studies.
Ijerph 19 05099 g005
Figure 6. Ratio of ML Models in Selected Studies.
Ijerph 19 05099 g006
Figure 7. Ratio of DL Models in Selected Studies.
Ijerph 19 05099 g007
Figure 8. Ratio of Mathematical and Regression Models in Selected Studies.
Ijerph 19 05099 g008
Figure 9. Ratio of Validation Strategies in Selected Studies.
Ijerph 19 05099 g009
Figure 10. List of Evaluation Metrics used in the Selected Studies.
Ijerph 19 05099 g010
Table 2. Number of Articles and Types of Modeling in Selected Studies.
Types of Modeling Authors
Deep Learning Models[15,27,28,29,32,33,34,35,36,38,39,41,42,43,44,48,50,59,64,65,68]
Machine Learning Models[25,26,27,30,37,47,49,51,52,54,55,56,57,63,67,72]
Others (Regression and Mathematical Models) [25,30,31,45,46,53,58,60,61,62,64,66,69,70,71,73,74,75,76,77,78]
Table 3. Epidemic Doubling Time in Selected Studies.
AuthorCountryMethodDatasetDoubling TimeTool UsedRecommendation by Author
[70]IndiaExponential Growth ModelFebruary 2020–March 20211.7 to 46.2 days (based on districts)Q-GIS softwareno uniformity across country
to analyze and study epidemics in future
[74]ChinaGlobal Epidemic and Mobility Model (GLEAM)By 23 January 20204.2 days-travel restrictions
[66]Multi-CountriesLinear Regression and Support Vector Machine22 January 2020, to 12 July 2021Min = if (5000 cases) double in 5 days
Max = if (163,840,000 cases) double in 140 days
-government and individuals aware about the severity
[75]ChinaExponential Growth Model1–23 January 20203.6 days-prevention measures were effective
[76]South AfricaSusceptible–Exposed–
Infectious–Recovered (SEIR) model
By 23 November 20213.3 days-immune evasion is more concerning
increased transmissibility
[78]ArgentinaAgent-based ModelMultiple Scenario2.0 to 7.14 days social distancing measures
Table 4. Epidemic Basic Reproduction Number in Selected Studies.
AuthorCountryDatasetBasic
Reproduction Number
MethodConfidence Interval (CI)Tool Used
[71]China1–15 January 20202.56Exponential Growth Model95% CI-
[70]IndiaFebruary 2020–March 20210 to > 7 (based on district)Exponential Growth Model-Q-GIS software
[72]USA21 January 2020–21 June 20202.3 to 7.1 (based on different states)Bayesian inference95% CIPyBioNetFit
[73]SpainMarch–April 20200.48 to 5.89 (different conditions)SIR (Susceptible-Infected-Recovered)95% CI-
[64]USA22 January 2020–10 August 20202.747 to 3.856 (increase as days increase)Mathematical Epidemic Model (MEM) + DL-MATLAB
[65]Morocco22 January 2020–22 November 20200.9 and 1.3 (increase as days increase)Auto-Regressive Integrated Moving Average (ARIMA) and Long short-term memory (LSTM)95% CIPython
[74]ChinaBy 23 January 20202.57Global Epidemic and Mobility Model (GLEAM)90% CI-
[75]China1–23 January 20204.2Exponential Growth Model95% CI-
[77]Malaysia1 February 2020–8 November 20203.96Susceptible-Exposed-Infectious-Removed (SEIR) Model95% CIExcel
[31]China, USABy 10 February 20200.023 (China)
0.020 (USA)
Retrospective Regression Analysis95% CIPython
[46]USA8 March–12 April3.96Linear Regression95% CI-
[25]USABy 16 April 20203.81 to 4.07 (based on method)SIR (Susceptible-Infected-Recovered)95% CI-
Publisher’s Note: MDPI stays neutral with regard to jurisdictional claims in published maps and institutional affiliations.

