
Does Use of Solid Cooking Fuels Increase Family Medical Expenses in China?


Abstract
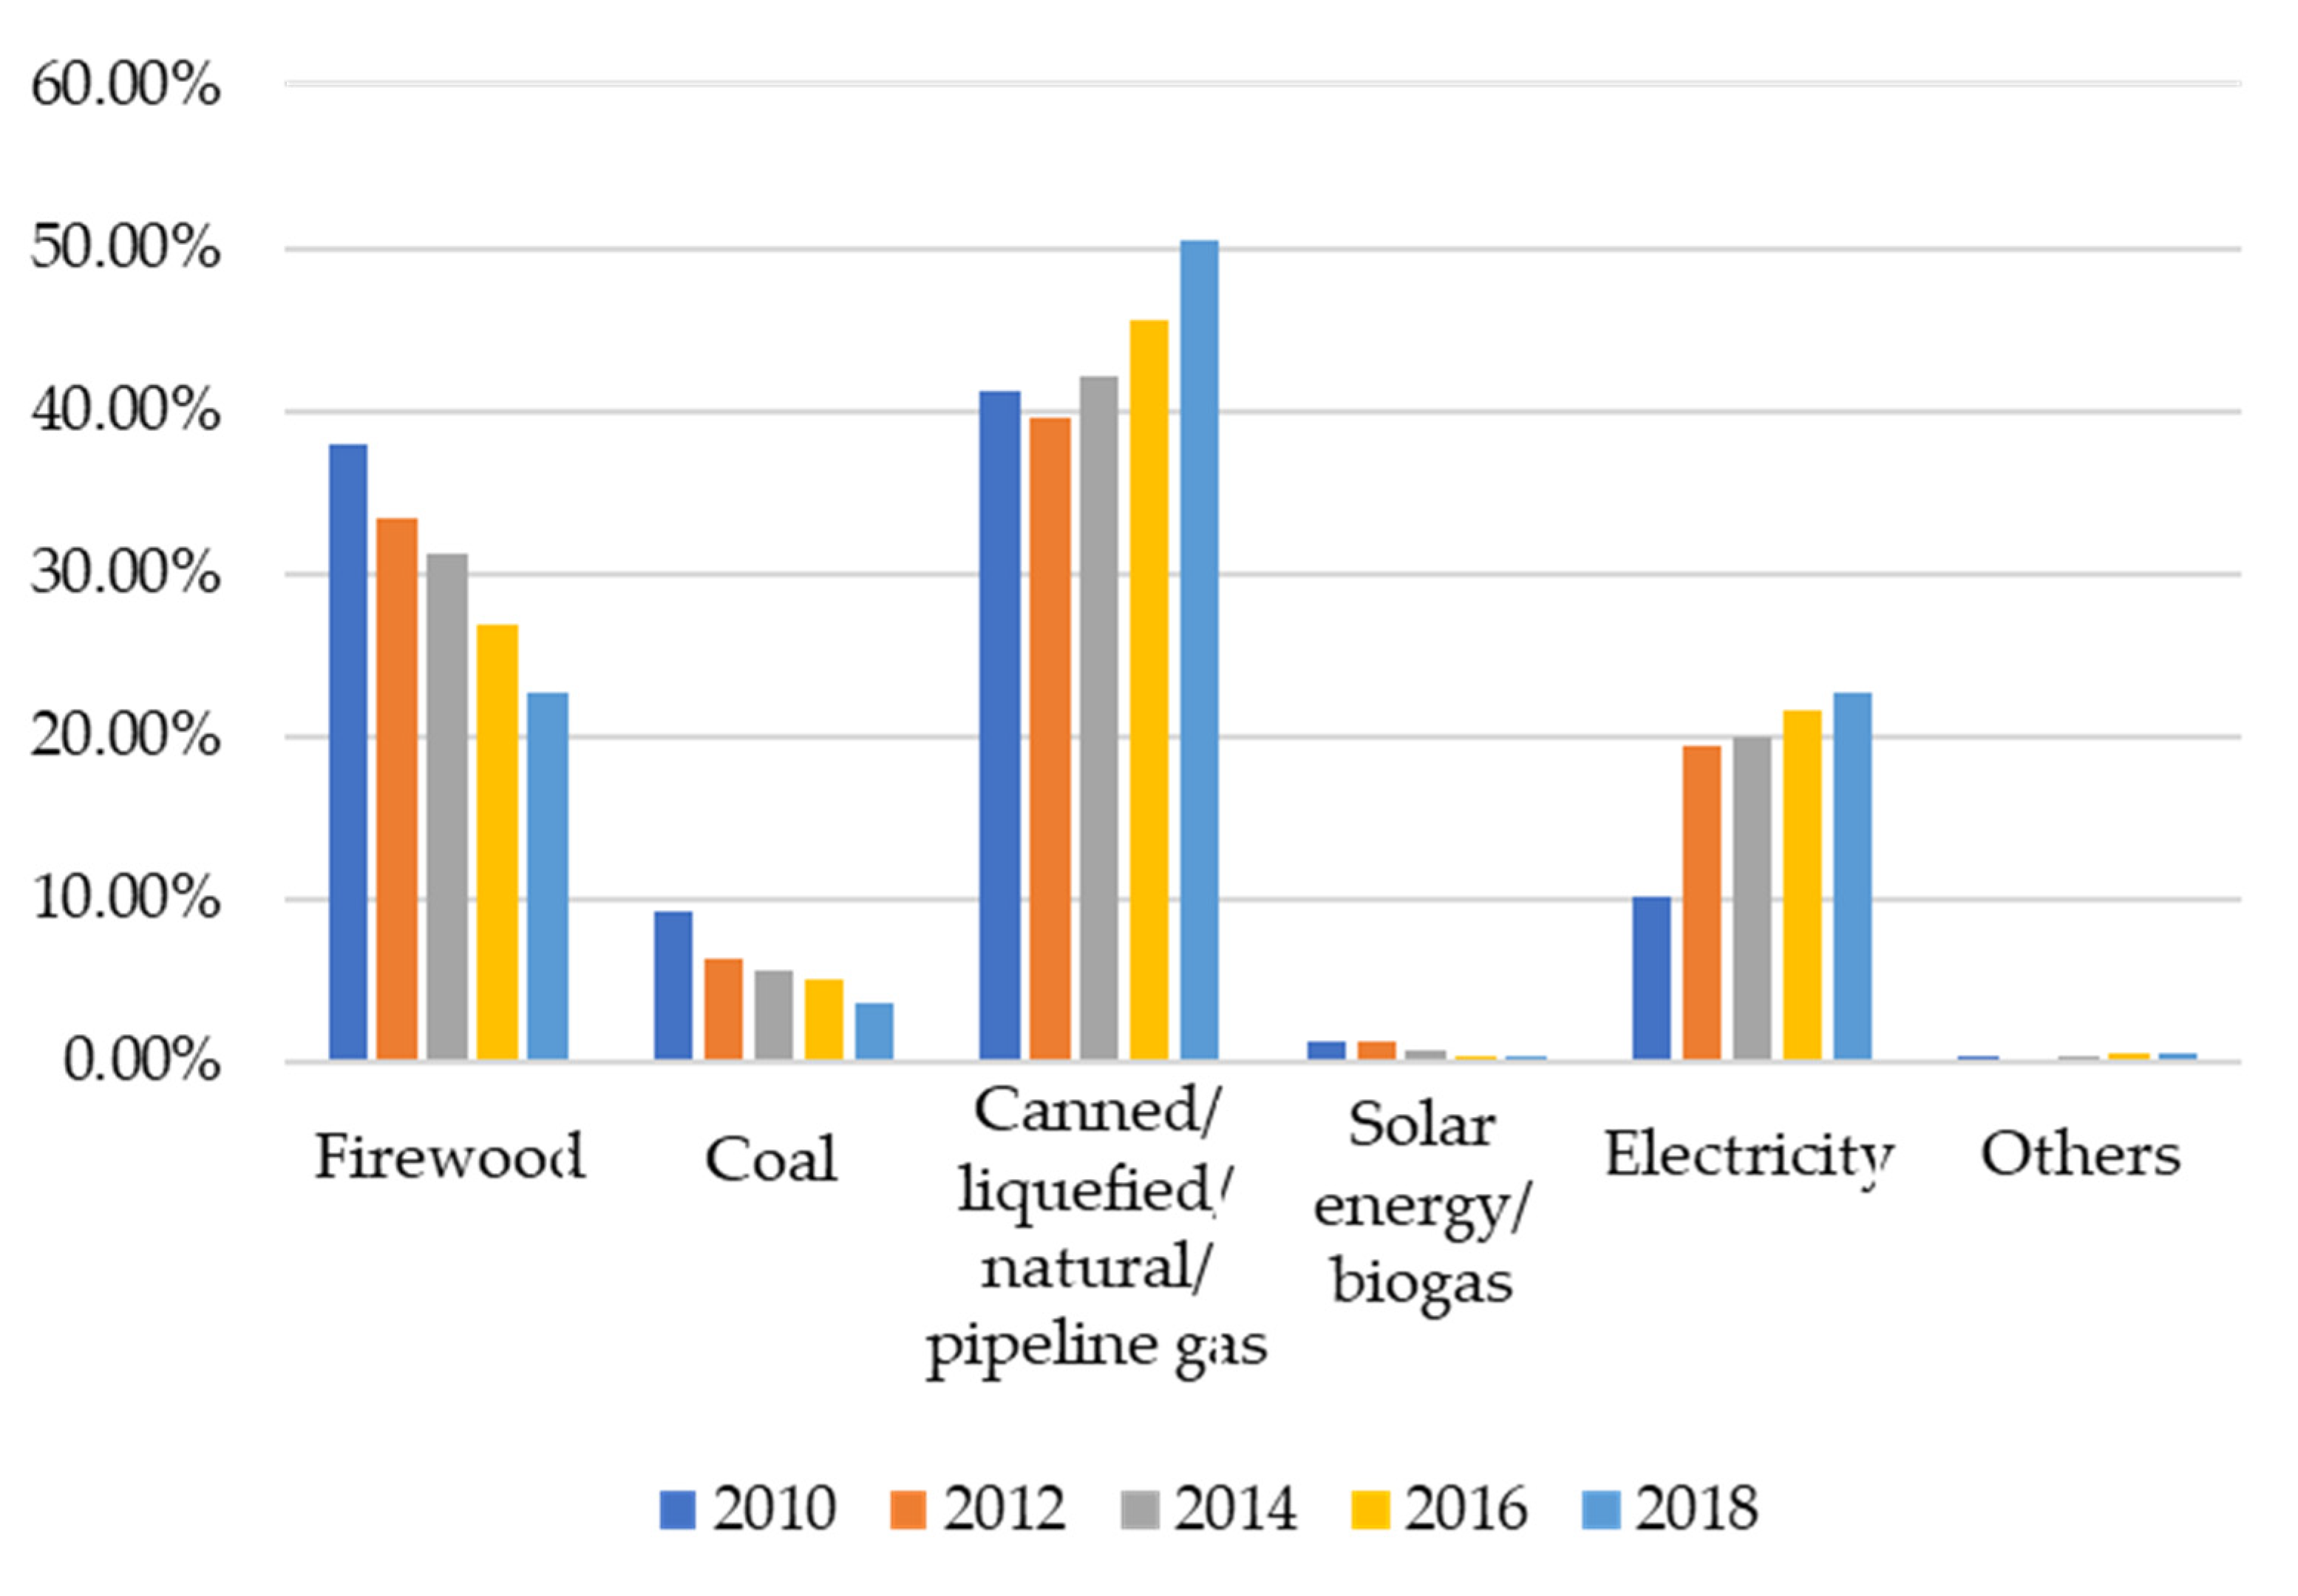
:1. Introduction
2. Literature Review
2.1. Household Fuel Use
2.2. Impact of Solid Fuels
2.3. Literature Summary
3. Materials and Methods
3.1. Data Sources
3.2. Model Design
4. Empirical Results and Discussion
4.1. Analysis of Baseline Regression
4.2. Estimation by Propensity Score Matching
4.3. Results Discussion of Tobit and 2SLS Methods
5. Mechanism and Heterogeneity Analysis
5.1. Mechanism Analysis
5.2. Heterogeneity Analysis
6. Conclusions
Author Contributions
Funding
Institutional Review Board Statement
Informed Consent Statement
Data Availability Statement
Acknowledgments
Conflicts of Interest
References
- IEA (International Energy Agency). World Energy Outlook 2020; IEA (International Energy Agency): Paris, France, 2020. [Google Scholar]
- Institute for Health Metrics and Evaluation. Global Burden of Disease data tool; Institute for Health Metrics and Evaluation: Seattle, DC, USA, 2016. [Google Scholar]
- Du, K.; Shao, S.; Yan, Z. Urban residential energy demand and rebound effect in China: A stochastic energy demand frontier approach. Energy J. 2021, 42, 175–193. [Google Scholar] [CrossRef]
- Lin, B.; Wang, Y. Analyzing the elasticity and subsidy to reform the residential electricity tariffs in China. Int. Rev. Econ. Financ. 2020, 67, 189–206. [Google Scholar] [CrossRef]
- Niu, S.; Jia, Y.; Ye, L.; Dai, R.; Li, N. Does electricity consumption improve residential living status in less developed regions? An empirical analysis using the quantile regression approach. Energy 2016, 95, 550–560. [Google Scholar] [CrossRef]
- Oum, S. Energy poverty in the Lao PDR and its impacts on education and health. Energy Policy 2019, 132, 247–253. [Google Scholar] [CrossRef]
- Dagoumas, A.; Kitsios, F. Assessing the impact of the economic crisis on energy poverty in Greece. Sustain. Cities Soc. 2014, 13, 267–278. [Google Scholar] [CrossRef]
- Quinn, A.K.; Bruce, N.; Puzzolo, E.; Dickinson, K.; Sturke, R.; Jack, D.W.; Mehta, S.; Shankar, A.; Sherr, K.; Rosenthal, J.P. An analysis of efforts to scale up clean household energy for cooking around the world. Energy Sustain. Dev. 2018, 46, 1–10. [Google Scholar] [CrossRef]
- IEA (International Energy Agency). Energy and Poverty: Special early excerpt of the World Energy Outlook 2002; IEA (International Energy Agency): Paris, France, 2002. [Google Scholar]
- Charlier, D.; Kahouli, S. From residential energy demand to fuel poverty: Income-induced Non-linearities in the Reactions of Households to Energy Price Fluctuations. Energy J. 2019, 40, 101–137. [Google Scholar] [CrossRef]
- Li, K.; Lloyd, B.; Liang, X.J.; Wei, Y.M. Energy poor or fuel poor: What are the differences? Energy Policy 2014, 68, 476–481. [Google Scholar] [CrossRef]
- Zhu, J.; Hu, S.; Wang, J.; Zheng, X. Future orientation promotes climate concern and mitigation. J. Clean. Prod. 2020, 262, 121212. [Google Scholar] [CrossRef]
- Mastropietro, P. Who should pay to support renewable electricity? Exploring regressive impacts, energy poverty and tariff equity. Energy Res. Soc. Sci. 2019, 56, 101222. [Google Scholar] [CrossRef]
- Zhu, J.; Wang, J. The effects of fuel content regulation at ports on regional pollution and shipping industry. J. Environ. Econ. Manage. 2021, 106, 102424. [Google Scholar] [CrossRef]
- Lin, B.; Wang, Y. Does energy poverty really exist in China? From the perspective of residential electricity consumption. Energy Policy 2020, 143, 111557. [Google Scholar] [CrossRef]
- Tang, X.; Liao, H. Energy poverty and solid fuels use in rural China: Analysis based on national population census. Energy Sustain. Dev. 2014, 23, 122–129. [Google Scholar] [CrossRef]
- Zhang, D.; Li, J.; Han, P. A multidimensional measure of energy poverty in China and its impacts on health: An empirical study based on the China family panel studies. Energy Policy 2019, 131, 72–81. [Google Scholar] [CrossRef]
- Liu, Z.; Li, J.; Rommel, J.; Feng, S. Health impacts of cooking fuel choice in rural China. Energy Econ. 2020, 89, 104811. [Google Scholar] [CrossRef]
- Farrukh, M.; Khreis, H. Monetizing the burden of childhood asthma due to traffic related air pollution in the contiguous united states in 2010. Int. J. Environ. Res. Public Health 2021, 18, 7864. [Google Scholar] [CrossRef]
- Pi, T.; Wu, H.; Li, X. Does air pollution affect health and medical insurance cost in the elderly: An empirical evidence from China. Sustain. 2019, 11, 1526. [Google Scholar] [CrossRef] [Green Version]
- Liu, Z.; Pagoulatos, A.; Hu, W.; Schieffer, J. Valuing the Benefit of Reducing Adverse Effects from Polluting Heating Fuels. Soc. Sci. Q. 2014, 95, 868–881. [Google Scholar] [CrossRef]
- Ozoh, O.B.; Okwor, T.J.; Adetona, O.; Akinkugbe, A.O.; Amadi, C.E.; Esezobor, C.; Adeyeye, O.O.; Ojo, O.; Nwude, V.N.; Mortimer, K. Cooking fuels in lagos, Nigeria: Factors associated with household choice of kerosene or liquefied petroleum gas (LPG). Int. J. Environ. Res. Public Health 2018, 15, 641. [Google Scholar] [CrossRef] [Green Version]
- Day, R.; Walker, G.; Simcock, N. Conceptualising energy use and energy poverty using a capabilities framework. Energy Policy 2016, 93, 255–264. [Google Scholar] [CrossRef]
- Belaïd, F. Exposure and risk to fuel poverty in France: Examining the extent of the fuel precariousness and its salient determinants. Energy Policy 2018, 114, 189–200. [Google Scholar] [CrossRef]
- Papada, L.; Kaliampakos, D. Measuring energy poverty in Greece. Energy Policy 2016, 94, 157–165. [Google Scholar] [CrossRef]
- Papada, L.; Kaliampakos, D. Being forced to skimp on energy needs: A new look at energy poverty in Greece. Energy Res. Soc. Sci. 2020, 64, 101450. [Google Scholar] [CrossRef]
- Karpinska, L.; Śmiech, S. Invisible energy poverty? Analysing housing costs in Central and Eastern Europe. Energy Res. Soc. Sci. 2020, 70, 101670. [Google Scholar] [CrossRef]
- Teschner, N.; Sinea, A.; Vornicu, A.; Abu-Hamed, T.; Negev, M. Extreme energy poverty in the urban peripheries of Romania and Israel: Policy, planning and infrastructure. Energy Res. Soc. Sci. 2020, 66, 101502. [Google Scholar] [CrossRef]
- Crentsil, A.O.; Asuman, D.; Fenny, A.P. Assessing the determinants and drivers of multidimensional energy poverty in Ghana. Energy Policy 2019, 133, 110884. [Google Scholar] [CrossRef]
- Alkire, S.; Foster, J. Counting and multidimensional poverty measurement. J. Public Econ. 2011, 95, 476–487. [Google Scholar] [CrossRef] [Green Version]
- Adusah-Poku, F.; Takeuchi, K. Energy poverty in Ghana: Any progress so far? Renew. Sustain. Energy Rev. 2019, 112, 853–864. [Google Scholar] [CrossRef]
- Scarpellini, S.; Rivera-Torres, P.; Suárez-Perales, I.; Aranda-Usón, A. Analysis of energy poverty intensity from the perspective of the regional administration: Empirical evidence from households in southern Europe. Energy Policy 2015, 86, 729–738. [Google Scholar] [CrossRef] [Green Version]
- Huang, F.; Liu, J.; Wang, Z.; Shuai, C.; Li, W. Of job, skills, and values: Exploring rural household energy use and solar photovoltaics in poverty alleviation areas in China. Energy Res. Soc. Sci. 2020, 67, 101517. [Google Scholar] [CrossRef]
- Middlemiss, L.; Gillard, R. Fuel poverty from the bottom-up: Characterising household energy vulnerability through the lived experience of the fuel poor. Energy Res. Soc. Sci. 2015, 6, 146–154. [Google Scholar] [CrossRef] [Green Version]
- Ojo, K.D.; Soneja, S.I.; Scrafford, C.G.; Khatry, S.K.; LeClerq, S.C.; Checkley, W.; Katz, J.; Breysse, P.N.; Tielsch, J.M. Indoor particulate matter concentration, water boiling time, and fuel use of selected alternative cookstoves in a home-like setting in rural Nepal. Int. J. Environ. Res. Public Health 2015, 12, 7558–7581. [Google Scholar] [CrossRef] [Green Version]
- Hou, B.D.; Tang, X.; Ma, C.; Liu, L.; Wei, Y.M.; Liao, H. Cooking fuel choice in rural China: Results from microdata. J. Clean. Prod. 2017, 142, 538–547. [Google Scholar] [CrossRef]
- Wei, T.; Zhu, Q.; Glomsrød, S. Energy spending and household characteristics of floating population: Evidence from Shanghai. Energy Sustain. Dev. 2014, 23, 141–149. [Google Scholar] [CrossRef]
- Yang, S.; Tan, Y.; Mei, H.; Wang, F.; Li, N.; Zhao, J.; Zhang, Y.; Qian, Z.; Chang, J.J.; Syberg, K.M.; et al. Ambient air pollution the risk of stillbirth: A prospective birth cohort study in Wuhan, China. Int. J. Hyg. Environ. Health 2018, 221, 502–509. [Google Scholar] [CrossRef]
- Wolf, J.; Mäusezahl, D.; Verastegui, H.; Hartinger, S.M. Adoption of clean cookstoves after improved solid fuel stove programme exposure: A cross-sectional study in three peruvian andean regions. Int. J. Environ. Res. Public Health 2017, 14, 745. [Google Scholar] [CrossRef] [Green Version]
- Mperejekumana, P.; Li, H.; Wu, R.; Lu, J.; Tursunov, O.; Elshareef, H.; Gaballah, M.S.; Nepo, N.J.; Zhou, Y.; Dong, R. Determinants of household energy choice for cooking in Northern Sudan: A multinomial logit estimation. Int. J. Environ. Res. Public Health 2021, 18, 11480. [Google Scholar] [CrossRef]
- Mortimer, K.; Ndamala, C.B.; Naunje, A.W.; Malava, J.; Katundu, C.; Weston, W.; Havens, D.; Pope, D.; Bruce, N.G.; Nyirenda, M.; et al. A cleaner burning biomass-fuelled cookstove intervention to prevent pneumonia in children under 5 years old in rural Malawi (the Cooking and Pneumonia Study): A cluster randomised controlled trial. Lancet 2017, 389, 167–175. [Google Scholar] [CrossRef] [Green Version]
- Smith, K.R.; McCracken, J.P.; Weber, M.W.; Hubbard, A.; Jenny, A.; Thompson, L.M.; Balmes, J.; Diaz, A.; Arana, B.; Bruce, N. Effect of reduction in household air pollution on childhood pneumonia in Guatemala (RESPIRE): A randomised controlled trial. Lancet 2011, 378, 1717–1726. [Google Scholar] [CrossRef]
- Alexander, D.A.; Northcross, A.; Karrison, T.; Morhasson-Bello, O.; Wilson, N.; Atalabi, O.M.; Dutta, A.; Adu, D.; Ibigbami, T.; Olamijulo, J.; et al. Pregnancy outcomes and ethanol cook stove intervention: A randomized-controlled trial in Ibadan, Nigeria. Environ. Int. 2018, 111, 152–163. [Google Scholar] [CrossRef]
- Silwal, A.R.; McKay, A. The Impact of Cooking with Firewood on Respiratory Health: Evidence from Indonesia. J. Dev. Stud. 2015, 51, 1619–1633. [Google Scholar] [CrossRef]
- Ahamad, M.G.; Tanin, F.; Shrestha, N. Household smoke-exposure risks associated with cooking fuels and cooking places in tanzania: A cross-sectional analysis of demographic and health survey data. Int. J. Environ. Res. Public Health 2021, 18, 2534. [Google Scholar] [CrossRef]
- Imelda Cooking that kills: Cleaner energy access, indoor air pollution, and health. J. Dev. Econ. 2020, 147, 102548. [CrossRef]
- Nie, P.; Sousa-Poza, A.; Xue, J. Fuel for life: Domestic cooking fuels and women’s health in rural China. Int. J. Environ. Res. Public Health 2016, 13, 810. [Google Scholar] [CrossRef]
- Kilabuko, J.H.; Nakai, S. Effects of cooking fuels on acute respiratory infections in children in Tanzania. Int. J. Environ. Res. Public Health 2007, 4, 283–288. [Google Scholar] [CrossRef] [Green Version]
- Phoumin, H.; Kimura, F. Cambodia’s energy poverty and its effects on social wellbeing: Empirical evidence and policy implications. Energy Policy 2019, 132, 283–289. [Google Scholar] [CrossRef]
- Simkovich, S.M.; Williams, K.N.; Pollard, S.; Dowdy, D.; Sinharoy, S.; Clasen, T.F.; Puzzolo, E.; Checkley, W. A systematic review to evaluate the association between clean cooking technologies and time use in low- and middle-income countries. Int. J. Environ. Res. Public Health 2019, 16, 2277. [Google Scholar] [CrossRef] [Green Version]
- Tiwari, I.; Herr, R.M.; Loerbroks, A.; Yamamoto, S.S. Household air pollution and angina pectoris in low-and middle-income countries: Cross-sectional evidence from the world health survey 2002–2003. Int. J. Environ. Res. Public Health 2020, 17, 5802. [Google Scholar] [CrossRef]
- Bellows, A.L.; Spiegelman, D.; Du, S.; Jaacks, L.M. The association of cooking fuel use, dietary intake, and blood pressure among rural women in China. Int. J. Environ. Res. Public Health 2020, 17, 5516. [Google Scholar] [CrossRef]
- Khanna, R.A.; Li, Y.; Mhaisalkar, S.; Kumar, M.; Liang, L.J. Comprehensive energy poverty index: Measuring energy poverty and identifying micro-level solutions in South and Southeast Asia. Energy Policy 2019, 132, 379–391. [Google Scholar] [CrossRef]
- Tu, Z.; Hu, T.; Shen, R. Evaluating public participation impact on environmental protection and ecological efficiency in China: Evidence from PITI disclosure. China Econ. Rev. 2019, 55, 111–123. [Google Scholar] [CrossRef]
- Smith, J.A.; Todd, P.E. Does matching overcome LaLonde’s critique of nonexperimental estimators? J. Econom. 2005, 125, 305–353. [Google Scholar] [CrossRef] [Green Version]
- Rahut, D.B.; Ali, A.; Mottaleb, K.A. Understanding the determinants of alternate energy options for cooking in the Himalayas: Empirical evidence from the Himalayan region of Pakistan. J. Clean. Prod. 2017, 149, 528–539. [Google Scholar] [CrossRef]
- Ho, E.W.; Strohmeier-Breuning, S.; Rossanese, M.; Charron, D.; Pennise, D.; Graham, J.P. Diverse health, gender and economic impacts from domestic transport of water and solid fuel: A systematic review. Int. J. Environ. Res. Public Health 2021, 18, 10355. [Google Scholar] [CrossRef]

| Variables | Explanation | (1) | (2) | (3) |
|---|---|---|---|---|
| N | Mean | SD | ||
| burden | Proportion of medical cost in all expense (%) | 9960 | 11.452 | 20.857 |
| fuelfee_ratio | Proportion of fuel fee in all expense (%) | 9960 | 0.247 | 0.536 |
| fuel_solid | Solid fuel as main cooking fuel (=1); Otherwise (=0) | 9960 | 0.291 | 0.454 |
| water_tap | Tap water as main cooking water (=1); Otherwise (=0) | 9960 | 0.721 | 0.449 |
| urban | Living in an urban area (=1); Otherwise (=0) | 9960 | 0.482 | 0.500 |
| ln(asset) | Logarithm of net assets (RMB) | 9960 | 12.576 | 1.409 |
| ln(income) | Logarithm of income (RMB) | 9960 | 9.108 | 1.739 |
| Familysize | Family size | 9960 | 3.790 | 1.896 |
| eduy | Average years of education of family members | 9960 | 7.332 | 3.866 |
| age | Average ages of family members | 9960 | 48.517 | 14.155 |
| exercise | Average frequency of exercise in a week | 9960 | 2.819 | 2.682 |
| exercisetime | Average time of exercise in a week | 9960 | 4.521 | 6.956 |
| health | Average health level of family members judged by interviewer (1, lowest; 7, highest) | 9960 | 5.443 | 1.216 |
| uncomfortable | Has been unwell in the past two weeks (=1); Otherwise (=0) | 9960 | 0.549 | 0.498 |
| chronic | Any chronic diseases within six months (=1); Otherwise (=0) | 9960 | 0.347 | 0.476 |
| bronchitis | Any bronchitis within six months (=1); Otherwise (=0) | 9960 | 0.115 | 0.319 |
| asthma | Any asthma within six months (=1); Otherwise (=0) | 9960 | 0.055 | 0.228 |
| hospitalized | Any hospitalization due to illness in the last 12 months (=1); Otherwise (=0) | 9960 | 0.290 | 0.454 |
| (1) | (2) | (3) | (4) | (5) | (6) | |
|---|---|---|---|---|---|---|
| fuel_solid | 1.596 *** | 1.913 *** | 1.373 ** | 1.630 *** | 1.600 ** | 1.763 ** |
| (0.509) | (0.498) | (0.644) | (0.629) | (0.775) | (0.768) | |
| eduy | −0.208 *** | −0.229 *** | −0.174 *** | −0.183 *** | −0.132 | −0.141 * |
| (0.059) | (0.061) | (0.064) | (0.066) | (0.082) | (0.085) | |
| age | 0.184 *** | 0.187 *** | 0.179 *** | 0.182 *** | 0.186 *** | 0.189 *** |
| (0.018) | (0.018) | (0.018) | (0.018) | (0.023) | (0.023) | |
| exercise | −0.246 ** | −0.255 *** | −0.222 ** | −0.228 ** | −0.331 *** | −0.334 *** |
| (0.098) | (0.095) | (0.096) | (0.094) | (0.123) | (0.122) | |
| exercisetime | 0.013 | 0.010 | 0.006 | 0.003 | 0.014 | 0.011 |
| (0.035) | (0.034) | (0.034) | (0.033) | (0.038) | (0.038) | |
| health | −1.731 *** | −1.782 *** | −2.240 *** | −2.301 *** | −2.779 *** | −2.848 *** |
| (0.269) | (0.257) | (0.341) | (0.324) | (0.391) | (0.378) | |
| uncomfortable | 1.611 *** | 1.666 *** | 1.572 *** | 1.616 *** | 1.441 *** | 1.472 *** |
| (0.385) | (0.387) | (0.388) | (0.388) | (0.444) | (0.445) | |
| chronic | 1.833 *** | 1.840 *** | 1.732 *** | 1.741 *** | 2.140 *** | 2.139 *** |
| (0.535) | (0.531) | (0.550) | (0.547) | (0.560) | (0.560) | |
| bronchitis | 0.569 | 0.624 | 0.732 | 0.777 | 0.809 | 0.843 |
| (0.937) | (0.939) | (0.947) | (0.947) | (0.986) | (0.987) | |
| asthma | −0.086 | −0.163 | −0.185 | −0.269 | −0.491 | −0.581 |
| (1.160) | (1.164) | (1.159) | (1.159) | (1.279) | (1.277) | |
| hospitalized | 9.124 *** | 9.095 *** | 8.963 *** | 8.932 *** | 9.057 *** | 9.032 *** |
| (0.581) | (0.582) | (0.593) | (0.594) | (0.660) | (0.661) | |
| familysize | −0.278 ** | −0.379 *** | −0.301 ** | −0.391 *** | −0.290 ** | −0.386 *** |
| (0.120) | (0.123) | (0.125) | (0.129) | (0.144) | (0.149) | |
| ln(asset) | −0.791 *** | −0.723 *** | −0.805 *** | |||
| (0.223) | (0.246) | (0.287) | ||||
| ln(income) | −0.474 *** | −0.455 *** | −0.360 ** | |||
| (0.129) | (0.133) | (0.158) | ||||
| Province fixed | Y | Y | Y | Y | Y | Y |
| County fixed | Y | Y | Y | Y | ||
| Community fixed | Y | Y | ||||
| N | 9960 | 9960 | 9958 | 9958 | 9730 | 9730 |
| r2 | 0.133 | 0.132 | 0.154 | 0.154 | 0.232 | 0.232 |
| r2_a | 0.129 | 0.129 | 0.131 | 0.131 | 0.103 | 0.103 |
| Control Mean | 10.120 | 10.120 | 10.120 | 10.120 | 10.191 | 10.191 |
| (1) | (2) | (3) | (4) | (5) | (6) | (7) | |
|---|---|---|---|---|---|---|---|
| Matching Methods | One-to-One | Neighbor | Caliper | Radius | Kernel | Local Linear | Mahal |
| Un-matched | 4.584 *** | 4.584 *** | 4.584 *** | 4.584 *** | 4.584 *** | 4.584 *** | 4.584 *** |
| (0.458) | (0.458) | (0.458) | (0.458) | (0.458) | (0.458) | (0.458) | |
| ATT | 2.223 ** | 1.75 ** | 1.749 * | 1.606 ** | 1.714 ** | 1.606 ** | 1.780 *** |
| (0.944) | (0.842) | (0.912) | (0.684) | (0.759) | (0.703) | (0.658) | |
| ATU | 1.824 ** | 1.469 ** | 1.469 ** | 1.444 *** | 1.689 *** | 1.566 ** | 1.977 *** |
| (0.743) | (0.653) | (0.679) | (0.522) | (0.597) | (0.618) | (0.625) | |
| ATE | 1.941 *** | 1.552 ** | 1.552 ** | 1.492 *** | 1.696 *** | 1.578 *** | 1.920 *** |
| (0.602) | (0.605) | (0.626) | (0.494) | (0.603) | (0.578) | (0.580) | |
| N | 9960 | 9960 | 9960 | 9960 | 9960 | 9960 | 9960 |
| (1) | (2) | (3) | (4) | (5) | (6) | |
|---|---|---|---|---|---|---|
| Method (i): Tobit estimates (medical expense as a censored variable) | ||||||
| fuel_solid | 1.596 *** | 1.373 ** | 1.600 *** | 1.913 *** | 1.630 *** | 1.763 *** |
| (0.496) | (0.540) | (0.592) | (0.485) | (0.532) | (0.590) | |
| Method (ii): 2SLS (tap water as an IV) | ||||||
| fuel_solid | 6.628 ** | 7.496 * | 17.279 * | 6.793 ** | 7.740 ** | 17.562 * |
| (2.918) | (4.098) | (9.701) | (2.664) | (3.850) | (9.354) | |
| Method (iii): IV-Tobit (tap water as an IV, and medical expense as a censored variable) | ||||||
| fuel_solid | 8.321 *** | 9.606 ** | 20.714 ** | 8.250 *** | 9.616 *** | 20.715 ** |
| (2.989) | (3.913) | (8.562) | (2.730) | (3.679) | (8.280) | |
| ln(asset) | Y | Y | Y | |||
| ln(income) | Y | Y | Y | |||
| Other controls | Y | Y | Y | Y | Y | Y |
| Province fixed | Y | Y | Y | Y | Y | Y |
| County fixed | Y | Y | Y | Y | ||
| Community fixed | Y | Y | ||||
| N | 9960 | 9958 | 9370 | 9960 | 9958 | 9370 |
| (1) | (2) | (3) | (4) | (5) | (6) | |
|---|---|---|---|---|---|---|
| (i) health | ||||||
| fuel_solid | −0.141 *** | −0.118 *** | −0.092 *** | −0.204 *** | −0.176 *** | −0.121 *** |
| (0.034) | (0.032) | (0.031) | (0.033) | (0.032) | (0.031) | |
| N | 9960 | 9958 | 9370 | 9960 | 9958 | 9370 |
| (ii) uncomfortable | ||||||
| fuel_solid | 0.051 *** | 0.051 *** | 0.050 *** | 0.058 *** | 0.056 *** | 0.054 *** |
| (0.012) | (0.014) | (0.015) | (0.012) | (0.013) | (0.015) | |
| N | 9959 | 9866 | 8892 | 9959 | 9866 | 8892 |
| (iii) chronic | ||||||
| fuel_solid | 0.031 *** | 0.027 ** | 0.032 ** | 0.033 *** | 0.029 ** | 0.033 ** |
| (0.012) | (0.013) | (0.014) | (0.011) | (0.012) | (0.014) | |
| N | 9959 | 9854 | 8785 | 9959 | 9854 | 8785 |
| (iv) bronchitis | ||||||
| fuel_solid | 0.023 *** | 0.022 ** | 0.028 ** | 0.026 *** | 0.024 *** | 0.029 ** |
| (0.008) | (0.009) | (0.011) | (0.008) | (0.009) | (0.011) | |
| N | 9959 | 9763 | 7354 | 9959 | 9763 | 7354 |
| ln(asset) | Y | Y | Y | |||
| ln(income) | Y | Y | Y | |||
| Other controls | Y | Y | Y | Y | Y | Y |
| Province fixed | Y | Y | Y | Y | Y | Y |
| County fixed | Y | Y | Y | Y | ||
| Community fixed | Y | Y |
| (1) | (2) | (3) | (4) | (5) | (6) | |
|---|---|---|---|---|---|---|
| fuel_solid | −0.016 | −0.009 | −0.005 | −0.007 | −0.001 | −0.000 |
| (0.013) | (0.020) | (0.014) | (0.014) | (0.022) | (0.014) | |
| ln(asset) | −0.022 *** | −0.023 *** | −0.024 *** | |||
| (0.005) | (0.006) | (0.005) | ||||
| ln(income) | −0.016 *** | −0.016 *** | −0.014 *** | |||
| (0.003) | (0.003) | (0.003) | ||||
| Other controls | Y | Y | Y | Y | Y | Y |
| Province fixed | Y | Y | Y | Y | Y | Y |
| County fixed | Y | Y | Y | Y | ||
| Community fixed | Y | Y | ||||
| N | 9960 | 9958 | 9370 | 9960 | 9958 | 9370 |
| r2 | 0.068 | 0.095 | 0.576 | 0.068 | 0.095 | 0.576 |
| r2_a | 0.065 | 0.071 | 0.505 | 0.065 | 0.071 | 0.505 |
| (1) | (2) | (3) | (4) | (5) | (6) | |
|---|---|---|---|---|---|---|
| (i) heterogeneity in urban (urban = 1, if living in urban areas; urban = 0, otherwise.) | ||||||
| fuel_solid * urban | −9.022 * | −11.691 * | −35.671 ** | −8.911 * | −11.731 * | −35.369 ** |
| (5.186) | −6.72 | −17.383 | −5.141 | −6.693 | −16.81 | |
| (ii) heterogeneity in house (house = 1, if house owned by household; house = 0, otherwise.) | ||||||
| fuel_solid * house | −45.202 ** | −45.092 ** | −113.346 * | −45.077 ** | −45.600 ** | −113.769 * |
| −21.373 | (22.547) | (62.621) | −20.476 | (22.006) | (61.329) | |
| (iii) heterogeneity in education (education = 1, if higher than the average level; education = 0, if lower than the average level.) | ||||||
| fuel_solid * education | −11.538 ** | −11.075 ** | −19.606 ** | −11.480 ** | −11.096 ** | −19.599 ** |
| (4.577) | (4.554) | (8.124) | (4.469) | (4.477) | (7.983) | |
| ln(asset) | Y | Y | Y | |||
| ln(income) | Y | Y | Y | |||
| Other controls | Y | Y | Y | Y | Y | Y |
| Province fixed | Y | Y | Y | Y | Y | Y |
| County fixed | Y | Y | Y | Y | ||
| Community fixed | Y | Y | ||||
| N | 9960 | 9958 | 9370 | 9960 | 9958 | 9370 |
Publisher’s Note: MDPI stays neutral with regard to jurisdictional claims in published maps and institutional affiliations. |
© 2022 by the authors. Licensee MDPI, Basel, Switzerland. This article is an open access article distributed under the terms and conditions of the Creative Commons Attribution (CC BY) license (https://creativecommons.org/licenses/by/4.0/).
Share and Cite
Lin, B.; Wei, K. Does Use of Solid Cooking Fuels Increase Family Medical Expenses in China? Int. J. Environ. Res. Public Health 2022, 19, 1649. https://doi.org/10.3390/ijerph19031649
Lin B, Wei K. Does Use of Solid Cooking Fuels Increase Family Medical Expenses in China? International Journal of Environmental Research and Public Health. 2022; 19(3):1649. https://doi.org/10.3390/ijerph19031649
Chicago/Turabian StyleLin, Boqiang, and Kai Wei. 2022. "Does Use of Solid Cooking Fuels Increase Family Medical Expenses in China?" International Journal of Environmental Research and Public Health 19, no. 3: 1649. https://doi.org/10.3390/ijerph19031649
APA StyleLin, B., & Wei, K. (2022). Does Use of Solid Cooking Fuels Increase Family Medical Expenses in China? International Journal of Environmental Research and Public Health, 19(3), 1649. https://doi.org/10.3390/ijerph19031649