1. Introduction
The wide spread of COVID-19 in early 2020 has changed the way we live and work. In an environment where the epidemic was spreading, new digital business models such as online office, online shopping, online teaching, and online video were emerging, and the digital economy have been developing rapidly [
1]. In 2016, the G20 Digital Economic Development and Cooperation Initiative clarified the concept of the digital economy, highlighting digital information and knowledge and their role as carriers of information networks. It also identified new information and communication technologies (ICT) as a critical driver for upgrading the economy’s structure [
2]. In 2020, the value of China’s digital economy reached CNY 39.2 trillion, accounting for 7.8% of the gross domestic product (Data from a white paper on the development of China’s digital economy published by the China Academy of Information and Communication Technology). During the global epidemic outbreak crisis, the development of the digital economy has provided a strong impetus and guarantee for economic development.
Medical studies have indicated that the main channels of transmission of COVID-19 viruses include contact transmissions, mother-to-child transmission, and aerosol transmission [
3]. Aerosol transmission refers to the mixing of droplets in the air to form an aerosol which, when inhaled, causes infection. Delicate particulate matters are airborne particles equal to or less than 2.5 microns in diameter, which can be suspended in the air for a more extended period and have a more significant impact on human health and the quality of the atmospheric environment. During the period of COVID-19 outbreak, exposure to PM
2.5 increased the risk of more severe symptoms at the time of infection [
4], including death (Harvard T.H. Chan School of Public Health. (n.d.). Coronavirus and air pollution.
https://www.hsph.harvard.edu/c-change/subtopics/coronavirus-and-pollution/, accessed on 25 August 2022). According to the air quality report 2021 (
https://www.iqair.cn/cn/world-air-quality-report (accessed on 25 August 2022)), 143 of 1347 cities in East Asia, had a PM
2.5 greater than seven times the World Health Organization (WHO) air quality objective value, and all 143 of these cities are from China, where average PM
2.5 concentration in 2021 was 6.5 times the WHO annual air quality objective value. In 2021, China ranked as the 22nd dirtiest country in the world. A series of facts show that air pollution caused by PM
2.5 emissions is a significant problem in China and, as such, poses a considerable threat to public health and sustainable economic development. Especially in the case of widespread COVID-19 virus transmission, air quality has a direct impact on the rate of virus transmission [
4].
Since the deepening of reform and opening up in China, the rapid economic development urbanization level has been increasing. The urbanization process over the past 40 years had shown that the problem of high PM
2.5 concentrations was mainly concentrated in cities [
5,
6]. Unfortunately, China’s brutal model of economic development over the past decades has caused irreversible environmental and energy crises [
7]. Based on the transmission characteristics of the new coronavirus and the development of the digital economy in the post-epidemic era, it is essential to analyze the impact of the digital economy on urban PM
2.5 emissions. In addition, in August 2013, China’s Ministry of Industry and Information Technology implemented a pilot policy on smart cities as an innovation to the traditional urban governance model. There is a quasi-natural experimental scenario for empirical analysis of whether innovations in urban governance models in the development of the digital economy can reduce PM
2.5 emissions.
Employing panel data of China’s 283 cities from 2011 to 2019, this paper empirically explores the effects of the digital economic development and SCP policy on PM2.5, adopting the spatial Durbin model and the spatial difference-in-difference (SDID) model, respectively. We mainly analyze the following question: Does digital economy development reduce PM2.5 emissions? Does the digital economy have spatial spillover effect on PM2.5? Have SCP policy reduced PM2.5 emissions? Does smart city construction have a spatial spillover effect on PM2.5 emissions?
The main contributions of this study can be summarized as follows: (1) Existing studies on the digital economy have not standardized the definition and measurement of the digital economy. This study employs an indicator system to construct digital economy indicators at the city level in China through the entropy value method to complement the digital economy research. (2) This paper quantified the impact of smart city construction on PM2.5 emissions in a quasi-natural experiment using China’s SCP policy. Thus, it expands the existing research perspective on smart cities and adds to the existing literature by linking environmental pollution to smart city construction. (3) The spatial spillover effects of digital economy and smart city construction are vital issues that may be neglected in existing studies. This study also analyzes the impact of the digital economy and smart city construction on PM2.5 emissions in pilot cities and neighboring non-pilot cities.
The structure of this paper is arranged as follows.
Section 2 is a literature review.
Section 3 shows the research design and empirical analysis model.
Section 4 further explains the spatial characteristics of the digital economy and PM
2.5 emissions.
Section 5 presents and discusses the empirical results.
Section 6 carries out an analysis of spatial heterogeneity.
Section 7 summarizes the conclusion.
2. Literature Review
Reviewing the digital economy, Tapscott (1996) indicated that the digital economy explains the relationship between the new economy, new business, and new technology [
8]. Rouse (2016) defined the digital economy as the economy based on digital technology and considered the digital economy as a global network of economic activities supported by information and communication technologies [
9]. Further, Dahlman et al. (2016) explained that the digital economy integrates a variety of generic technologies, a range of economic and social activities carried out through the internet, including digital technologies based on physical infrastructure, used to access devices and their applications to provide conditions [
10].
With the rapid development of the internet, big data, cloud computing, blockchain, and other modern information technologies, the digital economy was increasingly used in life and production [
11]. Especially in the light of COVID-19, the digital economy was promoted more widely. The digital economy has become a significant driver for the development of countries in the future [
12,
13]. As a result, the digital economy has attracted widespread attention from political and academic circles.
First, some of the studies point to the digital economy as a driver for the development of technology promotion, which improves economic development, social productivity, and resource allocation throughout society [
14,
15,
16]. On the one hand, the emergence of the internet has reshaped operational and organizational structures, deflating spatial and temporal constraints and enabling greater automation of traditional manufacturing processed, leading to lower production costs, and higher productivity [
14,
17,
18]. On the other hand, the digital economy promotes connectivity, mere sharing and innovative collaboration between economic agents, thus promoting digital technology empowerment [
19,
20,
21]. With technological innovation as the driving force of economic action, the digital economy faces a broader scope for development against the backdrop of the ongoing advancement of global sustainable development goals.
Second, with the advent of the internet, the digital economy has had a significant impact on changes in the way societies live. For example, online shopping has eliminated geographical restrictions, allowing people worldwide to buy the same products and services, and promoting a global balance between supply and demand [
12]. In addition, the digital economy has played an irreplaceable role in the context of the spreading of COVID-19. Online meetings, online offices, and online teaching provide a condition for isolating groups [
22,
23]. The digital economy will play an increasingly important role in future development during a century of unprecedented change.
Third, the digital economy development also influenced the environment. With global environmental constraints, increasing applications of digital technologies are emerging in the energy and environmental sectors [
16,
18]. The information integration capabilities of digital technologies help energy companies to improve the efficiency, to reduce production costs, and to extend the benefits of clean energy [
24]. In addition, scholars in the field have shifted from concentrating on whether the digital economy is good for the environment to focus on how the digital economy is good for the environment.
2.1. Research on Digital Economy and Emissions Nexus
To meet the requirements of adapting to green development and addressing global environmental issues, the digital economy has become a significant factor in promoting quality economic development [
13,
18]. The main aspects are summarized below.
The development of digital economy contributes to the technological improvement of the energy industry. Litvinenko (2020) uses the example of the mineral industry in the Russian Federation for his analysis and illustrates that digital systems reduce production costs and improve the quality of human capital to achieve organizational efficiency gains [
25]. In addition, using Japan as an example for analysis, Ahl et al. (2020) suggested that in the energy sector, blockchain can reduce transaction costs, facilitate distributed, peer-to-peer transactions, and create an innovative ecosystem for energy transformation [
26]. Park and Heo (2020) indicated that the energy data sharing mechanism and efficient regulatory system established by ICT has facilitated the rapid development of the energy sector in power industry in Korea [
27]. One of the essential ways to reduce emissions is to improve energy efficiency [
7,
18,
28,
29].
2.2. Smart City Construction and Emissions Nexus
As the foundation of urban digital economy development, the construction of a smart city takes an exogenous influence, and it is of great significance to investigate its influence on emissions [
13,
16].
Smart cities are considered to be a transformation of city building and management, with the integration of urban resources and information technology at their core [
30]. Then, through the integration of urban resources and information technology, smart city construction effectively improves air quality and has a significant positive spillover effect on air pollution in neighboring cities, such that most of it can be attributed to the technological impact [
31]. On one hand, information technology can break through regional restrictions and facilitate spreading technology and knowledge across regions. This enables innovation dividends to be shared, which drives the production and lifestyle of other cities around the smart city in the direction of intelligence [
27,
32]. On the other hand, the construction of smart cities promotes the upgrading of urban industries structure and frees up space for the development of high-tech industries by shifting energy-intensive and pollution-intensive industry within the region [
16,
33].
A review of the literature revealed that there are still two gaps in the research on this subject. First, even if the research on the digital economy have been around for a long time, there is still a study gap in the definition and measures standard. Second, although existing studies have analyzed impacts of digital economy on the environment, there is still a research gap in the effect of digital economy and smart city construction on PM2.5 emissions. The following study will fill the above gaps.
3. Research Design
3.1. Methodology
3.1.1. Spatial Autocorrelation Model
Spatial autocorrelation refers to the potential interdependence between the observation variables within the same distribution region. Especially, areas with similar locations have similar variable values. If high values are adjacent to high values, or common values are adjacent to common values, positive spatial autocorrelation exists. If high values are adjacent to low values, there is a negative spatial correlation. If high values and common values are published randomly, there is no spatial correlation [
34]. The global Moran’s I index was used to conduct spatial autocorrelation analysis of urban PM
2.5 emissions, and the relevant formula as follows [
35].
The value of
I ranges from −1 to 1. A positive value of
I indicates a positive autocorrelation in the neighboring space. The larger the
I, the stronger the spatial correlation. Conversely, a negative value of
I represents a negative autocorrelation in the adjacent area. If
I is equal to 0, it indicates no spatial autocorrelation in urban carbon emissions [
36].
Wij denoted the neighborhood weight matrix, and
n represented the total number of cities.
ci,
cj represented the carbon emissions of city
i and city
j, respectively.
defined the average value of carbon emissions.
3.1.2. Spatial Markov Chains
A Markov chain is mainly used to analyze the continuous attribute values of an index in different periods. Usually, the data level division is used to estimate the probability distribution and change of each type, and the evolution and development process of geographical phenomena are approximated as Markov processes [
37]. A particular kind of distribution at time
t is represented by the state probability vector of
of 1
× k, and the whole state transition process is described by the probability value
k × k, as the Markov probability transition matrix
Mij [
38,
39].
Mij represented the probability that a spatial unit of type
i at time
t becomes of type
j at time
t + 1.
where
nij represents the number of type
i at time
t that become type
j at time
t + 1, and
ni represents the sum of all kinds of
i during the study period.
The regional correlation and dependence of the digital economy in geographic space could not be ignored. The spatial Markov chain combined with the concept of spatial lag made up for the lack of missing spatial interaction in the static Markov chain. The spatial Markov chain introduce the spatial weight matrix to calculate the weighted average attributes of adjacent regions to analyze the neighborhood conditions of spatial nits. If the Markov chain has
N possible states, the size of the transition matrix is of order
N. To analyze the state transition trend and dynamic evolution characteristics of the research object, the digital economy level firstly was divided into
N types by the method of the natural break point. Secondly, the corresponding Markov probability transition matrix is constructed to reflect the dynamic characteristics of the development of the digital economy. Considering the mutual influence of the development of the digital economy in the neighborhood, space factors are considered in the Markov transition matrix [
40], as shown in the following model:
where, the
value represents the spatial lag value, measuring the development level of the digital economy in the spatial neighborhood, and obtained by the natural break point method.
Digitali represents the digital economy level in city
i.
Wij denoted the spatial weight matrix.
3.1.3. Spatial Econometric Model
In this study, the spatial Durbin model (SDM) is used to introduces the spatial lag term of dependent variables and the spatial lag term of the independent variables as independent variables. The following model analyzes the relationship between the digital economy and PM
2.5 emissions.
where,
pmit is PM
2.5 emissions per unit of output in city
i, and
β is the spatial lag regression coefficient, indicating the degree of mutual influence of spatial neighborhood PM
2.5 emissions.
Xit includes total independent variables in city
i.
γ is the regression coefficients of independent variables, and
λ spatial lag regression coefficients of independent variables.
α0,
μi, and
νt represent constant term, individual fixed, and time fixed effects, respectively.
εit is the random disturbance term.
Wij is the spatial weight matrix. In this study, three spatial weights are used to analyze the spatial Durbin model. The first matrix (
) is the spatial adjacency matrix, which takes the value of 1 for neighboring cities and 0 otherwise. The second matrix (
) is the economic distance matrix, constructed based on the inverse of the gap between the per capita GDP of two cities. The third matrix (
) is the economic–geographic nested matrix. Considering the influence of economic factors and geographical, the economic distance spatial weight matrix and geographical distance spatial weight matrix are nested to construct the matrix.
3.1.4. Spatial Difference-in-Differences Model
The construction of smart cities is the primary driver of the digital economy [
16]. The Ministry of Housing and Construction officially promulgated the smart cities list on 5 August 2013 (
http://www.gov.cn/jrzg/2013-08/05/content_2461575.htm (accessed on 25 August 2022)) to promote the construction of smart city construction. To more robustly analyze the impact of the digital economy on PM
2.5 emissions, this study constructed a dummy variable to investigate the SCP policy effect. The pilot city is 1, and the value of the non-pilot city is 0, which is used to analyze the impact of SCP policy on urban PM
2.5 emissions sites. The spatial DID model has been set as follows.
where,
Smart represents the dummy variable for whether SCP policy is implemented, and other symbols are identical as Equation (5).
A necessary prerequisite for the DID method is that the treatment and control groups satisfy the parallel trend hypothesis, i.e., there is either no significant difference in the digital economy and PM2.5 emissions between the treatment and control groups of cities before the SCP policy, or there is a relatively stable linkage trend. To address the characteristics of SCP policy implementation, this study adopted an event study approach to test the parallel trends.
The negative impact of the SCP policy on PM
2.5 emissions may also come from some unobservable factors. To ensure the reliability of the estimation results, estimation bias due to the omission of explanatory variables needs to be eliminated. Xie et al. (2021) and Guo et al. (2022) employed a random sampling method for placebo tests. Specifically, we first divided all cities into the control group based on the actual SCP policy [
16,
41]. We then randomly selected the same number of cities in the sample as the treatment group and re-estimated benchmark estimates of 1000 times based on these placebo samples. The t-statistics and coefficient estimates of 1000 times followed essentially a normal distribution.
3.2. Variables Selected
The dependent variable is PM2.5 emissions per unit of production (pm). The Atmospheric Composition Analysis Group at Dalhousie University in Halifax combines global models, satellite observations, and air quality monitor data to develop estimates of on-the-ground PM2.5 levels (The resolution of the retrieval product is 0.01° × 0.01° spatial resolution. The data in the grid can be exported by ArcGIS software). The measured data are used in the empirical analysis of this paper.
The digital economy level was selected as the core independent variable. There is still no uniform standard for the digital economy level. Combining with existing studies on the digital economy [
16,
42,
43,
44], this study used the entropy method to measure the level of digital economy development for four indicators: digital infrastructure, digital industry development, digital innovation, and digital inclusive finance. Precisely, digital infrastructure is mainly measured by broadband internet infrastructure and mobile internet infrastructure by, respectively, the number of internet users and mobile phone users. The development level of the digital industry is mainly measured by the information industry basis and output value, which are the number of personnel in the information transmission, computer service, and software industry and the total amount of telecom business. Digital innovation level is mainly measured by spending on science and education. Digital financial inclusion is mainly measured from three aspects: coverage breadth index, use depth index, and digital measure, which are the coverage breadth index, use depth index, and digital measure index of digital financial. Finally, the entropy method is used to measure the comprehensive index of digital economy shown in
Table 1. The development level of the city’s digital economic is divided into four stages by the natural break point method: lag phase, initial phase, propulsion phase, and leading phase.
Based on existing research and theoretical analysis, the economy development level (measured by per capita gross domestic product (GDP)) [
7,
45,
46], urbanization level [
47,
48], urban size (measured by population) [
49,
50,
51], investment in fixed assets [
45,
52,
53], industrial upgrading [
29,
54,
55], and green total factor productivity [
56] are selected as control variables.
3.3. Data Sources
This study selected 283 prefecture-level cities in China from 2011 to 2019 as research samples. The data mainly comes from the Wind database, Guoyan web, China Urban Statistical Yearbook, Digital research center of Peking University, China Energy Statistical Yearbook, and China environmental Statistical Yearbook.
Table 2 presents the descriptive statistics of a significant variable.
4. Spatial Evolution of the Digital Economy and PM2.5 Emissions
4.1. Agglomeration Characteristics of Digital Economy and PM2.5 Emissions
Based on the global Moran’s I index, this paper has analyzed the agglomeration characteristics of the digital economy development level and PM
2.5 emissions in China, and further explored the spatial features. The results are shown in
Table 2, which reports the global Moran’s I index for the digital economy [
12,
14] and PM
2.5 emissions [
40,
57]. The Moran’s I indexes are all significantly greater than 0, indicating a positive spatial autocorrelation between the digital economy and PM
2.5 emissions among Chinese cities. Specifically, the Moran’s I index of the digital economy is smaller than the Moran’s I index of PM
2.5 emissions, indicating that the spatial autocorrelation of the digital economy is slightly weaker than the spatial autocorrelation of PM
2.5 emissions.
To analyze the spatial relationship of the digital economy and PM2.5 emissions, Moran’s I indexes have been presented by different spatial distance thresholds of 100 km, 200 km, 300 km, 400 km, 500 km, and the entirety of these are in
Table 3. The
p-values of the Moran’s I index for the digital economy and PM
2.5 emissions are zero, and the
z-indexes are greater than 2.58, indicating significant spatial clustering of the digital economy and PM
2.5 emissions in the city. Specifically, the Moran’s I indexes for the digital economy continues to decrease over time, and the Moran’s I indexes for PM
2.5 emissions increase and decrease, suggesting that the correlation between different cities in the development of the digital economy has an impact on the spatial correlation of PM
2.5 emissions.
4.2. Spatial Distribution Characteristics of the Digital Economy
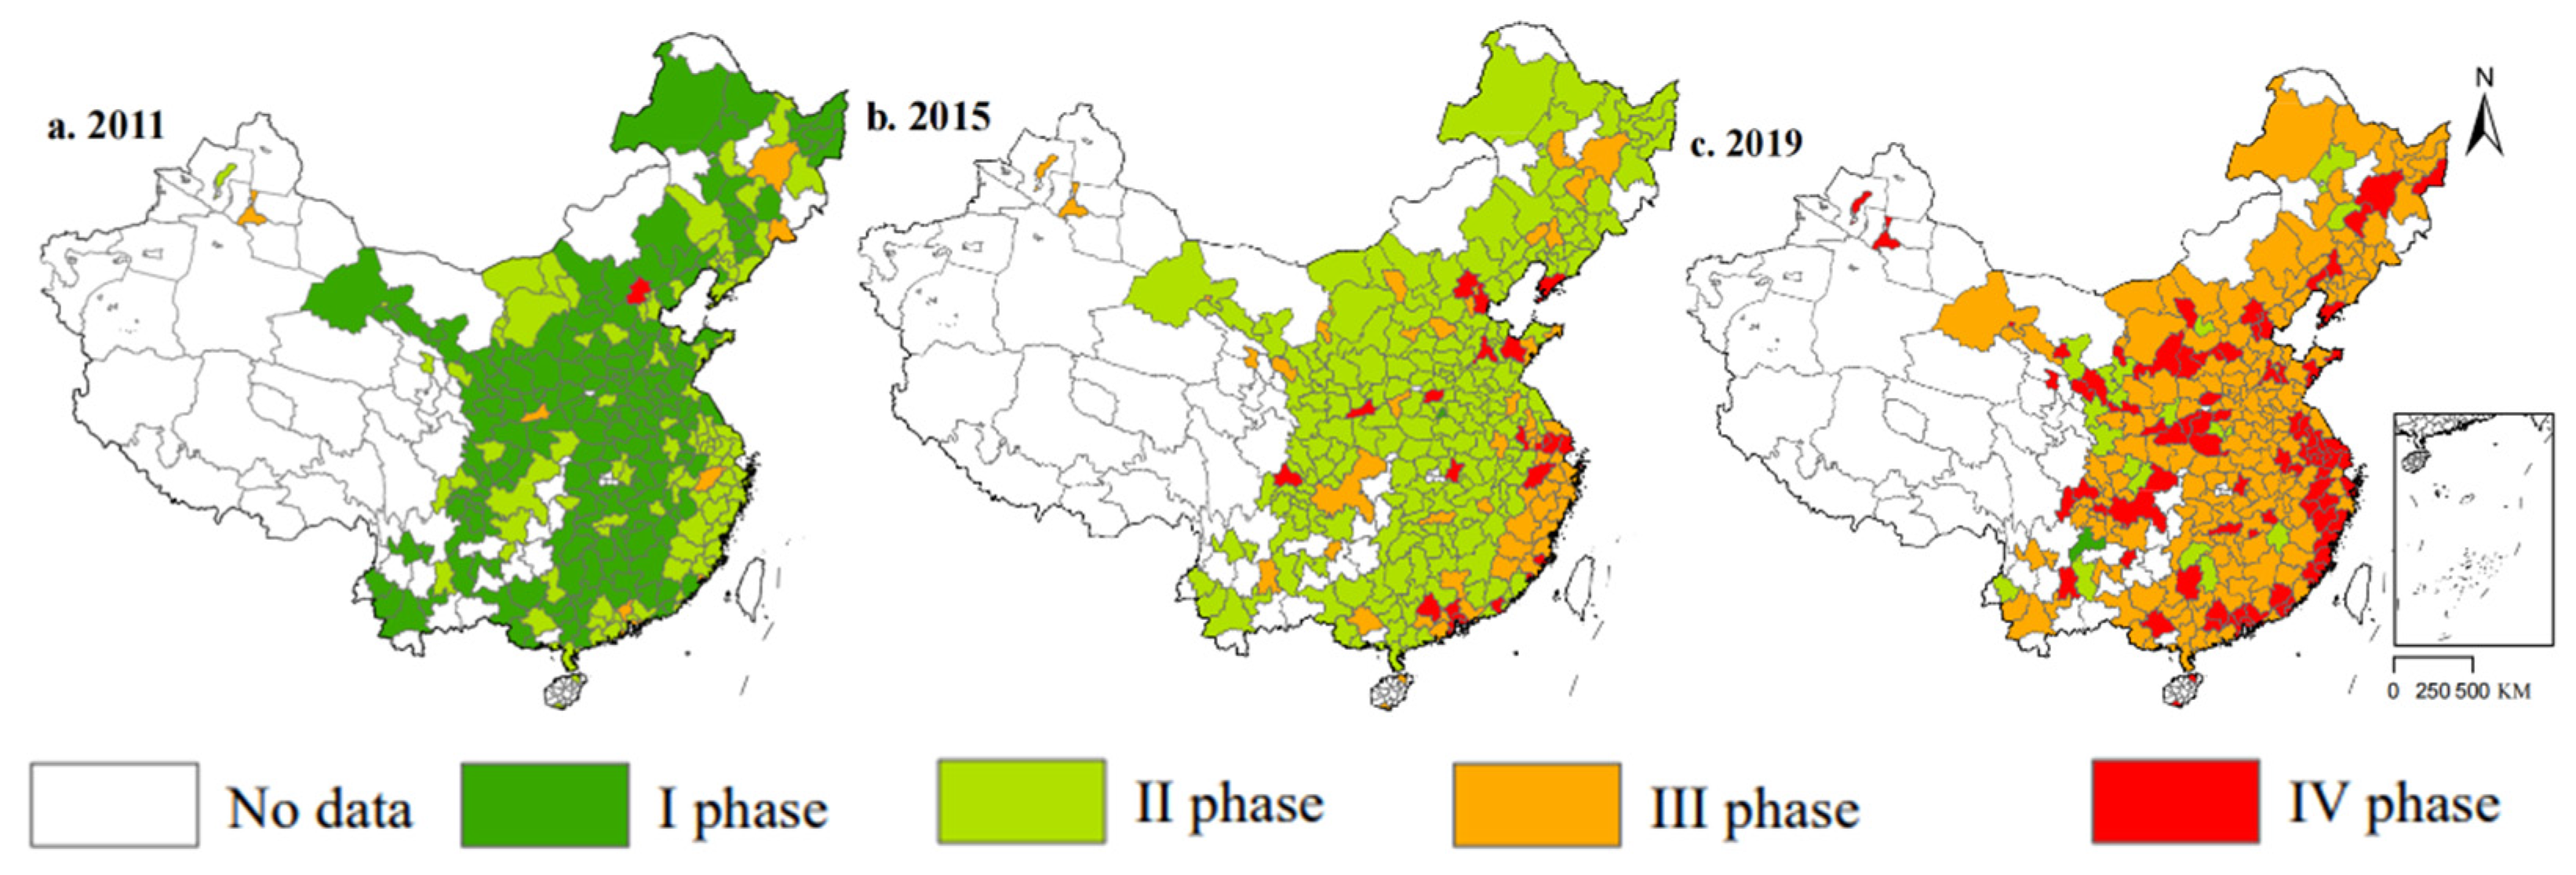
The spatial distribution characteristics of the digital economy were visualized by ArcGIS 10.6 software, as shown in
Figure 1. From 2011 to 2019, the digital economy development level has shown a trend of improvement, as well as a form of aggregate development. The digital economy level was divided into four segments by the method of natural segment points. The development level of the digital economy below 0.047 is the I phase, between 0.048 and 0.095 is the II phase, between 0.096 and 0.142 is the III phase, and greater than 0.142 is the IV phase. The development of the digital economy in eastern coastal areas has shown an agglomeration effect, especially in the Pearl River Delta and Yangtze River Delta. In 2019, the development level of China’s digital economy significantly improved. The theme of the digital economy and economic development pattern shows the phenomenon of the core cities of digital economy spreading to surrounding cities. On one hand, the technology spillover effect is the reason. On the other hand, factor resource allocation optimization is the reason.
4.3. Spatial Dynamic Characteristics of the Digital Economy
To analyze the spatial dynamic characteristics, in this section, we used the Markov chain method to calculate the transition probability of the digital economy to analyze the spatial evolution characteristics of the digital economy between cities from 2011 to 2019. The digital economy development level is divided into four stages, including: I phase, II phase, III phase, and IV phase by the natural break point method. According to the results in
Table 4, the diagonal values of II phase, III phase, and IV phase of digital economy development level are all greater than 0.75, indicating that there is a hierarchical solidification phenomenon in these three phases. The hierarchical solidification level of I phase is the weakest, with a probability of 0.384. The upper right of the main diagonal indicates the probability of the digital economy moving from a lower level to a higher level. Among them, the transfer possibility from the I phase to the II phase is the highest, which is 0.631. The second is from the II phase to III phase, with a probability of 0.222, followed by the transfer from propulsion phase to IV phase, with a probability of 0.173. In addition, the probability of cross-level transfer is minimal, which are less than 0.01, indicating that the development level of the urban digital economy in China has a steady and gradual trend, and multi-level leapfrog development is challenging to occur.
4.4. Spatial Transfer Characteristics of the Digital Economy
Due to spatial auto-correlation, this section analyzes the influence of geographical neighborhood relationships on the transition probability of digital economy development. The Markov transition matrix is used to analyze the transition probability of the digital economy development level under the influence of the community, and the results are shown in
Table 5. In terms of the transfer probability of digital economy level in the lag phase’s neighborhood, the central diagonal values of IV phase, III phase, II phase, and I phase are 0.900, 0.600, 0.710, and 0.500 respectively, indicating that the probability of horizontal transfer of digital development in the IV phase is more negligible in the I phase community. From the perspective of transfer probability of digital economy level in the neighborhood of the II phase, the main diagonal values of the IV phase, III phase, II phase, and I phase are 0.750, 0.773, 0.750, and 0.500, respectively, indicating that the transfer probability of the II phase is strong. The digital economy level of I phase in the neighborhood of II phase has a possibility of 0.5 to move to a higher level. According to the perspective of the transfer probability of the digital economic development in the community of III phase, the central diagonal values of the IV phase, III, II phase, and I phase are 0.877, 0.750, 0.787, and 0.200, respectively, indicating that I phase in the neighborhood of the III phase has a significant influence on I phase. The probability of transfer to II phase is 0.800. In terms of the transfer probability of the digital economy level in the IV phase’s neighborhood, the central diagonal values of the IV phase, III phase, II phase, and I phase are 0.931, 0.799, 0.770, and 0.382, respectively, indicating that the probability of horizontal transfer of digital development in I phase is 0.618. According to the above analysis, the state transition of the digital economy has a specific spatial correlation, and, significantly, the I phase is most affected by the digital economy level of the surrounding cities. In addition, there are apparent differences in the influence of different levels of regions in the dynamic transfer. In particular, the IV phase can promote the joint development of the digital economy in surrounding cities.
4.5. Spatial Distribution Characteristics of PM2.5 Emissions
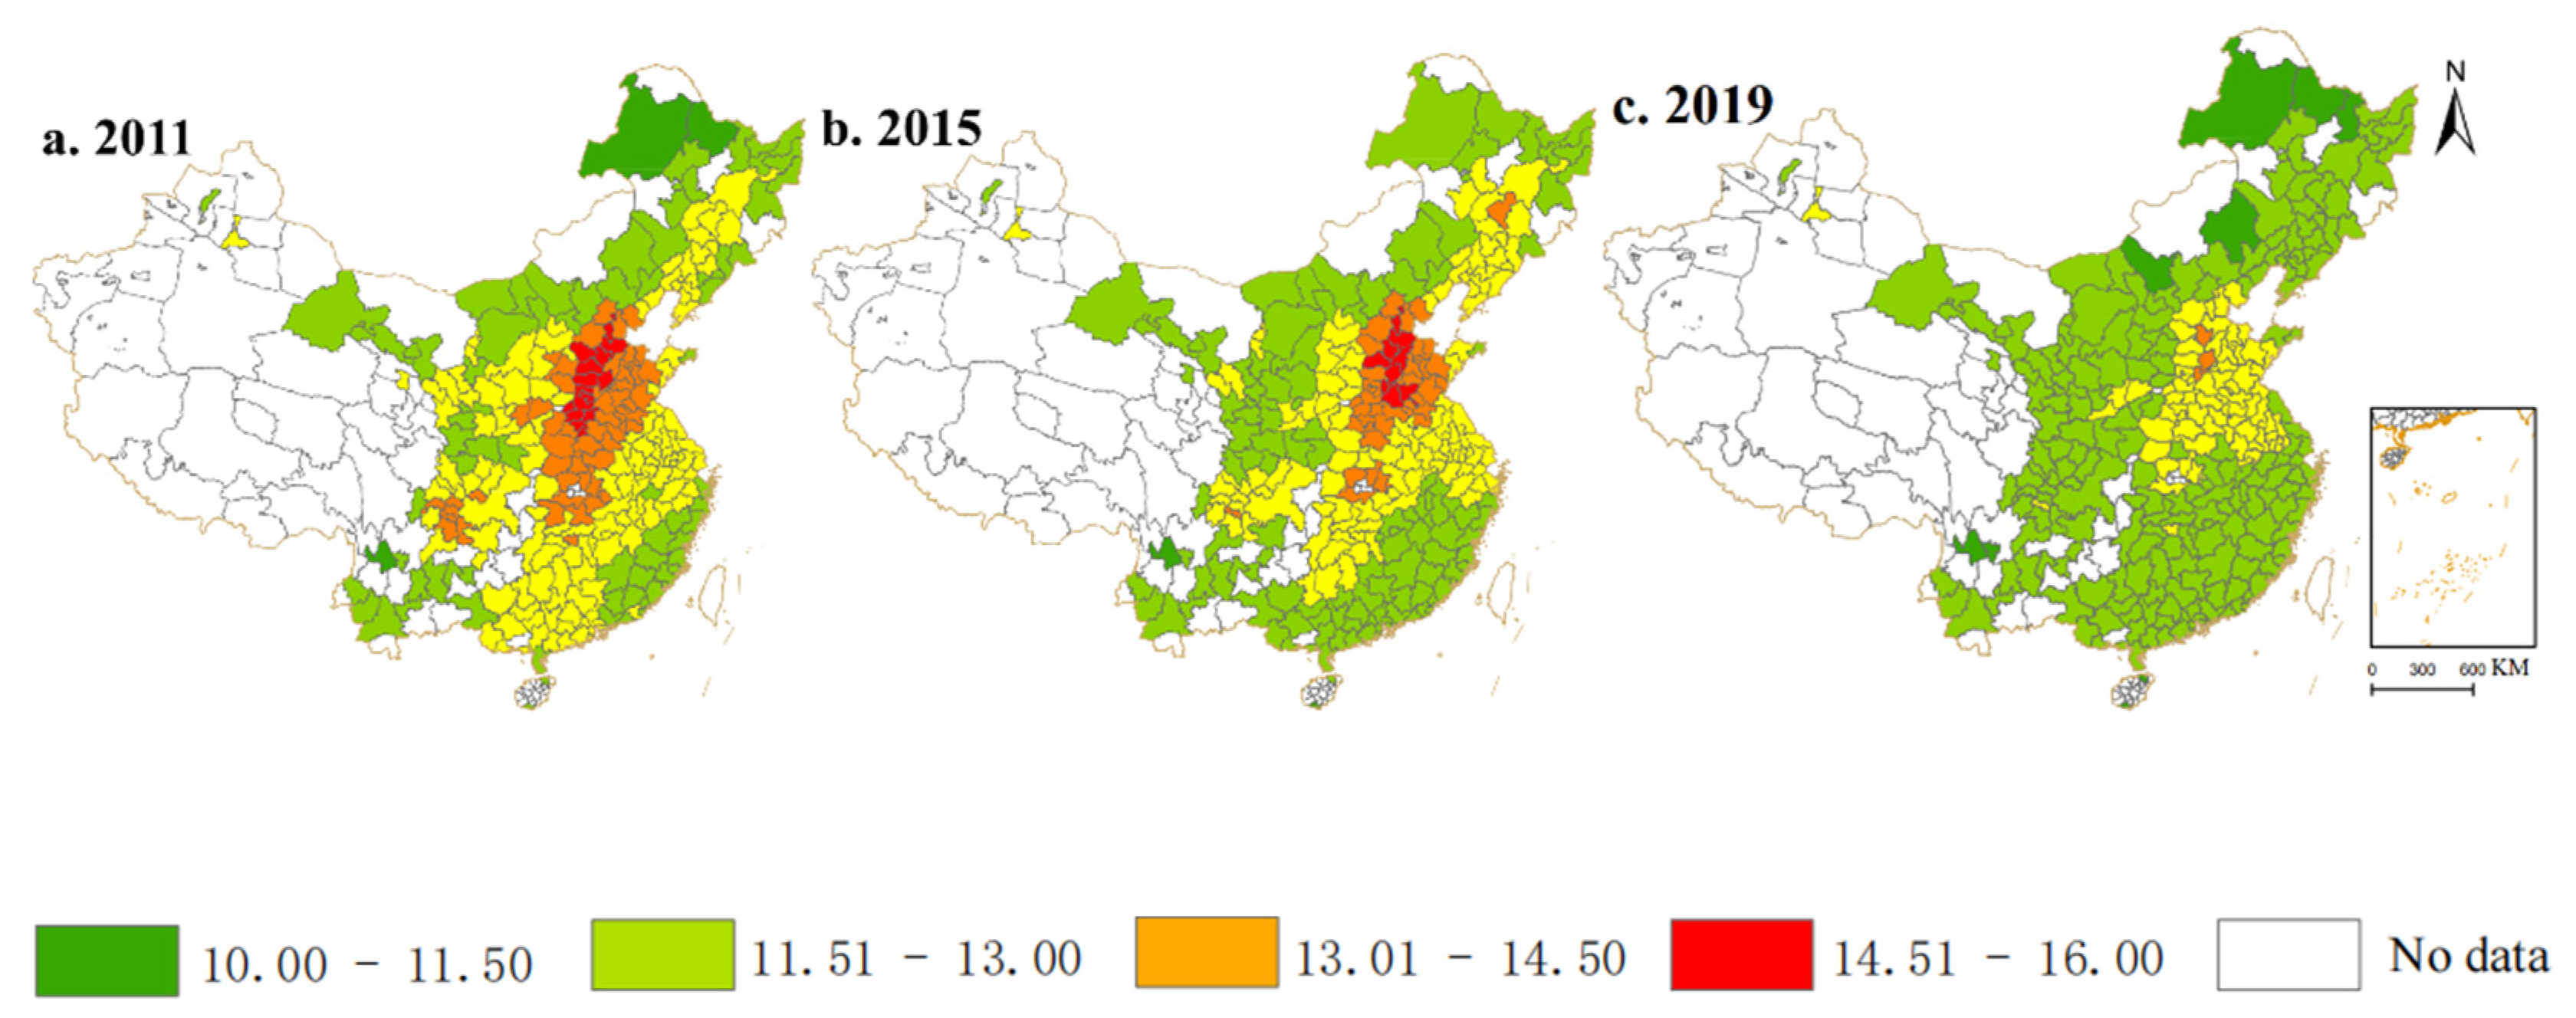
Figure 2 presented the spatial distribution characteristics of PM
2.5 emissions for 283 cities in China for the three years 2011, 2015, and 2019, which were visualized by ArcGIS 10.6 software. The data characteristics of PM
2.5 emissions was divided into five phases. Overall, PM2.5 is consistently higher in the central region and the Beijing-Tianjin-Hebei economic cluster than in other regions. Around 2011, the problem of haze in China threatened the health of the population. At one point, it became one of the most problematic issues in China. Overall, China’s PM2.5 emissions have decreased, indicating that China’s air quality has improved from 2011 to 2019.
5. The Impact of the Digital Economy on PM2.5 Emissions
5.1. Total Effect of the Digital Economy on PM2.5 Emissions
Based on the results of the above analysis, it was shown that digital economy and PM
2.5 emissions have significant spatial correlation, and so ordinary least squares (OLS) analysis is challenging to estimate. To analyze the results reliably and robustly, a spatial Durbin model is used to analyze the impact of the digital economy on PM
2.5 emissions in this paper. The estimation results are shown in
Table 6. City fixed effects and time fixed effects are controlled in the model, as shown in City FE and Time FE in
Table 6, respectively.
In
Table 6, the neighborhood space matrix, the economic distance matrix, and the economic geographical nesting matrix were considered separately. The impact of the digital economy development on PM
2.5 emissions was significantly negative under three types of weight, indicating that digital economy development significantly reduced the level of PM
2.5 emissions in the region. This conclusion was consistent with [
24,
25,
58]. Technological progress in the development of the digital economy has led to industrial upgrading [
14,
16,
21], which in turn has driven energy restructuring and the gradual penetration of big data to promote the effectiveness of resource allocation [
16,
18,
43]. At the same time, economic externalities were generated, leading to an increase in industrial productivity and urban energy utilization, ultimately contributing to the reduction of PM
2.5 emissions.
The comparative analysis revealed differences in the coefficient statistics and significance of the digital economy under different spatial matrices. Even though the digital economy was not statistically significant under the neighborhood weights, it was significantly negative at alpha level of 0.05 under both the economic distance and the economic–geographic weight matrix. The marginal impact of the development of the digital economy on neighborhood PM
2.5 emissions was more significant than the marginal impact on PM
2.5 emissions in the region, which further illustrated the spatial relevance discussed in
Section 4.
In control variables, there were also differences in the significance of the coefficients of several of the variables under different weighting matrices. Under the economic weights and the economic–geographic nested weight matrix, the level of economic development promotes the neighborhood PM2.5 emissions. Green total factor productivity, on the other hand, reduced PM2.5 emissions in the neighborhood.
5.2. Policy Effect of Smart Cities Pilot Policy
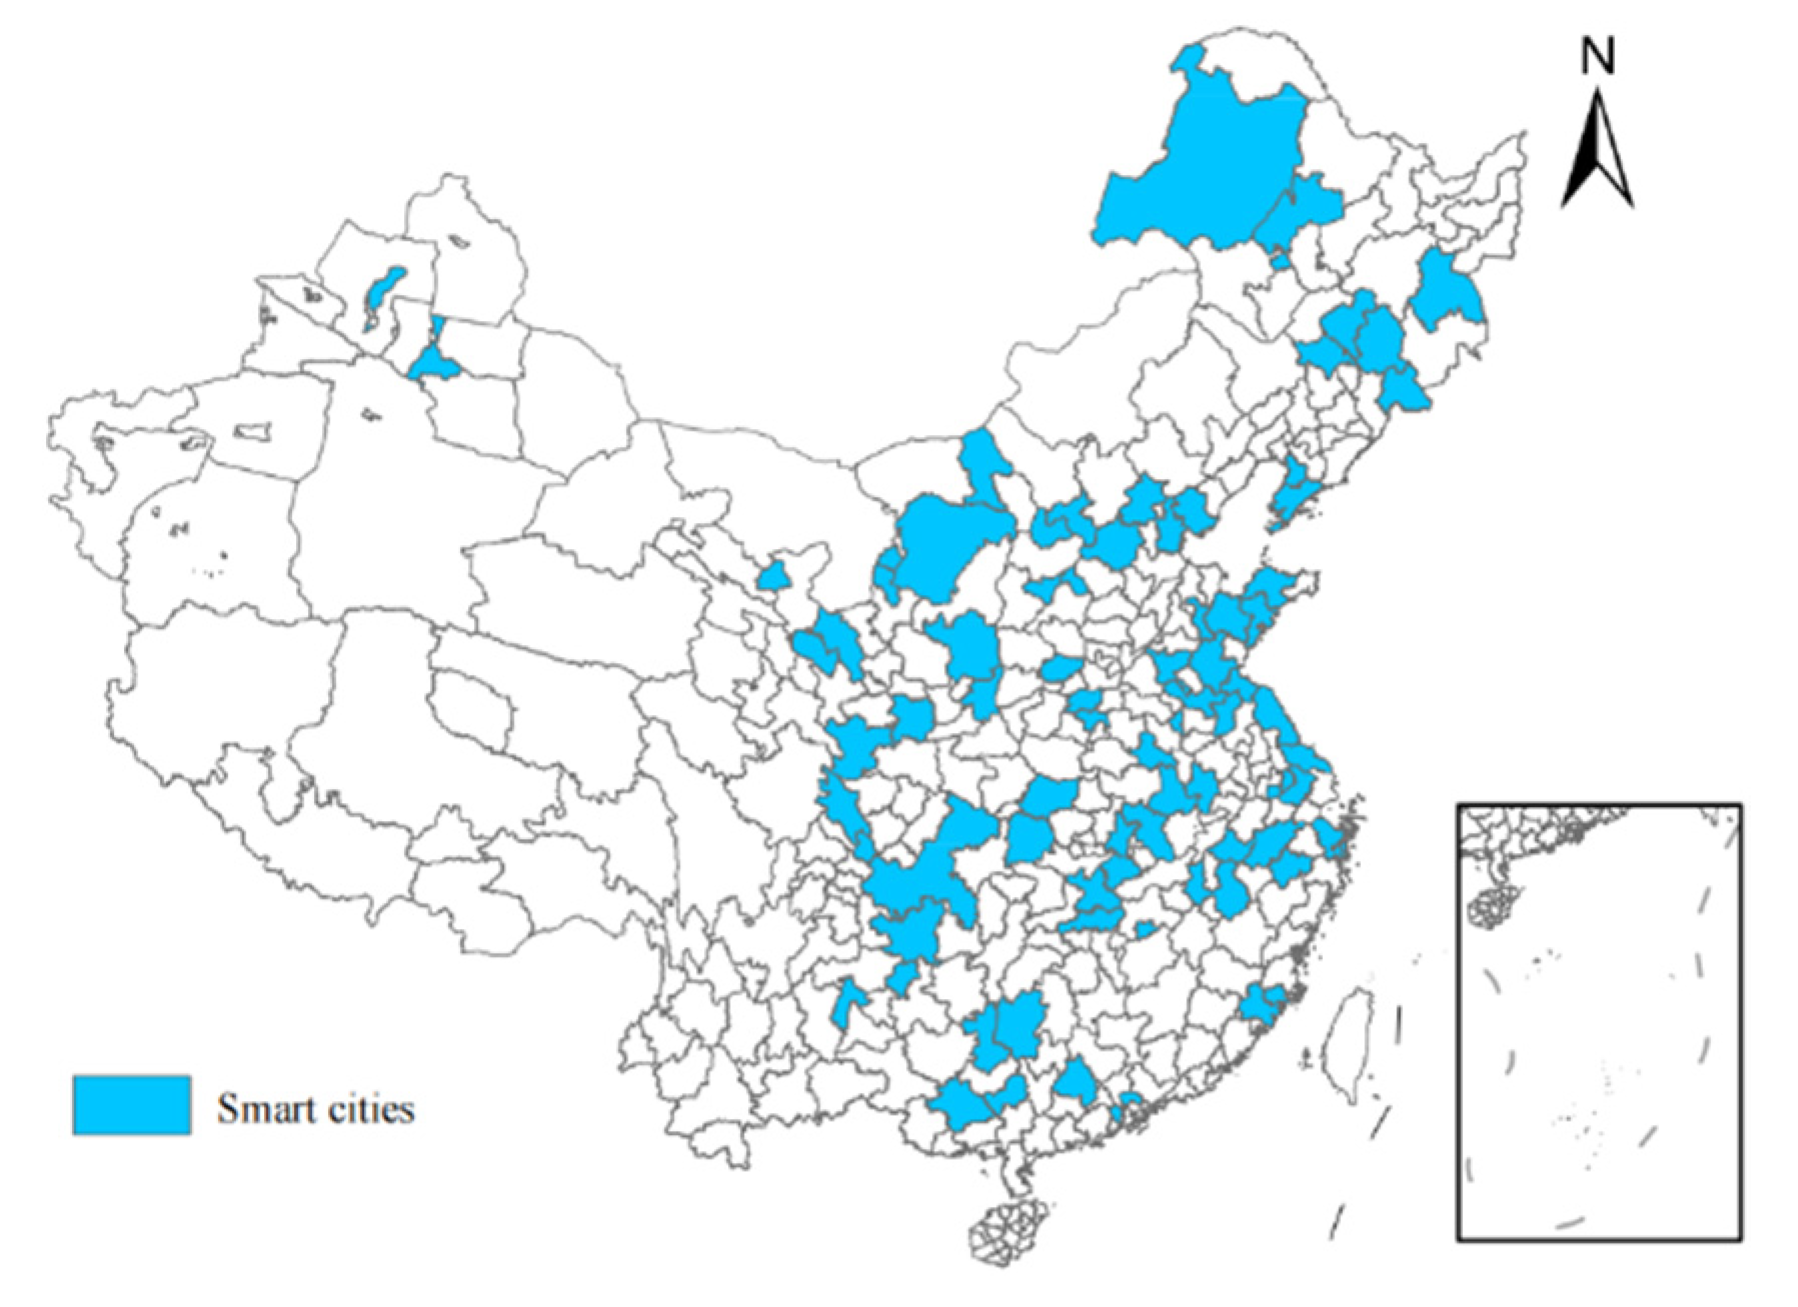
In 2013, the Chinese Ministry of Science and Technology and the National Standardisation Administration of China identified pilot cities for “smart city” technologies and standards. The distribution of pilot cities is shown in
Figure 3. Through the application of new-generation information technologies such as Internet of Things (IOT) infrastructure, cloud computing infrastructure, and tools and processes such as wikis, social networks, Fab Lab, Living Lab, and integrated methods, smart cities achieve comprehensive and open creation through perception, broadband and ubiquitous interconnection, intelligent and integration. Along with the rise of network empires and the convergence of mobile technologies of innovation, the smart city in the knowledge society environment was the advanced form of informational city development after the digital city [
16,
59,
60].
To evaluate the effect of SCP policy, this paper employed a spatial DID approach, and the estimated results are represented in
Table 7. The classical DID model was first used for estimation and the results were shown in the first column. The estimated coefficient obtained for the SCP policy was significantly negative, indicating that smart city construction had reduced urban PM
2.5 emissions to some extent. Further considering the spatial lag term of the SCP policy dummy variable, the coefficient of the
W×Smart showed a significant positive effect. A possible reason was that SCP policy promoted low carbon, digital and sustainable high-quality development, causing a portion of high energy consumption and high emission industries to shift to neighboring cities [
16]. Comparing the magnitude of the coefficients shows that the coefficients of
W×Smart were the largest under the economic distance weighting matrix, indicating that this industrial shift prefers cities with similar levels of development.
5.3. Placebo Test
There may be some unobservable factors in the impact of SCP policy on PM
2.5 emissions. This bias in estimation due to unobservable factors needs to be eliminated, and this study refers to Xie et al. (2021) and Guo et al. (2022) for a placebo trial using a random sampling method [
16,
41]. Specifically, all cities were divided into a control group based on the actual SCP policy. An identical number of cities in the sample were randomly selected as the treatment group. These samples were finally replicated an estimated 1000 times.
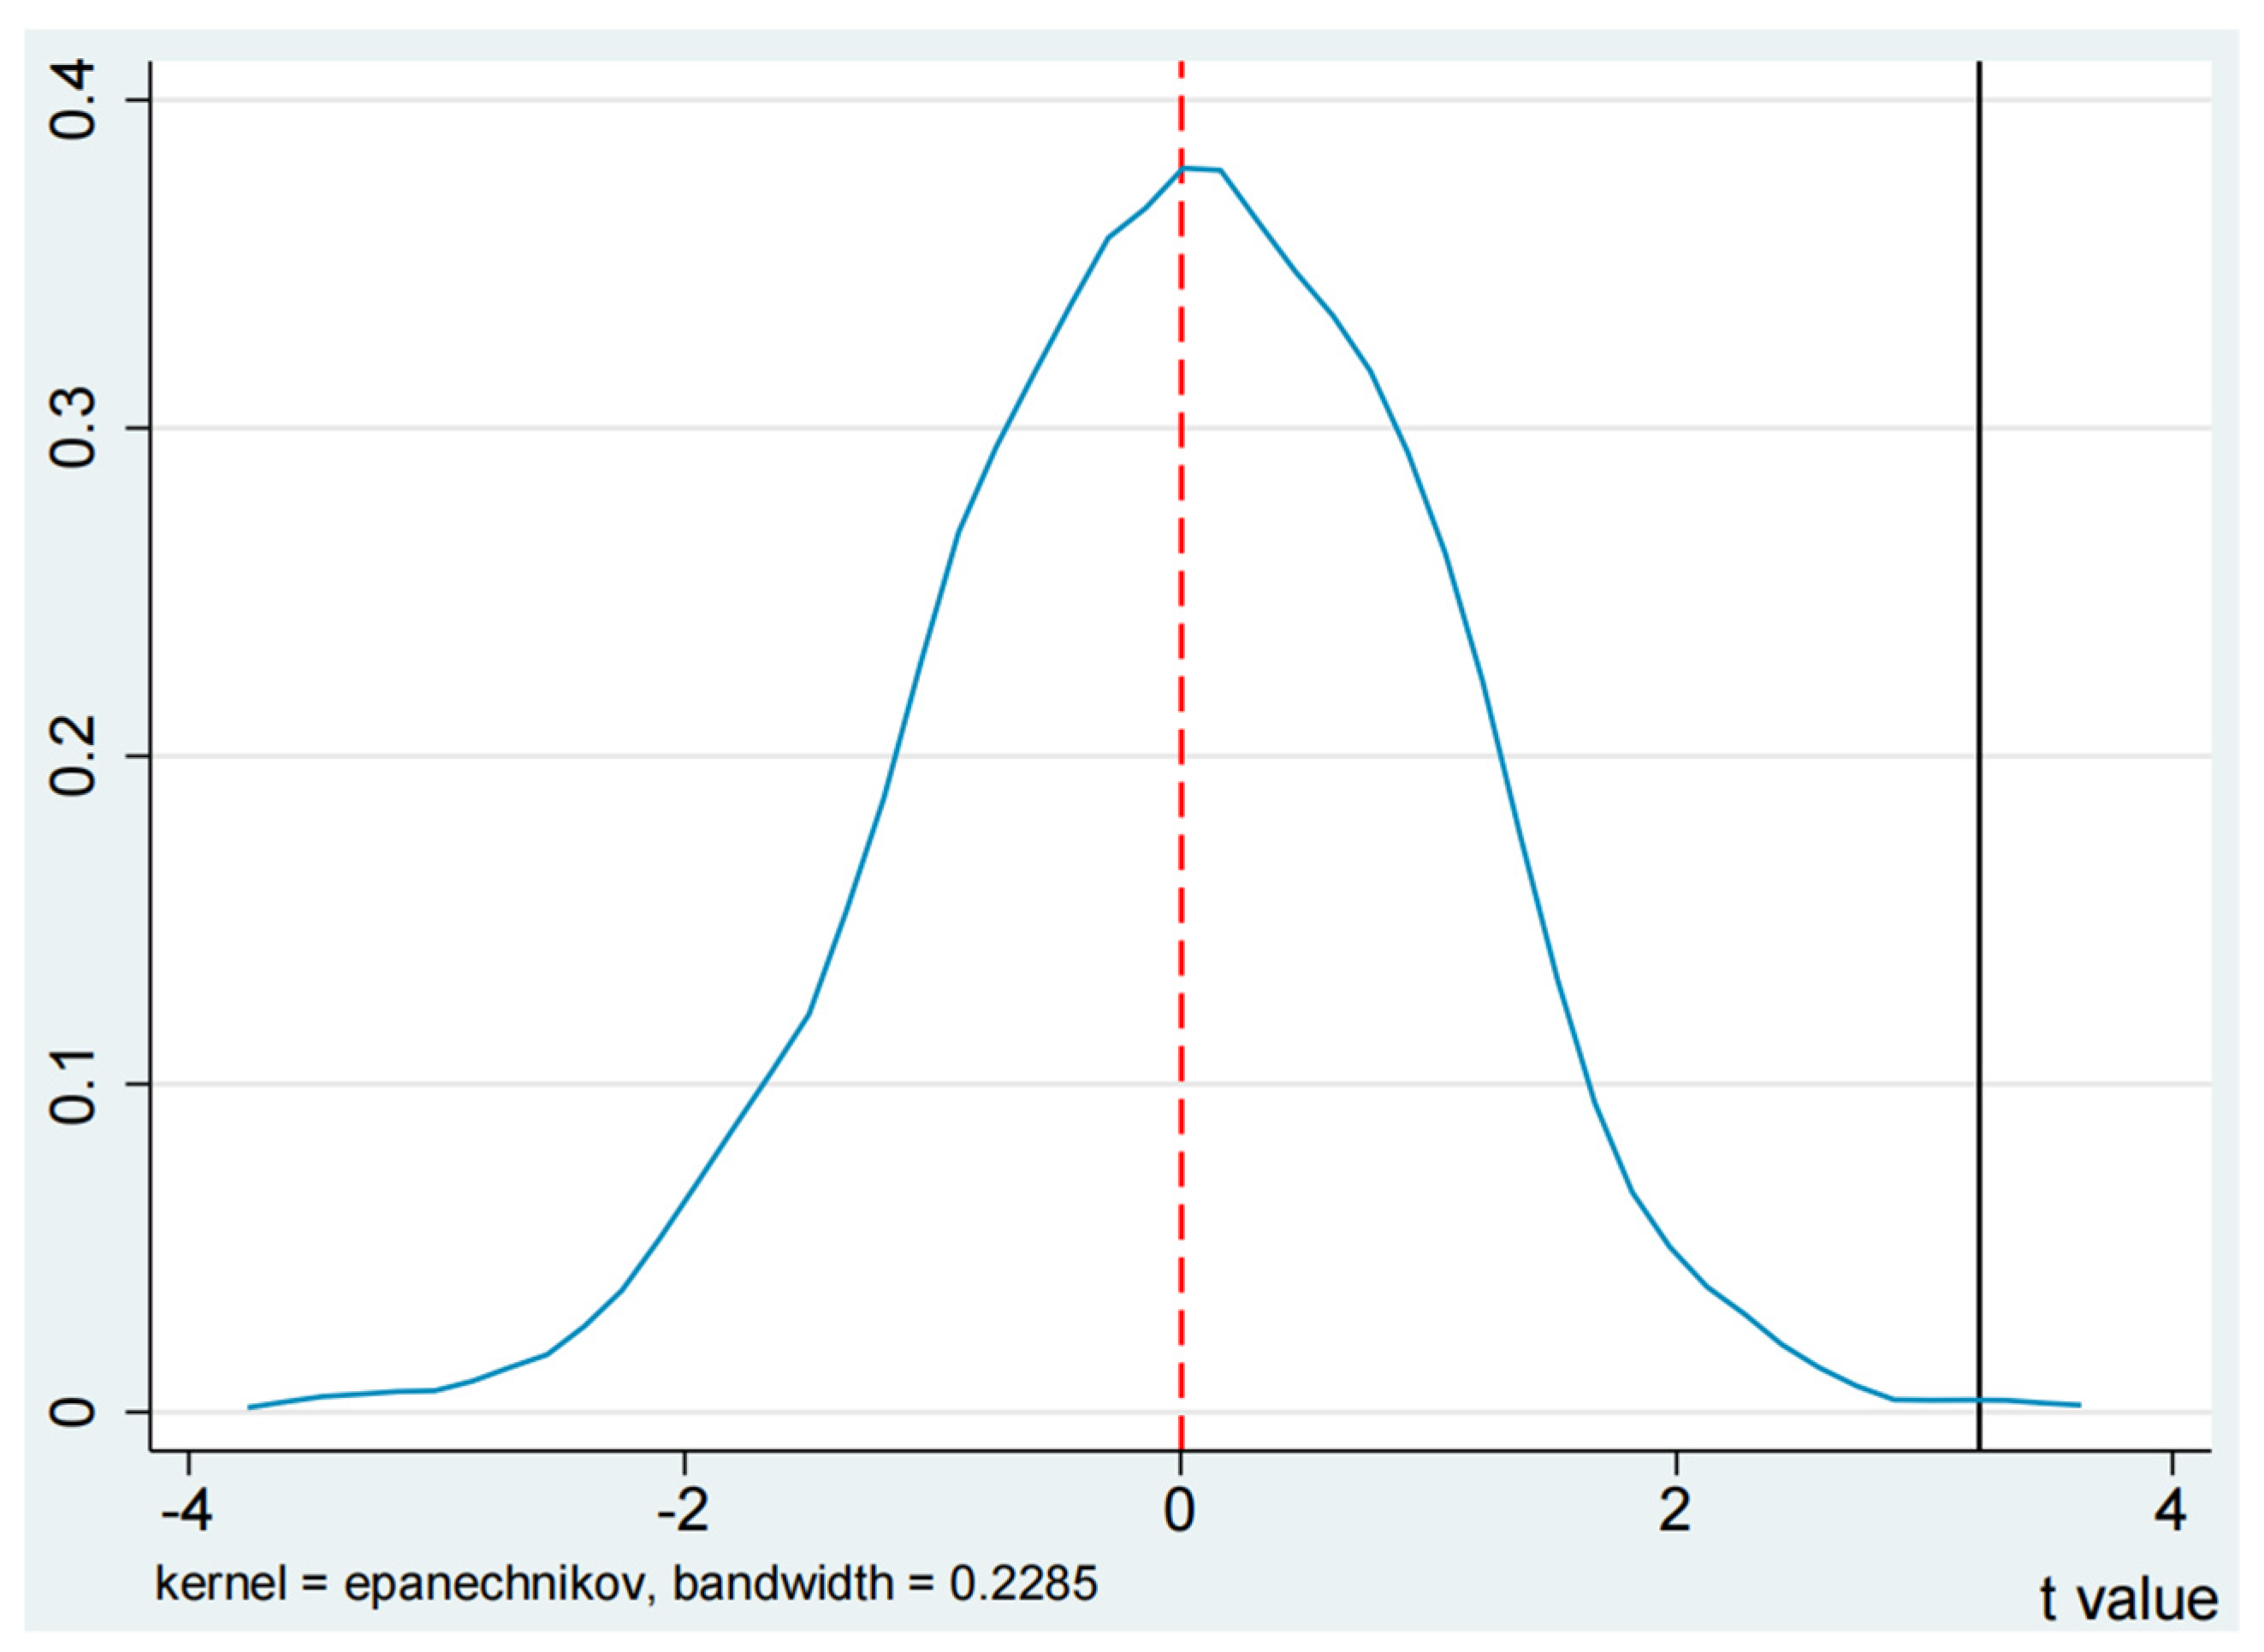
Kernel density plots of the t-statistic and estimated coefficients are reported separately in
Figure 4. Based on results from
Figure 4, the t-statistics and estimated coefficients of these 1000 regressions follow a normal distribution and the peak is around 0. Implying that the SCP policy has no significant effect on the randomly selected experimental group, further demonstrating the robustness of the study findings.
5.4. Exclude the Influence of Other Policies
During the sample period of this paper, the Chinese government also introduced some other policies. In October 2014, China’s Ministry of Industry and Information Technology announced the list of pilot cities for Broadband China (BC) to speed up information transfer and improve the efficiency of social and economical operations. In December 2015, China’s Ministry of Industry and Information Technology (MIIT) announced the inclusion of 11 cities in the pilot list of regional industrial green transformation to promote the green and efficient development of industry. In 2017, the national development and reform commission (NDRC) issued the Notice on the Piloting of Low-carbon (LC) Provinces, Regions, and Cities to promote the development of low-carbon industries, build low-carbon cities, and advocate low-carbon living. These policies might also impact urban PM2.5 emissions.
To exclude the influence of these policies, this section controlled for them and presented the estimation results in
Table 8. Columns (1)–(3) report the policy effect of BC, MITT, and LC pilot policies separately. The estimation results indicated that these three policies have no significant impact on PM
2.5. Column (4) considered these three policies and the wise city pilot policy. The results show that the effects of digital economy development on urban PM
2.5 concentration is still significantly negative. The coefficient of the smart city pilot policy is negative. However, the estimated coefficients of these three policies are not significant.
6. Spatial Heterogeneity Analysis
Based on the uneven regional development of China, this section further analyzed the spatial variability of the impact of the digital economy on urban PM
2.5 emissions. It was carried out in terms of both the geographical area (The division of the eastern, middle and western was mainly based on the criteria of the Nation Statistics Office.
http://www.stats.gov.cn/xxgk/sjfb/zxfb2020/202207/t20220715_1886447.html (accessed on 25 August 2022)), and whether it was an urban agglomeration (China’s urban agglomerations include the Beijing-Tianjin-Hebei urban agglomeration, the Yangtze River midstream urban agglomeration, the Ha-Chang urban agglomeration, the Chengdu-Chongqing urban agglomeration, the Yangtze River Delta urban agglomeration, the Central Plains urban agglomeration, the Beibu Gulf urban agglomeration, the Guanzhong Plain urban agglomeration, the Hubao-Egyu urban agglomeration, the Lanzhou-West urban agglomeration and the Guangdong-Hong Kong-Macao Greater Bay Area). As the differences between regions include economic distance differences and geographical differences, they were calculated in the subsequent analysis based on an economic geographical nested matrix. The estimated results are shown in
Table 9.
First, the impact of the digital economy on urban PM
2.5 emissions is estimated for each of the three regions: eastern, middle, and western (The eastern region includes Beijing, Tianjin Hebei, Shanghai, Jiangsu, Zhejiang, Fujian, Guangdong, Shandong, Hainan, Liaoning, Jilin, and Heilongjiang. The middle region includes Shanxi, Anhui, Jiangxi, Henan, Hubei, and Hunan. The western region includes Guangxi, Chongqing, Sichuan, Yunnan, Tibet, Shaanxi, Gansu, Qinghai, Ningxia, and Xinjiang). In the eastern region, the development of the digital economy had significantly curbed PM
2.5 emissions, as well as in neighboring areas. Each unit increase in the digital economy reduced PM
2.5 emissions in the area by 7.25%, while reducing PM
2.5 emissions in neighboring regions by 15.27%, all at an alpha level of 0.01. Since China’s reform and opening up, the eastern region had experienced rapid economic development and was at the leading edge of the country. The eastern region has more apparent advantages in infrastructure and digital industry development. In addition, the east area had gathered many innovative talents and capital, relying on various advantages to play an empowering role in the digital economy. The ultimate expression is green and emissions reduction [
14,
15]. In intermediate and west regions, the digital economy did not pass a significance test, probably because the level of development of the digital economy in the middle and west was still in its infancy. The increased resource consumption of the digital economy development and the effect of digital empowerment offset each other, ultimately resulting in a non-significant effect of the digital economy on PM
2.5 emissions [
14].
Second, from a city cluster perspective, the development of the digital economy had a mitigating effect on urban PM2.5 emissions within city clusters, and reduced neighboring cities through spillover effects. Especially, each unit increase in the digital economy of a city cluster reduced PM2.5 emissions by 4.02% in the region and by 6.17% in neighboring cities, both at alpha level of 0.05. It was mainly because the development of urban agglomerations showed strong synergies, and there were spillover effects between cities. For cities in non-urban clusters, the digital economy had no significant impact on PM2.5 emissions, but reduced PM2.5 emissions in neighboring cities.
In summary, the spatial heterogeneity analysis suggested that the environmental dividends of the digital economy in eastern and urban agglomerations are more fully realized in the form of reduced PM2.5 emissions in the region and neighboring areas. The cities in the central and west and non-urban clusters did not pass the significance test. The possible reason for this is that the level of digital economy development is still early in the central and west and non-urban cluster cities. The increase in resource consumption caused by the initial development of the digital economy is offset by the boost generated by digital empowerment.
7. Conclusions
To investigate the spatial effect of digital economy on PM2.5 emissions in China, this paper establishes a spatial Durbin model by using prefecture-level cities from 2011 to 2019. We further discuss the policy effect and spillover effect of smart city pilot policy. In addition, we analyze the heterogeneous results between the digital economy and PM2.5 emissions in two aspects. Accordingly, we highlight the following conclusions:
First, urban digital economy development is significantly negatively correlated with PM
2.5 emissions. Specifically, a 1% increase in the digital economy index will mitigate PM
2.5 emissions by an average of 2.44%. The spatial spillover effect results indicate that the adverse spillover effects of the digital economy on neighboring PM
2.5 emissions are more substantial. A 1% increase in the digital economy index will mitigate neighboring PM
2.5 emissions by an average of 4.99%. Possible reasons for this are that the development of the digital economy promotes technological efficiency and reduces PM
2.5 emissions in the region and neighboring regions through technological spillover [
61]. That is to say, digital economy development significantly facilitates the process of green economic growth.
Second, considering the policy effect of the smart city pilot policy, this paper uses classical DID and spatial DID models to explore the impact of smart city construction on PM2.5 emissions. The empirical results persisted that SCP policy significantly reduces PM2.5 emissions of pilot cities than non-pilot cities, and the spatial DID results show that SCP policy significantly increases PM2.5 emissions of the neighbor cities of pilot cities. One possible reason is that the construction of smart cities has led to the transfer of highly polluting and emitting industries from the pilot cities to neighboring cities, thereby increasing PM2.5 emissions from neighboring cities. In other words, smart city construction reduces PM2.5 emissions in the pilot cities but increases PM2.5 emissions in neighboring cities. To achieve green and sustainable development, the scope of smart cities should be promoted, thus improving environmental quality.
Third, because of the uneven development of China’s regional economies and the differences in the development of urban agglomerations, the differences are analyzed in these two aspects. In the eastern region, a 1% increase in the digital economy index will mitigate PM2.5 emissions by an average of 7.25% and 15.27% in region and neighboring cities, respectively. For cities in urban agglomerations, a 1% increase in the digital economy index will mitigate PM2.5 emissions by an average of 4.02% and 6.17 in region and neighboring cities, respectively. In other words, the digital economy spillover effect from eastern and urban agglomeration should be given full play to drive the development of the digital economy in middle and western regions and non-urban agglomerations, thereby promoting green and sustainable economic development.
According to the above conclusions, we put forward the following insights. First, the process of smart city construction, the development of the digital economy is conducive to reducing PM2.5 emissions, thus promoting green economic development. Second, the spatial spillover effects of the digital economy from eastern cities and urban agglomerations are still insufficient to affect central and western cities and non-urban agglomerations, illustrating the clear imbalance that characterizes the development of China’s digital economy. In a word, the development of digital economy in urban regions still has great potential for the digital economy in China.
Author Contributions
Material preparation, data collection and analysis were performed by J.T. The first draft of manuscript was written by L.C. and all authors commented on previous versions of the manuscript. All authors have read and agreed to the published version of the manuscript.
Funding
This work was supported by the Nation Social Science Foundation of China [grant numbers 20BJY198], and Major Projects of the National Social Science Foundation [grant number 18ZDAO67], General Scientific Research Project of Education Department of Zhejiang Province (Humanities and Social Sciences) [Y202248789].
Informed Consent Statement
Informed consent was obtained from all subjects involved in the study.
Data Availability Statement
It can be obtained from the author on request.
Conflicts of Interest
The authors declare no conflict of interest.
References
- Zhang, X. Broadband and economic growth in China: An empirical study during the COVID-19 pandemic period. Telemat. Inform. 2020, 58, 101533. [Google Scholar] [CrossRef]
- G20 Research Group. G20 Digital Economy Development And Cooperation Initiative; G20 Research Group at the University of Toronto: Toronto, ON, Canada, 2016. [Google Scholar]
- Worobey, M.; Levy, J.I.; Serrano, L.M.; Crits-Christoph, A.; Pekar, J.E.; Goldstein, S.A.; Rasmussen, A.L.; Kraemer, M.U.G.; Newman, C.; Koopmans, M.P.G.; et al. The Huanan Seafood Wholesale Market in Wuhan was the early epicenter of the COVID-19 pandemic. Science 2022, 377, 951–959. [Google Scholar] [CrossRef] [PubMed]
- Ali, S.M.; Malik, F.; Anjum, M.S.; Siddiqui, G.F.; Anwar, M.N.; Lam, S.S.; Nizami, A.-S.; Khokhar, M.F. Exploring the linkage between PM2.5 levels and COVID-19 spread and its implications for socio-economic circles. Environ. Res. 2020, 193, 110421. [Google Scholar] [CrossRef] [PubMed]
- Dong, Q.; Lin, Y.; Huang, J.; Chen, Z. Has urbanization accelerated PM2.5 emissions? An empirical analysis with cross-country data. China Econ. Rev. 2019, 59, 101381. [Google Scholar] [CrossRef]
- Yun, G.; Zhao, S. The imprint of urbanization on PM2.5 concentrations in China: The urban-rural gradient study. Sustain. Cities Soc. 2022, 86, 104103. [Google Scholar] [CrossRef]
- Xiao, B.; Niu, D.; Wu, H. Exploring the impact of determining factors behind CO2 emissions in China: A CGE appraisal. Sci. Total Environ. 2017, 581-582, 559–572. [Google Scholar] [CrossRef]
- Tapscott, D. The Digital Economy: Promise and Peril in the Age of Networked Intelligence; Mc Graw-Hill: New York, NY, USA, 1996; pp. 43–125. [Google Scholar]
- Rouse, M. Digital Economy [DB/OL]; Techtarget: Newton, MA, USA, 2016; Available online: http://techtarget.com/searchcio/definition/digital-economy (accessed on 10 July 2022).
- Dahlman, C.; Mealy, S.; Wermelinger, M. Harnessing the Digital Economy for Developing Countries; OECD Development Centre Working Papers, No. 334; OECD Publishing: Paris, France, 2016. [Google Scholar] [CrossRef]
- Li, L.; Zheng, Y.; Zheng, S.; Ke, H. The new smart city programme: Evaluating the effect of the internet of energy on air quality in China. Sci. Total Environ. 2020, 714, 136380. [Google Scholar] [CrossRef]
- Mossberger, K.; LaCombe, S.; Tolbert, C.J. A new measure of digital economic activity and its impact on local opportunity. Telecommun. Policy 2022, 46, 102231. [Google Scholar] [CrossRef]
- Luo, J.; Wang, Z.; Wu, M. Effect of place-based policies on the digital economy: Evidence from the Smart City Program in China. J. Asian Econ. 2021, 77, 101402. [Google Scholar] [CrossRef]
- Zhang, J.; Lyu, Y.; Li, Y.; Geng, Y. Digital economy: An innovation driving factor for low-carbon development. Environ. Impact Assess. Rev. 2022, 96, 106821. [Google Scholar] [CrossRef]
- Ma, Q.; Tariq, M.; Mahmood, H.; Khan, Z. The nexus between digital economy and carbon dioxide emissions in China: The moderating role of investments in research and development. Technol. Soc. 2022, 68, 101910. [Google Scholar] [CrossRef]
- Guo, Q.; Wang, Y.; Dong, X. Effects of smart city construction on energy saving and CO2 emission reduction: Evidence from China. Appl. Energy 2022, 313, 118879. [Google Scholar] [CrossRef]
- Caputo, A.; Marzi, G.; Pellegrini, M.M. The Internet of Things in Manufacturing Innovation Processes: Development and Application of a Conceptual Framework. Bus. Process Manag. J. 2016, 22, 383–402. [Google Scholar] [CrossRef]
- Li, Y.; Yang, X.; Ran, Q.; Wu, H.; Irfan, M.; Ahmad, M. Energy Structure, Digital Economy, and Carbon Emissions: Evidence from China. Environ. Sci. Pollut. Res. 2021, 28, 64606–64629. [Google Scholar] [CrossRef] [PubMed]
- Okano-Heijmans, M.; Vosse, W. Promoting open and inclusive connectivity: The case for digital development cooperation. Res. Glob. 2021, 3, 100061. [Google Scholar] [CrossRef]
- Han, J.; Guo, J.-E.; Cai, X.; Lv, C.; Lev, B. An analysis on strategy evolution of research & development in cooperative innovation network of new energy vehicle within policy transition period. Omega 2022, 112, 102686. [Google Scholar] [CrossRef]
- Ndubuisi, G.; Otioma, C.; Owusu, S.; Tetteh, G.K. ICTs quality and technical efficiency: An empirical analysis. Telecommun. Policy 2022, 46, 102439. [Google Scholar] [CrossRef]
- De’, R.; Pandey, N.; Pal, A. Impact of digital surge during Covid-19 pandemic: A viewpoint on research and practice. Int. J. Inf. Manag. 2020, 55, 102171. [Google Scholar] [CrossRef]
- Battisti, E.; Alfiero, S.; Leonidou, E. Remote working and digital transformation during the COVID-19 pandemic: Economic–financial impacts and psychological drivers for employees. J. Bus. Res. 2022, 150, 38–50. [Google Scholar] [CrossRef]
- Luo, K.; Liu, Y.; Chen, P.-F.; Zeng, M. Assessing the impact of digital economy on green development efficiency in the Yangtze River Economic Belt. Energy Econ. 2022, 112, 106127. [Google Scholar] [CrossRef]
- Litvinenko, V.S. Digital Economy as a Factor in the Technological Development of the Mineral Sector. Nat. Resour. Res. 2020, 29, 1521–1541. [Google Scholar] [CrossRef]
- Ahl, A.; Yarime, M.; Goto, M.; Chopra, S.S.; Kumar, N.M.; Tanaka, K.; Sagawa, D. Exploring blockchain for the energy transition: Opportunities and challenges based on a case study in Japan. Renew. Sustain. Energy Rev. 2019, 117, 109488. [Google Scholar] [CrossRef]
- Park, C.; Heo, W. Review of the changing electricity industry value chain in the ICT convergence era. J. Clean. Prod. 2020, 258, 120743. [Google Scholar] [CrossRef]
- Zhao, J.; Ji, G.; Yue, Y.; Lai, Z.; Chen, Y.; Yang, D.; Yang, X.; Wang, Z. Spatio-temporal dynamics of urban residential CO2 emissions and their driving forces in China using the integrated two nighttime light datasets. Appl. Energy 2018, 235, 612–624. [Google Scholar] [CrossRef]
- Zhang, M.; Liu, X.; Ding, Y.; Wang, W. How does environmental regulation affect haze pollution governance?—An empirical test based on Chinese provincial panel data. Sci. Total Environ. 2019, 695, 133905. [Google Scholar] [CrossRef]
- Young, R.F.; Lieberknecht, K. From smart cities to wise cities: Ecological wisdom as a basis for sustainable urban development. J. Environ. Plan. Manag. 2019, 62, 1675–1692. [Google Scholar] [CrossRef]
- Gao, K.; Yuan, Y. Is the sky of smart city bluer? Evidence from satellite monitoring data. J. Environ. Manag. 2022, 317, 115483. [Google Scholar] [CrossRef]
- Pick, J.B.; Sarkar, A.; Johnson, J. United States digital divide: State level analysis of spatial clustering and multivariate determinants of ICT utilization. Socio-Econ. Plan. Sci. 2015, 49, 16–32. [Google Scholar] [CrossRef]
- Yao, T.; Huang, Z.; Zhao, W. Are smart cities more ecologically efficient? Evidence from China. Sustain. Cities Soc. 2020, 60, 102008. [Google Scholar] [CrossRef]
- Moran, P. Notes on Continuous Stochastic Phenomena. Biometrika 1950, 37, 17–23. Available online: http://www.jstor.org/Stable/2332142 (accessed on 16 July 2022). [CrossRef]
- Wang, X.; Wang, X.; Ren, X.; Wen, F. Can digital financial inclusion affect CO2 emissions of China at the prefecture level? Evidence from a spatial econometric approach. Energy Econ. 2022, 109, 105966. [Google Scholar] [CrossRef]
- Zhou, Q.; Zhang, X.; Shao, Q.; Wang, X. The non-linear effect of environmental regulation on haze pollution: Empirical evidence for 277 Chinese cities during 2002–2010. J. Environ. Manag. 2019, 248, 109274. [Google Scholar] [CrossRef] [PubMed]
- Agovino, M.; Crociata, A.; Sacco, P.L. Proximity effects in obesity rates in the US: A Spatial Markov Chains approach. Soc. Sci. Med. 2018, 220, 301–311. [Google Scholar] [CrossRef] [PubMed]
- Shepero, M.; Munkhammar, J. Spatial Markov chain model for electric vehicle charging in cities using geographical information system (GIS) data. Appl. Energy 2018, 231, 1089–1099. [Google Scholar] [CrossRef]
- Ghalehteimouri, K.J.; Shamsoddini, A.; Mousavi, M.N.; Ros, F.B.C.; Khedmatzadeh, A. Predicting spatial and decadal of land use and land cover change using integrated cellular automata Markov chain model based scenarios (2019–2049) Zarriné-Rūd River Basin in Iran. Environ. Chall. 2021, 6, 100399. [Google Scholar] [CrossRef]
- Zhou, Q.; Song, Y.; Wan, N.; Zhang, X. Non-linear effects of environmental regulation and innovation—Spatial interaction evidence from the Yangtze River Delta in China. Environ. Sci. Policy 2020, 114, 263–274. [Google Scholar] [CrossRef]
- Xie, Y.; Wu, D.; Zhu, S. Can new energy vehicles subsidy curb the urban air pollution? Empirical evidence from pilot cities in China. Sci. Total Environ. 2020, 754, 142232. [Google Scholar] [CrossRef]
- Kovacikova, M.; Janoskova, P.; Kovacikova, K. The Impact of Emissions on the Environment within the Digital Economy. Transp. Res. Procedia 2021, 55, 1090–1097. [Google Scholar] [CrossRef]
- Shahbaz, M.; Wang, J.; Dong, K.; Zhao, J. The impact of digital economy on energy transition across the globe: The mediating role of government governance. Renew. Sustain. Energy Rev. 2022, 166, 112620. [Google Scholar] [CrossRef]
- Zhang, W.; Liu, X.; Wang, D.; Zhou, J. Digital economy and carbon emission performance: Evidence at China’s city level. Energy Policy 2022, 165, 112927. [Google Scholar] [CrossRef]
- Sarkodie, S.A.; Strezov, V. Effect of foreign direct investments, economic development and energy consumption on greenhouse gas emissions in developing countries. Sci. Total Environ. 2019, 646, 862–871. [Google Scholar] [CrossRef] [PubMed]
- Jiang, W.; Cole, M.; Sun, J.; Wang, S. Innovation, carbon emissions and the pollution haven hypothesis: Climate capitalism and global re-interpretations. J. Environ. Manag. 2022, 307, 114465. [Google Scholar] [CrossRef] [PubMed]
- Wang, F.; Zheng, P.; Dai, J.; Wang, H.; Wang, R. Fault tree analysis of the causes of urban smog events associated with vehicle exhaust emissions: A case study in Jinan, China. Sci. Total Environ. 2019, 668, 245–253. [Google Scholar] [CrossRef]
- Chen, G.; Hu, Y.; Zhang, R.; Yin, Z.; Zhang, Y.; Ma, K. Evolution of south-north transport and urbanization effects on PM2.5 distribution with increased pollution levels in Beijing. Sustain. Cities Soc. 2021, 72, 103060. [Google Scholar] [CrossRef]
- Zhu, Q.; Peng, X. The impacts of population change on carbon emissions in China during 1978–2008. Environ. Impact Assess. Rev. 2012, 36, 1–8. [Google Scholar] [CrossRef]
- Li, J.; Huang, X.; Chuai, X.; Yang, H. The impact of land urbanization on carbon dioxide emissions in the Yangtze River Delta, China: A multiscale perspective. Cities 2021, 116, 103275. [Google Scholar] [CrossRef]
- Gholipour, H.F.; Arjomandi, A.; Yam, S. Green property finance and CO2 emissions in the building industry. Glob. Finance J. 2022, 51, 100696. [Google Scholar] [CrossRef]
- Debrah, C.; Chan, A.P.C.; Darko, A. Green finance gap in green buildings: A scoping review and future research needs. Build. Environ. 2022, 207, 108443. [Google Scholar] [CrossRef]
- Li, Z.-Z.; Li, R.Y.M.; Malik, M.Y.; Murshed, M.; Khan, Z.; Umar, M. Determinants of Carbon Emission in China: How Good is Green Investment? Sustain. Prod. Consum. 2021, 27, 392–401. [Google Scholar] [CrossRef]
- Sun, H.; Chen, F. The impact of green finance on China’s regional energy consumption structure based on system GMM. Resour. Policy 2022, 76, 102588. [Google Scholar] [CrossRef]
- Yin, X.; Xu, Z. An empirical analysis of the coupling and coordinative development of China’s green finance and economic growth. Resour. Policy 2022, 75, 102476. [Google Scholar] [CrossRef]
- Wang, Z.; Jia, X. Analysis of energy consumption structure on CO2 emission and economic sustainable growth. Energy Rep. 2022, 8, 1667–1679. [Google Scholar] [CrossRef]
- Liu, M.; Huang, Y.; Ma, Z.; Jin, Z.; Liu, X.; Wang, H.; Liu, Y.; Wang, J.; Jantunen, M.; Bi, J.; et al. Spatial and temporal trends in the mortality burden of air pollution in China: 2004–2012. Environ. Int. 2017, 98, 75–81. [Google Scholar] [CrossRef]
- Kristoffersen, E.; Blomsma, F.; Mikalef, P.; Li, J. The smart circular economy: A digital-enabled circular strategies framework for manufacturing companies. J. Bus. Res. 2020, 120, 241–261. [Google Scholar] [CrossRef]
- Mak, H.W.L.; Lam, Y.F. Comparative assessments and insights of data openness of 50 smart cities in air quality aspects. Sustain. Cities Soc. 2021, 69, 102868. [Google Scholar] [CrossRef]
- Cui, H.-Y.; Cao, Y.-Q. Do smart cities have lower particulate matter 2.5 (PM2.5)? Evidence from China. Sustain. Cities Soc. 2022, 86, 104082. [Google Scholar] [CrossRef]
- Zhai, X.; An, Y. The relationship between technological innovation and green transformation efficiency in China: An empirical analysis using spatial panel data. Technol. Soc. 2021, 64, 101498. [Google Scholar] [CrossRef]
| Publisher’s Note: MDPI stays neutral with regard to jurisdictional claims in published maps and institutional affiliations. |
© 2022 by the authors. Licensee MDPI, Basel, Switzerland. This article is an open access article distributed under the terms and conditions of the Creative Commons Attribution (CC BY) license (https://creativecommons.org/licenses/by/4.0/).


