1. Introduction
Since the reform and opening up, with the rapid economic and social development, rural Chinese residents have bid farewell to the past model of a single-food diet and to subsistence-level self-sufficiency and are constantly shifting towards a market-oriented model of consuming diverse, nutritious, healthy foods. In recent years, the dietary diversity of rural Chinese residents has improved significantly, and the demand for fruits, vegetables, meat, poultry, fish, eggs, and milk has continued to increase. Farmers’ intake of energy, protein, and fat is increasing, and the sources of that energy, protein, and fat are also changing from plant-based foods to both animal- and plant-based foods. The traditional practice of providing a self-sufficient food supply is also increasingly shifting toward obtaining commercialized food through market-based channels in rural China. With the development of the market and the increment in income, the consumption of self-sufficient foods, such as grains, tends to decrease, while the consumption of high-protein foods that are sourced from market, such as meat and aquatic products, begins to rise [
1,
2].
When discussing achievements in rural China, we cannot ignore the diversity in the food consumption of rural residents. During China’s two sessions meeting in March 2022, it was emphasized that “it is necessary to establish a big food concept, start from better meeting the people’s needs for a better life, grasp the changing trend of the people’s food structure, and ensure the effective supply of meat, vegetables, fruits, aquatic products and other kinds of food while ensuring the food supply. Nothing can be done without it”. Improving dietary diversity is an inevitable requirement for practicing the concept of big food. Dietary diversity is fundamental for achieving a balanced diet, which can reduce the incidence of overweight, obesity, and other nutritional health problems [
3]. Different foods contain different dietary components and nutrients, and the intake of different foods helps to meet the body’s diverse needs for energy and various nutrients. According to the “Healthy China 2019–2030 Action Plan”, the daily diet of the general population should include cereals, potatoes, vegetables and fruits, livestock, poultry, fish, eggs, milk, soybeans, nuts, and other foods. On average, residents should consume more than 12 types of food per day and more than 25 types per week. However, the unreasonable single-food dietary structure is still a large problem in many rural areas in China, especially in poor areas. The nutrient intake of rural residents is mainly sourced from common foods, such as grains, vegetables, and meat (livestock and poultry meat), and the consumption quantities of eggs, milk, fruits, and aquatic products are relatively small [
4,
5]. Food diversity among poor residents, elderly individuals, children, and members of other groups deserves special attention. The transportation in many rural areas is inconvenient and communication is poor, which hinders the ability to bring in outside information and food, resulting in a lack of nutritional knowledge and limited dietary diversity among farmers. There is still a large gap in the diversity of food consumption between rural residents and urban residents [
6]. In this context, determining how to improve the dietary health of rural residents has become an important part of the “Rational Diet Action” included in the “Healthy China 2019–2030 Action Plan”.
In recent years, the internet revolution has not only profoundly affected the food consumption patterns and the composition of the food consumed by urban residents but has also reshaped the food consumption of rural residents in terms of food types and consumption patterns. According to the 47th Statistical Report on China’s Internet Development Status issued by the China Internet Network Information Center, as of December 2020, the percentage of internet users who use mobile phones to access the internet had reached 99.7%, and the number of individuals using mobile phones for online shopping had reached 781 million, of which rural internet users accounted for 309 million. The widespread popularity of smartphones has allowed many rural residents, who had not previously accessed the internet, to skip computers and become mobile internet users. In addition, e-commerce giants and platforms such as Taobao, JD.com, and Pinduoduo are accelerating along the “last mile” of e-commerce, making online shopping a normal part of life for farmers. In the past, the majority of rural residents ate mainly foods provided by themselves or obtained locally and purchased foods from other places through markets and shops. Today, an increasing number of rural residents are directly and deeply involved in the national food market and information platforms with the help of the power of the internet. They can search for and browse diverse food nutrition and health information without leaving home, buy foods online from all over the country, or sell agricultural products directly to consumers in all parts of the country. According to the “2016 China Rural E-commerce Consumption Trend Report” released by JD.com and the 21st Century Economic Research Institute, the percentage of mobile orders in rural areas is five percentage points higher than that in first-tier cities, and food and beverage orders are the fourth most frequently ordered products, following agricultural materials, maternal and child products, and personal care and cosmetics. In 2019, national online retail sales of agricultural products totalled 416.86 billion yuan, of which 71.8% were concentrated in three categories of products: fresh products, grain and oil condiments, and snack foods. It is worth noting that the income and age gaps within rural areas may prevent the internet from closing the rural–urban food and nutrition gap. If a large number of rural residents (especially low-income and elderly residents) do not enjoy the conveniences brought about by the digital transformation due to gaps in income and knowledge, the food and nutrition inequalities that already exist in rural areas may be exacerbated. This raises the questions that this research addresses: Has the widespread use of smartphones in rural areas changed the dietary health of rural residents, and if so, how? Does the impact of smartphones on food consumption diversity vary by income and age?
With the gradual growth in the popularity of mobile phones in rural areas, an increasing number of scholars have studied the impact of internet use on income, poverty reduction, agricultural production, and market accessibility among farmers [
7,
8,
9]. However, insufficient attention has been given to the path and mechanism by which internet use affects the dietary health of rural Chinese residents. Some international scholars have conducted research on how mobile phone use affects food diversity and have found that mobile phone use has a positive impact on the dietary diversity of farmers [
10,
11,
12]. However, these studies mainly consider rural areas in Latin America and Africa. For farmers in those regions, mobile phones are used more as an information communication tool. There is still a lack of research in countries such as China where the application of the internet is richer. In rural China, mobile phones are no longer limited to information communication functions due to the booming online markets and e-commerce. In addition, most domestic economic research on food still focuses on the relationships between income, market availability, education, habits, the new rural cooperative medical system and other factors, and the food safety and diversity experienced by rural residents [
1,
2,
5,
6]. The few studies related to the internet have either analysed the willingness of urban residents to buy food online and the corresponding factors of influence or have analysed the impact of the internet on the overall consumption of rural residents; there is still a lack of targeted causal analyses of how the internet affects the dietary health of rural residents.
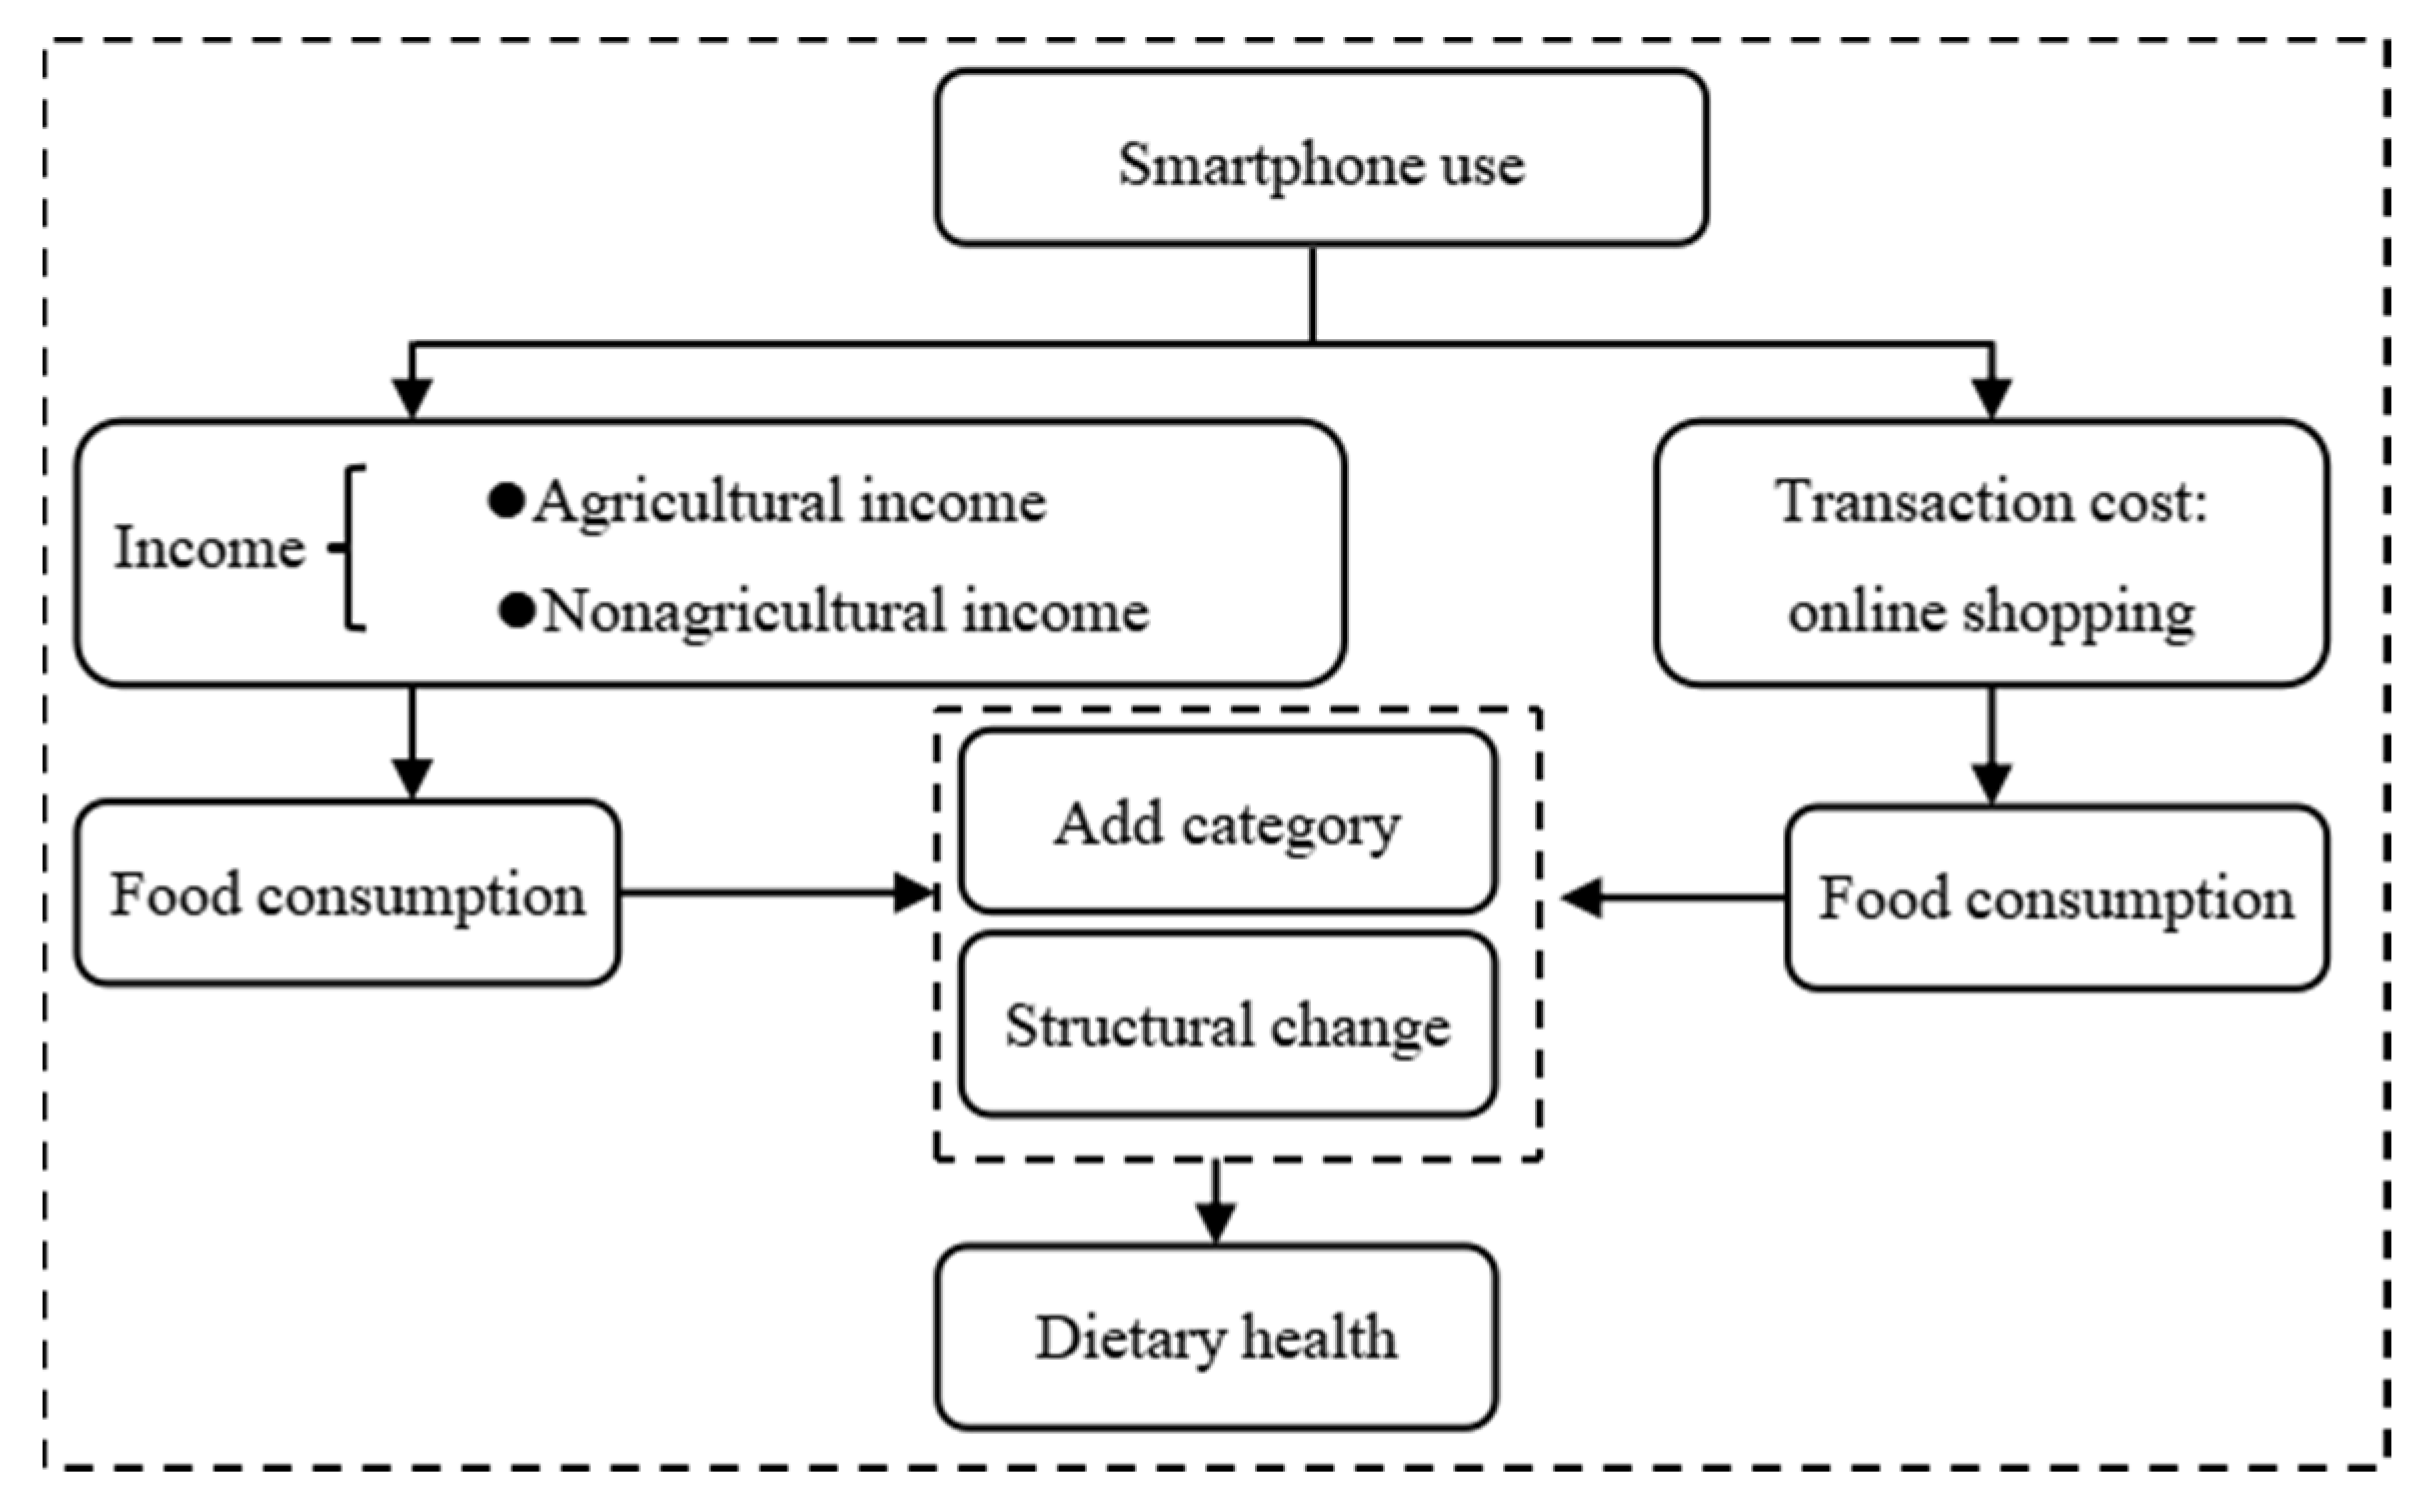
In light of this reality, this article uses survey data from 1047 farmer households across five provinces—Jiangsu, Hebei, Hubei, Shaanxi, and Guangxi—in 2020 to conduct a detailed investigation on the relationship between internet use and dietary health among rural residents, the underlying mechanism, and any group-level heterogeneity. This article examines two channels by which smartphone use could affect dietary health: the income effect and online shopping. Understanding the mechanism by which the dietary health of rural residents is affected provides a realistic basis for guiding internet use to improve the food consumption of rural residents. The remainder of the paper is arranged as follows: the second part contains the theoretical hypothesis, the third part describes the research design, the fourth part presents the empirical analysis and results, the fifth part provides a further discussion, and finally, the conclusion and policy recommendations are provided.
3. Research Design
3.1. Data
The data used in this study come from the “Rural Chinese Production and Livelihoods in the New Era” project group of the China Agricultural University. The data were collected in 2020 for the eastern region (Jiangsu Province and Hebei Province), the central region (Hubei Province), and the western region (Guangxi Zhuang Autonomous Region and Shaanxi Province) through a home-based survey. The content of the questionnaire included basic household information and information on smartphone usage and food consumption. The survey used a multistage sampling method to determine which farmers to sample. In the first stage, two cities (counties) were selected from each province according to the per capita GDP and per capita disposable income of each province and city. In the second stage, in each sample district and county, the townships were categorized as high, medium, or low grade according to the level of per capita disposable income in recent years, and a township from each grade was selected for investigation. In the third stage, in each sampled township, the villages were divided into those with high levels of per capita disposable income in recent years and those with low levels, and one village from each level was randomly selected for investigation. In the fourth stage, in each sample village, the front station staff for the research group randomly selected households based on the villager roster, and the plan was to survey 15–25 households in each village. The age of the respondents was restricted to be within the range of 18–70 years old. The final sample size was 1047 households.
3.2. Variable Setting
(1) Explained variable. This paper explores the impact of smartphones on the dietary health of rural residents. The explained variable, dietary health levels, is measured with the dietary diversity scores of the farmers. The Household Dietary Diversity Score (
HDDS) is an index for evaluating the quality of dietary nutrition proposed by the Food and Agriculture Organization of the United Nations (FAO) [
25]. The calculation of the
HDDS is based on FAO standards. Foods are divided into 12 categories: cereals, potatoes, vegetables, fruits, meat (including livestock and poultry), eggs, milk, fish and aquatic products, beans, fats, sugar, and miscellaneous (condiments, coffee, tea, etc.). According to FAO standards, 1 point will be given for each type of food consumed within 24 h or 7 days. Foods of the same type are not scored repeatedly, and the frequency and quantity of food consumption are not measured. The total score is obtained by summing the scores for the various foods together. The balanced diet pagoda from the “Dietary Guidelines for Chinese Residents (2016)” recommends “the daily intake of 8 types of foods such as grains and potatoes, soybeans and nuts, vegetables, fruits, eggs, aquatic products, milk, and livestock and poultry meat”. Similar to other Chinese studies, this research divided the different types of food into 8 categories: staple foods, meat, fruits, vegetables, milk, eggs, beans, and aquatic products. The
HDDS was calculated based on the respondents’ diet review. Each food type consumed within 7 days scored 1 point, the same food was not scored repeatedly, and the total score could not exceed 8 points.
(2) Explanatory variables. The core explanatory variable in this article is smartphone usage. Whether the respondent uses a smartphone to surf the internet was selected as the explanatory variable and was treated as a binary indicator, with 1 representing yes and 0 representing no.
(3) Control variables. Individual characteristics, such as gender, age, education level, marital status, nutritional and health knowledge scores, status as the person who most frequently buys food at home, and status as the person who most frequently cooks food at home, were used as control variables. In addition, family characteristics, such as per capita annual income, the number of elderly people over 60 years old in the home, and the number of children aged 6–18 years old in the family, were included. Village characteristics, such as per capita annual income and distance from the village to the county seat, were also controlled for.
The descriptions and settings for specific variables are shown in
Table 1.
Table 2 shows the percentage of farmers who do not consume certain types of food within a week. The results suggest that the dietary diversity of the interviewed farmers needs to be further improved, especially in terms of dairy and aquatic products. This is in line with the acknowledged gap between reality and the requirement in the “Healthy China 2019–2030 Action Plan” that “the daily diet of the general population should include cereals, potatoes, vegetables and fruits, livestock, poultry, fish, eggs, milk, soybeans, nuts and other foods, with an average daily intake of more than 12 kinds of food, and a weekly intake of 25 kinds or more”. The gap in the consumption of milk was the greatest; approximately 80% of the interviewed farmers do not drink milk often; the second largest gap was in the consumption of aquatic products, as nearly half of the interviewed farmers do not consume aquatic products on a daily basis. The vast majority of the interviewed farmers consume staple foods and vegetables on a daily basis, but there are also a small number of farmers who do not consume beans, fruits, or eggs within a week. In each of the different regions, drinking milk has not yet become a dietary habit among farmers, and the percentage of farmers who do not consume milk does not exhibit regional differences. The consumption of aquatic products occurs mainly in Jiangsu, Hubei, and Guangxi, which is related to the relatively well-developed local aquatic product industry. The percentage of farmers who do not consume beans weekly is the highest in Guangxi and the lowest in Jiangsu. This suggests that many rural residents do not yet choose their diets to ensure dietary balance and dietary diversity.
3.3. Model Setting
This paper analyses the impact of smartphones on the dietary health of rural residents, which is measured with the
HDDS. The specific empirical model is as follows:
represents the dietary diversity score for rural household i, indicates the usage of smartphones by the members of rural household i, represents the control variables, represents the regional fixed effects, and represents the error term.
The above baseline model may result in biased and inconsistent estimates due to endogeneity problems. The problem of endogeneity has two main sources. One is the omitted variable problem. Some unobservable factors, such as the dietary habits and consumption knowledge of rural residents, may affect dietary diversity, leading to problems such as omitted variables; the second is the problem of simultaneous cause and effect. That is, the ever-increasing consumer demand may drive rural residents to purchase and use smartphones, which creates the problem of simultaneous cause and effect. To address these problems, this article uses instrumental variables. This is explained in detail below.
4. Empirical Results and Analysis
4.1. Benchmark Regression
As shown in
Table 3, column (1) includes only the core explanatory variables, column (2) adds other control variables, column (3) includes only the regional dummy variables, and column (4) adds other control variables to the specification in the third column. By comparing the results, we can see that the use of smartphones significantly improves the dietary diversity scores of rural residents. According to the results in column (4), compared with rural residents who do not use smartphones to access the internet, rural residents who do use smartphones have dietary diversity scores that are significantly higher by 4.2%. This validates the hypothesis proposed during the theoretical analysis that smartphone use increases the dietary diversity of farmers.
The results for the control variables are basically in line with theoretical expectations. Individual characteristics, such as education level, nutrition and health knowledge level, and per capita annual income, have a significantly positive impact on the dietary diversity scores of rural residents at the 1% level. This shows that improving education levels, nutrition and health knowledge, and per capita annual income can help improve the dietary diversity of rural residents. Regarding family characteristics, there is a positive relationship between per capita annual income and the dietary diversity of rural residents, which is consistent with the results predicted by food consumption theory. Among the village characteristics, the village-level per capita annual income has a significantly positive impact on dietary diversity scores at the 10% level. In addition, the distance from the village to the county seat has a significant negative impact on dietary diversity scores at the 1% level.
4.2. Instrumental Variable Method
To address possible endogeneity problems, this article has carefully selected control variables, controlling for individual characteristics, family characteristics, village characteristics, and regional fixed effects as much as possible to reduce the bias caused by unobservable factors. However, there may still be endogeneity problems. Furthermore, in this article, instrumental variables for the smartphone usage of rural residents are used to reduce the bias and inconsistency caused by possible endogeneity.
Effective instrumental variables must meet two conditions: one is that they must not be related to the random disturbance terms, and the other is that they must be related to the endogenous variables. In this paper, broadband coverage in the village and the number of years that broadband has been installed in the household are used as instrumental variables for individual smartphone usage. In terms of relevance, first, village-level broadband coverage captures the penetration of the internet into a region, and the behaviour of people living in the same village can easily be affected by their interactions with others [
26]. Under normal circumstances, to reduce costs, network infrastructure is laid by region. If the network infrastructure is built in a given area, different farmers in the corresponding village can easily access the network at any time. Therefore, the interactions in expected behaviour will cause the internet usage of specific rural households in the village to be correlated with the average level of internet usage in the village. Therefore, the more developed the regional internet infrastructure is, the greater the probability of rural residents using smartphones to access the internet. Second, the longer a household has had broadband installed, the more likely it is for members of that household to use smartphones to surf the internet in order to maximize the utility of the broadband connection.
Regarding the exogeneity condition, first, whether network infrastructure has been laid in a certain area is greatly affected by factors such as the economic level of the area and road construction. Therefore, village-level broadband coverage may be related to factors such as the economic level of the village and the distance from the county seat and, thus, may affect the food consumption of the rural residents in the village. To address this issue, in this article, the economic status of the village and the distance from the county seat are controlled for so that the village-level broadband coverage is not related to the food consumption of rural residents at the micro (individual) level. In addition, the food consumption of rural residents cannot adversely affect village-level broadband coverage, so this instrument is not subject to the problem of reverse causality. In addition, broadband coverage in the village greatly reduces the measurement error problem that may exist in the data on the use of individual smartphones. The design of this instrumental variable has been adopted by other scholars [
27,
28]. Secondly, similar to village-level broadband coverage, the number of years that a household has had a broadband connection may be related to factors such as household income, education level, the number of elderly household members, and the number of children. There are more infants, more left-behind children, and more children overall in rural areas. To facilitate children’s education and their contact with their working parents, family broadband coverage may be widespread. For this reason, in this article, such variables are controlled for to ensure that household-level broadband coverage is not related to the food consumption of the rural household members. In addition, the number of years that broadband has been installed in the home also greatly reduces the measurement errors that may exist in the data on the use of individual smartphones. Therefore, logically, the village-level broadband coverage rate and the number of years that broadband has been installed in each home meet the relevance and exogeneity conditions for instrumental variables. Of course, this claim needs further testing.
Table 4 shows that the
p value for the Durbin–Wu–Hausman (DWH) test is 0.000, which means that the exogeneity hypothesis can be rejected at the 1% level, indicating that smartphone use is an endogenous variable. The Cragg–Donald Wald F statistic is 24.573, and the critical value is 19.93 when the error is greater than 10%, which eliminates concerns about weak instrumental variables [
29]. The
p value for the overidentification test (Hansen J statistic) is 0.079, indicating that the null hypothesis that all the instrumental variables are exogenous and cannot be rejected at 5% significant level. The above test results show that using village-level broadband coverage and the duration of home broadband installation as instrumental variables can be used to more accurately identify the impact of smartphone usage on the dietary diversity of rural residents.
In
Table 4, column (1), the traditional two-stage least-squares (2SLS) method is used for estimation. In column (2), the limited information maximum likelihood (LIML) estimation method, which is more robust to weak instrumental variables, is used. In column (3), the generalized method of moments (GMM), which is more effective under heteroscedasticity conditions, is used for estimation, and in column (4), iterative GMM is used for estimation. Overall, the estimation results from the four methods all show that smartphone use has a significant positive impact at the 1% level on the dietary diversity of rural residents, and that the estimation coefficients are relatively close, further indicating that the estimation results are robust and credible.
4.3. Robustness Test
Although the instrumental variable method has been used to overcome, as much as possible, the endogeneity problems caused by omitted variables, reverse causality, etc., due to data and variable limitations, there may still be selection bias in the analysis. That is, whether it is possible to use a smartphone to surf the internet is not randomly assigned but is the result of rural residents’ self-selection. Because of this, direct regression is likely to lead to selection bias. To address this issue, this article uses propensity score matching to construct a counterfactual to correct this bias and further verify whether the positive effect of smartphone use on the dietary diversity of rural residents is consistent and stable. However, propensity score matching mainly controls for the influence of observable variables. If the observable variables are selected improperly or too few are used, estimation errors can easily occur. Therefore, this study uses propensity score matching as a robustness test only.
This paper calculates the average treatment effect (average treatment effect on the treated, ATT) between two groups of residents—those who use smartphones to surf the internet and those who do not—after matching.
Table 5 shows the results using nearest neighbour matching, radius matching, kernel matching, and local linear regression matching. The ATT results all show that, after eliminating the systematic observable differences between subsamples, the use of smartphones to surf the internet has a significant positive impact on the dietary diversity of rural residents.
6. Conclusions
The “Healthy China 2030” Plan Outline, reviewed and approved in 2016, proposed “[focusing] on solving the problems of micronutrient deficiencies and excessive intake of high-calorie foods such as fats and oils for some people, and gradually [solving] the coexistence of nutritional deficiencies and excesses among residents”. The digital technology represented by the internet has set off a revolution in the understanding of food nutrition, ingredients, and purchase channels in rural China. Using survey data from five provinces in 2020, this article examines the impact of smartphone use on the dietary health of rural residents and explores the group-level heterogeneity in smartphone use and its impact mechanism. The results show that internet use has a significant positive effect on the dietary health of rural residents. Specifically:
(1) Compared with rural residents who do not use smartphones to access the internet, rural residents who do use smartphones to access the internet have food consumption diversity scores that are significantly higher by 4.2%. To take into account the possible endogeneity issues, this article selects appropriate instrumental variables to address endogeneity and uses propensity score matching; the results are still robust. (2) Further analysis of the impact mechanism shows that the use of smartphones improves the diversity of the foods in their diet by increasing the income level of rural residents and reducing transaction costs. That is, the relaxation of budget constraints and the increased efficiency of food acquisition are important mechanisms by which the use of smartphones improves the dietary diversity of rural residents. (3) The effect of smartphone use on the dietary diversity of rural residents is heterogeneous across groups. The analysis reveals that there are significant differences in the impact of smartphone use on the dietary diversity of rural residents of different ages and with different incomes. Smartphone use has a more significant impact on young people and high-income households than on elderly people and low-income households.
On the basis of the above analysis, this article makes the following suggestions for making full use of the internet to promote the dietary diversity of rural residents: (1) policymakers should continuously increase internet penetration and smartphone coverage in rural areas, as doing so will help narrow the urban-rural dietary health gap. In 2020, the internet penetration rate in rural areas was only 55.9%, and a large number of rural residents were still excluded from internet use due to an incomplete rural network infrastructure, a lack of skills, and limited education. Continuing to increase the internet penetration rate and smartphone coverage rate in rural areas will help consolidate poverty alleviation and rural revitalization and expand their effects, help ensure food safety, and reduce nutrition and health issues in rural areas. (2) To improve food consumption diversity in rural China, local governments could conduct lectures for public welfare, such as the use of smartphones, and provide knowledge about healthy eating patterns. In rural areas, nutritional vulnerable groups include, but are not limited to, elderly populations, young children, pregnant women, and low-income groups. These people have no resources or money to learn corresponding knowledge so as to improve the food consumption diversity. (3) To make rural residents better facilitate food consumption, the government needs to improve e-commerce distribution infrastructure in rural areas. In addition to the internet penetration rate, the main component of the external environment that affects whether rural residents can shop online is the construction of local village roads, express delivery outlets, and other related supporting facilities. To further expand the coverage of rural e-commerce, it is necessary to focus on solving the “last mile” problem and achieve full coverage of express delivery outlets in all administrative villages. A number of comprehensive commercial service centres and logistics distribution centres in county towns can be upgraded; a group of township commercial centres can be upgraded in townships; in villages, a group of new chain convenience stores can be built, thus increasing the rapid delivery and distribution of agricultural products according to local conditions.
It should be noted that the issues discussed in this article are related mainly to the difference between being online and being offline; this article does not examine the impact of the quality of smartphone use on the dietary diversity of rural residents, and this issue will be further investigated in the future. In fact, however, using equipment to obtain information or for shopping requires only the basic skill of identifying the value of information and quickly obtaining the required information. The ability to transform valuable information into nutrition and health behaviours is even more important. Especially when basic technologies become popularized over time, differences in the latter three capabilities will determine whether the internet becomes particularly important for the dietary diversity of residents.


