
A Case Study of Refined Building Climate Zoning under Complicated Terrain Conditions in China


Abstract
:1. Introduction
2. Data and Methods
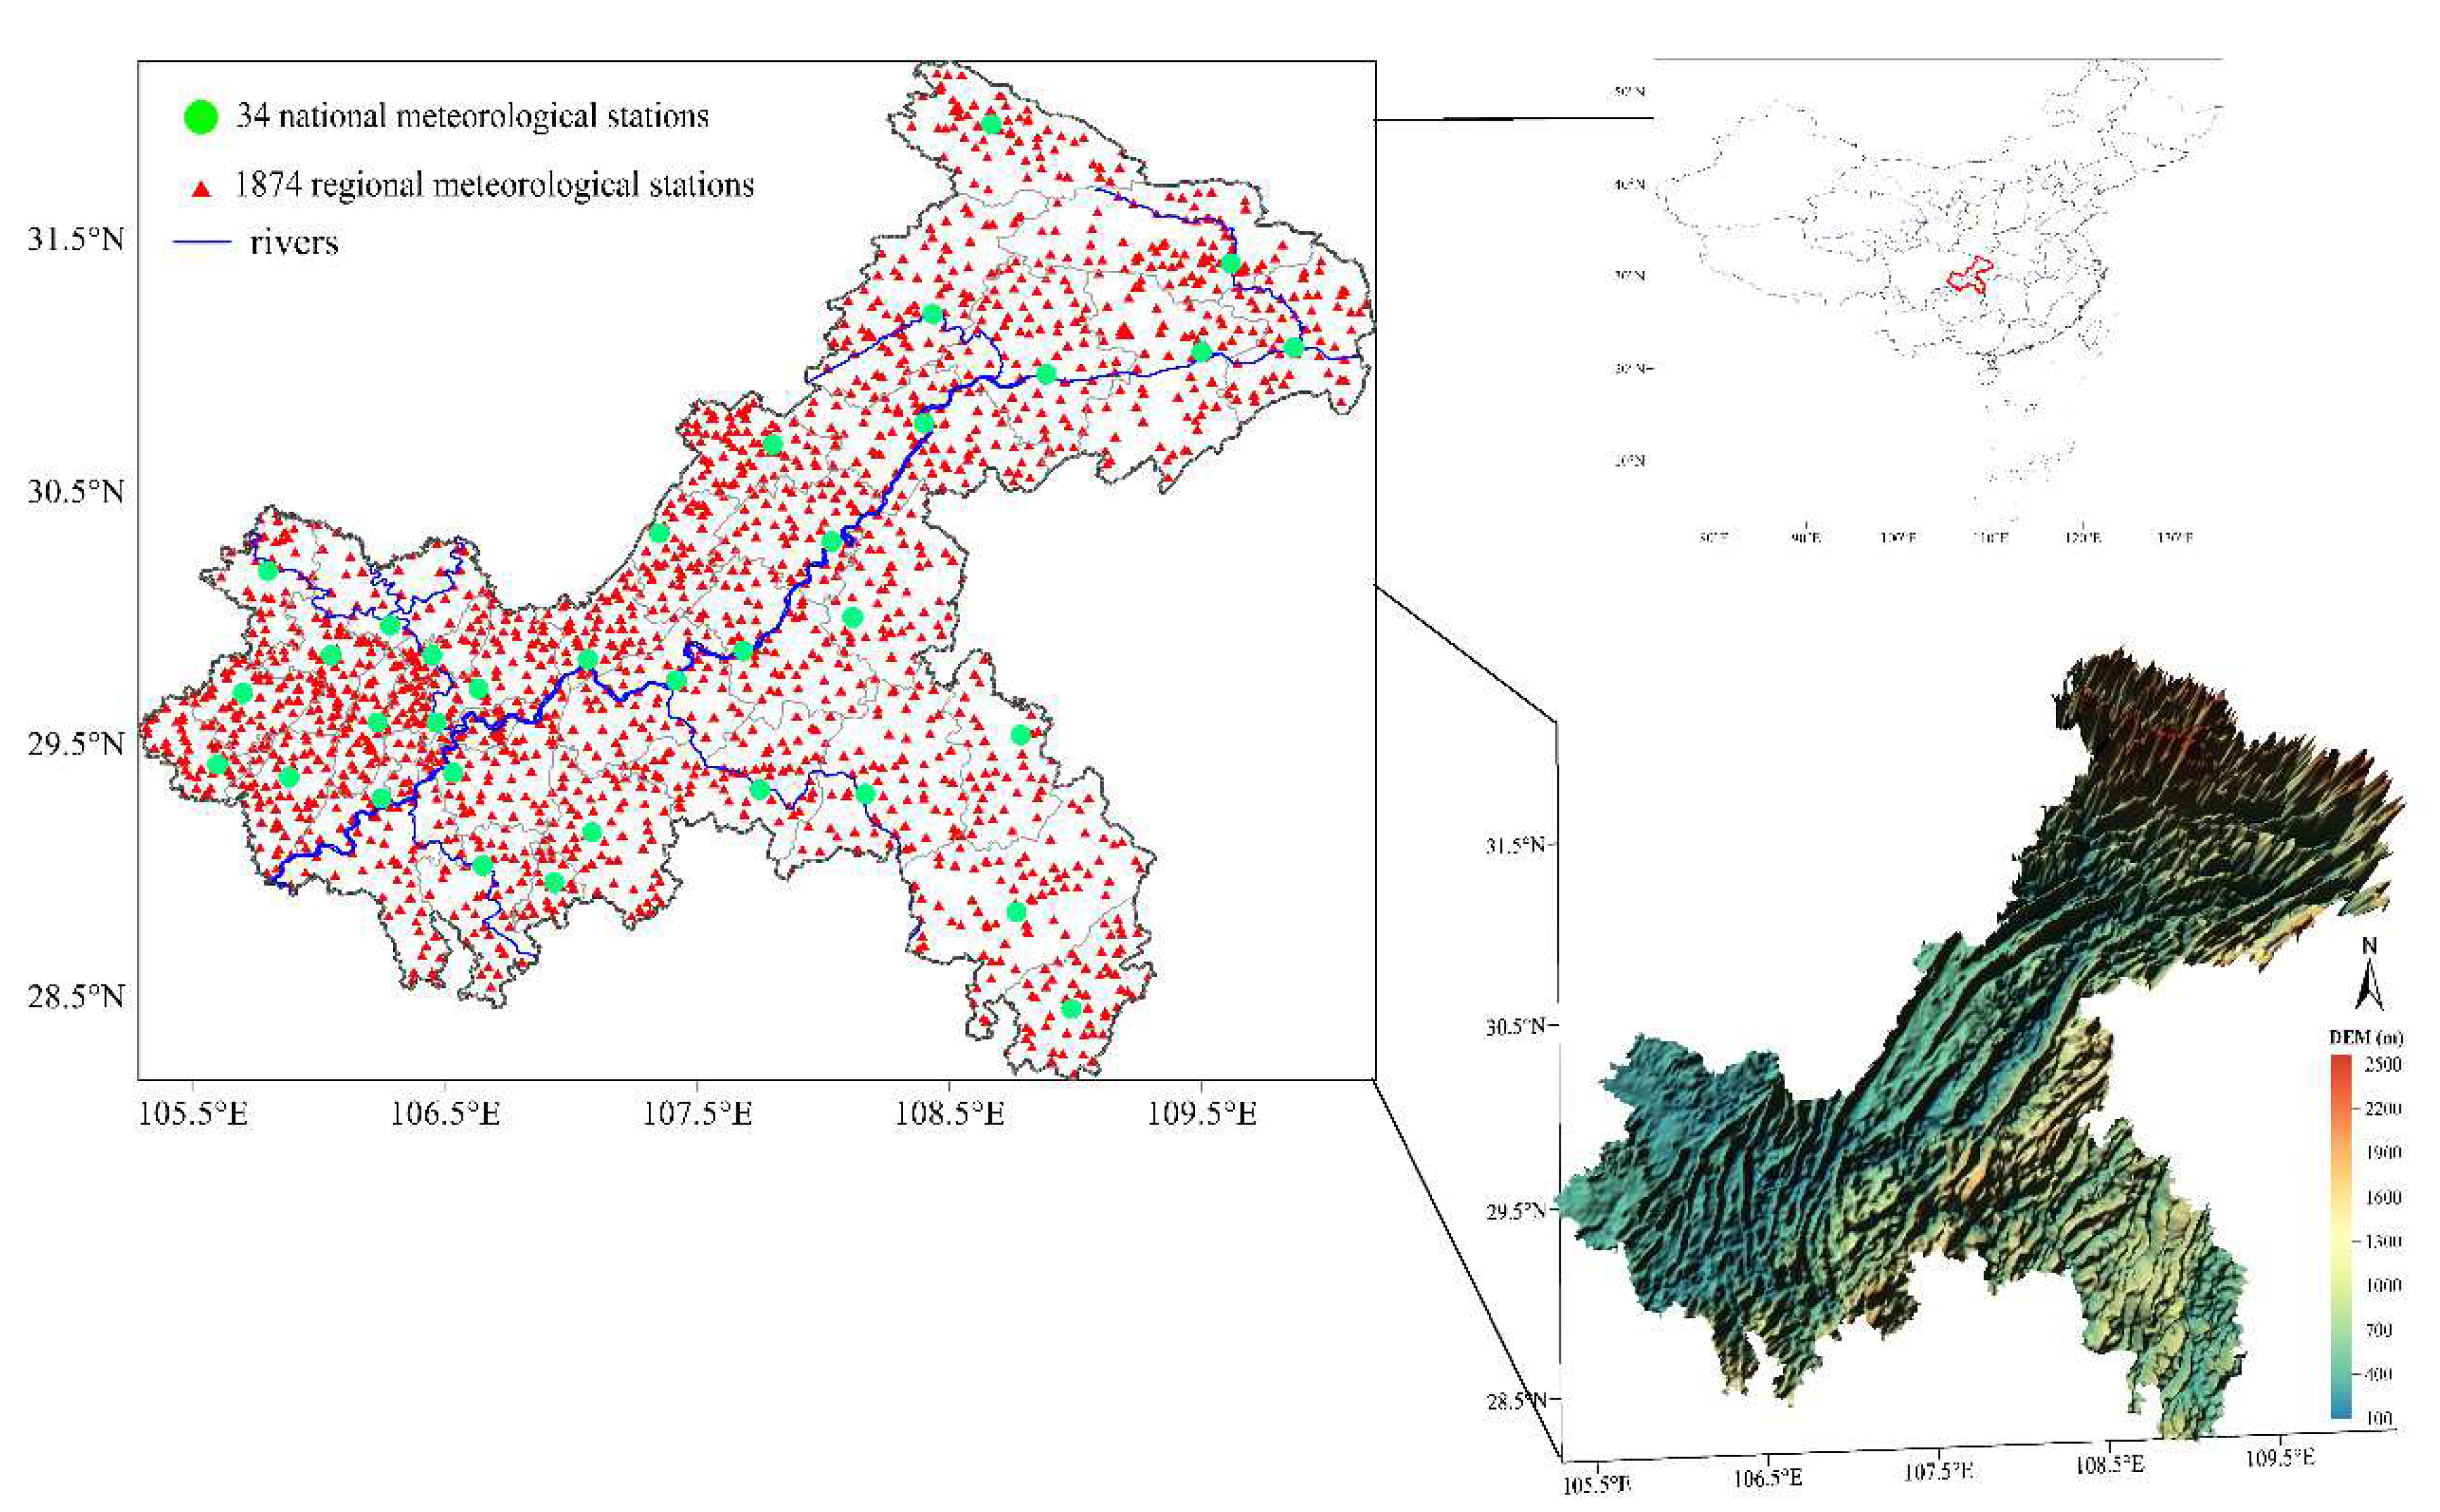
2.1. Data
2.2. Method
3. Results
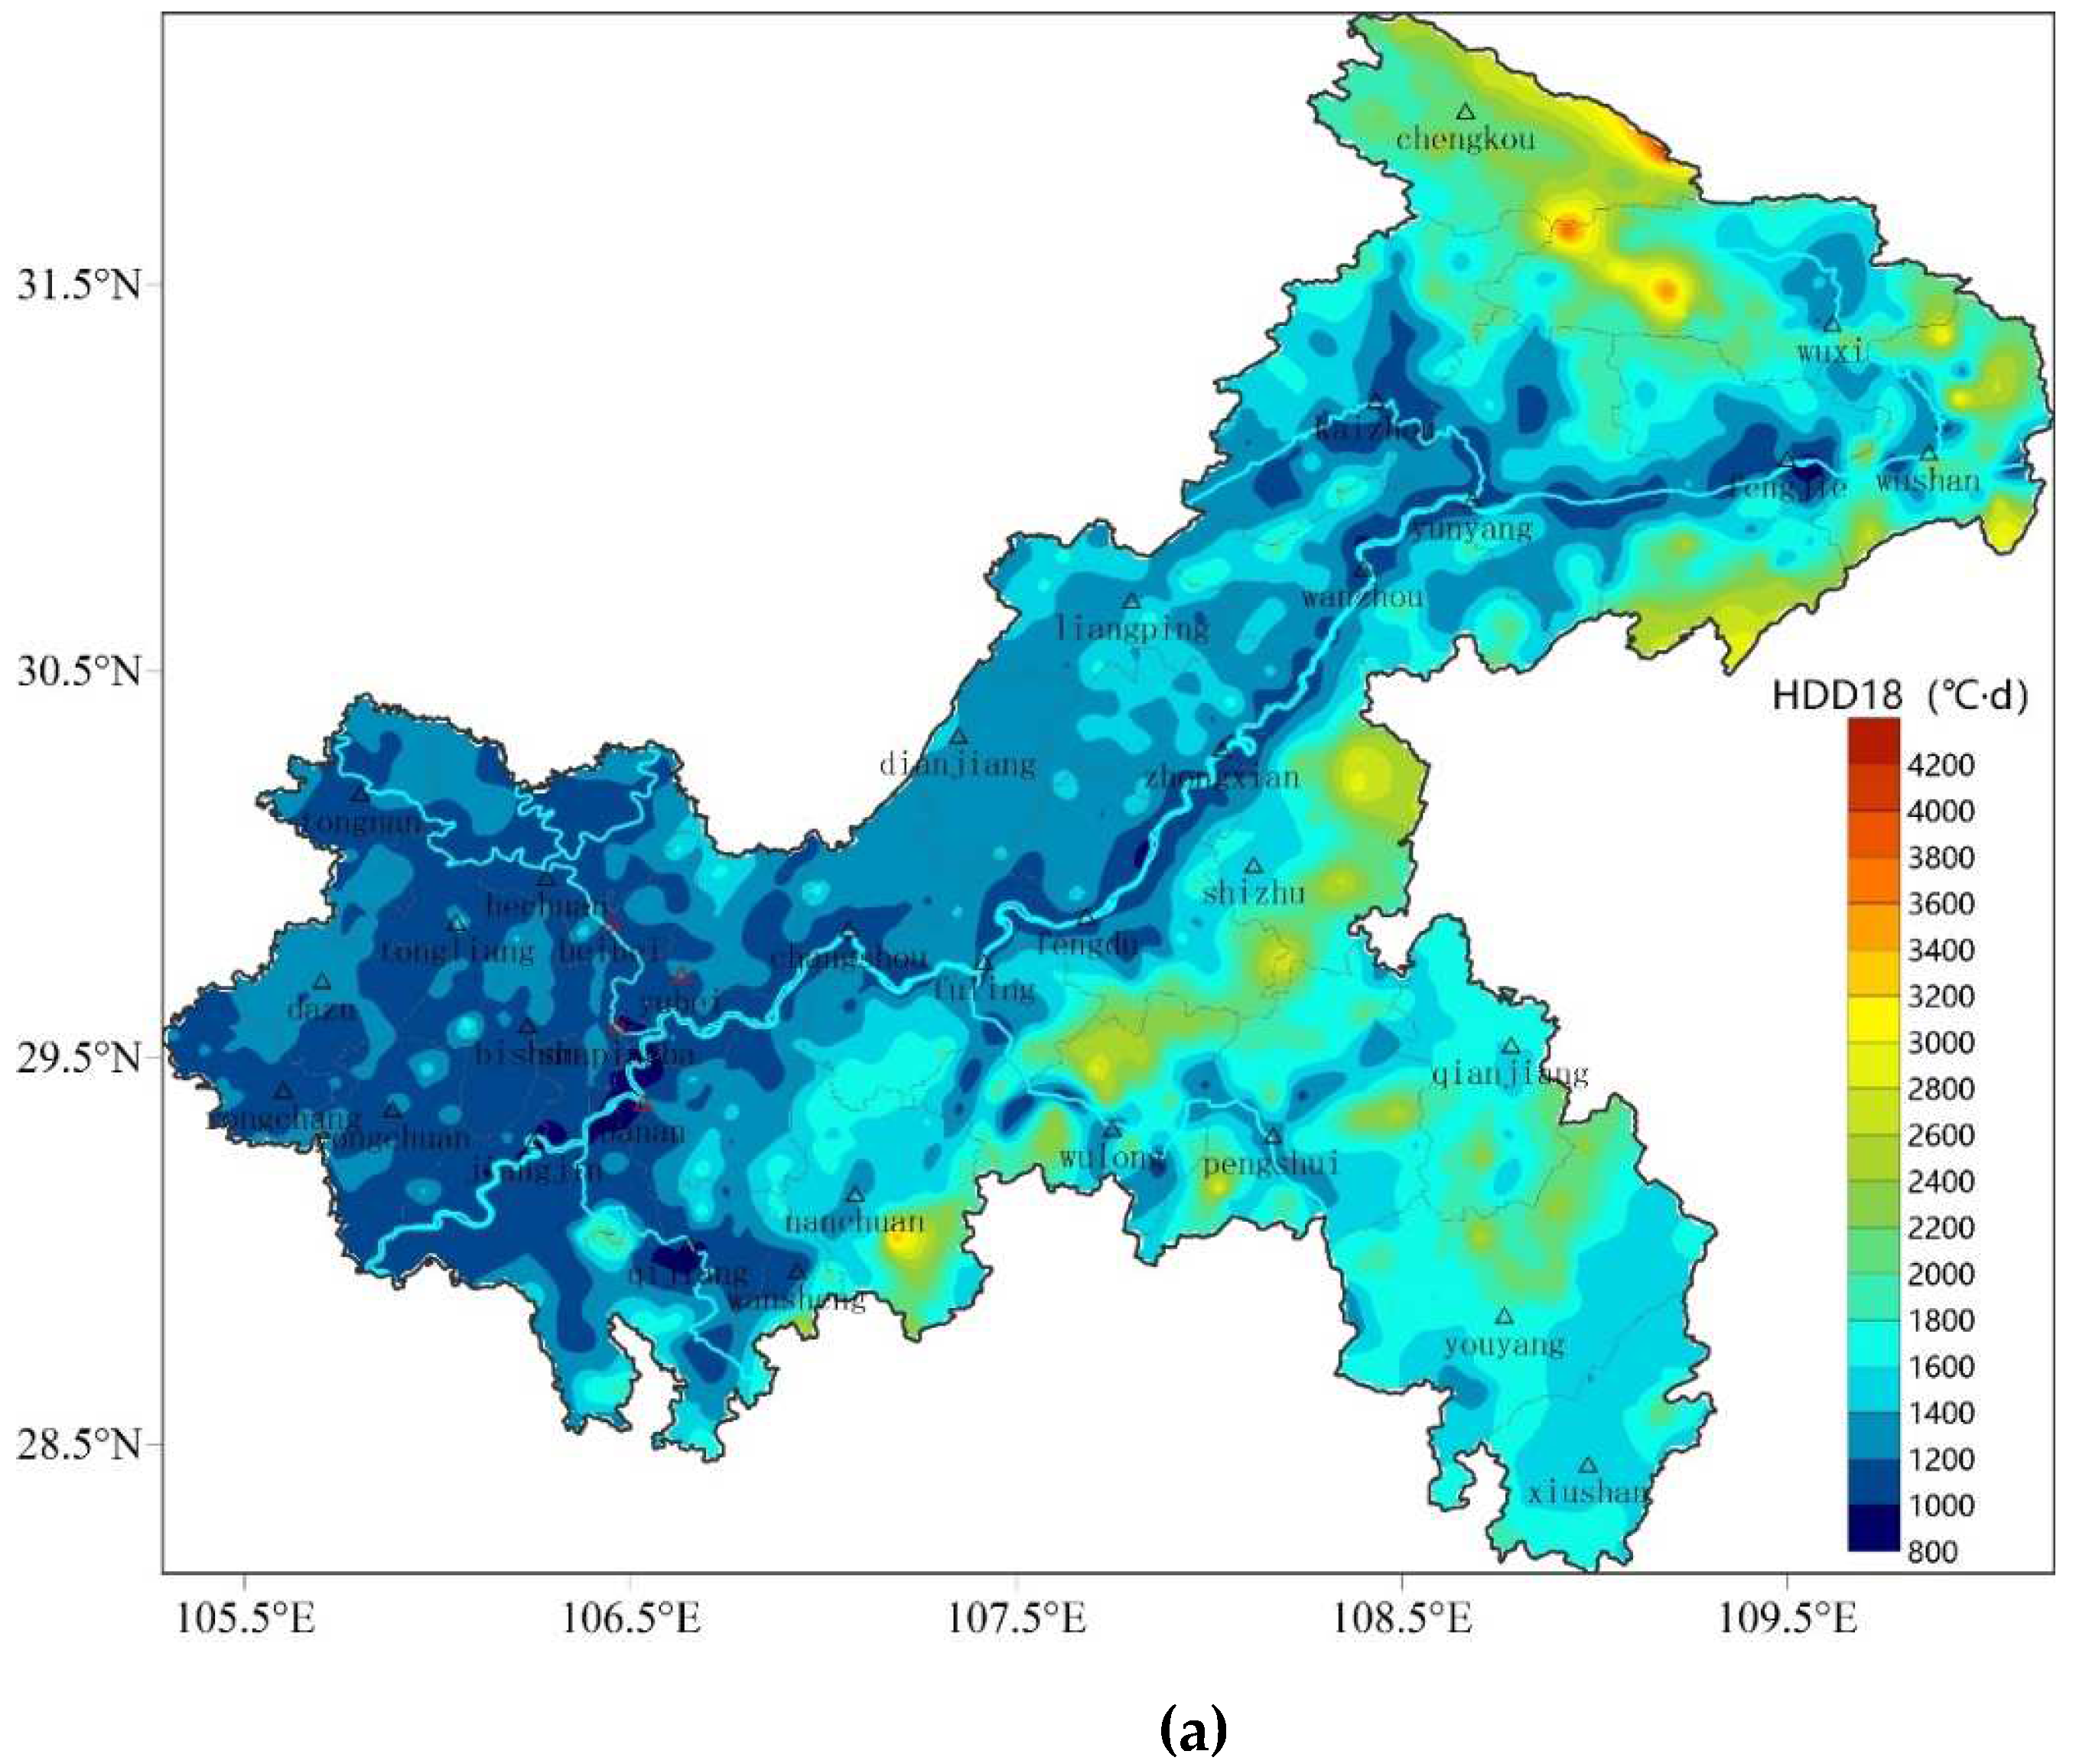
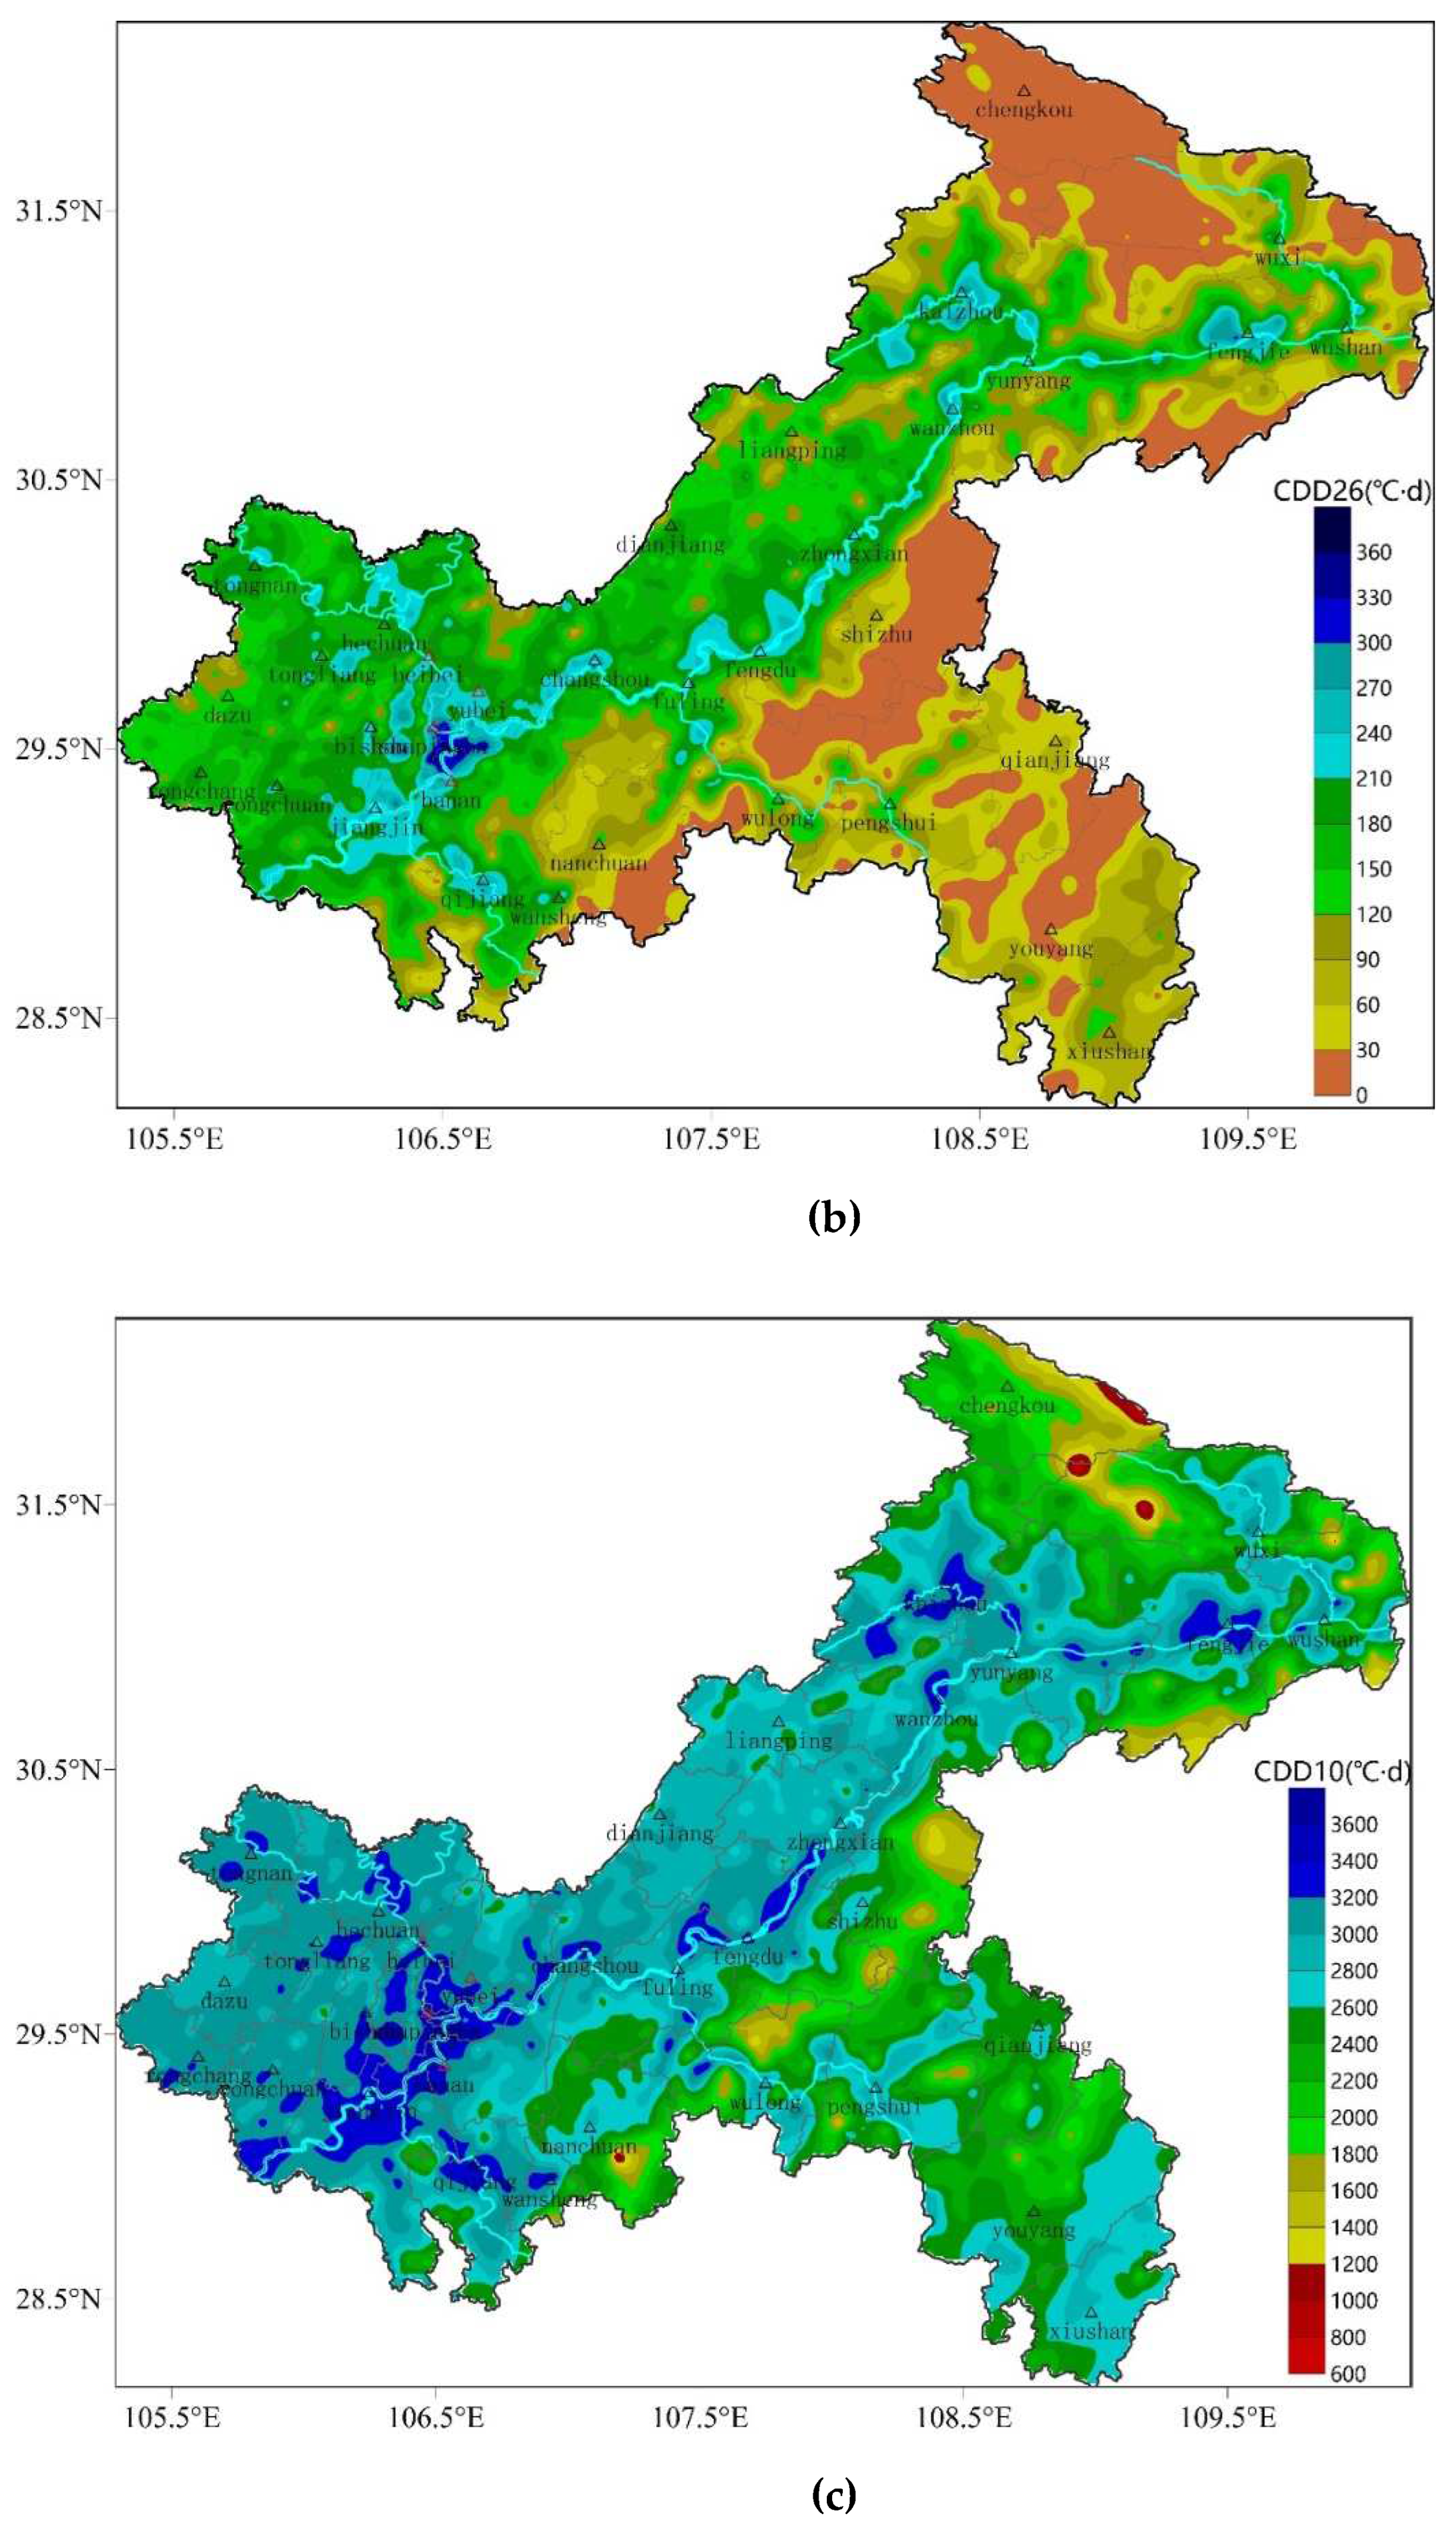
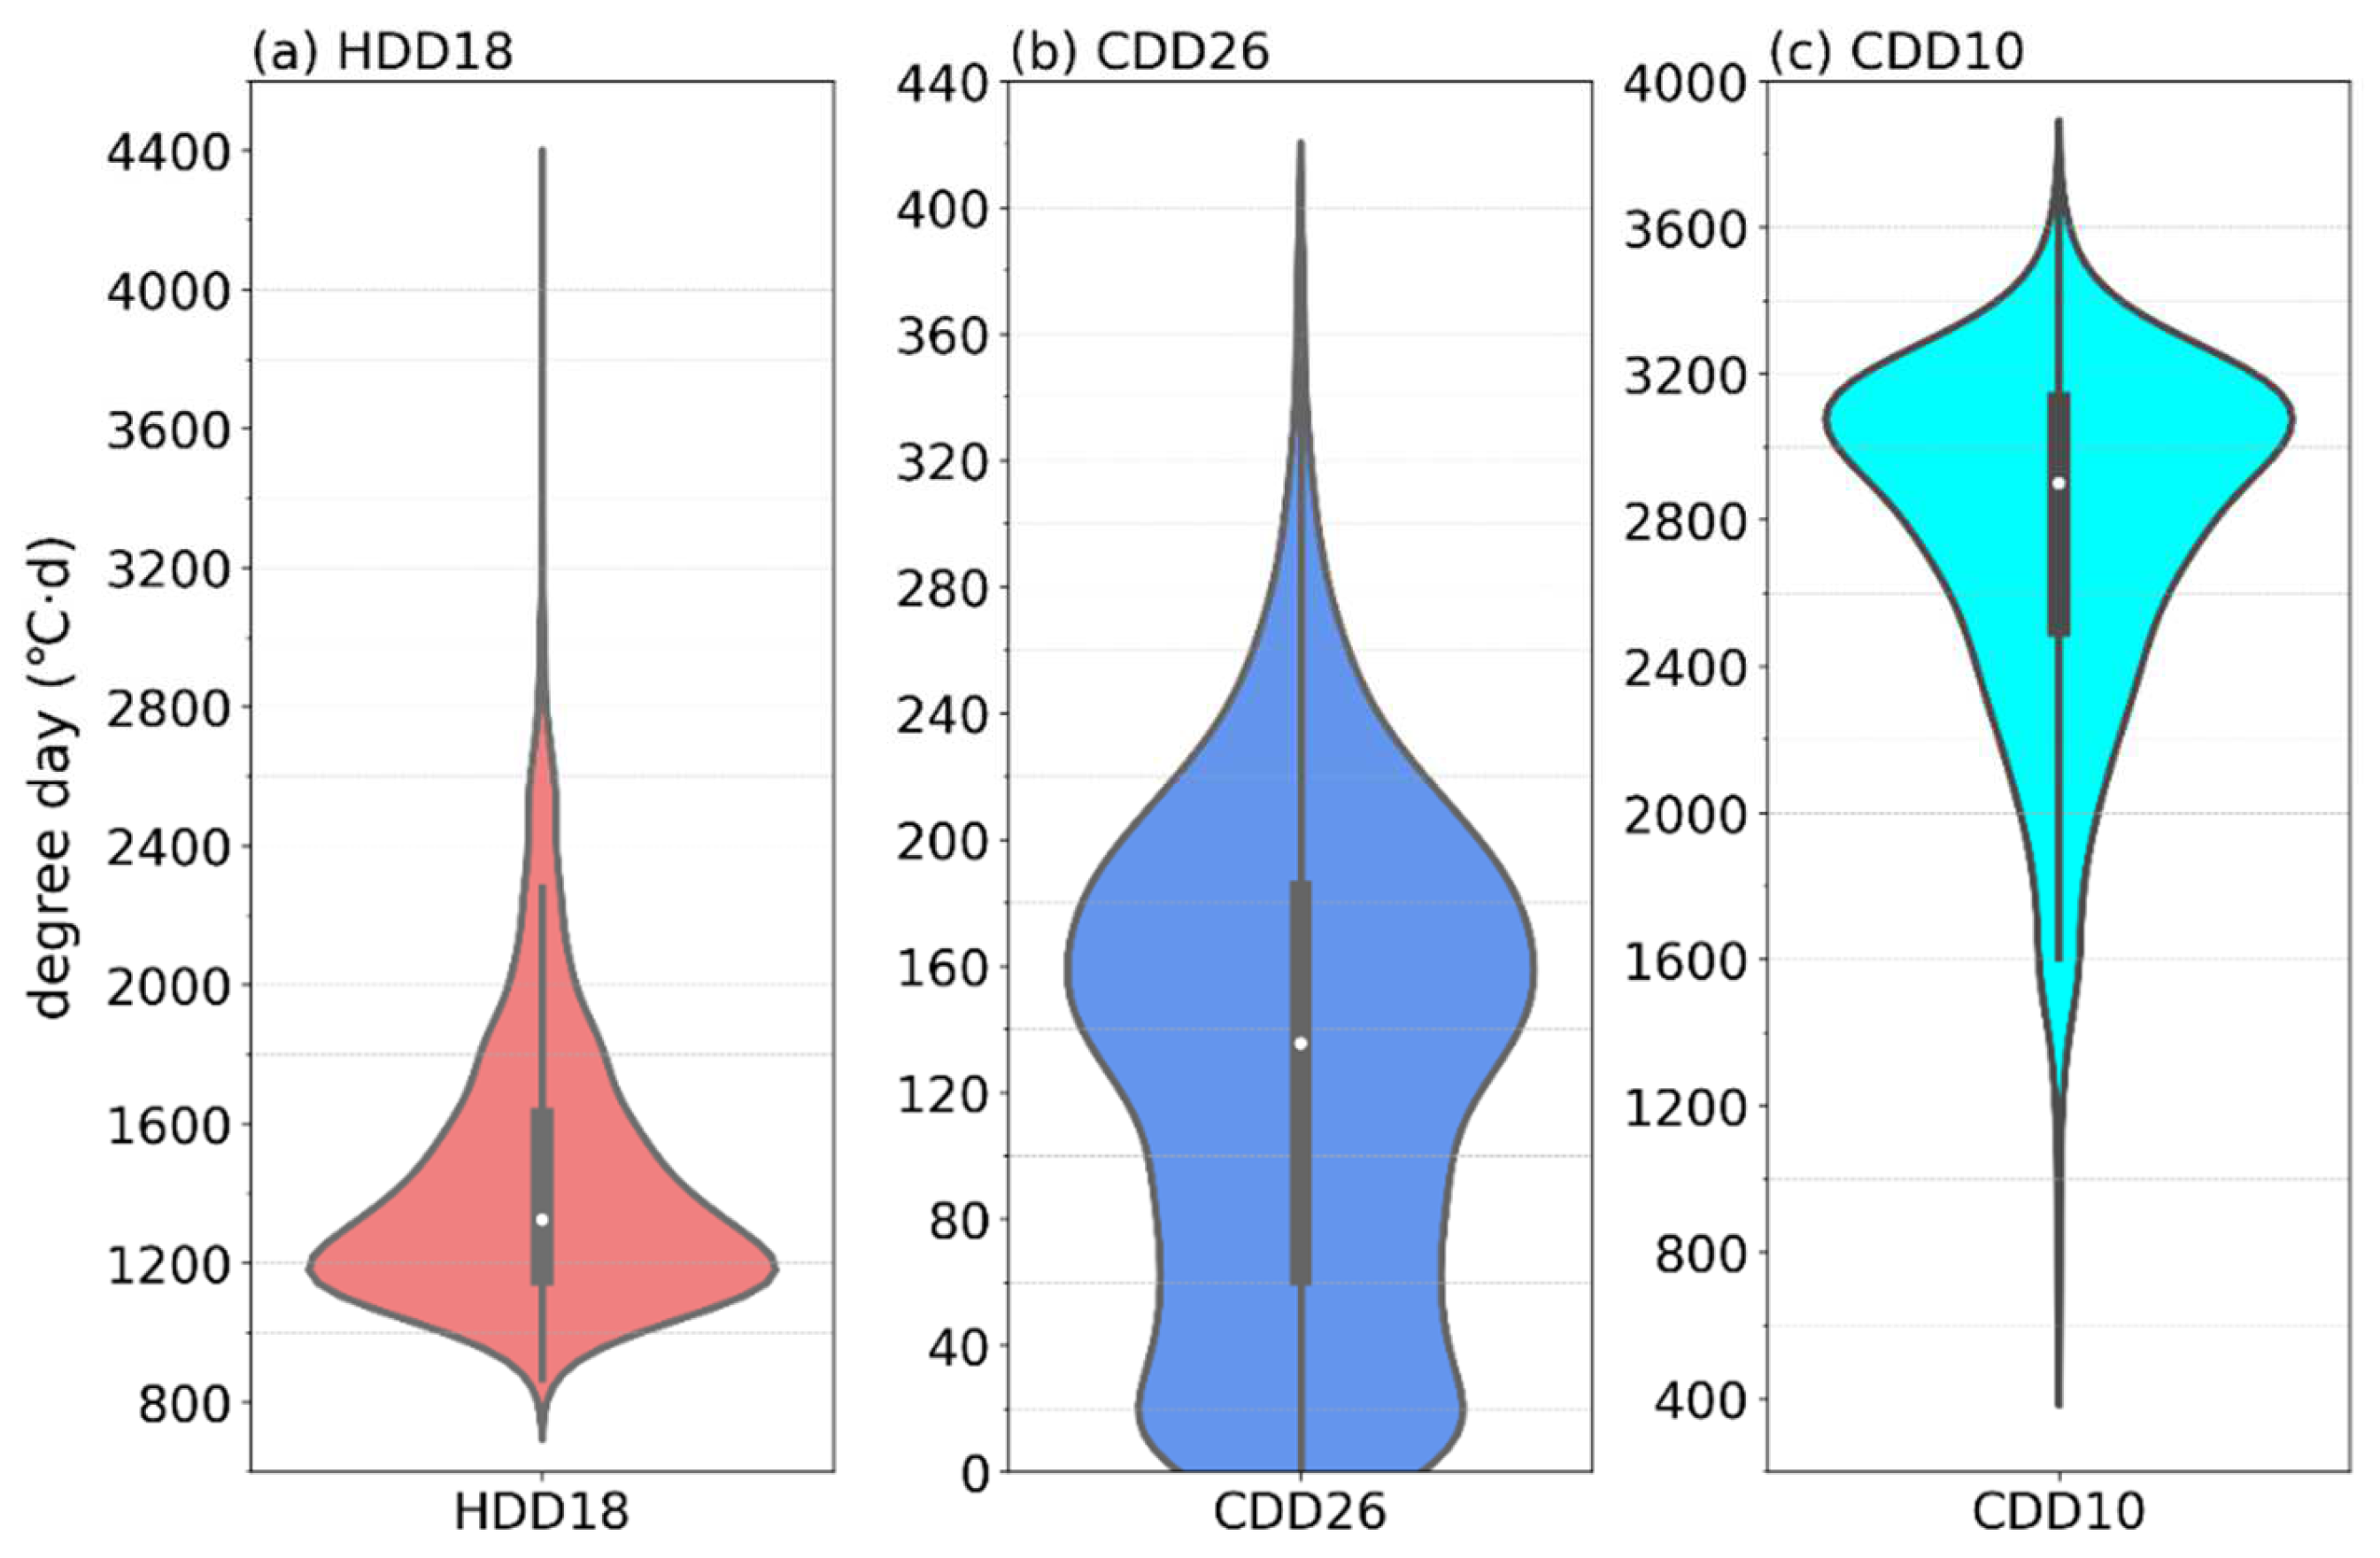
3.1. Refined Spatial Distribution Characteristics of HDD18, CDD26, and CDD10
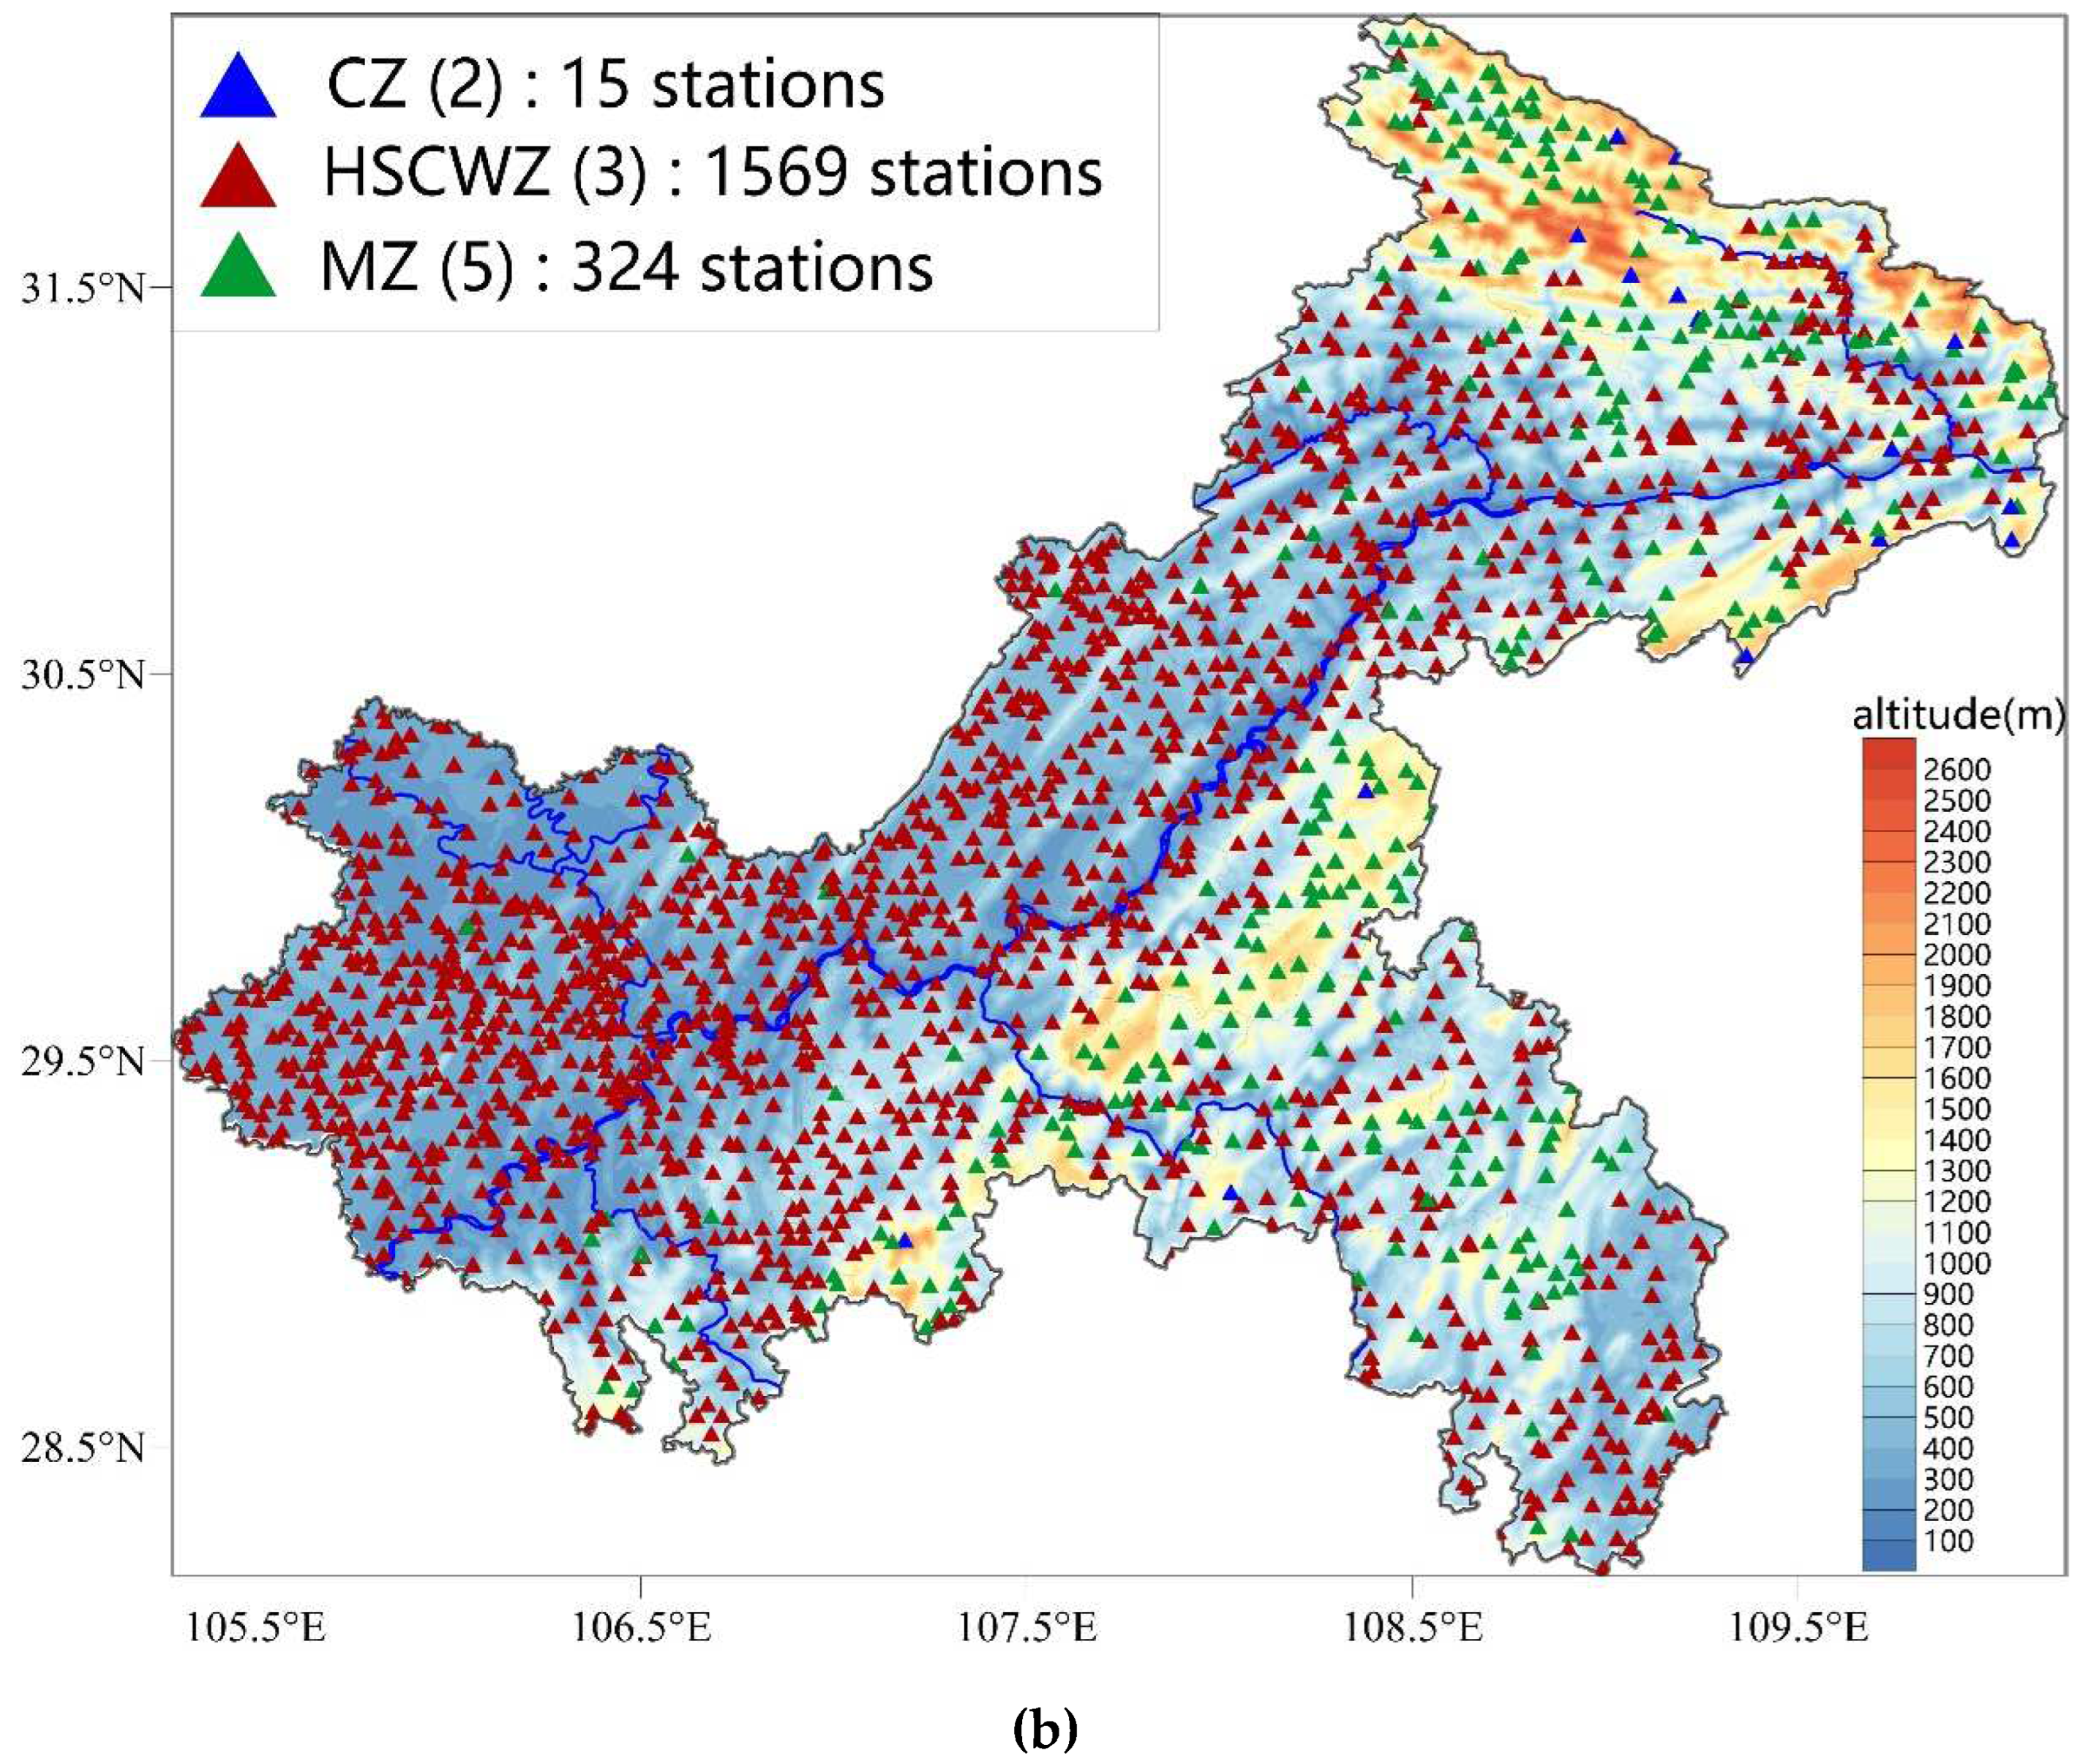
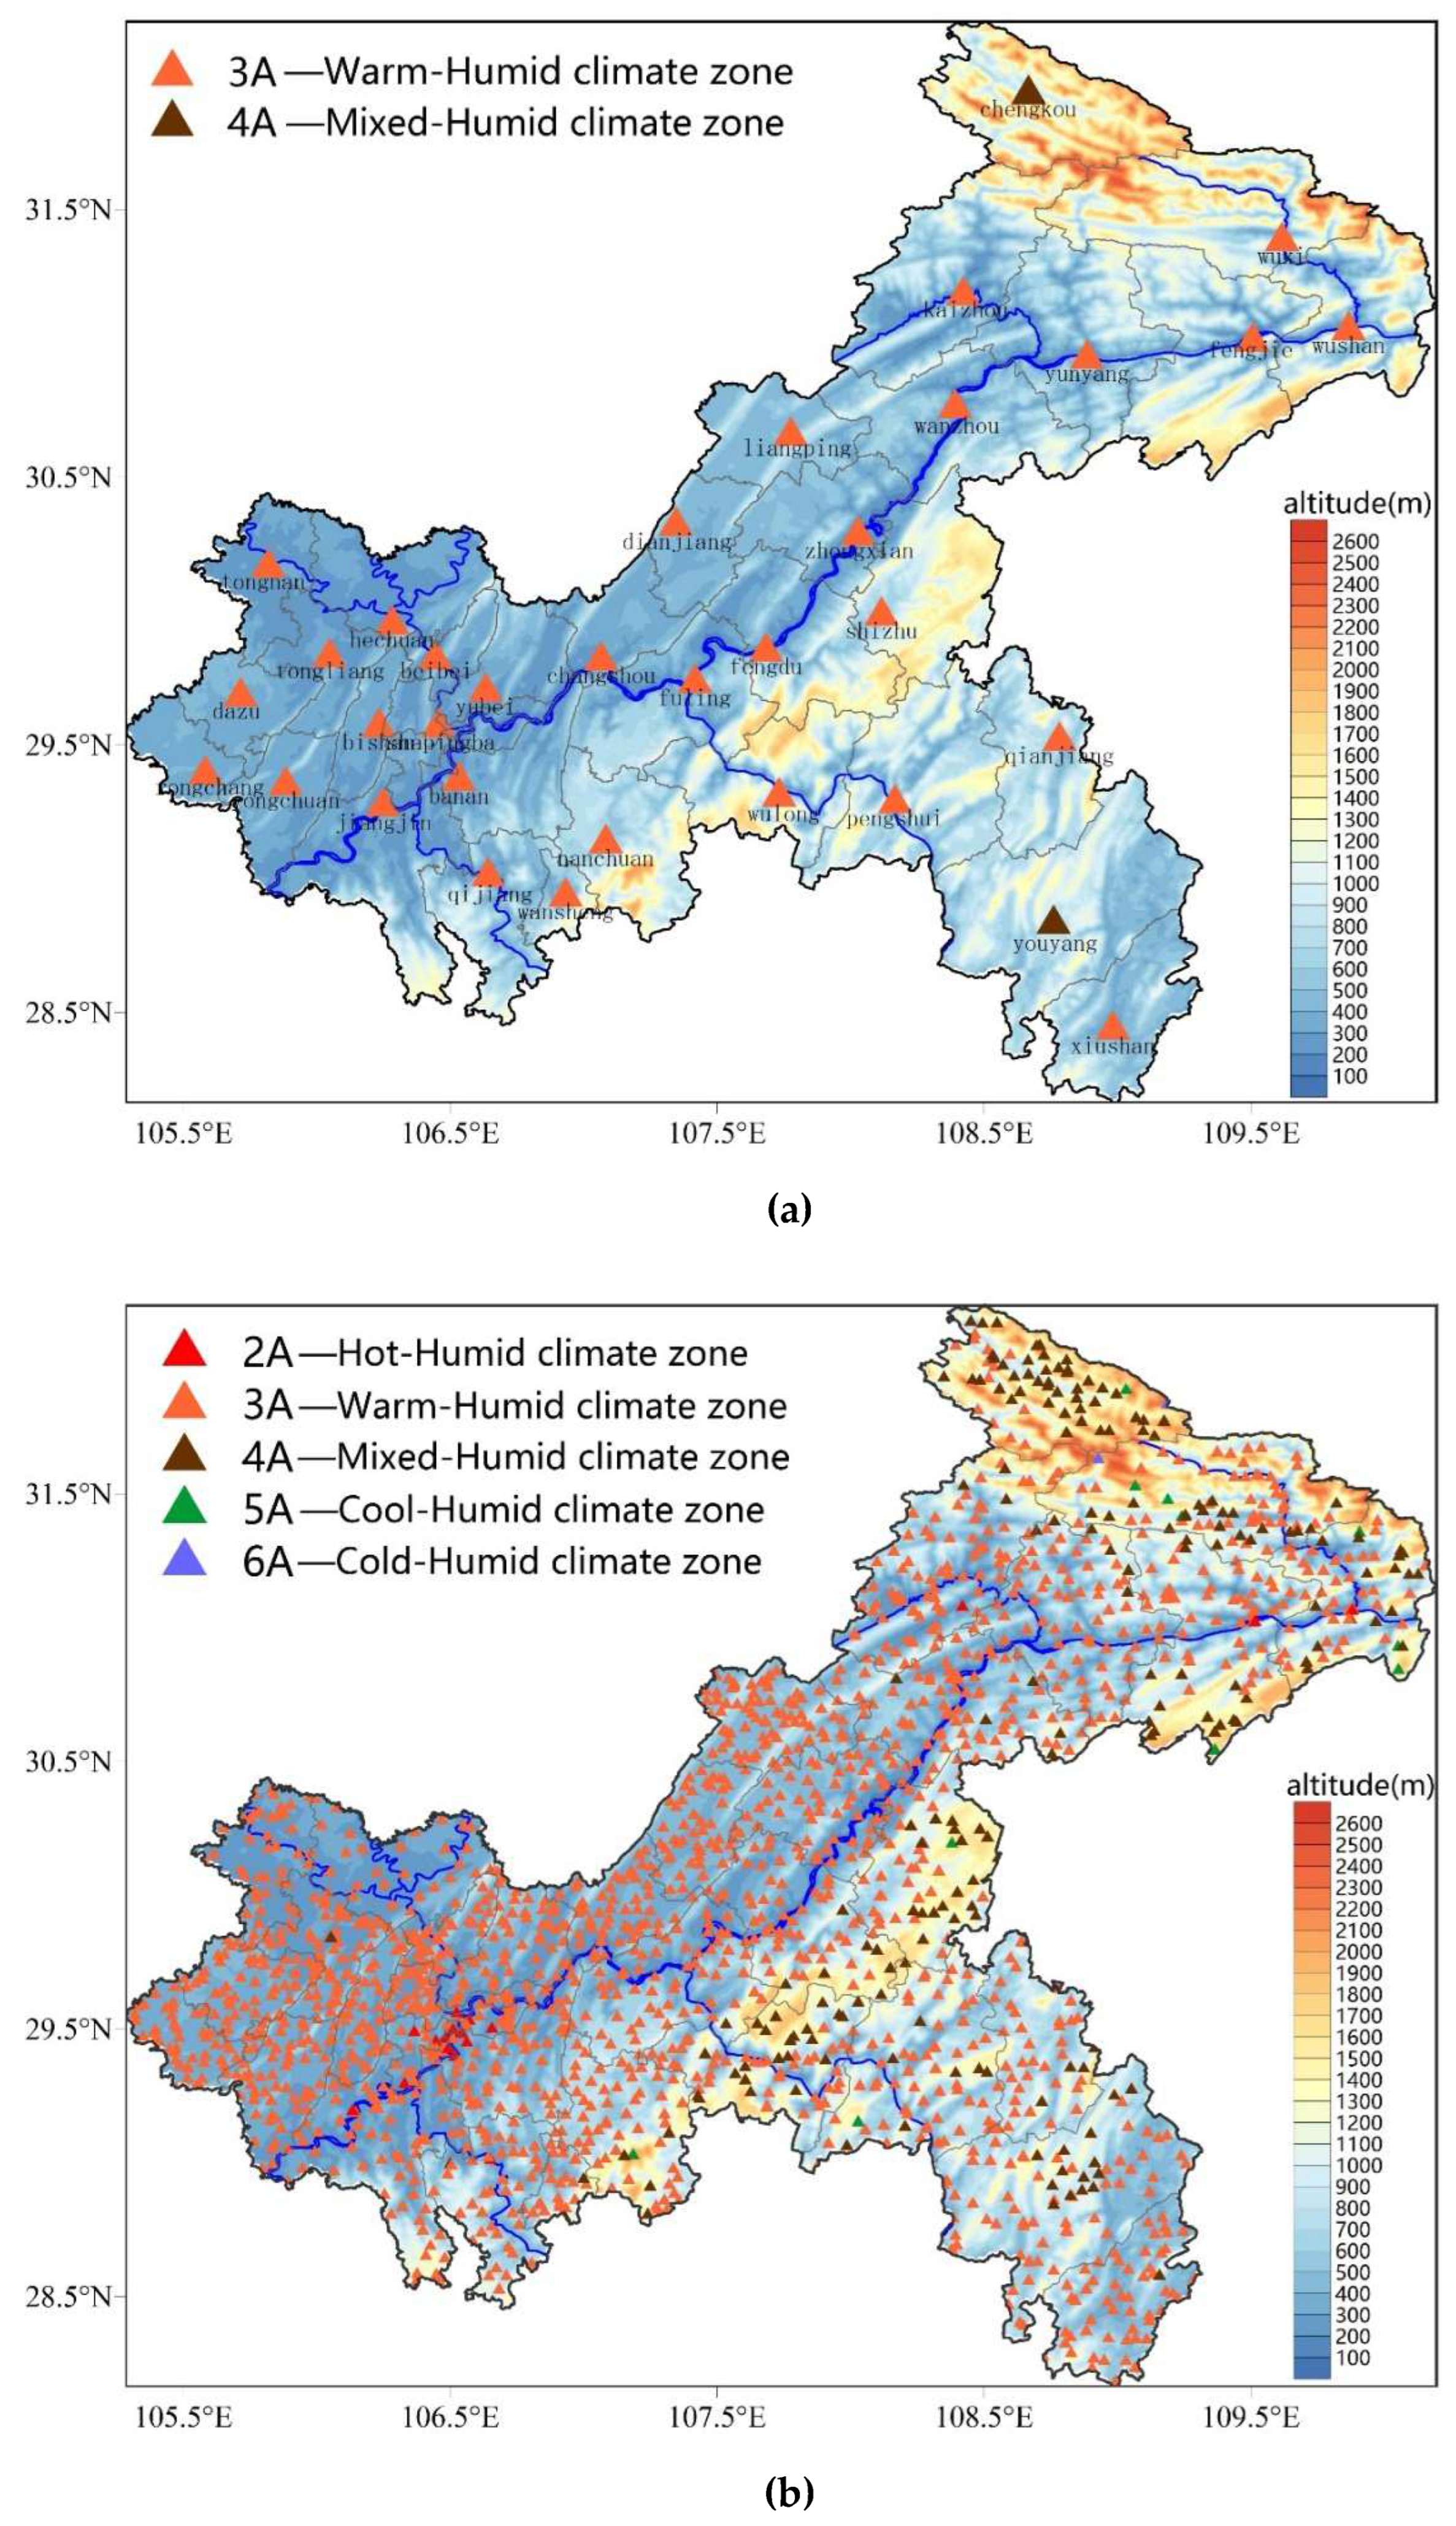
3.2. Results of Refined Building Climate Zoning in Chongqing Based on the ASHRAE Standard
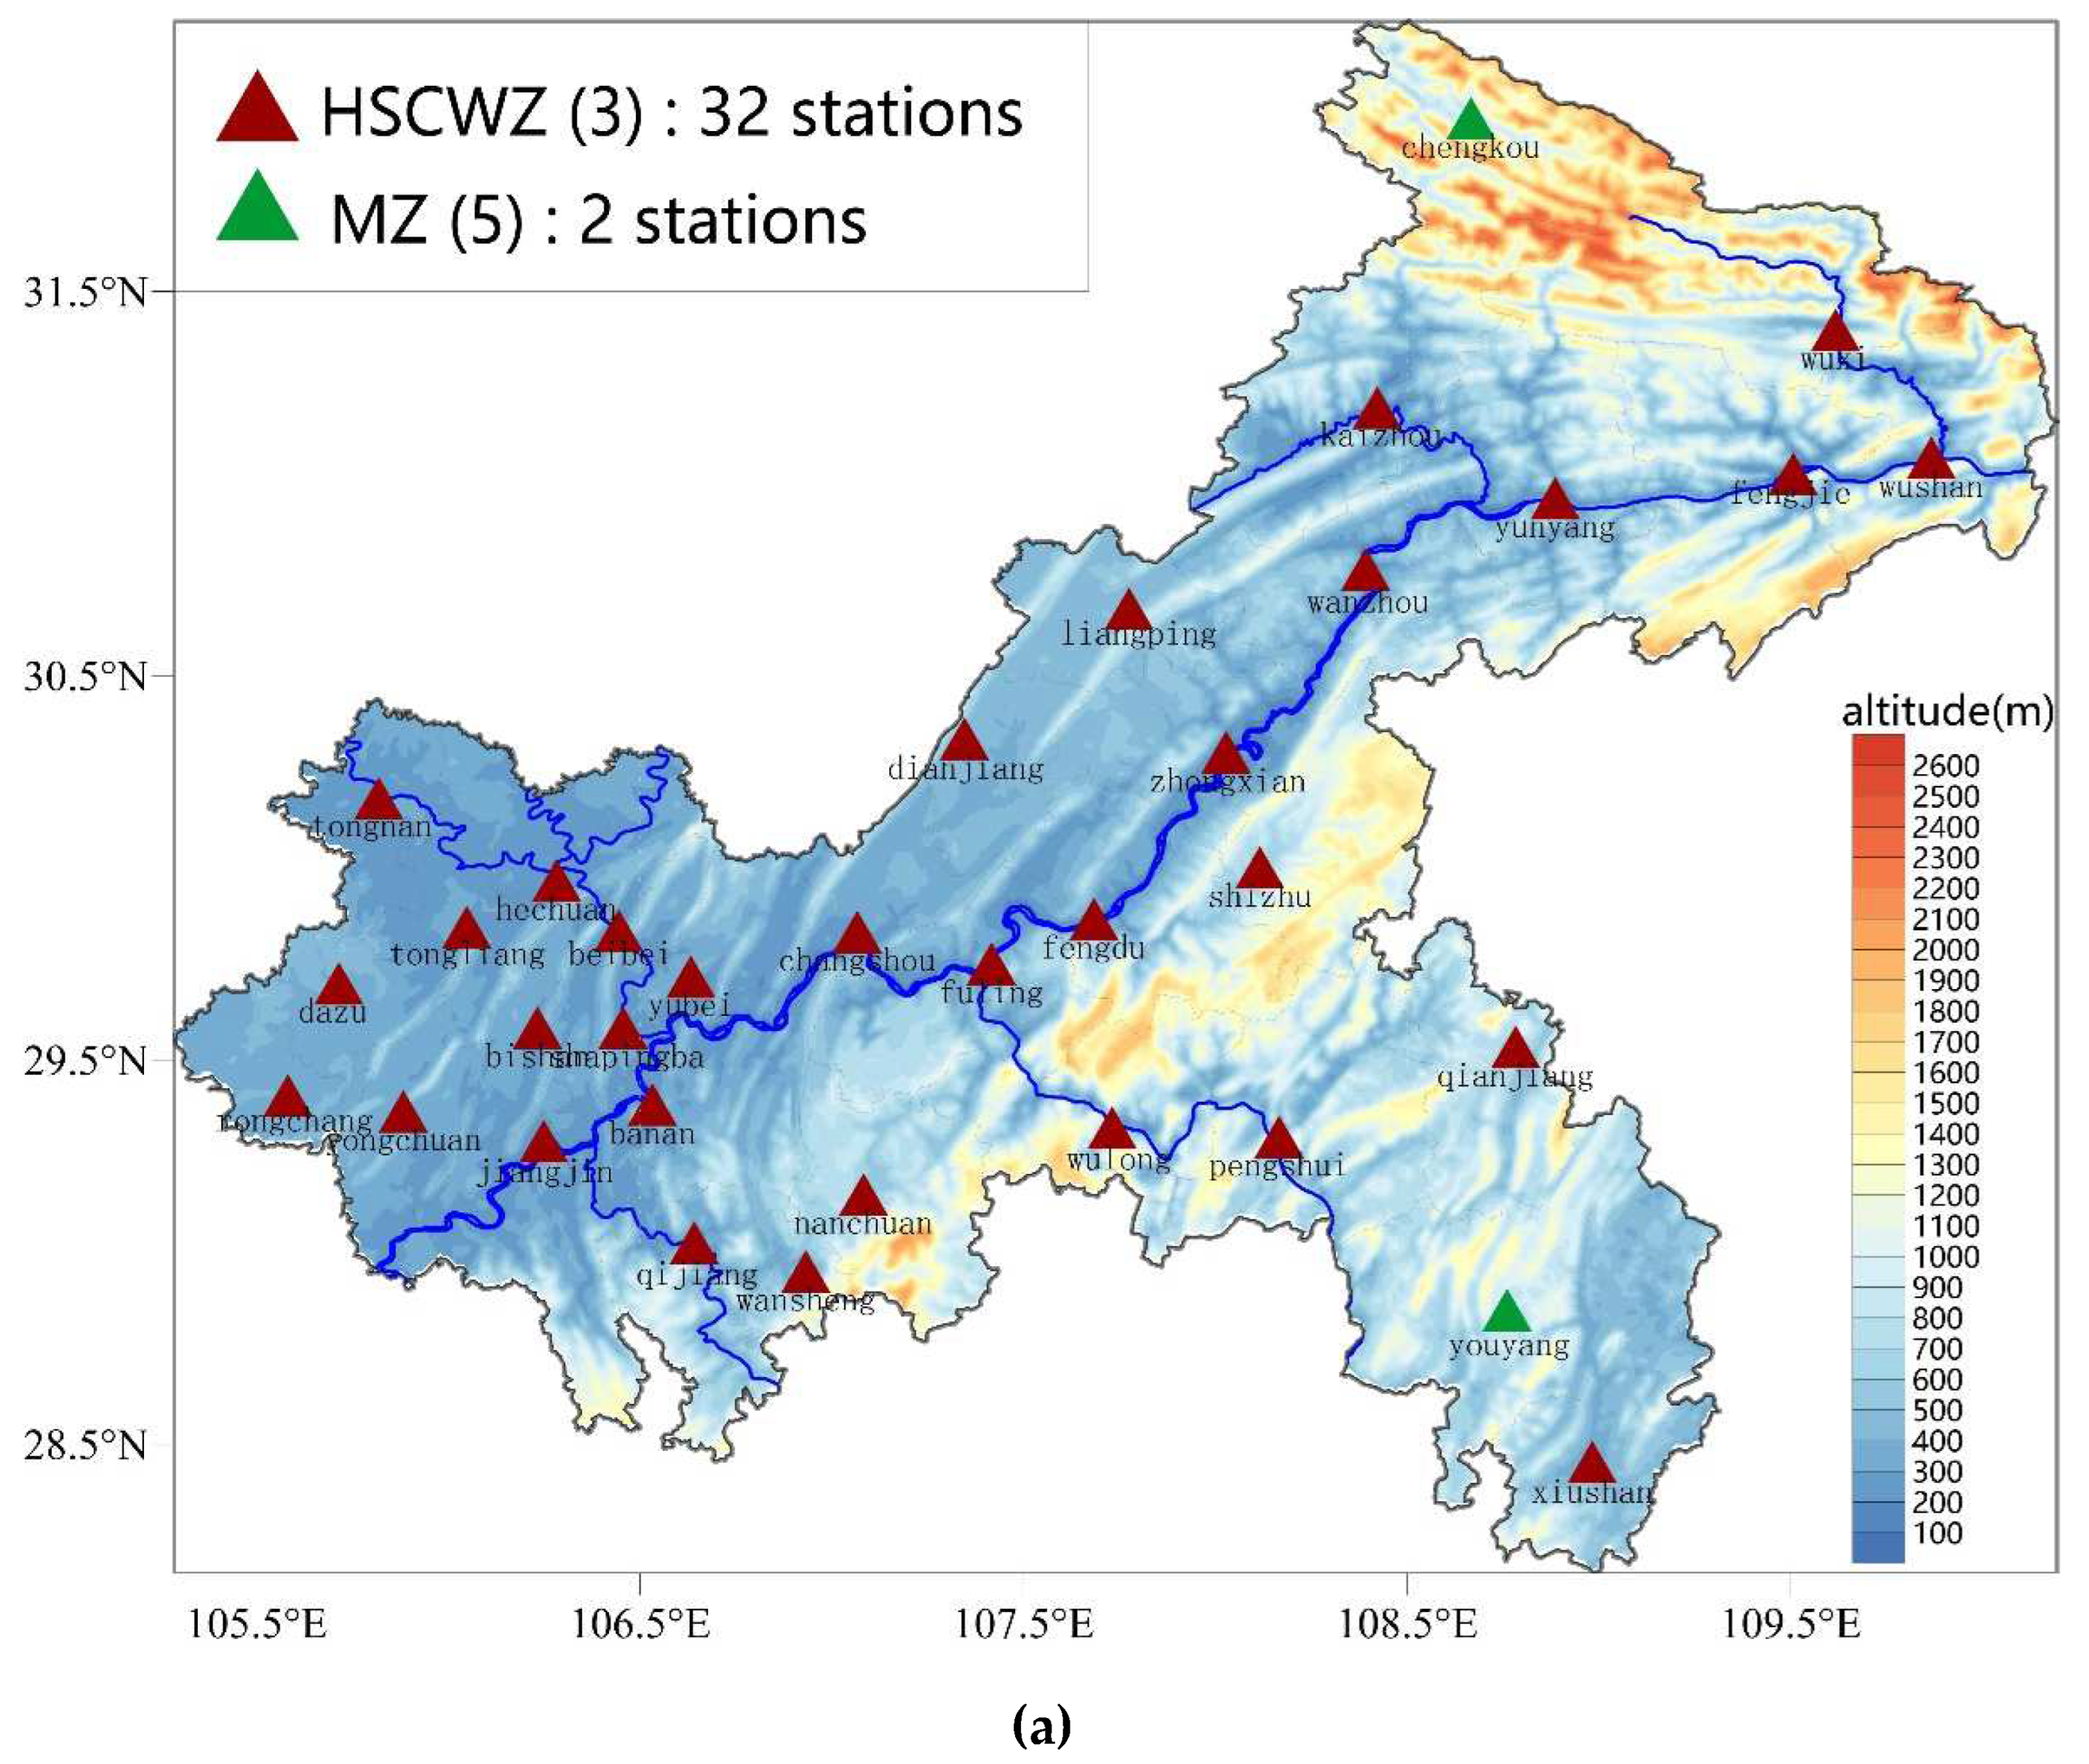
3.3. Refined Climate Zoning Results for Chongqing Building Thermal Design Based on the Chinese National Standard
4. Conclusions
5. Discussion
Author Contributions
Funding
Institutional Review Board Statement
Informed Consent Statement
Data Availability Statement
Acknowledgments
Conflicts of Interest
Nomenclature
| ASHRAE | American Society of Heating, Refrigerating and Air Conditioning Engineers |
| CDD26 | Cooling degree-days based on 26 °C |
| CDD10 | Cooling degree-days based on 10 °C |
| CZ | Cold zone |
| ECMWF | European Centre for Medium-Range Weather Forecasts |
| HDD18 | Heating degree-days based on 18 °C |
| HDD18.3 | Heating degree-days based on 18.3 °C |
| HSCWZ | Hot summer and cold winter zone |
| HSWWZ | Hot summer and warm winter zone |
| MZ | Mild zone |
| NASA | National Aeronautics and Space Administration |
| SCZ | Severe cold zone |
| SCS | Summer climatic severity |
| T1 | Average air temperature in January (°C) |
| T7 | Average air temperature in July (°C) |
| WCS | Winter climatic severity |
References
- National Bureau of Technical Supervision of PRC, Ministry of Construction of PRC. Standard of Climatic Regionalization for Architecture (GB50178-93); China Planning Press: Beijing, China, 1993. (In Chinese) [Google Scholar]
- Givoni, B. Human·Building·Climate; Chen, S.Y., Translator; China Architecture and Building Press: Beijing, China, 1982. (In Chinese) [Google Scholar]
- Walsh, A.; Cóstola, D.; Labaki, L.C. Review of methods for climatic zoning for building energy efficiency programs. Build. Environ. 2017, 112, 337–350. [Google Scholar] [CrossRef] [Green Version]
- Walsh, A.; Cóstola, D.; Labaki, L.C. Performance-based validation of climatic zoning for building energy efficiency applications. Appl. Energy 2018, 212, 416–427. [Google Scholar] [CrossRef] [Green Version]
- Mazzaferro, L.; Machado, R.; Melo, A.P.; Lamberts, R. Do we need building performance data to propose a climatic zoning for building energy efficiency regulations? Energy Build. 2020, 225, 110303. [Google Scholar] [CrossRef]
- Bai, L.J. The Development of Climate Classification for Building Energy Efficiency. Archit. Cult. 2020, 4, 173–175. (In Chinese) [Google Scholar]
- Walsh, A.; Cóstola, D.; Labaki, L.C. Validation of the climatic zoning defined by ASHRAE standard 169–2013. Energy Policy 2019, 135, 111016. [Google Scholar] [CrossRef]
- Spain. Código Técnico de la Edifificación (CTE). 2006. Real Decreto 314/2006 de 17 de Marzo. Madrid. Available online: www.boe.es/boe/dias/2006/03/28/pdfs/A11816-11831.pdf (accessed on 1 July 2021).
- Moral, F.J.; Pulido, E.; Ruíz, A.; López, F. Climatic zoning for the calculation of the thermal demand of buildings in Extremadura (Spain). Theor. Appl. Climatol. 2017, 129, 881–889. [Google Scholar] [CrossRef]
- Verichev, K.; Carpio, M. Climatic zoning for building construction in a temperate climate of Chile. Sustain. Cities Soc. 2018, 40, 352–364. [Google Scholar] [CrossRef]
- BEAR-iD, NOBATEK. European Climate Zones And Bio-Climatic Design Requirements. Brussel: PVSites. 2016. Available online: https://www.pvsites.eu/ (accessed on 1 July 2021).
- International Code Council. IECC-2012-International Energy Conservation Code; Country Club Hills: New York, NY, USA, 2012; pp. C3–C77. [Google Scholar]
- Briggs, R.S.; Lucas, R.G.; Taylor, Z.T. Climate classification for building energy codes and standards: Patr 1—Development Process. ASHRAE Trans. 2003, 109, 109–121. [Google Scholar]
- Briggs, R.S.; Lucas, R.G.; Taylor, Z.T. Climate classification for building energy codes and standards: Part 2—Zone definitions, maps, and comparisons. ASHRAE Trans. 2003, 109, 122–130. [Google Scholar]
- ASHRAE. Weather Data for Building Design Standards: ANSI/ASHREA Standard 169–2006; ASHRAE Inc.: Atlanta, GA, USA, 2006. [Google Scholar]
- ASHRAE. Climatic Data for Building Design Standards: ANSI/ASHREA Standard 169–2013; ASHRAE Inc.: Atlanta, GA, USA, 2013. [Google Scholar]
- ASHRAE. Climatic Data for Building Design Standards: ANSI/ASHREA Standard 169–2020; ASHRAE Inc.: Atlanta, GA, USA, 2020. [Google Scholar]
- ASHRAE. Climatic Data for Building Design Standards: ANSI/ASHREA Standard 169–2021; ASHRAE Inc.: Atlanta, GA, USA, 2021. [Google Scholar]
- Beck, H.E.; Zimmermann, N.E.; McVicar, T.R.; Vergopolan, N.; Berg, A.; Wood, E.F. Present and future Köppen-Geiger climate classification maps at 1-km resolution. Sci. Data 2018, 5, 180214. [Google Scholar] [CrossRef] [Green Version]
- Eshraghi, H.; Ansari, M.; Moshari, S.; Gholami, J. Climatic zoning and per capita demand forecast of Iran using degree-day method. Adv. Build. Energy Res. 2021, 15, 683–708. [Google Scholar] [CrossRef]
- Abebe, S.; Assefa, T. Development of climatic zoning and energy demand prediction for Ethiopian cities in degree days. Energy Build. 2022, 260, 111935. [Google Scholar] [CrossRef]
- Bai, L.J.; Yang, L.; Song, B.; Liu, N. A new approach to develop a climate classification for building energy efficiency addressing Chinese climate characteristics. Energy 2020, 195, 116982.1–116982.14. [Google Scholar] [CrossRef]
- Athalye, R.; Taylor, T.; Liu, B. Impact of ASHRAE Standard 169-2013 on building energy codes and energy efficiency. In Proceedings of the SimBuild 2016 Building Performance Modeling Conference, Salty Lake City, UT, USA, 8–12 August 2016; Volume 6. [Google Scholar]
- Tu, F.X.; Wang, M.J. Climate change and building energy efficiency in China. J. HVAC 1996, 4, 11–15. (In Chinese) [Google Scholar]
- Lam, J.C.; Yang, L.; Liu, J. Development of passive design zones in China using bioclimatic approach. Energy Convers. Manag. 2006, 47, 746–762. [Google Scholar] [CrossRef]
- Lau, C.; Lam, J.C.; Yang, L. Climate classification and passive solar design implications in China. Energy Convers. Manag. 2007, 48, 2006–2015. [Google Scholar] [CrossRef]
- Fu, X.Z.; Zhang, H.L.; Huang, G.D. Discussion of climate regions of building energy efficiency in China. J. HVAC 2008, 38, 44–47. (In Chinese) [Google Scholar]
- Wan, K.; Li, D.; Liu, Y.; Lam, J. Climate classifications and building energy use implications in China. Energy Build. 2010, 42, 1463–1471. [Google Scholar] [CrossRef]
- Zhang, H.L.; Fu, X.Z. Further climate zoning of building energy efficiency based on principal component analysis and cluster analysis. J. HVAC 2012, 42, 119–124. (In Chinese) [Google Scholar] [CrossRef]
- Bai, L.J.; Yang, L. Application of different zoning methods in climatic zoning of building energy efficiency design. J. HVAC 2018, 48, 2–11. (In Chinese) [Google Scholar]
- Bai, L.J.; Wang, S. Definition of new thermal climate zones for building energy efficiency response to the climate change during the past decades in China. Energy 2019, 170, 709–719. [Google Scholar] [CrossRef]
- Liu, Y.L.; Chen, L.; Kang, H.Y.; Sun, S.; Zhou, Y.J.; Zhang, H.C. A study on the variation of building climate zones and heating climate conditions in China. J. Meteorol. Environ. 2020, 36, 97–104. (In Chinese) [Google Scholar] [CrossRef]
- Yang, L.; Lv, K.; Li, H.; Liu, Y. Building climate zoning in China using supervised classification-based machine learning. Build. Environ. 2020, 171, 106663. [Google Scholar] [CrossRef]
- Xiong, J.; Yao, R.; Grimmond, S.; Zhang, Q.L.; Li, B.Z. A hierarchical climatic zoning method for energy efficient building design applied in the region with diverse climate characteristics. Energy Build. 2019, 186, 355–367. [Google Scholar] [CrossRef]
- Hao, Z.; Zhang, X.; Xie, J.; Wang, J.; Liu, J. Building climate zones of major marine islands in China defined using two-stage zoning method and clustering analysis. Front. Archit. Res. 2021, 10, 14. [Google Scholar] [CrossRef]
- Ministry of Housing and Urban-Rural Development, PRC.; General Administration of Quality Supervision, Inspection and Quarantine of PRC. Code for Thermal Design of Civil Buildings (GB 50176-2016); China Architecture and Building Press: Beijing, China, 2016. (In Chinese) [Google Scholar]
- Zhou, J.; Liu, X.R.; Zhu, H.N.; Sun, J.; Wang, Y.L. Effect of climate change on meteorological parameters for building energy-saving design in Chongqing. Meteorol. Environ. Sci. 2020, 43, 88–96. (In Chinese) [Google Scholar] [CrossRef]
- Zhang, T.Y.; Li, Y.H.; Wang, Y.; Cheng, B.Y.; Tang, H.Y. Impact of climate change on cooling energy consumption in Chongqing. J. Chongqing Norm. Univ. (Nat. Sci.) 2012, 29, 36–41. (In Chinese) [Google Scholar]
- Cheng, B.Y.; Zhang, T.Y.; Li, Y.H.; He, Y.K. Chongqing Climate Change Assessment Report; China Meteorological Press: Beijing, China, 2019. (In Chinese) [Google Scholar]
- Encyclopedia of China Publishing House. National Geographic Map of China, 2nd ed.; Encyclopedia of China Publishing House: Beijing, China, 2018. (In Chinese) [Google Scholar]
- Liu, X.N.; Ren, Z.H. Progress in quality control of surface meteorological data. Meteorol. Sci. Technol. 2005, 33, 199–203. (In Chinese) [Google Scholar] [CrossRef]
- Cheng, S.; Li, M.; Sun, M.; Chen, Y.H.; Cao, J.F.; Yuan, S.S. Building climatic zoning under the conditions of climate change in China. Int. J. Glob. Warm. 2019, 18, 173–187. [Google Scholar] [CrossRef]
- Ministry of Housing and Urban-Rural Development of PRC. Standard for Weather Data of Building Energy Efficiency (JGJ/T 346–2014); China Architecture and Building Press: Beijing, China, 2014. (In Chinese) [Google Scholar]
- Ministry of Housing and Urban-Rural Development, PRC. General Code for Energy Efficiency and Renewable Energy Application in Buildings (GB 55015-2021); China Architecture and Building Press: Beijing, China, 2021. (In Chinese) [Google Scholar]
- Rodgers, J.L.; Nicewander, W.A. Thirteen ways to look at the correlation coefficient. Am. Stat. 1988, 42, 59–66. [Google Scholar] [CrossRef]
- Hintze, J.L.; Nelson, R.D. Violin Plots: A Box Plot-Density Trace Synergism. Am. Stat. 1998, 52, 181–184. [Google Scholar] [CrossRef]
- Brassel, K.E.; Reif, D. A Procedure to Generate Thiessen Polygons. Geogr. Anal. 1979, 11, 289–303. [Google Scholar] [CrossRef]
- Liao, D.Q.; Zhu, H.N.; Jiang, P. Study of urban heat island index methods for urban agglomerations (hilly terrain) in Chongqing. Theor. Appl. Climatol. 2021, 143, 279–289. [Google Scholar] [CrossRef]
- Shi, Q.; Gao, J.; Wang, X.; Hong, R.; Cai, W.G.; Wei, H.F. Temporal and Spatial Variability of Carbon Emission Intensity of Urban Residential Buildings: Testing the Effect of Economics and Geographic Location in China. Sustainability 2020, 12, 2695. [Google Scholar] [CrossRef] [Green Version]
- Feist, W. Passive houses in Chinese Climates; China Architecture and Building Press: Beijing, China, 2018. (In Chinese) [Google Scholar]
- Ministry of Housing and Urban-Rural Development, PRC. Standard for Design of Energy Efficiency of Residential Buildings in Moderate Climate Zone (JGJ 475-2019); China Architecture and Building Press: Beijing, China, 2019. (In Chinese) [Google Scholar]


| Climate Zone Definition | Definition |
|---|---|
| Humid zone (A) | Locations that are not marine (C) and not dry (B). |
| Dry zone (B) | (1) Not marine; (2) If 70% or more of precipitation p occurs during the high-sun period, the dry/humid threshold is: p < 20 × (T + 14); (3) If between 30% and 70% of precipitation p occurs during the high-sun period, then the dry/humid threshold is: p < 20 × (T + 7); (4) If 30% or less of precipitation p occurs during the high-sun period, the dry/humid threshold is: p < 20 × T. |
| Marine zone (C) | (1) Mean temperature in the coldest month varies between −3 °C and 18.3 °C; (2) Warmest monthly mean < 22 °C; (3) At least four months with a mean temperature over 10 °C; (4) Dry season in summer. The month with the highest precipitation in the cold season has at least three times as much precipitation as the month with the least precipitation in the rest of the year. |
| Remarks: (1) p = annual precipitation (mm); (2) T = annual mean temperature (°C); (3) Summer or high-sun period ranges from April through September in the Northern Hemisphere and from October through March in the Southern Hemisphere; (4) Winter or cold season ranges from October through March in the Northern Hemisphere and from April through September in the Southern Hemisphere. | |
| Thermal Zone | Zone Name | Zoning Criterion |
|---|---|---|
| 0 | Extremely hot | 6000 < CDD10 |
| 1 | Very hot | 5000 < CDD10 ≤ 6000 |
| 2 | Hot | 3500 < CDD10 ≤ 5000 |
| 3 | Warm | CDD10 ≤ 3500 and HDD18.3 ≤ 2000 |
| 4 | Mixed | CDD10 ≤ 3500 and 2000 < HDD18.3 ≤ 3000 |
| 5 | Cool | CDD10 ≤ 3500 and 3000 < HDD18.3 ≤ 4000 |
| 6 | Cold | 4000 < HDD18.3 ≤ 5000 |
| 7 | Very cold | 5000 < HDD18.3 ≤ 7000 |
| 8 | Subarctic/arctic | 7000 < HDD18.3 |
| Climate Zones | Number of Meteorological Stations | Proportion of Meteorological Stations | Proportion of the Area |
|---|---|---|---|
| CZ | 15 | 0.8% | 1.5% |
| HSCWZ | 1569 | 82.2% | 75.8% |
| MZ | 324 | 17.0% | 22.7% |
Publisher’s Note: MDPI stays neutral with regard to jurisdictional claims in published maps and institutional affiliations. |
© 2022 by the authors. Licensee MDPI, Basel, Switzerland. This article is an open access article distributed under the terms and conditions of the Creative Commons Attribution (CC BY) license (https://creativecommons.org/licenses/by/4.0/).
Share and Cite
Zhang, T.; Chen, X.; Zhang, F.; Yang, Z.; Wang, Y.; Li, Y.; Wei, L. A Case Study of Refined Building Climate Zoning under Complicated Terrain Conditions in China. Int. J. Environ. Res. Public Health 2022, 19, 8530. https://doi.org/10.3390/ijerph19148530
Zhang T, Chen X, Zhang F, Yang Z, Wang Y, Li Y, Wei L. A Case Study of Refined Building Climate Zoning under Complicated Terrain Conditions in China. International Journal of Environmental Research and Public Health. 2022; 19(14):8530. https://doi.org/10.3390/ijerph19148530
Chicago/Turabian StyleZhang, Tianyu, Xianyan Chen, Fen Zhang, Zhi Yang, Yong Wang, Yonghua Li, and Linxiao Wei. 2022. "A Case Study of Refined Building Climate Zoning under Complicated Terrain Conditions in China" International Journal of Environmental Research and Public Health 19, no. 14: 8530. https://doi.org/10.3390/ijerph19148530
APA StyleZhang, T., Chen, X., Zhang, F., Yang, Z., Wang, Y., Li, Y., & Wei, L. (2022). A Case Study of Refined Building Climate Zoning under Complicated Terrain Conditions in China. International Journal of Environmental Research and Public Health, 19(14), 8530. https://doi.org/10.3390/ijerph19148530