Article

Ammonia Emissions from NPK Fertilizer Production Plants: Emission Characteristics and Emission Factor Estimation

1
Climate Change & Environment Research Center, Sejong University, Seoul 05006, Korea
2
Department of Climate and Energy, Sejong University, Seoul 05006, Korea
3
Department of Climate and Environment, Sejong University, Seoul 05006, Korea
*
Author to whom correspondence should be addressed.
Int. J. Environ. Res. Public Health 2022, 19(11), 6703; https://doi.org/10.3390/ijerph19116703
Submission received: 11 May 2022 / Revised: 26 May 2022 / Accepted: 27 May 2022 / Published: 31 May 2022

Abstract

:
Fertilizers are made from manure, but they are also produced through chemical processes. Fertilizer is an ammonia emission source; it releases ammonia when used. Ammonia is also emitted during the production process. Although many studies related to fertilizer application have been conducted, there are few research cases related to the production process and related emissions are not calculated. In this study, the ammonia emissions from NPK (nitrogen phosphorus Potassium oxide) fertilizer production facilities were checked through actual measurement and related characteristics were analyzed. In addition, emission factors were developed, and the necessity of developing emission factors was also confirmed. As a result of the development of the emission factor, it was found to be 0.001 kgNH3/ton, which is like the range of emission factors in related fields. The NPK ammonia emission factor of this study was found to be higher than the minimum emission factor currently applied in South Korea, and it was judged to be a level that can be used as an emission factor.

1. Introduction

The concentration of PM2.5 in South Korea was 19 μg/m3 in 2020, approximately 21% lower than that in the previous year, owing to the COVID-19 pandemic and the implementation of policies on particulate matter [1]. However, the concentration is considerably higher than the strict annual average limit of 5 μg/m3 implemented by the World Health Organization (WHO) in 2021. Additionally, the concentration of PM2.5 in 55 cities in South Korea exceeds the national annual average limit of 15 μg/m3, indicating that the management of particulate matter requires considerable attention [2].
Secondary products account for approximately 72% of fine particulate matter emissions in South Korea. Sources of secondary particulate matter include NH3, NOx, SOx, and volatile organic compounds [3,4]. While South Korea is striving to reduce air pollutants in various ways, current policies are mainly focused on the management of NOx and SOx. Little is known about the emission sources and application of appropriate emission factors of NH3 in South Korea [5,6]. Therefore, relevant studies are required to ensure the reliability of inventories.
NH3 emissions in South Korea were 315,975 tons in 2018. The agricultural sector accounted for the largest proportion (79%) of NH3 emissions, with manure management and cropland sectors as major sources [7,8,9]. NH3 emissions during the application of fertilizers in the cropland sector have been evaluated in several studies. However, NH3 emissions from fertilizer production facilities have not been monitored and only phosphate fertilizers are included in the calculation of PM2.5 emissions during fertilizer production [10]. Therefore, it is necessary to quantify NH3 emissions and calculate and establish an accurate emission factor.
In this study, NH3 emissions were measured at NPK fertilizer production facilities and monthly concentrations and seasonal effects were evaluated in a statistical framework. NH3 emission factors were determined using the measured data and the need to develop a national emission factor was confirmed by comparing newly calculated emission factors with reported values in analogous fields.

2. Methods

2.1. Selection of Facilities

Samples were collected from four NPK fertilizer production facilities to confirm the NH3 concentration and emission characteristics. Facilities that annually produced more than 50,000 tons of NPK fertilizers were selected as targets. Table 1 shows the average annual production amount at the target facilities and the number of samples. Samples were collected for 3 to 4 years. It was attempted to measure the monthly concentration data per facility but since the maintenance period for each facility is different and the annual maintenance period is not the same, more than 25 samples were collected for each facility.

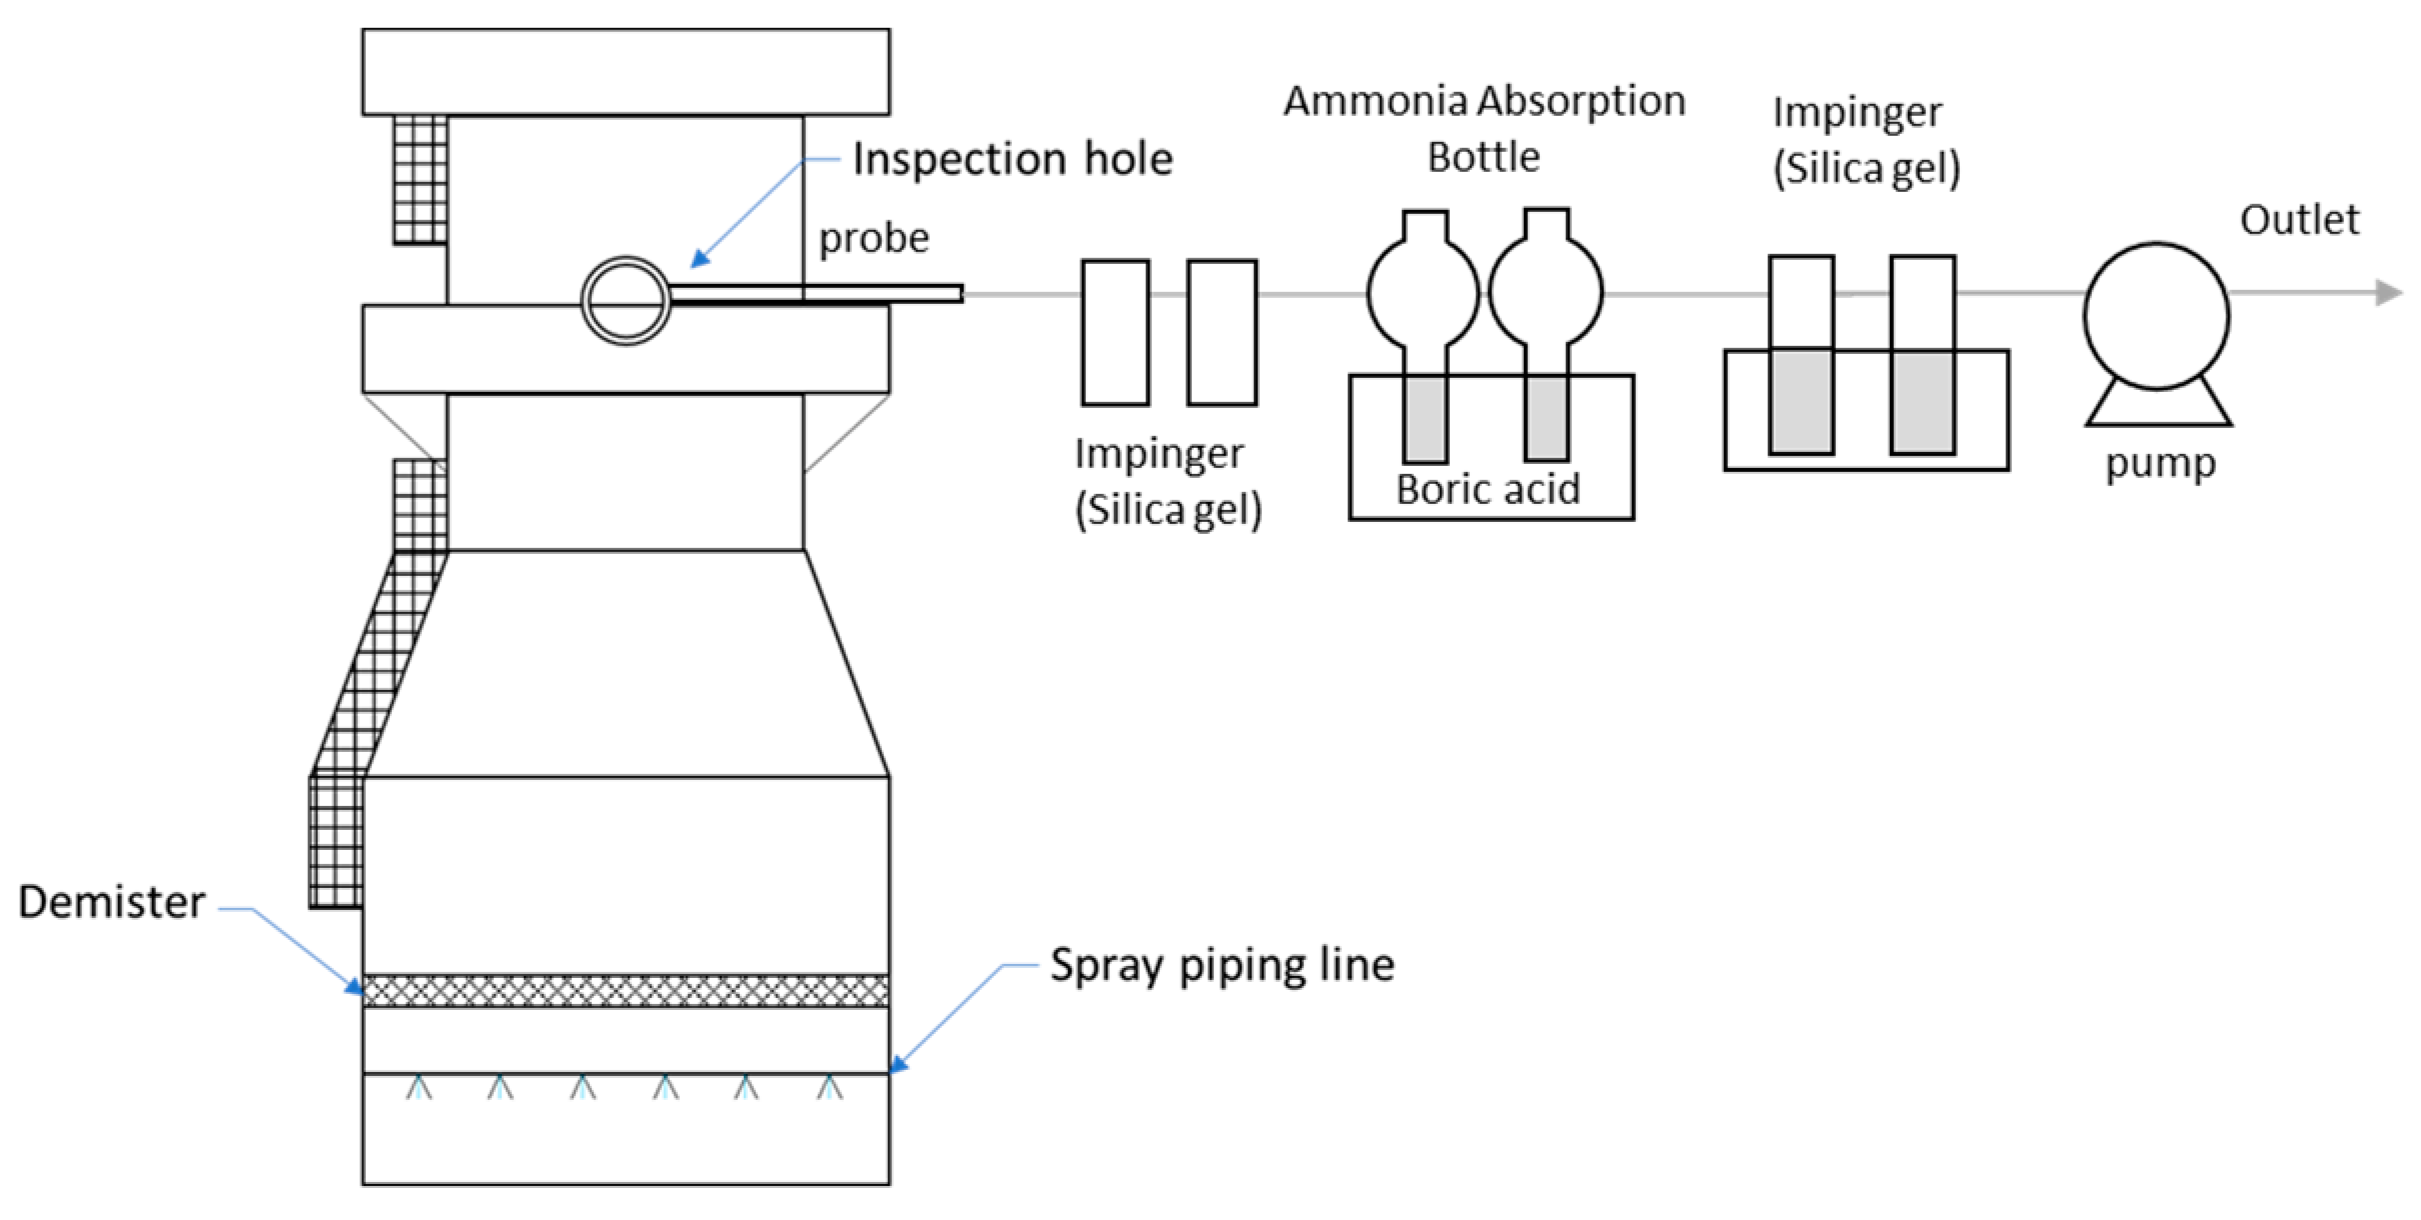
2.2. NH3 Analysis at NPK Fertilizer Production Plants

The indophenol method was used to measure NH3 emissions at the NPK fertilizer production facilities following the standard odor test method and the standard air test method specific to the measurement of NH3 in South Korea [11,12]. In the indophenol method, NH3 is quantified by adding a phenol-sodium nitroprusside solution and a sodium hypochlorite solution to the sample and measuring the absorbance of indophenols produced in the reaction with ammonium ions.
To sample NH3, 25 mL of boric acid was added as an NH3 absorbent in two 50 mL flasks each, then 50 L of exhaust gas was pulled in by a mini-pump (SIBATA MP-ΣNII, Tokyo, Japan) at 4 L/min for about 13 min. Figure 1 shows a schematic diagram of the NH3 sampling technique. The absorbance of the absorbent solution containing NH3 was measured at a wavelength of 650 nm using a spectrophotometer (Shimadzu 17A, Kyoto, Japan). NH3 was sampled through an inspection hole.

2.3. Development of the NH3 Emission Factor at NPK Fertilizer Production Plants

The emission factor of gaseous pollutants (e.g., air pollutants) indicates the number of emissions in a sample and is calculated based on the flow rate and the concentration of the emitted pollutant, accounting for combustion and production [10]. In this study, the equation used in previous studies was adopted to determine the NH3 emission factor for the NPK fertilizer production facilities, as shown in Equation (1) [13,14]. The flow rate and NPK fertilizer production amount necessary to develop the NH3 emission factor for the NPK fertilizer production facilities were obtained from the data provided by the target facilities, and the daily mass flow rate was used.
E F N H 3 = [ C N H 3 × M w V m × Q d a y × 10 6 ] / F C d a y
where E F is the emission factor (kg NH3/ton), C N H 3 is the NH3 concentration in exhaust gas (ppm), M w is the molecular weight of NH3 (constant) = 17.031 (g/mol), V m is one mole ideal gas volume in standardized condition (constant) = 22.4 (10−3 m3/mol), Q d a y is the daily accumulated flow rate (Sm3/day) (based on dry combustion gas), and F C d a y is the daily NPK production (ton/day).

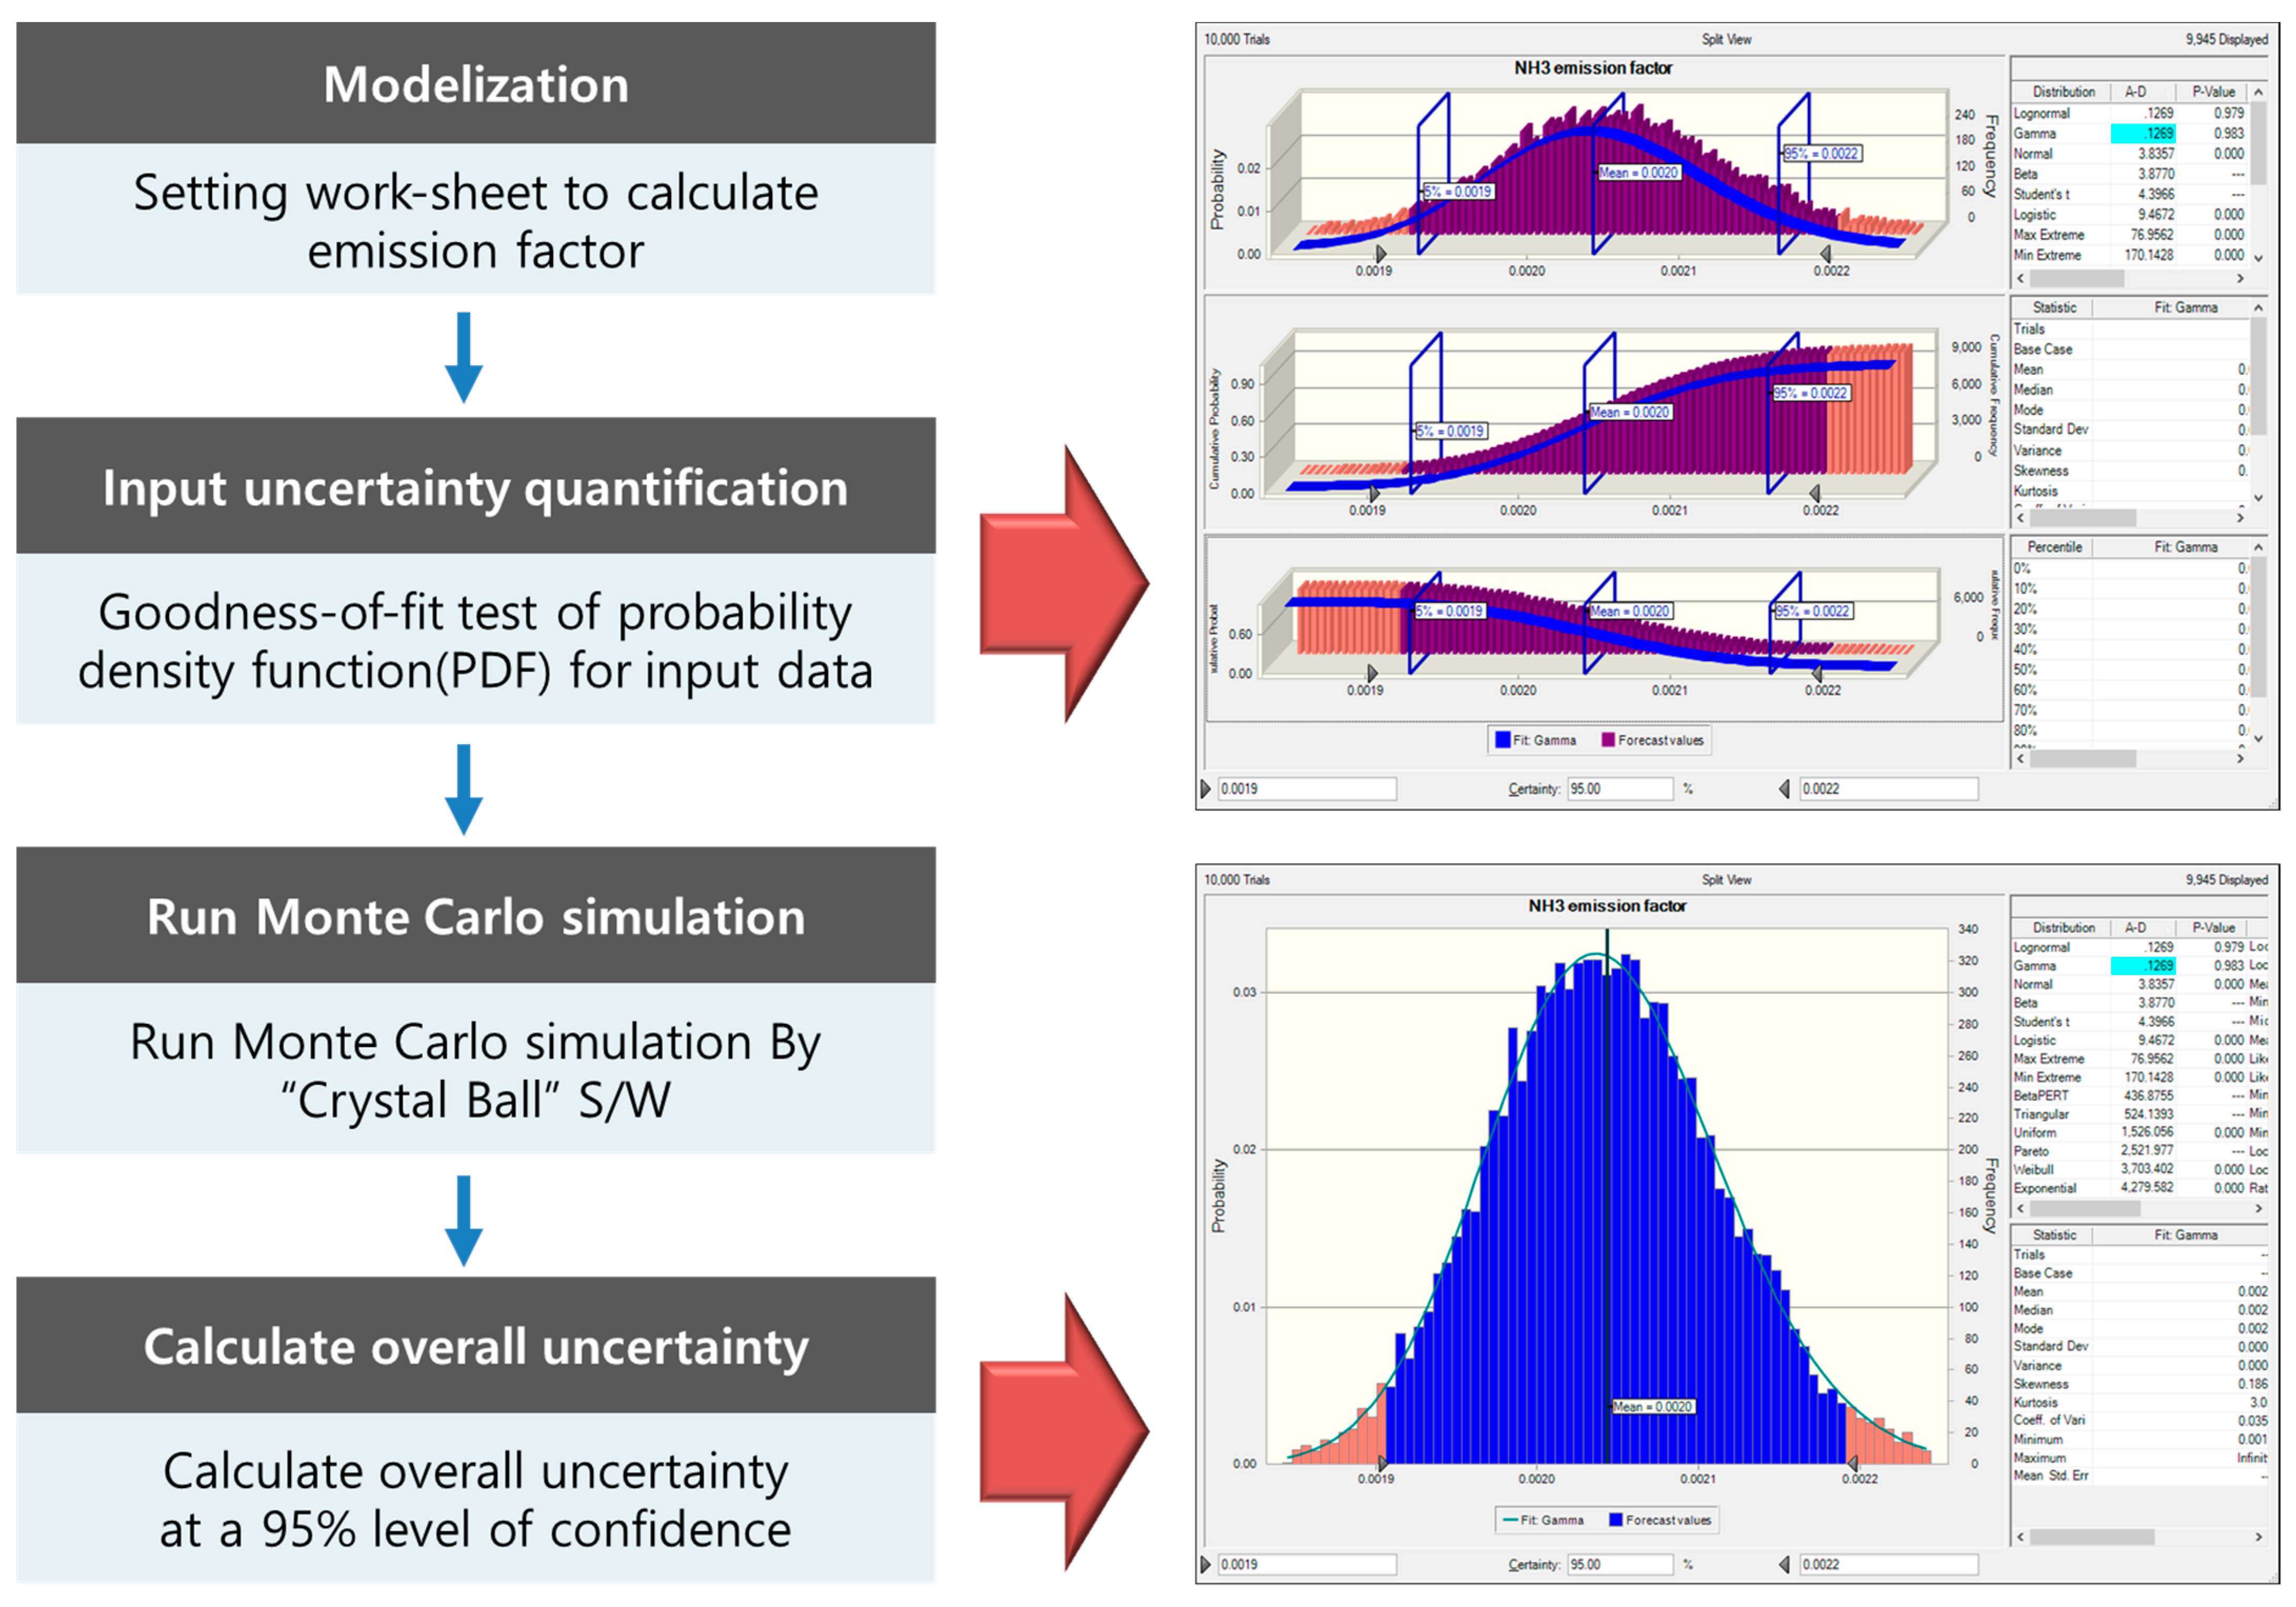
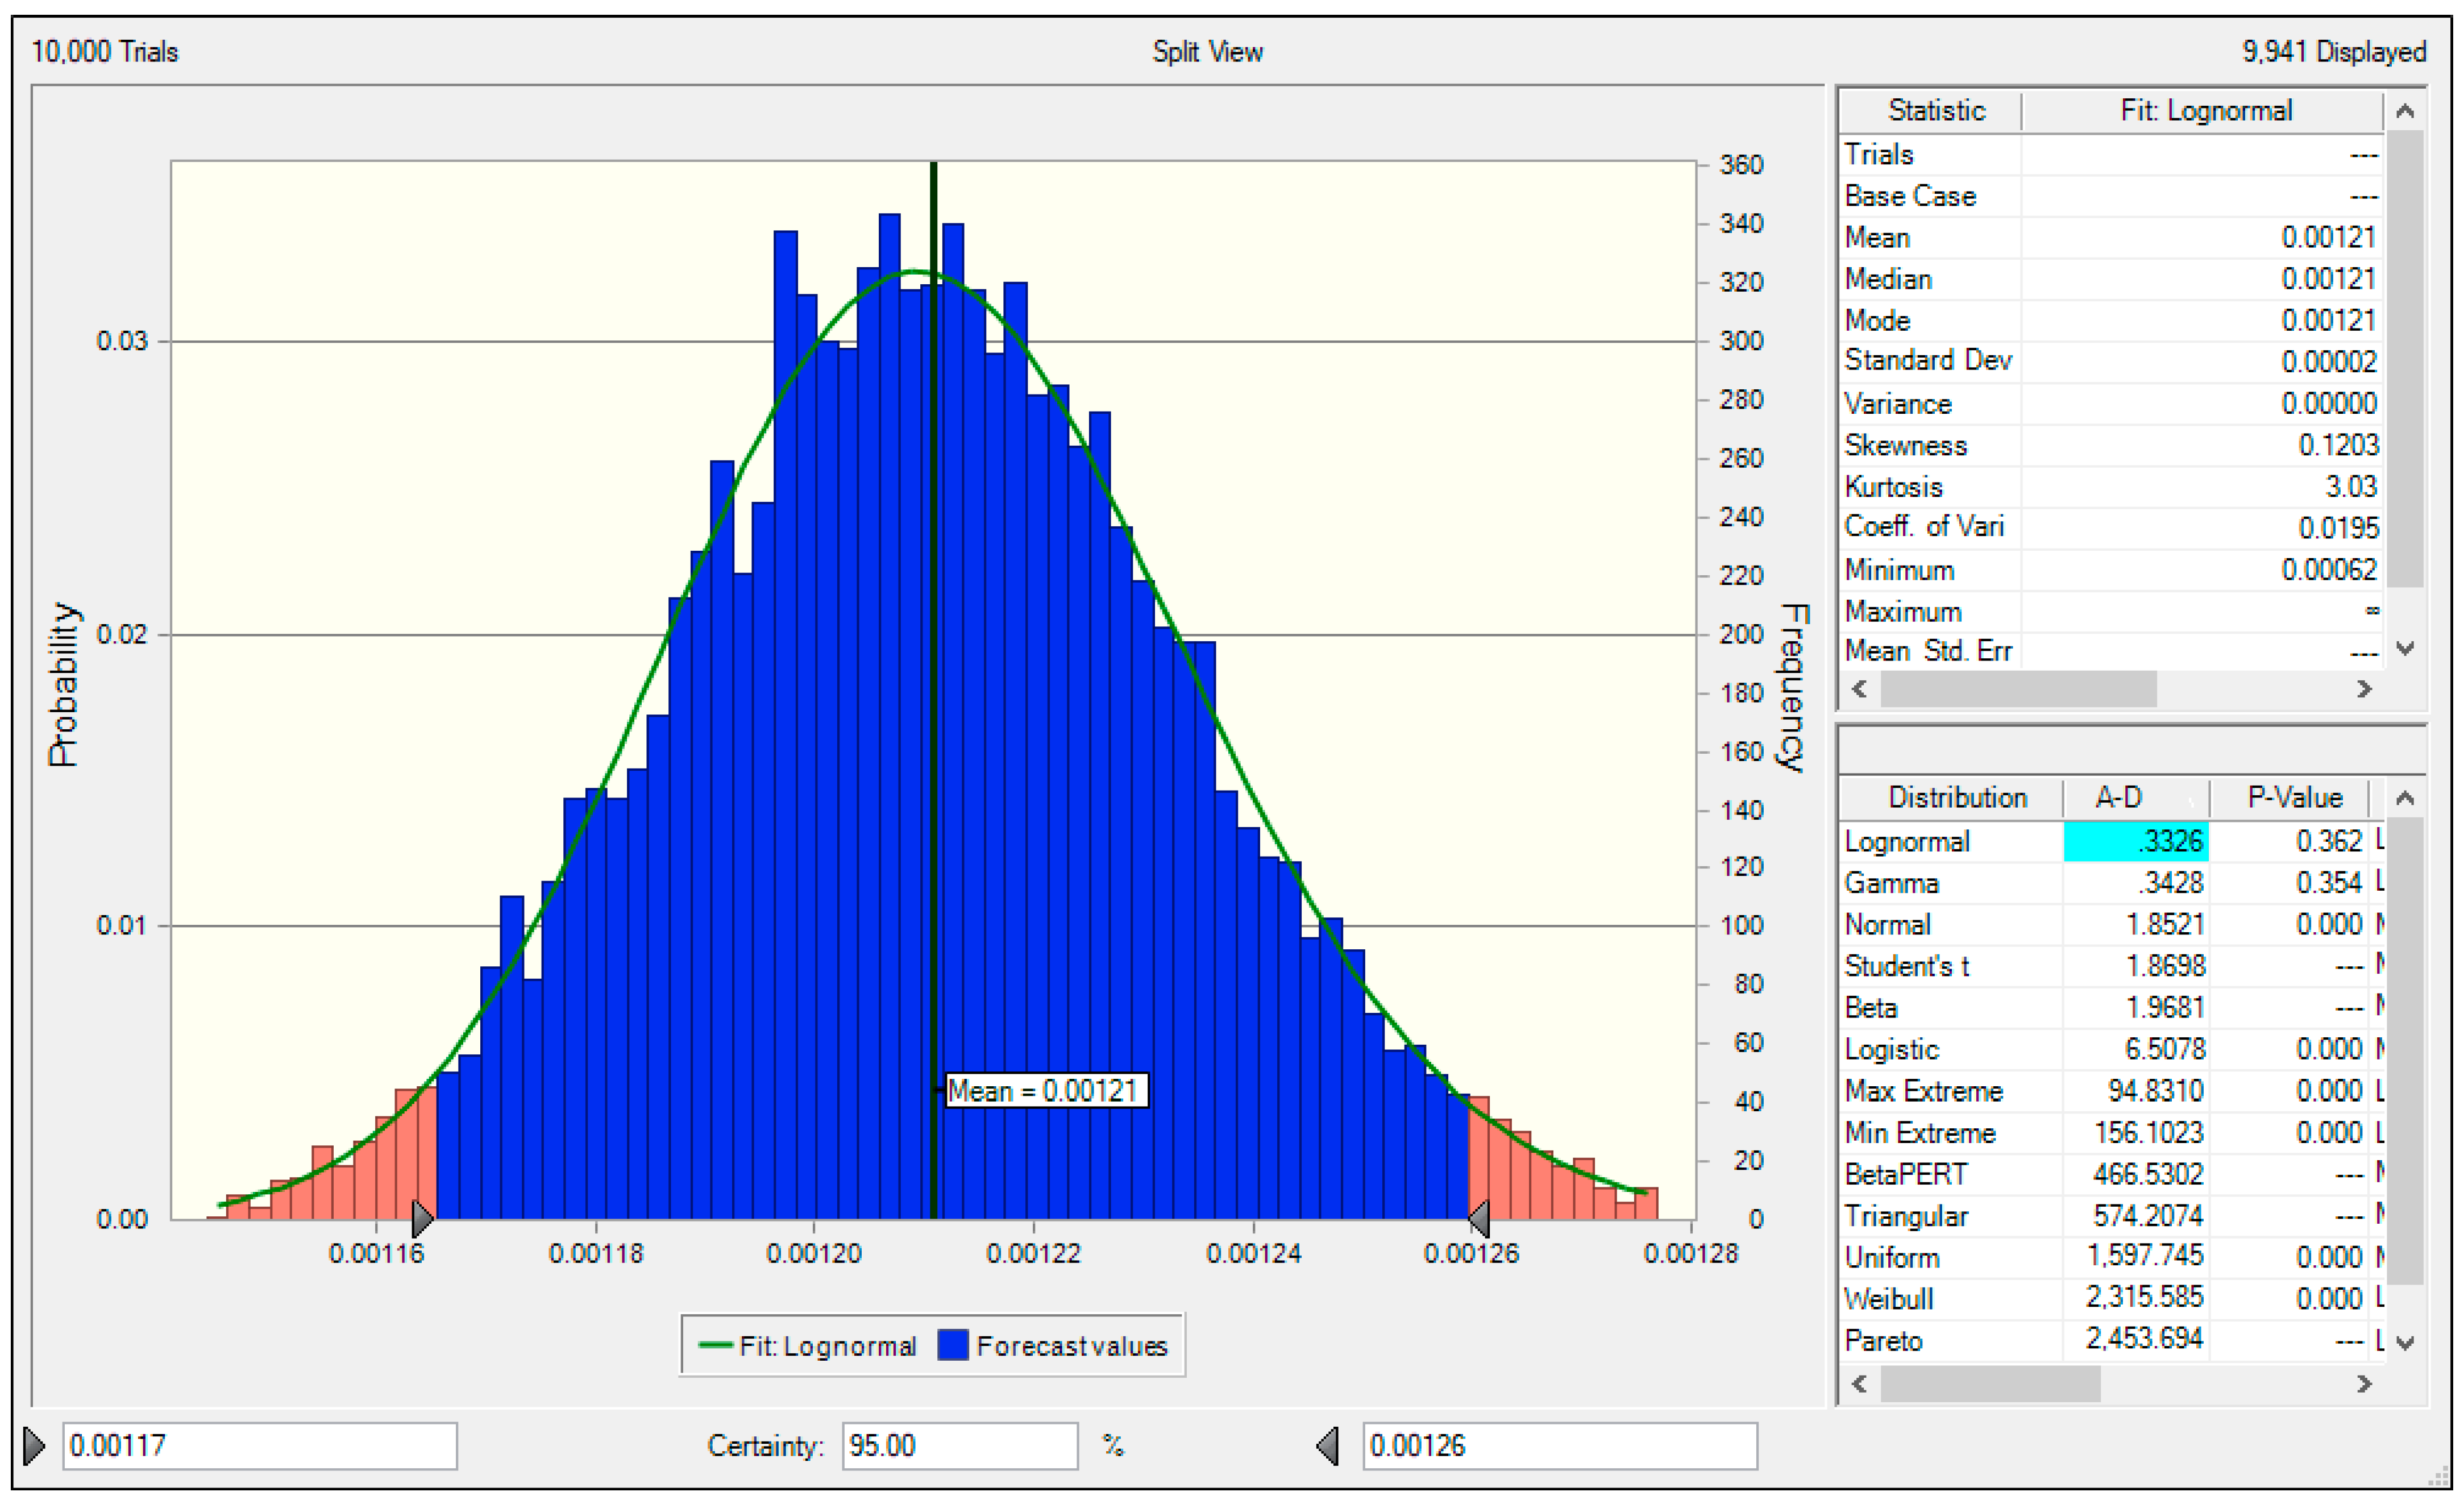
2.4. Uncertainty Analysis of the NH3 Emission Factor Using a Monte Carlo Simulation

In South Korea, the uncertainty of air pollutant emission estimates was identified in accordance with the EPA Data Attribute Rating System (DARS) methodology, which is based on expert input [15,16]. However, the European EMEP/EEA suggests that quantitative uncertainty assessments of emission factors should be conducted in accordance with the methodology of IPCC 2006 in greenhouse gas inventories [17]. In this study, the Monte Carlo simulation proposed by IPCC 2006 was used to quantitatively evaluate the uncertainty of the NH3 emission factor [18]. Widely used in environmental fields, Monte Carlo simulations can be used to evaluate uncertainty by random sampling and specifying a probability density function (PDF) for input variables [19,20]. The Monte Carlo simulation consists of four stages, as summarized in Figure 2. In the first step, a model is selected. For this, a worksheet is constructed to calculate the greenhouse gas emission factor. Second, the PDF of the input variables is validated. In this study, the significance level for testing the hypothesis was set at 5%. Then, the PDF is calculated for each variable through fitness analysis of the data required for NH3 emission factor estimation, such as the NH3 emission concentration, emission flow rate, and fertilizer production amount. Third, the Monte Carlo simulation is performed using the Crystal Ball program for simulations with random sampling. Fourth, the uncertainty range at the 95% confidence interval is calculated based on the simulation results.

3. Results and Discussion

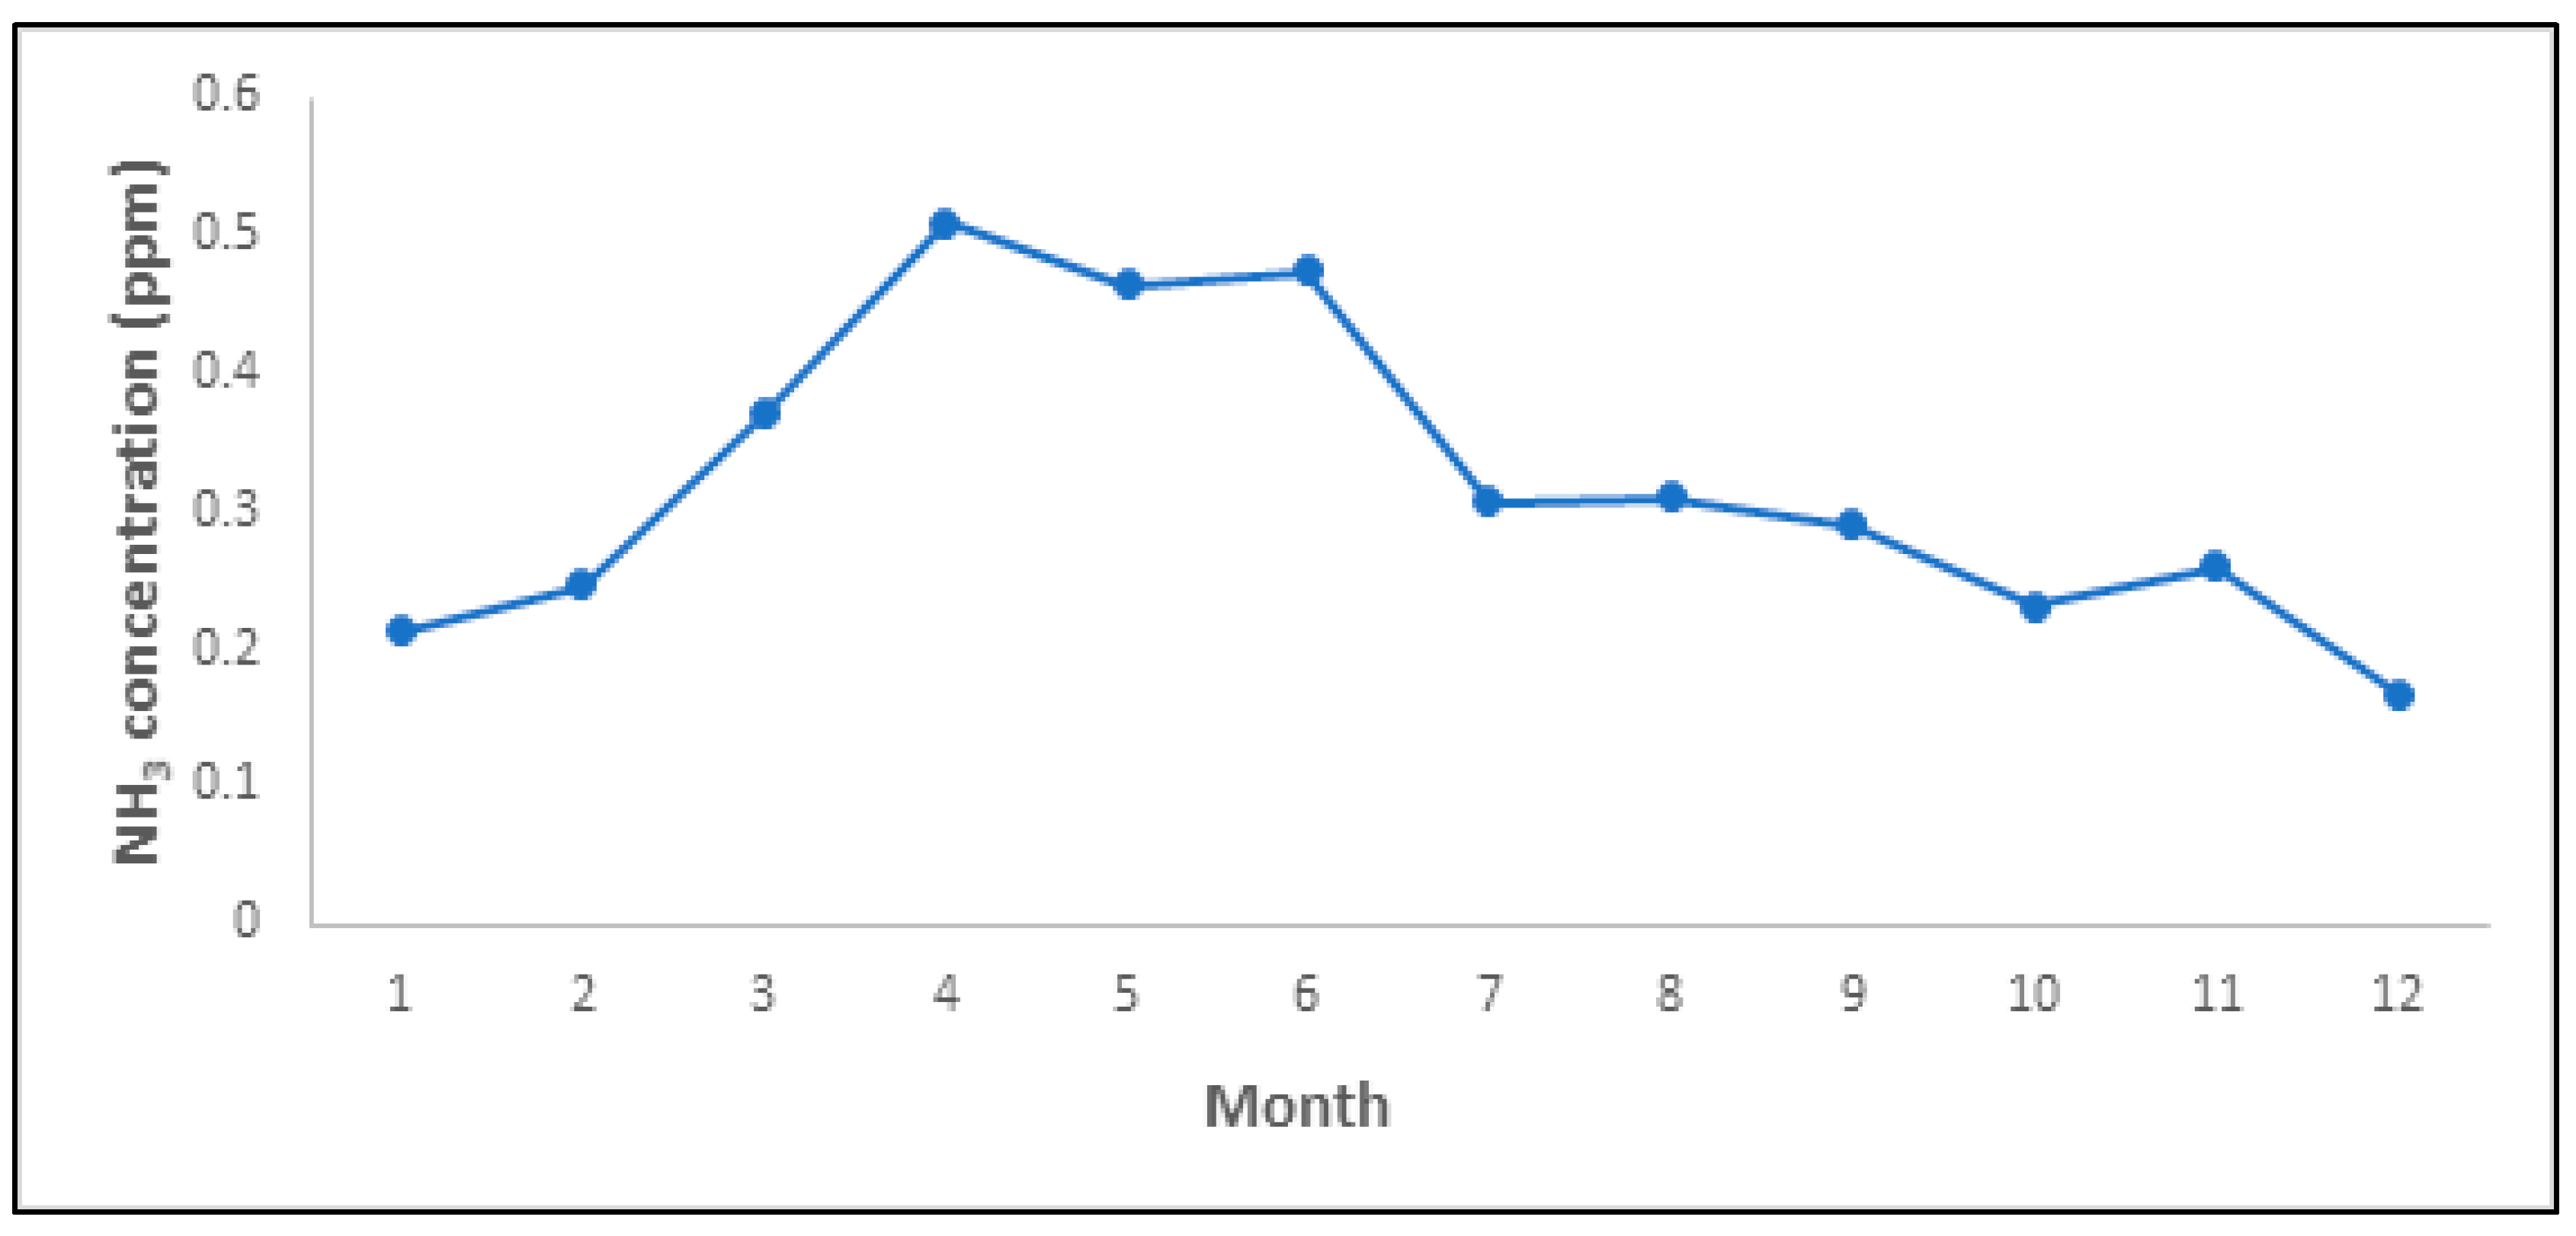
3.1. Characteristics of NH3 Emissions at NPK Fertilizer Production Plants

Table 2 shows the NH3 concentrations at the NPK fertilizer production facilities (referred to as facilities A–D). The NH3 concentration at the NPK fertilizer production facilities ranged from 0.01 ppm to 1.48 ppm.
The concentration at facility A ranged from a minimum of 0.01 ppm to a maximum of 1.48 ppm, with an average value of 0.32 ppm and a standard deviation of 0.33 ppm. The concentration at facility B ranged from 0.01 ppm to 0.82 ppm, with an average concentration of 0.18 ppm and a standard deviation of 0.33 ppm. The concentration at facility C ranged from 0.06 ppm to 1.14 ppm, with an average of 0.43 ppm and a standard deviation of 0.28 ppm. The concentration at facility D ranged from 0.01 ppm to 1.31 ppm, with an average of 0.35 ppm and a standard deviation of 0.27 ppm.
To understand the temporal characteristics of NH3 emissions at the NPK fertilizer production facilities, trends in the monthly average concentrations of NH3 were examined (Figure 3). In the case of NPK fertilizer manufacturing facilities, depending on the facility, the maintenance period may be as low as 1 month to as high as 3 months. In this study, in order to confirm the monthly NH3 emission concentration of the overall NPK fertilizer manufacturing facilities, the monthly average data of the four facilities were used to confirm the temporal emission characteristics. The concentration was the highest from March to June. These high concentrations could be attributed to the high activity during this period, if the NPK fertilizer production amount at the target facilities (8000–9000 tons/month) exceeded the monthly average of 6926 tons/month.
Furthermore, the seasonal differences in NH3 emitted from the NPK fertilizer production facilities were analyzed. Table 3 shows the NH3 concentration data for different seasons. The average concentration was the highest in the spring (0.45 ppm), followed by the summer, fall, and winter. These results are consistent with those of the analysis of monthly average concentrations, revealing that NH3 emissions were high in the spring months of March to May and in the summer month of June.
For statistical analyses, SPSS 21 (IBM, New York, NY, USA) was used to verify the normality of the NH3 concentration data (to determine whether parametric or nonparametric statistical tests should be applied) and to analyze differences among seasons.
In general, the Kolmogorov–Smirnov (K–S) and Shapiro–Wilk tests are widely used to test normality, depending on the number of samples. The K–S test is typically used when the number of samples is greater than 2000, whereas the Shapiro–Wilk test is used when there are fewer than 2000 samples.
In these tests, the null hypothesis is that the data are normally distributed and this hypothesis is rejected when p < 0.05. To confirm the seasonal effect, mean values can be compared using one-way ANOVA (for normally distributed data) and Kruskal–Wallis tests (for non-normal distribution).
In this study, concentration data obtained at the NPK fertilizer production facilities were evaluated for normality, as shown in Table 4. Since the sample size of the NH3 concentration estimates was less than 2000, normality was tested using the Shapiro–Wilk method, revealing a non-normal distribution. Accordingly, the Kruskal–Wallis test was used to analyze seasonal differences.
The seasonal differences in the NH3 concentration of the NPK fertilizer production facilities were analyzed using the Kruskal–Wallis test and the results are summarized in Table 5. Based on the Kruskal–Wallis test, the seasonal differences were significant (p < 0.05).
When the null hypothesis is rejected, a post hoc test must be conducted. The post hoc test, used to identify the cause of the seasonal differences, can be performed by reviewing the seasonal response data. The results of this analysis are provided in Table 6. The difference in emissions between the spring and winter was significant (p < 0.05), indicating seasonal differences in the overall result. While most seasonal differences were not significant, the difference in concentrations between the spring and winter was significant, which should be considered when developing the corresponding emission factor.

3.2. NH3 Emission Factor and NH3 Emissions at NPK Fertilizer Production Plants

In this study, 139 NH3 samples were collected from four NPK fertilizer production facilities to calculate the NH3 emission factor (Table 7). The overall NH3 emission factor for the NPK fertilizer production facilities was 0.001 kg NH3/ton. The NH3 emission factor for most facilities was 0.001 kg NH3/ton; however, that of facility C was 0.002 kg NH3/ton. This is consistent with the observation that facility C had the highest NH3 concentration.
Although the emission factor of the NPK fertilizer production facilities should be compared to emission factors in other regions and countries, related studies are lacking. Therefore, the emission factors in analogous fields were used for comparison, confirming the necessity to develop a national NH3 emission factor.
Additionally, since this study was mainly focused on large-scale sites that were well-equipped with elutriation-type odor prevention facilities, such as scrubbers, absorption towers, and wet scrubbers, the concentrations of NH3 were low. We attempted to measure NH3 concentrations prior to the implementation of preventive measures; however, receiving cooperation from companies was difficult owing to safety issues. Therefore, the NH3 emission factor was estimated at sites with no prevention facilities to investigate the prevention efficiency and an uncontrolled emission factor was proposed by calculating an additional emission factor based on the concentration without the application of preventive measures. Regarding the treatment efficiency of the prevention facilities, we were able to obtain relevant data through an interview with the person in charge of the relevant facility.
Analysis of the effectiveness of the prevention facilities revealed that all target companies exhibited a treatment efficiency of 90% or higher. Therefore, a treatment efficiency of 90% was used for the prevention facilities for the calculation of the emission factor, as shown in Equation (2).
C I N P U T = C O U P U T 1 E P
where C I N P U T is the NH3 concentration at the front of the prevention facilities (ppm), C O U P U T is the NH3 concentration at the back of the prevention facilities output (ppm) and E p is the effectiveness of the prevention facilities.
Table 8 shows a comparison between foreign NH3 emission factors reported in analogous fields, uncontrolled NH3 emission factors without considering the efficiency of prevention facilities, and NH3 emission factors calculated at the final emission outlet.
Since no reports of NH3 emission factors at NPK fertilizer production facilities were found, emission factors for the NH3 production sector in the same chemical industry were used for comparison. In the comparative analysis, the NH3 emission factor at the final outlet following treatment by the prevention facilities demonstrated a 50-fold difference. The NH3 emission factor in the absence of prevention facilities showed a 5-fold difference. However, the NH3 emission factor in this study was comparable to the lower limit of the NH3 emission factor of the NH3 production facilities at the 95% confidence level, suggesting that our results were valid. Furthermore, the uncontrolled NH3 emission factor fell between the upper and lower limits of the foreign emission factor and was valid.
Among the NH3 emission factors currently applied in South Korea, the factor used for bituminous coal is the smallest (0.00028 kgNH3/ton), approximately 3.5 times higher than the values obtained in this study. Therefore, it is necessary to develop and apply an NH3 emission factor from the perspective of inventory.

3.3. Uncertainty in the NH3 Emission Factor at NPK Fertilizer Production Plants

A Monte Carlo simulation was used to evaluate the uncertainty of the NH3 emission factor for the NPK fertilizer production facilities calculated in this study (Figure 4). The Monte Carlo simulation was implemented in Crystal Ball.
The PDF of the NH3 emission factor for the NPK fertilizer production facilities calculated in this study had a lognormal distribution. The mean value was 0.00121 kgNH3/ton and the lower 2.5% and upper 97.5% quantiles at the 95% confidence level were 0.00117 tonNH3/m3 and 0.00126 tonNH3/m3, respectively. Based on these values, the uncertainty of the calculated NH3 emission factor at the 95% confidence level was −3.3% to +4.4%.
The lack of reported point estimates or ranges for the NH3 uncertainty makes comparative analyses difficult. Insufficient NH3 emission factor values for fertilizer production facilities are available for comparison. However, according to the EMEP/EEA inventory guidebook, when the uncertainty of an emission factor is in the range of 10% to 30%, the emission factor is classified as Grade A. The NH3 emission factors in this study were classified as Grades D–E, indicating that the uncertainty of the emission factors in this study was high [21].
In the case of South Korea, the uncertainty of air pollutant emission estimates is evaluated in accordance with the DARS method proposed by the EPA of the United States [16]. In the DARS method, scores are assigned to reflect the characteristics of the inventory; however, this often depends on expert opinions and may be influenced by subjectivity. According to the European EMEP/EEA Air Pollution Inventory Guidebook, the uncertainty of pollutant emissions needs to be quantitatively assessed, in a similar manner to that used for greenhouse gases. In particular, the IPCC guideline for calculating greenhouse gas emissions involves Monte Carlo simulations (Approach 2), like the method used to evaluate uncertainty in this study. The IPCC recommends that air pollutant emissions are also reported as indirect greenhouse gases when reporting greenhouse gas emissions [22]. Therefore, it is necessary to develop an uncertainty range for the consistent evaluation of air pollutants and greenhouse gases.

4. Conclusions

In this study, NH3 was confirmed to be an important omitted source of emissions, as determined by the calculation of NH3 emission factors based on field measurement. Our findings reveal the importance of developing a national NH3 emission factor in South Korea.
Field measurements were performed for 3 years at four NPK fertilizer production facilities and these data were used to calculate NH3 emission factors. The concentration of NH3 emitted from the NPK fertilizer production facilities was 0.01–1.48 ppm. To understand the temporal characteristics of NH3 emissions at the NPK fertilizer production facilities, the trends in monthly average NH3 concentrations were examined. The concentration was the highest from March to June, overall. This result was cross-checked against other relevant data, which indicated that the facilities were running the most actively during this period, with the production of NPK fertilizers (8000–9000 tons/month) higher than the average monthly fertilizer production.
In this study, seasonal differences and causes of variation were characterized. The analysis confirmed significant seasonal differences; in particular, emissions in the spring and winter were significantly different. This was consistent with the analysis results of monthly concentrations and could be attributed to the relatively active fertilizer production during the spring and relatively low production during the winter, resulting in a significant difference. Therefore, data for all seasons should be acquired to ensure the reliability of emissions factors.
The newly calculated NH3 emission factor was comparable to the lower limit of the emission factors in analogous fields overseas but was greater than the smallest NH3 emission factor applied in South Korea, confirming the need for the development of an NH3 emission factor at the national level.
Analyses of quantitative uncertainty are important when developing emission factors. In this study, Monte Carlo simulations were used to calculate quantitative uncertainty, as suggested in the IPCC guidelines. The PDF for the NPK fertilizer production facilities exhibited a lognormal distribution and the uncertainty range was −3.3% to +4.4% at a 95% confidence level, equivalent to Grade A according to the European EMEP/EEA uncertainty evaluation system. Therefore, the emission factor calculated in this study was reliable to some degree.
The key findings and implications of the study are as follows.
  • The NH3 emissions from NPK fertilizer production facilities that do not monitor NH3 were confirmed and quantitatively evaluated and the corresponding NH3 emission factor was calculated.
  • Based on data measured over 3 years, monthly NH3 concentration trends and seasonal characteristics at the NPK fertilizer production facilities were examined and the cause of the seasonal differences was statistically analyzed.
  • The need for a national emission factor was confirmed by comparing the NH3 emission factor for the NPK fertilizer production facilities calculated in this study with emission factors reported in analogous cases and those applied in South Korea.
  • The recent Paris Agreement requires more countries to report greenhouse gas emissions. The relevant reporting system also recommends reporting air pollutants as indirect greenhouse gases. In Europe, the reliability of emission factors and emission amounts should be in compliance with air pollutant inventory guidelines. In South Korea, the uncertainty of emission factors and emission amounts are evaluated using an expert input-based ranking evaluation method suggested by the U.S. EPA. However, a quantitative uncertainty assessment is required to ensure the same level of reliability applied to greenhouse gas inventories, as recommended by the European EMEP/EEA.
In this study, uncertainty in the NH3 emission factor was evaluated using Monte Carlo simulations, the evaluation method used for greenhouse gases. The quantitative uncertainty estimates provide reference values for other researchers.
Since this study focused on the need to address omitted emission sources by analyzing the NH3 emission characteristics and emission factor, this study was limited to a small number of facilities and the results do not reflect emissions from small-scale facilities without preventive measures. The future development of NH3 emission factors based on a larger number of facilities will improve the reliability of NH3 inventories in the fertilizer production facility sector and, furthermore, will contribute to the establishment of policies for the reduction of PM2.5.

Author Contributions

All authors contributed to the research presented in this work. Their contributions are presented below. Conceptualization, E.-c.J.; methodology and writing—original draft preparation, S.K.; methodology, J.R.; analysis, G.K. All authors have read and agreed to the published version of the manuscript.

Funding

This work is supported by the Korea Ministry of Environment (MOE) and Korea Environment Corporation.

Institutional Review Board Statement

Not applicable.

Informed Consent Statement

Not applicable.

Data Availability Statement

Data sharing not applicable.

Acknowledgments

This work is financially supported by the Korea Ministry of Environment (MOE) as “Graduate School specialized in Climate Change”.

Conflicts of Interest

The authors declare no conflict of interest.

References

  1. National Institute of Environmental Research. Annual Report on the Air Quality 2020; National Institute of Environmental Research: Incheon, Korea, 2021. [Google Scholar]
  2. IQAir. 2020 World Air Quality Report; IQAir: Goldach, Switzerland, 2020; p. 14. [Google Scholar]
  3. Ministry of Environment. Fine Dust, What Is It? Ministry of Environment: Incheon, Korea, 2016. [Google Scholar]
  4. Ministry of Environment. Management Strategies to Reduce PM-2.5 Emission; Ministry of Environment: Incheon, Korea, 2017. [Google Scholar]
  5. Shin, D.W. Management Strategies to Reduce PM-2.5 Emission: Emphasis-Ammonia; Korea Environment Institute: Sejong, Korea, 2017; pp. 1–2. [Google Scholar]
  6. National Institute of Environmental Research. A Study on Improving the Reliability and Accuracy of Air Pollutant Emissions; National Institute of Environmental Research: Incheon, Korea, 2018. [Google Scholar]
  7. Ku, H.H. Measurement of Soil Surface and Plant Canopy Ammonia Fluxes in Red Pepper Field Using Dynamic Chamber Method. Korean J. Soil Sci. Fertil. 2020, 53, 644. [Google Scholar] [CrossRef]
  8. Kim, M.W.; Hong, S.H.; Yoo, S.Y.; Kim, J.H. Evaluation of Ammonia Emission Coefficient according to the use of Compound Fertilizers when Cultivating Apples and Pears in Orchards. J. Korean Soc. Environ. Agric. 2021, 40, 366–372. [Google Scholar] [CrossRef]
  9. Oh, Y.G.; Park, J.S.; Hong, S.W. A study on the establishment of an agricultural ammonia emission inventory and regional unit emission coefficient calculation model to respond to fine dust in the agricultural sector. Rural. Resour. 2020, 62, 24–31. [Google Scholar]
  10. National Air Emission Inventory and Research Center. National Air Pollutant Emission Estimation Manual (IV); National Air Emission Inventory and Research Center: Chung-ju Si, Korea, 2020. [Google Scholar]
  11. Ministry of Environment in Korea. Standard Method of Odor Compounds; Ministry of Environment in Korea: Sejong Si, Korea, 2019. [Google Scholar]
  12. Ministry of Environment in Korea. Standard Methods for the Measurements of Air Pollution; Ministry of Environment in Korea: Sejong Si, Korea, 2019. [Google Scholar]
  13. Kang, S.M.; Hong, Y.J.; Kim, S.D.; Jeon, E.C. Ammonia Emission Factors and Uncertainties of Coke Oven Gases in Iron and Steel Industries. Sustainability 2020, 12, 3518. [Google Scholar] [CrossRef]
  14. National Air Emission Inventory and Research Center. Investigation of Ammonia Emissions and Development of Emission Factors (I)-Investigation of Ammonia Emissions during Production Process; National Air Emission Inventory and Research Center: Incheon, Korea, 2019. [Google Scholar]
  15. Emission Inventory Improvement Program (EIIP). Recommended Approach to Using the Data Attribute Rating System (DARS); EIIP Technical Report Series Volume 6, Appendix F; U.S. Environmental Protection Agency: Washington, DC, USA, 1996. [Google Scholar]
  16. Kim, J.; Jang, Y.K. Uncertainty Assessment for CAPSS Emission Inventory by DARS. J. Korean Soc. Atmos. Environ. 2014, 30, 26–36. [Google Scholar] [CrossRef] [Green Version]
  17. European Environment Agency. EMEP/CORINAIR Atmospheric Emission Inventory Guidebook 2019; European Environment Agency: Copenhagen, Danmark, 2019. [Google Scholar]
  18. IPCC. The 2006 IPCC Guidelines for National Greenhouse Gas Inventories; General Guidance and Reporting; IPCC: Geneva, Switzerland, 2006; Volume 1. [Google Scholar]
  19. Lee, S.H. Development of the Coke Oven Gas Carbon Emission Factor and Calculation of Uncertainty. J. Clim. Chang. Res. 2021, 12, 137–142. [Google Scholar]
  20. Chun, B.G.; Shim, S.H.; Hwang, I.C.; Jin, S.H. An Analysis of Uncertainties in Greenhouse Gas Emission: Monte Carlo Simulation Using Experts’ Judgements. J. Environ. Policy Adm. 2014, 22, 1–29. [Google Scholar] [CrossRef]
  21. National Institute of Environmental Research. Regulations of the Air Pollution Information Management Committee; National Institute of Environmental Research: Incheon, Korea, 2020. [Google Scholar]
  22. IPCC. Climate Change 2014: Synthesis Report; Contribution of Working Groups I, II and III to the Fifth Assessment Report of the Intergovernmental Panel on Climate Change; Core Writing Team, Pachauri, R.K., Meyer, L.A., Eds.; IPCC: Geneva, Switzerland, 2014; p. 151. [Google Scholar]
Figure 1. Schematic of the field setup for ammonia sampling at NPK fertilizer production plants.
Ijerph 19 06703 g001
Figure 2. Process of the Monte Carlo simulation for estimating the uncertainty of the emission factor.
Ijerph 19 06703 g002
Figure 3. Monthly trend of NH3 concentrations at NPK fertilizer production plants.
Ijerph 19 06703 g003
Figure 4. Uncertainty of NPK fertilizer production facilities NH3 emission factor.
Ijerph 19 06703 g004
Table 1. Characteristics of the investigated NPK fertilizer production plants.
SiteProduction (Ton/Year)Sampling
A fertilizer production plant50,90044
B fertilizer production plant59,01537
C fertilizer production plant91,00926
D fertilizer production plant54,53132
Table 2. NH3 concentration of the investigated NPK fertilizer production plants.
SiteMean
(ppm)
Min
(ppm)
Max
(ppm)
SD
(ppm)
Sampling
A fertilizer production plant0.320.011.480.3344
B fertilizer production plant0.180.010.820.1837
C fertilizer production plant0.430.061.140.2826
D fertilizer production plant0.350.011.310.2732
Table 3. Seasonal characteristics of NH3 concentrations at NPK fertilizer production plants. Unit: ppm.
SeasonMeanStd. DeviationMinimumMaximumSampling
Spring0.450.410.021.8335
Summer0.37 0.310.011.2635
autumn0.260.250.020.9136
Winter0.240.240.0010.9133
Table 4. The result of the normality test of NH3 concentrations at NPK fertilizer production plants.
Normality Test ResultShapiro-Wilk
StatisticDegree of Freedom, DfSig.
NPK fertilizer production plantsSpring0.27934<0.0001
Summer0.144350.003
Autumn0.21237<0.0001
Winter0.17947<0.0001
Table 5. The result of the Kruskal–Wallis test by NH3 concentration at NPK fertilizer production plants.
Hypothesis TestNull HypothesisTestSig.Decision
NPK fertilizer production plantsThe distribution of NH3 is the same across categories of seasonIndependent Samples Kruskal–Wallis Test0.008Reject the null hypothesis
Table 6. The result of the pairwise comparison test by NH3 concentration at NPK fertilizer production plants.
Pairwise Comparisons of SeasonAdjusted Significant *Test Statistic
Winter-Autumn1.003.169
Winter-Summer0.20121.023
Winter-Spring0.01629.915
Autumn-Summer0.52417.854
Autumn-Spring0.06626.745
Summer-Spring1.008.891
* The result of Bonferroni correction.
Table 7. NH3 emission factors of the investigated NPK fertilizer production plants.
SiteMean
(kg NH3/ton)
SD
(kg NH3/ton)
Sampling
A fertilizer production plant0.0010.00144
B fertilizer production plant0.0010.00237
C fertilizer production plant0.0020.00126
D fertilizer production plant0.0010.00132
Total0.0010.001139
Table 8. Comparison of NH3 emission factor in similar fields.
This StudyEEA
(2019)
NPK fertilizer production plantsAmmonia production
NH3 emission factor at stack
(kgNH3/ton)
Uncontrolled
NH3 emission factor
(kgNH3/ton)
NH3 emission factor
(kgNH3/ton)
95% confidence interval
LowerUpper
0.0010.0110.050.0010.1
Publisher’s Note: MDPI stays neutral with regard to jurisdictional claims in published maps and institutional affiliations.

