Abstract
Despite numerous studies on multiple socio-economic factors influencing urban PM2.5 pollution in China, only a few comparable studies have focused on developed countries. We analyzed the impact of three major socio-economic factors (i.e., income per capita, population density, and population size of a city) on PM2.5 concentrations for 254 cities from six developed countries. We used the Stochastic Impacts by Regression on Population, Affluence and Technology (STIRPAT) model with three separate data sets covering the period of 2001 to 2013. Each data set of 254 cities were further categorized into five subgroups of cities ranked by variable levels of income, density, and population. The results from the multivariate panel regression revealed a wide variation of coefficients. The most consistent results came from the six income coefficients, all of which met the statistical test of significance. All income coefficients except one carried negative signs, supporting the applicability of the environmental Kuznet curve. In contrast, the five density coefficients produced statistically significant positive signs, supporting the results from previous studies. However, we discovered an interesting U-shaped distribution of density coefficients across the six subgroups of cities, which may be unique to developed countries with urban pollution. The results from the population coefficients were not conclusive, which is similar to the results of previous studies. Implications from the results of this study for urban and national policy makers are discussed.
1. Introduction
Heavy fine particulate (PM2.5) pollution has increased and become a high risk to public health in densely populated urban areas in many countries. According to a recent study involving 381 large cities with populations of more than 0.75 million people in China, India, the U.S., Europe, Latin America, and Africa [1], the annual average PM2.5 concentrations from 2000 to 2006 in 23.9% of these cities was higher than the World Health Organization’s (WHO) interim Target 1 of less than 35 micrograms per cubic meter (35 μg/m3). In addition, only 18.0% of these large cities were within the recommended WHO target of less than 10 μg/m3. Large cities in Asia, especially China and India, had the worst record, with 48.7% of these cities recording PM2.5 concentrations higher than 35 μg/m3 and only 1.7% with PM2.5 concentrations of less than 10 μg/m3. In contrast, large cities in Latin America had the best air quality, with 64.4% of them within the 10 μg/m3 guideline.
Translating urban pollution risk in terms of the number of people, it has been reported [1] that more than 500 million Chinese urban residents (14% of the global urban population) were at risk from PM2.5 hazard (35 μg/m3 or more) in 2010. These people resided in 154 cities, which represented 78% of all large cities with a population of more than 1 million. To make matters worse, 278 million more people became exposed to PM2.5 hazards between 2000 and 2010 due to the high birth rate and high migration rate from rural areas to these cities.
In short, the air pollution risk appears to be far more serious in urban settings in large cities in several countries in Asia, particularly in China, India, and Pakistan. Therefore, a high priority for research on socio-economic influencing factors of PM2.5 pollution in urban centers is needed to develop effective mitigating policies to control urban pollution. However, the unavailability of relevant city-wide technology-related data, such as the industrial structure, energy intensity, service structure, vehicle usage, as well as income per capita has been a barrier to the productive flow of research. Fortunately, however, the unavailability of city-wide data has become somewhat more manageable in recent years, increasing the number of necessary studies.
A large majority of these studies have focused exclusively on urban pollution in China [2,3,4,5,6,7,8,9,10,11,12]. For example, Hao and Liu [2] examined the four influencing factors of GDP per capita, industrial structure, vehicle population, and population density to PM2.5 concentrations for 73 Chinese cities. The results showed that secondary industries, including manufacturing, construction, fast moving consumer goods, and other industries, and the vehicle population, in that order, had greater impacts on PM2.5 concentrations in these cities. Wu et al. [3] used PM2.5 data from the same 73 cities in 2013 and 2014 and determined that PM2.5 significantly correlated with the proportion of industrial activity, the number of vehicles, and household gas consumption in these cities.
Expanding the number of cities to 338 Chinese cities from 2014 to 2017, Wang et al. [5] determined that population density and the number of vehicles had a large impact on increasing PM2.5, and GDP per capita had a moderate impact on PM2.5. Cheng et al. [4] also used STIRPAT models to analyze influencing factors of PM2.5 concentrations for 285 Chinese cities from 2001 to 2012. Their results indicated that population density, income, and traffic intensity had a significant impact on PM2.5 concentrations. In addition, secondary industries and central heating significantly aggravated urban air pollution. However, foreign direct investment was not a significant factor.
In contrast to the many studies on urban pollution, only a few socio-economic studies on PM2.5 concentrations in cities in developed countries have been published in recent years [13,14]. The current study fills this important gap in the urban pollution literature for developed economies by focusing on 254 cities in the U.S., Germany, Japan, France, U.K. and Spain. More specifically, a STIRPAT framework was used to analyze the three influencing factors of population, income, and technology on PM2.5 concentrations from 2001 to 2013.
After this introduction, the paper has four sections. A brief literature review on selected socio-economic studies on PM2.5 pollution is presented in the next section, followed by a section explaining the STIRPAT model and data sources. An analysis of the results is presented in the fourth section. Finally, the conclusion, implications, and limitations of the study are presented in the fifth section.
2. Literature Review of PM2.5 Concentrations in Urban Centers
The large majority of socio-economic studies on PM2.5 concentration in urban centers in recent years have concentrated on China [2,3,4,5,6,8,9,10,12,15]. One reason is that PM2.5 is the main component of haze and fog for large cities in China, so investigating the relationship between socio-economic factors related to PM2.5 pollution is very important to Chinese policy makers. Another reason is that city-level data for PM2.5 pollutants and related socio-economic factors in many other developing countries are mostly unavailable. In terms of developed countries, PM2.5 is not as critical of an environmental pollution issue for cities in developed countries [2]. Thus, only a few socio-economic studies on PM2.5 concentrations for cities in developed countries have been published recently on cities in the U.S. [13] and Germany [14]. A group of related studies on air pollution in developed countries such as the U.S. and Canada have also been published [16,17,18,19,20,21]. A few other papers on multiple cities in both developed and developing countries have also been published [1,22,23].
We selected the five most representative papers on the socio-economic analysis of city-level PM2.5 concentrations in China for a closer examination [2,4,8,9,15]. The results show that economic development measured by city GDP per capita and population density are the two most influential factors analyzed by these five studies, followed by traffic intensity analyzed by four articles, and industrial structure and energy or electricity intensity examined by three articles. Other factors such central heating, trade openness, and foreign direct investment were analyzed in one article each.
The most consistent finding is related to the increasing or decreasing impact of city GDP per capita to PM2.5 concentrations, depending on the income level of cities. All five articles found a statistically significant inverse U-shaped or inverted N-shaped environmental Kuznet curve (EKC). For example, Cheng et al. [4] estimated that 83.4% of Chinese cities are below the inflection point of EKC, and as a result of increasing income, have experienced an increase in PM2.5 pollution. Similarly, Liu et al. [9] concluded that high- income cities in China have surpassed the peak of their EKC while upper- and low-middle income cites have not.
Wu et al. [8] also estimated that most cities in the eastern region with higher incomes have passed the inflection point, while cities in the middle region may need 10 to 15 years to reach their peak of EKC. To elaborate, Wu et al. [8] verified the existence of an inverted U-shaped EKC involving 104 cities in the middle region of China with the inflection point estimated at $18,506 per capita. As of 2011, only 11% (13) of these cities have arrived at this inflection point, creating a win-win relationship between income and PM2.5 pollution. For 108 cities in the eastern region, there is an inverted N-shaped curve with a projected inflection point of $9186. As many as 64% (69) of the cities have reached their inflection point, and another 18% (19) cities are expected to reach their inflection point within the next five years. The remaining 47 cities in the western region do not follow the EKC and show a linear positive relationship between income per capita and PM2.5 pollution.
Wang and Fang’s [6] study on 53 cities in the Bohai Rim Urban Agglomeration found that 43 of the 53 cities displayed a negative relationship with GDP per capita with an average coefficient of −1.8. In other words, an increase of 10,000-yuan GDP per capita would cause a reduction of 1.18% of μg/m3 in PM2.5.
Nearly the same findings can be found for industrial structure, measured by the proportion of value added by secondary industry to GDP as well as traffic intensity measured by the proportion of the number of civilian vehicles to the total length of urban roads. In short, four of the five articles (with the exception of Wu et al. [8]) confirmed a positive and significant relationship between high traffic intensity and high secondary industry output to higher PM2.5 concentrations.
The impact of population density on PM2.5 pollution has had somewhat contradictory results in these five articles. The findings by Cheng et al. [4], Wu et al. [8], and Zhou et al. [15] were statistically significant and positive. For example, Cheng et al. [4] showed that population density coefficients to PM2.5 concentrations derived from three separate panel regression models for 285 cities in China from 2001 to 2012 generated all six population density coefficients ranging from +0.06 to +0.029, which were statistically significant at the 1% level. In other words, a 1% increase in density increased PM2.5 concentrations from 0.029% to 0.06%, while the effects from other factors such as income, industrial structure, electricity intensity, traffic intensity, and several others held constant. The other two articles by Hao and Liu [2] and Lin et al. [24] showed positive but no statistically significant density coefficients.
Another factor, energy or electricity intensity, has also generated somewhat contradictory findings in the three articles. For example, Cheng et al. [4] found a statistically significant positive impact of increased electricity consumption on increased PM2.5 pollution. Similarly, Wu et al. [8] found a strong positive impact of coal consumption on PM2.5 pollution. In contrast, Zhou et al. [15] found no significant relationship between electricity consumption and PM2.5 pollution.
It is interesting to note that none of the five articles examined the impact of the population size of cities on PM2.5 pollution. However, other papers such as Wang et al. [25] reported a positive correlation between PM2.5 concentrations and urban population, together with the size of the urban areas, the share of secondary industry, and population density. Han et al. [11] and Han et al. [26] suggested that urbanization had a considerable impact on increasing PM2.5 concentrations in Chinese cities.
The findings from socio-economic analyses of urban PM2.5 pollution in developed countries are less clear as they vary from those reported on city level PM2.5 concentrations in China. A recent socio-economic analysis of PM2.5 pollution on cites in developed countries emphasized the role of population density over income or population size. For example, Carozzi and Roth [13] found a positive and statistically significant population density coefficient of +0.13 for PM2.5 concentrations. Specifically, they found that doubling the density would increase the average PM2.5 pollution roughly 10% across 933 U.S. cities.
In another systematic study on 109 districts in Germany, which included 51 urban districts, Borck and Schrauth [14] found that a 1% increase in population density increased PM2.5 concentrations by a modest 0.08%. Using an authoritative survey, Ahlfeldt and Pietrostefani [27] cited both studies by Carozzi and Roth [13] and Borck and Schrauth [14], and recommended +0.13 as the elasticity for pollution reduction. In short, the impact of high-density cities on PM2.5 pollution was positive in Chinese studies. Similarly, studies on U.S. and Germany cities also suggested that the effect of high population density was moderately positive.
However, when population density is examined in the framework of urban spatial structure or urban form in relation to air pollution, studies of American and European cities have shown that low-density urban sprawl can lead to a significant deterioration of air quality [16,19,28,29].
For example, Bereitsnaft and Debbaze [19] found that among 86 metropolitan areas in the U.S., low-density urban sprawls led to higher concentration of air pollution. Stone [16] showed for the 45 major cities in the U.S, the more compact the city, the smaller the spread, the more likely it was to reduce air pollution emissions. The primary reason is that compact low-density cities can reduce transportation emissions and air pollution, due to the proximity of housing and employment. In contrast, Clark et al. [30] found that PM2.5 pollution levels increase as population density increases. Another study for 249 European cities found that high density cities were more vulnerable to high levels of SO2 concentration [31].
In sum, it is likely that both very high- and very low-density cities may be subjected to higher levels of air pollution emissions. Thus, several recent studies have proposed adjusting population density upward by promoting monocentric urban structures for those low-density cities while adjusting population density downwards by promoting polycentric structures for the excessively high-density cities as possible remedies to reduce air pollution [32,33,34].
As for the impact of income on PM2.5 pollution, Anenberg et al. [22] discovered that PM2.5 concentrations across 82 global cities were negatively associated with city GDP per capita at a correlation coefficient of 0.64 at p < 0.0001. In other words, the negative impact from higher income cities in developed countries on PM2.5 pollution appears to be more pervasive compared to Chinese cities.
Another paper by Ouyang et al. [35] examined the driving forces of PM2.5 concentrations in 30 OECD countries from 1998 to 2015 using a threshold panel model. The result was that a 1% increase in GDP per capita decreased the PM2.5 concentrations from 0.3% to 0.4%, depending on the three income levels of countries. These findings supported the earlier studies by Wang and Fang [6] and Wang et al. [25].
As for the impact of population size of a city on PM2.5 pollution, Han et al. [1] discovered an inverse U-shape relation among Chinese cities. However, they indicated that the relationships in U.S., European, and Latin American cities were stationary or showed a small increasing trend. In other words, the larger population size cities in China may be more likely to experience higher PM2.5 pollution than those in U.S., European, and Latin American cities. For cities in India and Africa, they discovered a U-shaped trend for PM2.5 concentrations as urban population increased.
3. Method and Data
3.1. STIRPAT Model
Many scholars have used econometric models to analyze the influencing factors of energy usage and air pollution from a socio-economic perspective. Econometric models include both cross-section and panel models. The use of panel models has become popular as they can increase the sample size, reduce collinearity between variables, and control individual heterogeneity of samples to improve the reliability and validity of the estimates [4].
The original IPAT model was refined later to become the Stochastic Impacts by Regression on Population, Affluence and Technology (STIRPAT) model, which enabled researchers to estimate the proportional change of the environmental impact per given proportional change in population, affluence, and technology.
The STIRPAT model is defined as
where I represents the pollution intensity of a pollutant, P represents the total population, A depicts affluence or income, and T indicates the level of technological development. Subscript i and t of each variable denote the cross-sectional unit, which is the cites and time period, respectively; a is the constant; b, c, and d are the exponents of P, A, and T, respectively, to be estimated; and e is the residual error term.
To ease the task of estimating exponents, Equation (1) is converted into the log-log form of Equation (2) by taking the natural log of both sides.
The natural log is helpful as it converts non-linear variables to linear ones, rendering the results interpretable as a percentage change. For example, b can be viewed as the population elasticity that measures the percentage change of the environmental impact resulting from a 1% change in population. The STIRPAT model has also been used to examine the impact of population, income, and/or technology in other areas such as the material footprint, human ecological footprint, and environmental efficiency of well-being [36,37,38].
Many scholars have also used the STIRPAT model to analyze the impact of socio-economic factors on PM2.5 pollution at the country level as well as the city level [39,40,41,42,43,44,45,46]. As for a measure for technology, there is no consensus on a single measure of technology [47]. According to Cole and Neumayer [48], technology is a broad term intended to reflect technological, cultural, and institutional determinants of the environmental impact. For example, Uddin, Alam and Gow [49] extensively used the urbanization ratio measured as the percentage of the population living in urban areas for technology in their STIRPAT model. Wang et al. [40] also used the urbanization ratio, together with energy intensity for the technology factor in their STIRPAT model.
For this study, population density is used to represent the technology factor in the STIRPAT model, together with the population size of a city as P and income per capita of a city as A, as shown in Equation (3):
where P represents the population size of each city, A represents the GDP per capita of a city, and PD represents population density calculated by population per km2.
In addition, we use threshold regression as a robust test to verify the results from the STIRPAT analysis. This study uses Hansen’s [50] threshold regression using the simplest form of regression where a single threshold was called for. The single threshold regression model includes Equations (4) and (5):
where i represents the units of analysis, which is a city; Y represents the dependent variable of PM2.5 concentrations; x represents the explaining variables of population size (P), income per capita (I), and population density (PD); θ1 and θ2 represent parameters to be estimated; q represents the threshold variable; γ represents the threshold quantity; and e represents the error term. Based on the variables selected in this study, the threshold model is expressed in Equations (6) and (7):
We then combine Equations (6) and (7) using a dummy variable, which takes the value of one when the condition in parentheses is met, otherwise it becomes zero. This combined equation is used as the estimation equation of this research. The generalized threshold panel model has been used extensively in the fields of energy consumption, renewable energy development, and carbon emission on sustainable development [51,52,53,54,55,56,57].
3.2. Data and Data Sources
We downloaded the data set indicating the exposure to PM2.5 in metropolitan areas from 2001 to 2013 (https://stats.oecd.org/index.aspx?DatasetCode=EXP_PM2_5_FUA accessed on 12 August 2020) for 706 cities in six countries: the U.S. (262 cities), Germany (109 cities), the U.K. (101 cities), France (82 cities), Japan (76 cities), and Spain (76 cities).
We then downloaded the population size, metropolitan land area, and GDP from 2001 to 2013 (http://stats.oecd.org accessed on 24 August 2020). After eliminating cities with missing data, we obtained the final sample size of 254 cities with a complete set of yearly data on PM2.5, population size, population density, and city GDP per capita. The final sample size of 254 cities included 59 cities in the U.S., 57 cities in Germany, 46 cities in Japan, 38 cities in France, 33 cities in the U.K., and 21 cities in Spain.
Further details on data and data sources are presented in Table 1. First, the PM2.5 mean pollution exposure was 13.15 μg/m3 and the median was nearly the same at 13.05 μg/m3. Second, the population size of the cites during the study period was calculated at 1.35 million inhabitants. The average city GDP income per capita measured in constant international U.S dollars with a base year of 2010 at PPP was $37,772. Finally, the average population density during the study period was 703.68 persons per km2.

Table 1.
Data sources for 254 cities.
For the subgroup analysis, the total sample of 254 cities was independently ranked from highest to the lowest in each of the three categories of income, density, and population size. We used the latest income figures of 2013 to categorize the income subgroups. The total group of 254 cities was categorized into two equal numbers of the top 127 highest income cities and the bottom 127 lowest income cities. The top 127 subgroup was led by San Francisco, CA, the highest ranked for income per capita at $84,921, and ended with Rennes, France, the 127th ranked at $35,966. The bottom 127 subgroup was led by Reims, France, ranked 128th at an income per capita at $35,964, and ended with Cordoba, Spain, ranked 254th at $22,057. To highlight the scale effect, three additional subgroups were created: the top 15, top 30, and top 60 high-income cities. The top 15 subgroup was again led by San Francisco, CA and the 15th ranked Denver, CO at $60,752, while the top 30 subgroup was led by San Francisco, CA and the 30th ranked Aberdeen, SD at $54,812. Finally, the top 60 subgroup was led again by San Francisco, CA and the 60th ranked Sacramento, CA at $44,680.
We then applied the same procedure to population density using 2013 density data. For density subgroups, the top 127 subgroup was led by the first ranked Tokyo, Japan, at 8635 persons per km2 and ended with the 127th ranked Hachinohe, Japan at 405 persons per km2. The bottom 127 subgroup was led by the 128th ranked Granada, Spain at 402 persons per km2 and ended with the 254th ranked Albuquerque, NM at 28 persons per km2. To highlight the scale effect, we created three additional subgroups of the top 15, top 30, and top 60 high-population density cities. The top 15 subgroup was again led by Tokyo, Japan and ended with the 15th ranked Barcelona, Spain at 2076 persons per km2. The top 30 subgroup was led by Tokyo, Japan, and ended with the 30th ranked Santa Cruz de Tenerife, Spain at 1311 persons per km2. Finally, the top 60 subgroup was led again by San Francisco, CA and ended with the 60th ranked Bonn, Germany at 797 persons per km2.
For population size subgroups, using 2013 population data, the top 127 subgroup was led by the highest-ranked Tokyo, Japan at 35,221,137 inhabitants and ended with the 127th ranked Toulon, France at 553,594 inhabitants. The bottom 127 subgroup was led by the 128th ranked Numazu, Japan at 553,358 inhabitants and ended with the 254th ranked Tuscaloosa, AL in the USA at 244,054 inhabitants. To highlight the scale effect, we again created three additional subgroups of the top 15, top 30, and top 60 high-population size cities. The top 15 subgroup was again led by Tokyo, Japan and ended with the 15th ranked Berlin, Germany at 4,950,913 inhabitants. The top 30 subgroup was led by Tokyo, Japan and ended with the 30th ranked Sacramento, CA at 2,213,564 inhabitants. Finally, the top 60 subgroup was led again by Tokyo, Japan and ended with the 60th ranked Bremen, Germany at 1,230,691 inhabitants. Detailed ranking of the cities by income, density, and population are listed in the Appendix A Table A1, Table A2 and Table A3.
4. Analysis of Results
This study used the panel unit root test to check whether the data used in this study were stationary or not. We applied two widely used tests: the Levin–Lin–Chu (LLC) test developed by Levin, Lin, and James [58], and the Fisher Phillips–Perron (PP) test developed by Phillips and Perron [59]. The results indicated that there is a common unit root process in all of the variables, with one exception of income in the Fisher PP test, as shown in Table 2.
Table 2.
Results of panel unit root tests.
We then tested for multicollinearity among the explanatory independent variables in all of the panel regression models using variance inflation factors (VIFs). The VIF values were all less than 10, as shown in Table 3, suggesting no multicollinearity [60].
Table 3.
VIF test for PM2.5 data.
In the regression of the SPIRPAT model, this research used the Prais–Winsten (PW) estimation method with panel-corrected standard error. The PW method uses a generalized least square framework that corrects for AR(1) autocorrelation within the panels and cross-sectional correlation and heteroscedasticity across panels [61].
STIRPAT multivariate panel regression of PM2.5 concentrations on the three separate groups of 254 cities by income, density, and population, and their respective five subgroups generated the following variable results. First, the full sample of 254 cities ranked by 2013 income per capita yielded a statistically significant −0.074. In other words, a 1% increase in income per capita generated a −0.074% reduction of PM2.5 concentrations, while the impact from the other factors of density and population size were held constant, as shown in Table 4.
Table 4.
Multivariate panel analysis of PM2.5 concentrations for six income subgroups (2001–2013).
When the subgroup of 254 cities was divided into the top 127 high-income cities, the income coefficient increased to −0.208, which was about 2.7 times larger than the income coefficient obtained from the 254 cities. A 1% increase in income per capita reduced PM2.5 concentrations by 0.208% for the subgroup of 127 high-income cities. In contrast, the sample of the remaining bottom 127 low-income cities yielded a statistically significant coefficient of +0.157, while the other factors held constant. Specifically, a 1% increase in income increased PM2.5 concentrations by 0.157%, which indicated an income scale disadvantage for the bottom 127 low-income cities. These results suggest that there are effects from the EKC curve on cities with different income levels.
Furthermore, the contrasting results from the top 127 and the bottom 127 cities suggested the possibility of an even greater income scale advantage for cities with very high income per capita. Therefore, extended STIRPAT analysis of income coefficients for the samples of the top 15, top 30, and top 60 high-income cities were examined. The result was that the top 60 cities yielded −0.505, while the top 30 yielded −0.582. Finally, the top 15 high-income cities generated the highest negative income coefficient of −0.783, which was about 10 times larger than the income coefficient of the 254 cites at −0.074, indicating the existence of a very large-scale advantage of income for PM2.5 pollution. Furthermore, all three income coefficients met the statistical test of significance.
In summary, a very large-scale advantage of income for reduced PM2.5 pollution was evident in the top 15, top 30, and top 60 high-income cities. This income scale advantage continued through the top 127 cities at a somewhat reduced scale. However, the scale advantage showed a slight scale disadvantage for the remaining bottom 127 cities with lower income per capita. The full sample of 254 cities showed a moderate yet statistically significant income scale advantage by combining different income coefficients from these city subgroups.
The same STIRPAT multivariate panel regression was applied first to the full sample of 254 cities, ranked by 2013 population density. The density coefficient from the full sample of 254 cities yielded statistically significant density coefficients of +0.058, as shown in Table 5, which resembled the results in a German study [14] with a density coefficient of +0.08. In other words, a 1% increase in density yielded a 0.058% increase in PM2.5 concentration, demonstrating that the impact of density on PM2.5 concentrations was positive. When the full sample of 254 cities was divided into the subsample of the top 127 cities with higher density, the density coefficient was more or less unchanged at 0.053, meeting the statistical test of significance, while the effects from the other factors held constant.
Table 5.
Multivariate panel analysis of PM2.5 concentrations for six density subgroups (2001–2013).
The bottom 127 cities with lower densities yielded a statistically significant density coefficient of +0.142, which was substantially higher than the density coefficients of both the top 127 and all 254 cities. In other words, the positive impact of population density on PM2.5 pollution was much greater for the group of cities with lower densities compared to the group of cities with higher densities.
The result for the top 60 cities yielded a statistically significant coefficient of +0.05, which was nearly the same as the +0.058 coefficient estimated for all 254 cities. Similarly, the density coefficients for the top 30 cities remained at +0.061. However, for the top 15 cities, the density coefficient more than doubled to +0.13. The density coefficients for the top 15 cities did not meet the statistical test of significance, whereas the density coefficient for the top 30 cities did.
In summary, all of the density coefficients displayed a positive impact of density on greater PM2.5 pollution. The positive impact was greater for the 127 cities with lower population densities over both the 127 cities with higher population densities, and the full sample of all 254 cites. The top 60 and 30 cities displayed density coefficients nearly equal to those of the top 127 cities and all 254 cities. However, the top 15 cities displayed a substantially higher density coefficient, approaching the density coefficient derived from the bottom 127 cities. In sum, the overall pattern of density coefficients followed a U-shaped pattern, providing an interesting contrast to the inverse U-shaped pattern of the EKC.
Finally, the full sample of 254 cities ranked by 2013 population size was subjected to the same panel regression analysis. The resulting population coefficient of −0.018 met the statistical test of significance. To explain, a 1% increase in population would reduce PM2.5 concentrations slightly by 0.018% for the full sample of 254 cities, while the effects of the other factors of income and density were held constant, as listed in Table 6. However, compared to the income and density coefficients estimated earlier, the magnitude of impact of population size is quite moderate. In addition, similar to the effect of income, larger population sizes implied a smaller reduction in PM2.5 concentrations.
Table 6.
Multivariate panel analysis of PM2.5 concentrations for six population subgroups (2001–2013).
To differentiate the degree of impact between large versus small population size, the full sample of 254 cities was again divided into the subgroups of the top 127 largest population cities and the remaining 127 smallest population cities. The resulting population coefficient for the top 127 cities was much smaller at −0.009, compared to the −0.018 estimated for all 254 cities, but the coefficient failed to meet the statistical test of significance. The remaining 127 cities with smaller populations yielded a substantially larger population coefficient of +0.024, which again did not meet the statistical test of significance.
To determine the impact of population mega cities of the top 15 most populated cities, the panel regression yielded a statistically significant population coefficient of +0.261. For the subgroup of the top 30 most populated cities, the population coefficient was substantially smaller at +0.027, but failed to meet the statistical test of significance. For the top 60 cites, the population coefficient yielded −0.034, indicating the same population impact on PM2.5 concentrations as the subgroups of the top 127 and all 254 cities. However, only the two population coefficients for the top 15 cities and all 254 cities met the statistical test of significance.
In sum, although an increasing population size for the full sample of 254 cities yielded a moderate reduction in PM2.5 pollution, the results from the subgroup analyses did not support such an impact. On the contrary, the subgroup of 15 mega cities indicated a much higher impact of increasing, not decreasing, PM2.5 pollution. The results from the remaining subgroups were inconclusive.
In order to verify the appropriateness of subgroups used in this study so far, the multivariate panel regression was replicated for the four additional subgroups for the respective independent variables. Specifically, we added the subgroups of the top 20, top 50, top 100, and top 200 cities. Table 7 shows the newly derived income, density, and population coefficients for the newly added four subgroups together with the coefficients estimated earlier for the five subgroups of the top 15, top 30, top 60, top 127, and bottom 127 cities.
Table 7.
Robustness tests of income, density, and population coefficients with four additional subgroups.
The four newly estimated income coefficients, all of which are statistically significant, follow the overall declining pattern of coefficients from the top 15 to bottom 127 cities in perfect alignment, indicating the robustness of our previous estimation of the five subgroups. As for the four new density coefficients, they, in general, also support the overall “U” shaped pattern, with a wide flat bottom displayed by the previous five coefficients. The distribution of the four new population coefficients, also, support the overall pattern established by the previously estimated coefficients, where the top 15 displayed the highest coefficients. Similarly, the new coefficients from the subgroup of top 20 cities also displayed the highest coefficients among the new four subgroups.
Since both the top 127 largest cities and the bottom 127 smallest cities failed to generate statistically significant population coefficients, we used an alternative model of threshold regression as a robustness check. The results, shown in Table 8, indicated that the optimal single-threshold value was estimated at 0.768 million inhabitants. We divided the full sample of 254 cities into Region 1 with more than 0.768 million inhabitants and Region 2 with less than 0.768 million inhabitants. Region 1 with 94 cities had an average population size of 2,903,502 inhabitants and Region 2 with 160 cities had an averaged population size of 436,966 inhabitants.
Table 8.
Threshold regression of PM2.5 concentrations for 254 cities by population size.
The population coefficient for Region 1 generated a statistically significant +0.045, compared to −0.009 for the top 127 cities, whereas Region 2 generated a statistically insignificant +0.012, compared to +0.024 for the bottom 127 cities.
In sum, the robustness test with threshold regression using the subgroups of alternative population size for the top 94 cities and the bottom 160 cities improved the statistical validity for the subgroup of cities with large populations. However, the basic piecewise linear pattern of population coefficients remained essentially intact.
5. Conclusions
The key findings from this research can be summarized as follows. First, the impact of income measured by city GDP per capita on PM2.5 pollution for the full sample of 254 cities was highest, in that a 1% increase in income generated a −0.074 reduction of PM2.5 concentrations. In contrast, the impact of population density was nearly as high, in that a 1% increase in population density resulted in a 0.058% increase of PM2.5 concentrations. The impact from population size was quite modest, in that a 1% increase of population size resulted in a reduction of only 0.018%.
Second, when all 254 cities were categorized into five subgroups of the top 127, bottom 127, top 60, top 30, and top 15 cities, the impact of income, density, and population varied so widely that each influencing factor needed a separate in-depth analysis. We provide a summary in Table 9 of the six coefficients for each of the three influencing factors of income, density, and population. We also present the average values during the study period of income, density, and population for all 254 cities as well as for each of the respective five subgroups under analysis.
Table 9.
Summary table of income, density, and population coefficients (2001–2013).
Third, the results of the income subgroup analysis showed the most consistent pattern following the EKC. The richest cities displayed the highest scale advantage for greater pollution reduction, whereas the lower income cities experienced a scale of diseconomy with pollution increases. To elaborate, Figure 1 shows that the income coefficient for the top 15 highest-income subgroup with an average income of $63,132 experienced a reduction of −0.783% in PM2.5 pollution, whereas the bottom 127 lower-income cities with an average income of $30,007 experienced a pollution increase of 0.157% for the same 1% increase in income.
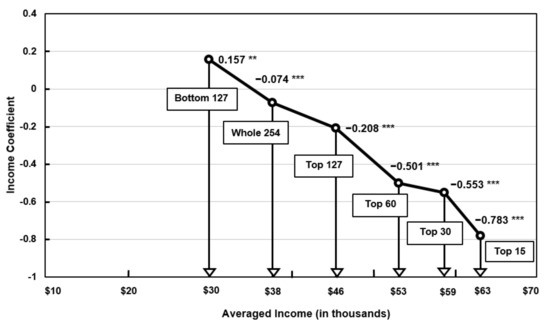
Figure 1.
Distribution of income coefficients and averaged income for all cities and the five subgroups of cities (2001–2013). *** p < 0.01, ** p < 0.05.
To explain this pattern in the context of the EKC, many cities in the subgroup of cities with an average income of $30,007 had not reached the peak of their EKC, and thus, experienced increasing pollution as their income increased. In contrast, many cities in the subgroup with an average income of $45,537 had surpassed the peak, so experienced a win-win relation of increased income and reduced pollution. Cities with the highest income level experienced proportionately greater pollution reductions, as predicted by the EKC.
Fourth, the results of the density subgroup analysis showed a somewhat opposite pattern from the income subgroups. As shown in Figure 2, the bottom 127 low-density cites with an average density of 202 persons per km2 generated the highest density coefficient of +0.142, whereas the top 15 high-density cities also generated an equally high density coefficient of +0.119. In the remaining subgroups, the density coefficient clustered closely around the density coefficient derived from all 254 cities. Thus, the overall distribution of density coefficients resembled a U-shaped pattern, which is opposite to the inverse U-shaped EKC.
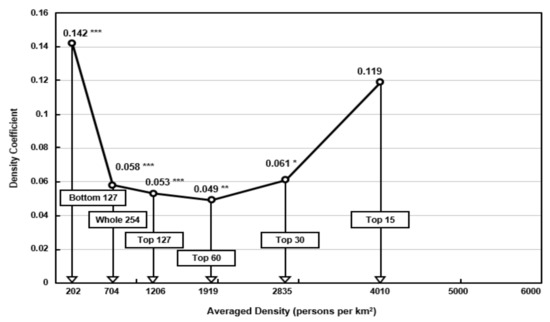
Figure 2.
Distribution of density coefficients and averaged density for all cities and the five subgroups of cities (2001–2013). *** p < 0.01, ** p < 0.05, * p < 0.1.
As noted in the earlier section of the literature review, many cities in the U.S and some European countries with low-density urban sprawl may have been responsible for the unusual high-density coefficient of +0.142 estimated for the subgroups of the bottom 127 cities. For example, the bottom 127 subgroup contained a large minority of 36 American cities. Furthermore, this subgroup contained 14 American cities in the bottom 20 lowest density cities, indicating the impact of low-density sprawl cities.
The high-density coefficient of 0.119 from the subgroup of the top 15 cities with a very high average density of 4010 inhabitants per km2 may reflect the fact that extremely high-density cities will begin to experience excessive spatial concentration and consequently increasing vehicle emissions due to severe congestion as well as the high number of people exposed to pollution. These can bring about a rapidly rising air pollution. Furthermore, the fact that there are seven high-density Japanese cities included in the top 15 subgroup may have generated another cause for the unusually high coefficient derived for this subgroup.
Fifth, the results from the population subgroups were somewhat inconsistent and contradictory in that only the full sample of 254 cities and the top 15 most populous mega cities generated statistically significant population coefficients. All 254 cities generated −0.018, while the top 15 subgroup generated +0.261. In other words, most cities would experience a very modest pollution reduction in the full sample of 254 cities, whereas the most populous cities in the top 15 subgroup would experience the largest increase in PM2.5 pollution. The population coefficient from the remaining subgroups clustered around the population density of the full sample of all cities group. Therefore, the distribution of population coefficients can be approximated using a piecewise linear relation, as displayed in Figure 3. In short, unlike the case of income and density, the population size of cities appears to not have a substantial impact on PM2.5 pollution. The only exception was in the case of the most populous 15 mega cities with an average population size around 10 million inhabitants.
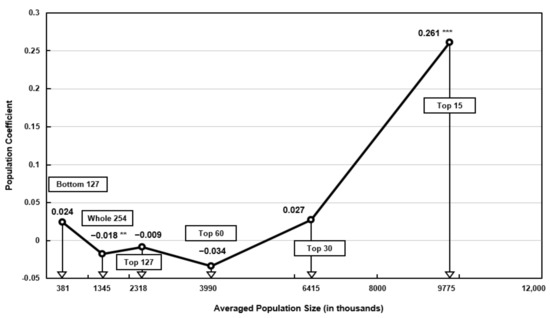
Figure 3.
Distribution of population size coefficients and averaged population size for all cities and the five subgroups of cities (2001–2013). *** p < 0.01, ** p < 0.05.
It would be interesting to compare the results of this study to the results of studies on Chinese cities discussed earlier in the literature review section. First, the impact of income on PM2.5 pollution between the two groups was quite similar, as both the previous studies and our study verified the theory of EKC. One difference may be that the inflection point of the EKC in China could be somewhat lower in the range of $9186 to $18,506 per capita [8]. In comparison, the average income for the bottom 127 cities in this study, generating a positive income coefficient, was estimated at $30,007. Another difference may relate to the very large-scale economy estimated for the top 15 high-income subgroup in this study, which may be different in high-income Chinese cities.
As for population density, both groups of studies verified the result of increasing pollution as a function of increasing population density. However, the U-shaped distribution of density coefficients revealed in this study may be due to many low-density urban sprawls found particularly in the U.S. For example, the average density for all 254 cities was quite low (i.e., estimated at 704 persons per km2). In comparison, the average population density for 285 cities in China during a similar study period of 2001 to 2012 was estimated at a much higher density of 1149.86 persons per km2 [4]. Finally, both groups of studies found that the impact of population size on PM2.5 pollution was inconclusive, although our study revealed rapidly increasing pollution from the most populous cities with an average of 10 million inhabitants.
The findings of this study have policy implications for all countries. An ideal combination of the three influencing factors examined in this study that are most favorable to pollution reduction are (1) an average income per capita of $38,000 or more; (2) population density in the range of 1000 to 2000 population per km2; and (3) a medium population size between 1.5 million to 4 million inhabitants. In contrast, the worst combination of the three factors are (1) low-income cities with significantly less than $30,000 per capita; (2) the highest population density of more than 4000 persons per km2; and (3) the largest population size of more than 10 million inhabitants.
We realize, however, that such an ideal combination would be quite difficult to achieve in most cities. Fortunately, the results of this study have identified a rather wide indifference zone of the average values in all three factors. For the income, any city income per capita over $38,000 would generate a substantial pollution reduction. For density, the wide indifference zone ranges from about 700 to 3000 persons per km2, while the indifference zone of population size ranges from 1.3 million to 6.4 million inhabitants.
There are several limitations to this study that represent possible topics for future studies. One major limitation is the omission of several socio-economic factors related to PM2.5 pollution that have been analyzed in previous studies. For example, several previous studies on Chinese cities have included other influencing factors such as industrial structure, traffic intensity, energy and electricity usage, and coal consumption [2,3,4,7]. Another group of omitted factors include meteorological elements such as temperature, precipitation, wind, and humidity [9]. Other omitted variables may include atmospheric chemistry and the long-distance transport of pollution [9,62,63,64,65,66]. These omitted variables could be included in future studies, and thus could revise the interactions related to socio-economic factors examined in this study. In other words, we have provided some evidence for the robust association between the factors of income, density, and population to PM2.5 pollutions, rather than evidence of causality. Thus, future work should continue to establish the causal relationships to control air pollutions.
Despite these limitations, this research revealed the role of high-income cities in developed countries and added insights about how pollution reduction can have a greater impact compared to developing countries such as China. This study also supports the positive impact of high population density cities on increasing pollution, which is also the case in developing countries. Going beyond this basic notion, this study proposes a U-shaped pattern of density coefficients as a function of variable population densities of cities for developed countries.
Author Contributions
Conceptualization, methodology, and analysis, Y.-S.C. and S.-M.K.; original draft preparation, Y.-S.C. and M.-J.K.; review and editing, Y.-S.C., M.-J.K., and S.-M.K. All authors have read and agreed to the published version of the manuscript.
Funding
This research received no external funding.
Institutional Review Board Statement
Not applicable.
Informed Consent Statement
Not applicable.
Data Availability Statement
Data sources are reported in our Method and Data section. Data are available from these sources.
Conflicts of Interest
The authors declare no conflict of interest.
Appendix A
Table A1.
Ranking of 254 cities into 5 subgroups by income per capita.
Table A1.
Ranking of 254 cities into 5 subgroups by income per capita.
| Rank | Cities | gdp/cap | Population | Density | PM2.5 |
|---|---|---|---|---|---|
| 1 | USA: San Francisco (Greater) | 84,921 | 6,457,022 | 1285 | 11 |
| 2 | USA: Boston | 73,186 | 4,276,297 | 2343 | 8 |
| 3 | USA: Houston | 72,001 | 6,422,530 | 285 | 9 |
| 4 | USA: New York (Greater) | 70,399 | 20,000,933 | 1757 | 10 |
| 5 | USA: New Haven | 69,899 | 1,807,423 | 1068 | 10 |
| 6 | DE: Ingolstadt | 68,518 | 463,060 | 171 | 18 |
| 7 | USA: Washington (Greater) | 68,073 | 8,794,922 | 561 | 10 |
| 8 | USA: Hartford | 64,337 | 1,216,966 | 585 | 9 |
| 9 | USA: Philadelphia (Greater) | 61,836 | 6,407,666 | 756 | 10 |
| 10 | DE: Dusseldorf | 61,698 | 1,511,967 | 1708 | 14 |
| 11 | USA: Minneapolis | 61,415 | 3,405,918 | 238 | 10 |
| 12 | USA: Portland | 61,332 | 2,209,459 | 201 | 6 |
| 13 | FR: Paris | 61,301 | 11,866,785 | 1186 | 17 |
| 14 | USA: Dallas | 60,787 | 6,980,428 | 272 | 10 |
| Top 15 | USA: Denver | 60,752 | 2,696,308 | 226 | 8 |
| 16 | USA: Indianapolis | 60,360 | 1,938,160 | 232 | 11 |
| 17 | DE: Frankfurt am Main | 60,351 | 2,544,366 | 648 | 15 |
| 18 | USA: Tulsa | 59,447 | 1,002,698 | 59 | 10 |
| 19 | USA: Milwaukee | 58,426 | 1,571,740 | 485 | 10 |
| 20 | USA: Chicago | 58,099 | 9,548,402 | 1089 | 11 |
| 21 | USA: Nashville | 58,031 | 294,618 | 427 | 10 |
| 22 | USA: New Orleans | 56,524 | 1,219,579 | 150 | 8 |
| 23 | DE: Stuttgart | 56,386 | 2,648,143 | 802 | 16 |
| 24 | UK: London | 55,954 | 11,544,026 | 2897 | 15 |
| 25 | DE: Heilbronn | 55,901 | 441,943 | 402 | 17 |
| 26 | USA: East Baton Rouge | 55,885 | 819,304 | 84 | 10 |
| 27 | USA: Austin | 55,841 | 1,894,164 | 257 | 8 |
| 28 | USA: Charlotte | 55,486 | 1,839,138 | 343 | 9 |
| 29 | USA: Columbus | 55,401 | 1,935,123 | 192 | 12 |
| Top 30 | UK: Aberdeen | 54,812 | 484,840 | 77 | 6 |
| 31 | USA: Cincinnati | 54,682 | 2,084,836 | 268 | 11 |
| 32 | USA: Atlanta | 52,745 | 5,183,715 | 465 | 10 |
| 33 | DE: Hamburg | 52,487 | 3,143,783 | 487 | 11 |
| 34 | USA: Jackson (MO) | 52,441 | 1,977,173 | 124 | 9 |
| 35 | USA: Richmond (Greater) | 51,870 | 1,112,531 | 101 | 9 |
| 36 | DE: Bonn | 51,515 | 889,551 | 797 | 13 |
| 37 | USA: Salt Lake | 51,295 | 1,539,116 | 54 | 9 |
| 38 | DE: Karlsruhe | 51,240 | 722,801 | 667 | 16 |
| 39 | DE: Wiesbaden | 51,140 | 453,599 | 559 | 14 |
| 40 | USA: Pittsburgh | 50,378 | 1,441,884 | 646 | 11 |
| 41 | USA: Oklahoma | 50,025 | 1,281,128 | 120 | 9 |
| 42 | DE: Regensburg | 50,009 | 436,621 | 178 | 18 |
| 43 | DE: Mainz | 49,981 | 405,874 | 671 | 15 |
| 44 | USA: Lancaster (NE) | 49,898 | 328,854 | 110 | 11 |
| 45 | USA: St. Louis | 49,457 | 2,596,184 | 237 | 10 |
| 46 | DE: Mannheim-Ludwigshafen | 49,358 | 1,145,686 | 661 | 16 |
| 47 | DE: Muenster | 49,276 | 512,138 | 461 | 12 |
| 48 | UK: Guildford | 49,131 | 263,440 | 764 | 12 |
| 49 | USA: Detroit (Greater) | 48,811 | 4,360,382 | 885 | 11 |
| 50 | DE: Koblenz | 48,496 | 319,944 | 392 | 13 |
| 51 | DE: Braunschweig-Salzgitter Wolfsburg | 48,491 | 977,157 | 279 | 13 |
| 52 | USA: Memphis | 47,895 | 1,302,172 | 146 | 10 |
| 53 | DE: Ulm | 47,753 | 470,839 | 263 | 16 |
| 54 | DE: Darmstadt | 46,621 | 434,462 | 661 | 16 |
| 55 | ES: Vitoria | 46,600 | 264,719 | 200 | 10 |
| 56 | USA: Virginia Beach | 46,383 | 1,165,789 | 286 | 9 |
| 57 | USA: Rochester (NY) | 46,221 | 857,051 | 320 | 10 |
| 58 | USA: Albany | 45,650 | 976,721 | 118 | 8 |
| 59 | FR: Lyon | 45,114 | 1,958,191 | 622 | 17 |
| Top 60 | USA: Sacramento | 44,680 | 2,213,564 | 478 | 11 |
| 61 | DE: Hannover | 44,588 | 1,267,062 | 458 | 12 |
| 62 | DE: Schweinfurt | 44,541 | 267,890 | 136 | 16 |
| 63 | JPN: Toyohashi | 44,353 | 665,226 | 961 | 14 |
| 64 | UK: Oxford | 44,033 | 527,670 | 281 | 13 |
| 65 | USA: Erie (NY) | 43,694 | 1,136,993 | 823 | 11 |
| 66 | DE: Aschaffenburg | 43,603 | 368,348 | 261 | 16 |
| 67 | USA: Charleston | 43,545 | 711,407 | 152 | 9 |
| 68 | USA: Tuscaloosa | 43,490 | 244,054 | 43 | 11 |
| 69 | USA: Montgomery (OH) | 43,485 | 697,435 | 646 | 11 |
| 70 | USA: Phoenix | 43,099 | 4,390,565 | 315 | 12 |
| 71 | USA: Lafayette | 43,007 | 427,049 | 54 | 12 |
| 72 | DE: Reutlingen | 42,986 | 273,578 | 272 | 16 |
| 73 | UK: Edinburgh | 42,842 | 849,720 | 582 | 9 |
| 74 | USA: Miami (Greater) | 42,808 | 6,014,211 | 3413 | 7 |
| 75 | JPN: Tokyo | 42,785 | 35,221,137 | 8635 | 16 |
| 76 | USA: Providence | 42,772 | 969,960 | 980 | 9 |
| 77 | USA: Roanoke | 42,757 | 311,993 | 65 | 8 |
| 78 | ES: Barcelona | 42,739 | 4,019,011 | 2076 | 14 |
| 79 | FR: Toulouse | 42,275 | 1,277,646 | 267 | 12 |
| 80 | DE: Offenburg | 42,147 | 412,179 | 232 | 15 |
| 81 | ES: Madrid | 42,105 | 6,379,915 | 991 | 10 |
| 82 | DE: Bremen | 42,075 | 1,230,691 | 221 | 12 |
| 83 | JPN: Toyota | 41,974 | 8,498,701 | 2403 | 13 |
| 84 | USA: Allen | 41,952 | 396,450 | 453 | 10 |
| 85 | DE: Heidelberg | 41,759 | 677,291 | 639 | 16 |
| 86 | USA: San Antonio | 41,750 | 2,298,261 | 122 | 8 |
| 87 | USA: Las Vegas | 41,274 | 2,074,253 | 28 | 7 |
| 88 | DE: Wurzburg | 41,216 | 497,551 | 168 | 16 |
| 89 | UK: Bristol | 40,865 | 913,519 | 1048 | 14 |
| 90 | DE: Kassel | 40,851 | 427,403 | 331 | 14 |
| 91 | DE: Saarbrucken | 40,635 | 800,458 | 586 | 14 |
| 92 | USA: Hamilton (TN) | 40,424 | 542,036 | 134 | 11 |
| 93 | UK: Cambridge | 40,261 | 360,154 | 232 | 13 |
| 94 | DE: Augsburg | 40,217 | 639,038 | 345 | 17 |
| 95 | JPN: Hamamatsu | 40,014 | 957,085 | 681 | 13 |
| 96 | DE: Freiburg im Breisgau | 39,783 | 623,036 | 303 | 15 |
| 97 | JPN: Kanazawa | 39,658 | 684,018 | 722 | 13 |
| 98 | USA: Jacksonville | 39,619 | 1,485,547 | 132 | 9 |
| 99 | JPN: Fujieda | 39,605 | 457,650 | 1069 | 14 |
| 100 | JPN: Numazu | 39,600 | 553,358 | 1100 | 13 |
| 101 | DE: Iserlohn | 39,246 | 420,986 | 451 | 12 |
| 102 | JPN: Yokkaichi | 38,989 | 1,058,231 | 1145 | 14 |
| 103 | DE: Pforzheim | 38,695 | 307,352 | 536 | 15 |
| 104 | USA: Albuquerque | 38,603 | 929,424 | 28 | 7 |
| 105 | USA: Knox | 38,534 | 463,248 | 723 | 9 |
| 106 | DE: Aachen | 38,469 | 539,521 | 995 | 13 |
| 107 | ES: Pamplona | 38,280 | 362,229 | 241 | 11 |
| 108 | JPN: Utsunomiya | 38,171 | 882,046 | 646 | 14 |
| 109 | DE: Siegen | 38,160 | 405,088 | 244 | 12 |
| 110 | DE: Osnabruck | 38,113 | 506,726 | 239 | 12 |
| 111 | DE: Paderborn | 37,865 | 298,853 | 281 | 12 |
| 112 | DE: Rosenheim | 37,486 | 307,074 | 213 | 18 |
| 113 | USA: Spokane | 37,376 | 501,584 | 51 | 8 |
| 114 | UK: Southampton | 37,211 | 664,608 | 481 | 13 |
| 115 | JPN: Toyama | 37,118 | 593,754 | 828 | 12 |
| 116 | FR: Nice | 36,979 | 824,441 | 353 | 16 |
| 117 | DE: Kiel | 36,979 | 632,735 | 195 | 10 |
| 118 | ES: Bilbao | 36,936 | 1,033,172 | 770 | 11 |
| 119 | JPN: Fukui | 36,794 | 547,512 | 306 | 14 |
| 120 | JPN: Morioka | 36,463 | 413,105 | 178 | 10 |
| 121 | FR: Nantes | 36,454 | 915,985 | 348 | 13 |
| 122 | FR: Dijon | 36,390 | 402,912 | 111 | 15 |
| 123 | JPN: Mito | 36,331 | 703,770 | 681 | 14 |
| 124 | DE: Berlin | 36,248 | 4,950,913 | 302 | 14 |
| 125 | DE: Oldenburg (Oldenburg) | 36,096 | 402,152 | 224 | 11 |
| 126 | JPN: Sendai | 36,011 | 1,464,672 | 1435 | 13 |
| Top 127 | FR: Rennes | 35,966 | 701,153 | 219 | 13 |
| 128 | FR: Reims | 35,964 | 320,879 | 137 | 15 |
| 129 | USA: Tallahassee | 35,883 | 373,212 | 81 | 9 |
| 130 | FR: Strasbourg | 35,874 | 771,559 | 449 | 16 |
| 131 | JPN: Hitachi | 35,740 | 316,365 | 420 | 13 |
| 132 | UK: Northampton | 35,711 | 457,540 | 313 | 13 |
| 133 | DE: Gottingen | 35,692 | 383,137 | 169 | 14 |
| 134 | JPN: Tokushima | 35,601 | 569,456 | 620 | 15 |
| 135 | DE: Wetzlar | 35,552 | 251,578 | 255 | 13 |
| 136 | JPN: Hiroshima | 35,436 | 1,432,615 | 3149 | 17 |
| 137 | FR: Bordeaux | 35,367 | 1,174,012 | 235 | 12 |
| 138 | USA: Fresno (Greater) | 35,140 | 1,105,606 | 198 | 15 |
| 139 | JPN: Kurashiki | 34,908 | 1,516,388 | 962 | 16 |
| 140 | JPN: Takamatsu | 34,900 | 562,614 | 1285 | 15 |
| 141 | FR: Pau | 34,751 | 267,702 | 146 | 11 |
| 142 | FR: Orleans | 34,633 | 424,619 | 164 | 14 |
| 143 | FR: Clermont-Ferrand | 34,545 | 476,713 | 202 | 13 |
| 144 | JPN: Niigata | 34,529 | 805,385 | 1446 | 14 |
| 145 | ES: Palma de Mallorca | 34,502 | 643,352 | 355 | 11 |
| 146 | JPN: Wakayama | 34,473 | 541,730 | 1180 | 15 |
| 147 | DE: Lubeck | 34,352 | 407,813 | 295 | 11 |
| 148 | FR: Rouen | 34,337 | 689,626 | 313 | 16 |
| 149 | JPN: Kofu | 34,222 | 586,614 | 433 | 12 |
| 150 | JPN: Kurume | 34,202 | 409,982 | 1898 | 19 |
| 151 | FR: Grenoble | 34,031 | 661,221 | 282 | 16 |
| 152 | JPN: Nagano | 33,981 | 572,858 | 732 | 12 |
| 153 | DE: Flensburg | 33,897 | 274,656 | 138 | 9 |
| 154 | UK: Derby | 33,806 | 472,015 | 783 | 14 |
| 155 | JPN: Koriyama | 33,754 | 518,284 | 513 | 12 |
| 156 | UK: Manchester | 33,644 | 3,246,448 | 1762 | 13 |
| 157 | DE: Leipzig | 33,626 | 978,997 | 266 | 15 |
| 158 | JPN: Matsumoto | 33,581 | 426,101 | 477 | 11 |
| 159 | JPN: Fukushima | 33,569 | 449,041 | 548 | 12 |
| 160 | DE: Erfurt | 33,561 | 519,509 | 201 | 15 |
| 161 | USA: Montgomery (AL) | 33,516 | 451,815 | 39 | 11 |
| 162 | FR: Le Havre | 33,328 | 297,916 | 537 | 16 |
| 163 | USA: Lubbock | 33,053 | 351,009 | 29 | 6 |
| 164 | DE: Trier | 33,037 | 248,567 | 227 | 13 |
| 165 | DE: Halle an der Saale | 33,026 | 420,210 | 292 | 14 |
| 166 | DE: Magdeburg | 33,017 | 496,349 | 125 | 14 |
| 167 | UK: Brighton and Hove | 32,843 | 440,222 | 1502 | 16 |
| 168 | JPN: Kitakyushu | 32,749 | 1,332,183 | 2680 | 20 |
| 169 | UK: Glasgow | 32,740 | 1,790,510 | 780 | 10 |
| 170 | JPN: Oita | 32,635 | 732,952 | 568 | 17 |
| 171 | JPN: Fukuoka | 32,630 | 2,680,715 | 5918 | 21 |
| 172 | DE: Rostock | 32,549 | 412,399 | 121 | 11 |
| 173 | JPN: Matsuyama | 32,249 | 625,918 | 6137 | 17 |
| 174 | FR: Caen | 32,169 | 434,109 | 211 | 14 |
| 175 | FR: Valenciennes | 32,133 | 358,729 | 687 | 16 |
| 176 | FR: Avignon | 32,098 | 318,245 | 505 | 13 |
| 177 | JPN: Asahikawa | 32,090 | 388,628 | 232 | 9 |
| 178 | FR: Annecy | 32,023 | 272,588 | 256 | 15 |
| 179 | UK: Ipswich | 31,738 | 349,520 | 235 | 13 |
| 180 | FR: Tours | 31,733 | 460,093 | 183 | 14 |
| 181 | FR: Lille | 31,700 | 1,366,909 | 1647 | 16 |
| 182 | FR: Poitiers | 31,591 | 266,275 | 118 | 13 |
| 183 | FR: Montpellier | 31,425 | 668,380 | 372 | 12 |
| 184 | JPN: Obihiro | 31,404 | 262,830 | 150 | 9 |
| 185 | DE: Dresden | 31,378 | 1,327,534 | 241 | 16 |
| 186 | JPN: Himeji | 31,342 | 720,892 | 1139 | 16 |
| 187 | FR: Le Mans | 31,328 | 355,467 | 171 | 15 |
| 188 | JPN: Sapporo | 31,201 | 2,192,770 | 1629 | 11 |
| 189 | UK: Leicester | 31,141 | 849,964 | 728 | 13 |
| 190 | ES: Valladolid | 30,983 | 414,196 | 431 | 8 |
| 191 | UK: Leeds | 30,926 | 2,550,810 | 740 | 12 |
| 192 | JPN: Yamagata | 30,785 | 422,839 | 571 | 13 |
| 193 | UK: Norwich | 30,726 | 388,299 | 266 | 12 |
| 194 | DE: Kaiserslautern | 30,696 | 273,554 | 226 | 14 |
| 195 | DE: Bremerhaven | 30,604 | 307,055 | 149 | 11 |
| 196 | JPN: Aomori | 30,530 | 309,601 | 585 | 11 |
| 197 | FR: Nancy | 30,446 | 474,407 | 176 | 14 |
| 198 | FR: Dunkerque | 30,390 | 273,513 | 425 | 17 |
| 199 | JPN: Hakodate | 30,317 | 345,811 | 562 | 10 |
| 200 | JPN: Hachinohe | 30,196 | 324,182 | 405 | 10 |
| 201 | USA: El Paso (TX) | 30,194 | 833,522 | 70 | 8 |
| 202 | JPN: Akita | 30,093 | 399,793 | 624 | 13 |
| 203 | JPN: Miyazaki | 29,868 | 493,598 | 639 | 15 |
| 204 | JPN: Kumamoto | 29,811 | 1,130,440 | 753 | 20 |
| 205 | FR: Amiens | 29,772 | 309,154 | 145 | 17 |
| 206 | DE: Zwickau | 29,645 | 329,603 | 390 | 15 |
| 207 | UK: Nottingham | 29,576 | 884,410 | 1068 | 13 |
| 208 | UK: Dundee City | 29,547 | 264,390 | 121 | 8 |
| 209 | FR: Mulhouse | 29,505 | 407,282 | 414 | 16 |
| 210 | FR: Angers | 29,380 | 406,872 | 227 | 14 |
| 211 | DE: Hildesheim | 29,355 | 276,440 | 248 | 12 |
| 212 | FR: Besancon | 29,345 | 270,164 | 138 | 15 |
| 213 | JPN: Nagasaki | 29,342 | 641,205 | 1869 | 17 |
| 214 | UK: Liverpool | 29,312 | 1,178,689 | 6204 | 13 |
| 215 | DE: Schwerin | 29,287 | 303,031 | 64 | 11 |
| 216 | JPN: Kagoshima | 29,173 | 715,775 | 1473 | 15 |
| 217 | FR: Limoges | 29,160 | 307,992 | 114 | 12 |
| 218 | FR: Brest | 29,048 | 365,055 | 336 | 10 |
| 219 | FR: Saint-Etienne | 28,911 | 526,369 | 425 | 13 |
| 220 | UK: Plymouth | 28,849 | 396,686 | 193 | 11 |
| 221 | UK: Exeter | 28,828 | 460,870 | 192 | 11 |
| 222 | UK: Blackburn with Darwen | 28,709 | 285,594 | 489 | 10 |
| 223 | UK: Newcastle upon Tyne | 28,450 | 1,152,859 | 230 | 9 |
| 224 | ES: Oviedo | 28,336 | 304,133 | 407 | 8 |
| 225 | JPN: Kochi | 28,335 | 513,465 | 342 | 16 |
| 226 | ES: Valencia | 28,298 | 1,663,496 | 1243 | 12 |
| 227 | ES: Santander | 27,833 | 372,909 | 608 | 9 |
| 228 | DE: Neubrandenburg | 27,794 | 278,044 | 48 | 12 |
| 229 | UK: Cardiff | 27,691 | 767,542 | 1095 | 13 |
| 230 | ES: Santa Cruz de Tenerife | 27,235 | 492,820 | 1311 | 12 |
| 231 | DE: Gorlitz | 27,186 | 264,402 | 130 | 17 |
| 232 | FR: Metz | 27,067 | 368,383 | 247 | 14 |
| 233 | UK: Kingston upon Hull | 26,879 | 593,260 | 246 | 11 |
| 234 | UK: Lincoln | 26,721 | 296,097 | 143 | 11 |
| 235 | UK: Stoke-on-Trent | 26,405 | 472,866 | 822 | 11 |
| 236 | UK: Sheffield | 26,220 | 1,154,133 | 4197 | 12 |
| 237 | UK: Blackpool | 26,076 | 326,318 | 1966 | 13 |
| 238 | ES: Murcia | 26,062 | 591,669 | 1992 | 11 |
| 239 | UK: Middlesbrough | 25,983 | 467,304 | 1907 | 11 |
| 240 | UK: Swansea | 25,891 | 379,975 | 858 | 12 |
| 241 | JPN: Naha | 25,838 | 1,170,320 | 3715 | 8 |
| 242 | FR: Toulon | 25,681 | 553,594 | 818 | 13 |
| 243 | UK: Colchester | 25,622 | 317,030 | 932 | 14 |
| 244 | ES: Gijon | 25,587 | 296,163 | 863 | 9 |
| 245 | ES: Las Palmas | 25,354 | 620,841 | 1127 | 13 |
| 246 | ES: Vigo | 25,251 | 533,676 | 430 | 9 |
| 247 | ES: Elche/Elx | 25,221 | 249,200 | 4224 | 12 |
| 248 | FR: Perpignan | 25,092 | 389,016 | 326 | 11 |
| 249 | FR: Nimes | 24,987 | 338,177 | 414 | 11 |
| 250 | ES: Seville | 24,789 | 1,498,774 | 372 | 13 |
| 251 | ES: Alicante | 23,321 | 439,642 | 3891 | 12 |
| 252 | ES: Marbella | 23,226 | 285,326 | 509 | 13 |
| 253 | ES: Granada | 22,719 | 538,657 | 402 | 11 |
| Bottom 127 | ES: Cordoba | 22,057 | 355,038 | 577 | 11 |
Table A2.
Ranking of 254 cities into 5 subgroups by population density.
Table A2.
Ranking of 254 cities into 5 subgroups by population density.
| Rank | Cities | Density | gdp/Capita | Population | PM2.5 |
|---|---|---|---|---|---|
| 1 | JPN01: Tokyo | 8635 | 42,785 | 35,221,137 | 16 |
| 2 | UK006: Liverpool | 6204 | 29,312 | 1,178,689 | 13 |
| 3 | JPN25: Matsuyama | 6137 | 32,249 | 625,918 | 17 |
| 4 | JPN04: Fukuoka | 5918 | 32,630 | 2,680,715 | 21 |
| 5 | ES505: Elche/Elx | 4224 | 25,221 | 249,200 | 12 |
| 6 | UK010: Sheffield | 4197 | 26,220 | 1,154,133 | 12 |
| 7 | ES021: Alicante | 3891 | 23,321 | 439,642 | 12 |
| 8 | JPN10: Naha | 3715 | 25,838 | 1,170,320 | 8 |
| 9 | USA09: Miami (Greater) | 3413 | 42,808 | 6,014,211 | 7 |
| 10 | JPN08: Hiroshima | 3149 | 35,436 | 1,432,615 | 17 |
| 11 | UK001: London | 2897 | 55,954 | 11,544,026 | 15 |
| 12 | JPN09: Kitakyushu | 2680 | 32,749 | 1,332,183 | 20 |
| 13 | JPN03: Toyota | 2403 | 41,974 | 8,498,701 | 13 |
| 14 | USA11: Boston | 2343 | 73,186 | 4,276,297 | 8 |
| Top 15 | ES002: Barcelona | 2076 | 42,739 | 4,019,011 | 14 |
| 16 | ES007: Murcia | 1992 | 26,062 | 591,669 | 11 |
| 17 | UK553: Blackpool | 1966 | 26,076 | 326,318 | 13 |
| 18 | UK559: Middlesbrough | 1907 | 25,983 | 467,304 | 11 |
| 19 | JPN42: Kurume | 1898 | 34,202 | 409,982 | 19 |
| 20 | JPN24: Nagasaki | 1869 | 29,342 | 641,205 | 17 |
| 21 | UK008: Manchester | 1762 | 33,644 | 3,246,448 | 13 |
| 22 | USA01: New York (Greater) | 1757 | 70,399 | 20,000,933 | 10 |
| 23 | DE011: Dusseldorf | 1708 | 61,698 | 1,511,967 | 14 |
| 24 | FR009: Lille | 1647 | 31,700 | 1,366,909 | 16 |
| 25 | JPN05: Sapporo | 1629 | 31,201 | 2,192,770 | 11 |
| 26 | UK515: Brighton and Hove | 1502 | 32,843 | 440,222 | 16 |
| 27 | JPN19: Kagoshima | 1473 | 29,173 | 715,775 | 15 |
| 28 | JPN15: Niigata | 1446 | 34,529 | 805,385 | 14 |
| 29 | JPN06: Sendai | 1435 | 36,011 | 1,464,672 | 13 |
| Top 30 | ES025: Santa Cruz de Tenerife | 1311 | 27,235 | 492,820 | 12 |
| 31 | USA05: San Francisco (Greater) | 1285 | 84,921 | 6,457,022 | 11 |
| 32 | JPN28: Takamatsu | 1285 | 34,900 | 562,614 | 15 |
| 33 | ES003: Valencia | 1243 | 28,298 | 1,663,496 | 12 |
| 34 | FR001: Paris | 1186 | 61,301 | 11,866,785 | 17 |
| 35 | JPN33: Wakayama | 1180 | 34,473 | 541,730 | 15 |
| 36 | JPN12: Yokkaichi | 1145 | 38,989 | 1,058,231 | 14 |
| 37 | JPN20: Himeji | 1139 | 31,342 | 720,892 | 16 |
| 38 | ES008: Las Palmas | 1127 | 25,354 | 620,841 | 13 |
| 39 | JPN31: Numazu | 1100 | 39,600 | 553,358 | 13 |
| 40 | UK009: Cardiff | 1095 | 27,691 | 767,542 | 13 |
| 41 | USA03: Chicago | 1089 | 58,099 | 9,548,402 | 11 |
| 42 | JPN38: Fujieda | 1069 | 39,605 | 457,650 | 14 |
| 43 | USA27: New Haven | 1068 | 69,899 | 1,807,423 | 10 |
| 44 | UK029: Nottingham | 1068 | 29,576 | 884,410 | 13 |
| 45 | UK011: Bristol | 1048 | 40,865 | 913,519 | 14 |
| 46 | DE507: Aachen | 995 | 38,469 | 539,521 | 13 |
| 47 | ES001: Madrid | 991 | 42,105 | 6,379,915 | 10 |
| 48 | USA53: Providence | 980 | 42,772 | 969,960 | 9 |
| 49 | JPN07: Kurashiki | 962 | 34,908 | 1,516,388 | 16 |
| 50 | JPN23: Toyohashi | 961 | 44,353 | 665,226 | 14 |
| 51 | UK546: Colchester | 932 | 25,622 | 317,030 | 14 |
| 52 | USA13: Detroit (Greater) | 885 | 48,811 | 4,360,382 | 11 |
| 53 | ES023: Gijon | 863 | 25,587 | 296,163 | 9 |
| 54 | UK517: Swansea | 858 | 25,891 | 379,975 | 12 |
| 55 | JPN26: Toyama | 828 | 37,118 | 593,754 | 12 |
| 56 | USA44: Erie (NY) | 823 | 43,694 | 1,136,993 | 11 |
| 57 | UK027: Stoke-on-Trent | 822 | 26,405 | 472,866 | 11 |
| 58 | FR032: Toulon | 818 | 25,681 | 553,594 | 13 |
| 59 | DE007: Stuttgart | 802 | 56,386 | 2,648,143 | 16 |
| Top 60 | DE034: Bonn | 797 | 51,515 | 889,551 | 13 |
| 61 | UK518: Derby | 783 | 33,806 | 472,015 | 14 |
| 62 | UK004: Glasgow | 780 | 32,740 | 1,790,510 | 10 |
| 63 | ES019: Bilbao | 770 | 36,936 | 1,033,172 | 11 |
| 64 | UK033: Guildford | 764 | 49,131 | 263,440 | 12 |
| 65 | USA06: Philadelphia (Greater) | 756 | 61,836 | 6,407,666 | 10 |
| 66 | JPN11: Kumamoto | 753 | 29,811 | 1,130,440 | 20 |
| 67 | UK003: Leeds | 740 | 30,926 | 2,550,810 | 12 |
| 68 | JPN29: Nagano | 732 | 33,981 | 572,858 | 12 |
| 69 | UK014: Leicester | 728 | 31,141 | 849,964 | 13 |
| 70 | USA97: Knox | 723 | 38,534 | 463,248 | 9 |
| 71 | JPN17: Kanazawa | 722 | 39,658 | 684,018 | 13 |
| 72 | FR034: Valenciennes | 687 | 32,133 | 358,729 | 16 |
| 73 | JPN14: Hamamatsu | 681 | 40,014 | 957,085 | 13 |
| 74 | JPN21: Mito | 681 | 36,331 | 703,770 | 14 |
| 75 | DE037: Mainz | 671 | 49,981 | 405,874 | 15 |
| 76 | DE035: Karlsruhe | 667 | 51,240 | 722,801 | 16 |
| 77 | DE084: Mannheim-Ludwigshafen | 661 | 49,358 | 1,145,686 | 16 |
| 78 | DE025: Darmstadt | 661 | 46,621 | 434,462 | 16 |
| 79 | DE005: Frankfurt am Main | 648 | 60,351 | 2,544,366 | 15 |
| 80 | USA41: Pittsburgh | 646 | 50,378 | 1,441,884 | 11 |
| 81 | JPN16: Utsunomiya | 646 | 38,171 | 882,046 | 14 |
| 82 | USA66: Montgomery (OH) | 646 | 43,485 | 697,435 | 11 |
| 83 | DE522: Heidelberg | 639 | 41,759 | 677,291 | 16 |
| 84 | JPN36: Miyazaki | 639 | 29,868 | 493,598 | 15 |
| 85 | JPN43: Akita | 624 | 30,093 | 399,793 | 13 |
| 86 | FR003: Lyon | 622 | 45,114 | 1,958,191 | 17 |
| 87 | JPN30: Tokushima | 620 | 35,601 | 569,456 | 15 |
| 88 | ES015: Santander | 608 | 27,833 | 372,909 | 9 |
| 89 | DE040: Saarbrucken | 586 | 40,635 | 800,458 | 14 |
| 90 | USA40: Hartford | 585 | 64,337 | 1,216,966 | 9 |
| 91 | JPN51: Aomori | 585 | 30,530 | 309,601 | 11 |
| 92 | UK007: Edinburgh | 582 | 42,842 | 849,720 | 9 |
| 93 | ES020: Cordoba | 577 | 22,057 | 355,038 | 11 |
| 94 | JPN41: Yamagata | 571 | 30,785 | 422,839 | 13 |
| 95 | JPN18: Oita | 568 | 32,635 | 732,952 | 17 |
| 96 | JPN48: Hakodate | 562 | 30,317 | 345,811 | 10 |
| 97 | USA04: Washington (Greater) | 561 | 68,073 | 8,794,922 | 10 |
| 98 | DE020: Wiesbaden | 559 | 51,140 | 453,599 | 14 |
| 99 | JPN39: Fukushima | 548 | 33,569 | 449,041 | 12 |
| 100 | FR012: Le Havre | 537 | 33,328 | 297,916 | 16 |
| 101 | DE533: Pforzheim | 536 | 38,695 | 307,352 | 15 |
| 102 | JPN34: Koriyama | 513 | 33,754 | 518,284 | 12 |
| 103 | ES533: Marbella | 509 | 23,226 | 285,326 | 13 |
| 104 | FR039: Avignon | 505 | 32,098 | 318,245 | 13 |
| 105 | UK557: Blackburn with Darwen | 489 | 28,709 | 285,594 | 10 |
| 106 | DE002: Hamburg | 487 | 52,487 | 3,143,783 | 11 |
| 107 | USA32: Milwaukee | 485 | 58,426 | 1,571,740 | 10 |
| 108 | UK520: Southampton | 481 | 37,211 | 664,608 | 13 |
| 109 | USA29: Sacramento | 478 | 44,680 | 2,213,564 | 11 |
| 110 | JPN40: Matsumoto | 477 | 33,581 | 426,101 | 11 |
| 111 | USA10: Atlanta | 465 | 52,745 | 5,183,715 | 10 |
| 112 | DE504: Muenster | 461 | 49,276 | 512,138 | 12 |
| 113 | DE013: Hannover | 458 | 44,588 | 1,267,062 | 12 |
| 114 | USA116: Allen | 453 | 41,952 | 396,450 | 10 |
| 115 | DE045: Iserlohn | 451 | 39,246 | 420,986 | 12 |
| 116 | FR006: Strasbourg | 449 | 35,874 | 771,559 | 16 |
| 117 | JPN27: Kofu | 433 | 34,222 | 586,614 | 12 |
| 118 | ES009: Valladolid | 431 | 30,983 | 414,196 | 8 |
| 119 | ES022: Vigo | 430 | 25,251 | 533,676 | 9 |
| 120 | USA145: Nashville | 427 | 58,031 | 294,618 | 10 |
| 121 | FR011: Saint-Etienne | 425 | 28,911 | 526,369 | 13 |
| 122 | FR042: Dunkerque | 425 | 30,390 | 273,513 | 17 |
| 123 | JPN50: Hitachi | 420 | 35,740 | 316,365 | 13 |
| 124 | FR040: Mulhouse | 414 | 29,505 | 407,282 | 16 |
| 125 | FR044: Nimes | 414 | 24,987 | 338,177 | 11 |
| 126 | ES013: Oviedo | 407 | 28,336 | 304,133 | 8 |
| Top 127 | JPN49: Hachinohe | 405 | 30,196 | 324,182 | 10 |
| 128 | ES501: Granada | 402 | 22,719 | 538,657 | 11 |
| 129 | DE529: Heilbronn | 402 | 55,901 | 441,943 | 17 |
| 130 | DE042: Koblenz | 392 | 48,496 | 319,944 | 13 |
| 131 | DE544: Zwickau | 390 | 29,645 | 329,603 | 15 |
| 132 | ES004: Seville | 372 | 24,789 | 1,498,774 | 13 |
| 133 | FR010: Montpellier | 372 | 31,425 | 668,380 | 12 |
| 134 | ES010: Palma de Mallorca | 355 | 34,502 | 643,352 | 11 |
| 135 | FR205: Nice | 353 | 36,979 | 824,441 | 16 |
| 136 | FR008: Nantes | 348 | 36,454 | 915,985 | 13 |
| 137 | DE033: Augsburg | 345 | 40,217 | 639,038 | 17 |
| 138 | USA28: Charlotte | 343 | 55,486 | 1,839,138 | 9 |
| 139 | JPN35: Kochi | 342 | 28,335 | 513,465 | 16 |
| 140 | FR037: Brest | 336 | 29,048 | 365,055 | 10 |
| 141 | DE513: Kassel | 331 | 40,851 | 427,403 | 14 |
| 142 | FR043: Perpignan | 326 | 25,092 | 389,016 | 11 |
| 143 | USA56: Rochester (NY) | 320 | 46,221 | 857,051 | 10 |
| 144 | USA12: Phoenix | 315 | 43,099 | 4,390,565 | 12 |
| 145 | FR215: Rouen | 313 | 34,337 | 689,626 | 16 |
| 146 | UK528: Northampton | 313 | 35,711 | 457,540 | 13 |
| 147 | JPN32: Fukui | 306 | 36,794 | 547,512 | 14 |
| 148 | DE027: Freiburg im Breisgau | 303 | 39,783 | 623,036 | 15 |
| 149 | DE001: Berlin | 302 | 36,248 | 4,950,913 | 14 |
| 150 | DE510: Lubeck | 295 | 34,352 | 407,813 | 11 |
| 151 | DE018: Halle an der Saale | 292 | 33,026 | 420,210 | 14 |
| 152 | USA43: Virginia Beach | 286 | 46,383 | 1,165,789 | 9 |
| 153 | USA08: Houston | 285 | 72,001 | 6,422,530 | 9 |
| 154 | FR026: Grenoble | 282 | 34,031 | 661,221 | 16 |
| 155 | UK560: Oxford | 281 | 44,033 | 527,670 | 13 |
| 156 | DE523: Paderborn | 281 | 37,865 | 298,853 | 12 |
| 157 | DE083: Braunschweig-Salzgitter Wolfsburg | 279 | 48,491 | 977,157 | 13 |
| 158 | USA07: Dallas | 272 | 60,787 | 6,980,428 | 10 |
| 159 | DE537: Reutlingen | 272 | 42,986 | 273,578 | 16 |
| 160 | USA21: Cincinnati | 268 | 54,682 | 2,084,836 | 11 |
| 161 | FR004: Toulouse | 267 | 42,275 | 1,277,646 | 12 |
| 162 | DE008: Leipzig | 266 | 33,626 | 978,997 | 15 |
| 163 | UK566: Norwich | 266 | 30,726 | 388,299 | 12 |
| 164 | DE532: Ulm | 263 | 47,753 | 470,839 | 16 |
| 165 | DE061: Aschaffenburg | 261 | 43,603 | 368,348 | 16 |
| 166 | USA30: Austin | 257 | 55,841 | 1,894,164 | 8 |
| 167 | FR048: Annecy | 256 | 32,023 | 272,588 | 15 |
| 168 | DE079: Wetzlar | 255 | 35,552 | 251,578 | 13 |
| 169 | DE542: Hildesheim | 248 | 29,355 | 276,440 | 12 |
| 170 | FR017: Metz | 247 | 27,067 | 368,383 | 14 |
| 171 | UK026: Kingston upon Hull | 246 | 26,879 | 593,260 | 11 |
| 172 | DE540: Siegen | 244 | 38,160 | 405,088 | 12 |
| 173 | DE009: Dresden | 241 | 31,378 | 1,327,534 | 16 |
| 174 | ES014: Pamplona | 241 | 38,280 | 362,229 | 11 |
| 175 | DE517: Osnabruck | 239 | 38,113 | 506,726 | 12 |
| 176 | USA15: Minneapolis | 238 | 61,415 | 3,405,918 | 10 |
| 177 | USA17: St. Louis | 237 | 49,457 | 2,596,184 | 10 |
| 178 | FR007: Bordeaux | 235 | 35,367 | 1,174,012 | 12 |
| 179 | UK569: Ipswich | 235 | 31,738 | 349,520 | 13 |
| 180 | USA25: Indianapolis | 232 | 60,360 | 1,938,160 | 11 |
| 181 | DE073: Offenburg | 232 | 42,147 | 412,179 | 15 |
| 182 | JPN44: Asahikawa | 232 | 32,090 | 388,628 | 9 |
| 183 | UK017: Cambridge | 232 | 40,261 | 360,154 | 13 |
| 184 | UK013: Newcastle upon Tyne | 230 | 28,450 | 1,152,859 | 9 |
| 185 | FR036: Angers | 227 | 29,380 | 406,872 | 14 |
| 186 | DE026: Trier | 227 | 33,037 | 248,567 | 13 |
| 187 | USA18: Denver | 226 | 60,752 | 2,696,308 | 8 |
| 188 | DE044: Kaiserslautern | 226 | 30,696 | 273,554 | 14 |
| 189 | DE520: Oldenburg (Oldenburg) | 224 | 36,096 | 402,152 | 11 |
| 190 | DE012: Bremen | 221 | 42,075 | 1,230,691 | 12 |
| 191 | FR013: Rennes | 219 | 35,966 | 701,153 | 13 |
| 192 | DE069: Rosenheim | 213 | 37,486 | 307,074 | 18 |
| 193 | FR023: Caen | 211 | 32,169 | 434,109 | 14 |
| 194 | FR022: Clermont-Ferrand | 202 | 34,545 | 476,713 | 13 |
| 195 | USA20: Portland | 201 | 61,332 | 2,209,459 | 6 |
| 196 | DE032: Erfurt | 201 | 33,561 | 519,509 | 15 |
| 197 | ES012: Vitoria | 200 | 46,600 | 264,719 | 10 |
| 198 | USA45: Fresno (Greater) | 198 | 35,140 | 1,105,606 | 15 |
| 199 | DE039: Kiel | 195 | 36,979 | 632,735 | 10 |
| 200 | UK516: Plymouth | 193 | 28,849 | 396,686 | 11 |
| 201 | USA31: Columbus | 192 | 55,401 | 1,935,123 | 12 |
| 202 | UK018: Exeter | 192 | 28,828 | 460,870 | 11 |
| 203 | FR035: Tours | 183 | 31,733 | 460,093 | 14 |
| 204 | DE028: Regensburg | 178 | 50,009 | 436,621 | 18 |
| 205 | JPN37: Morioka | 178 | 36,463 | 413,105 | 10 |
| 206 | FR016: Nancy | 176 | 30,446 | 474,407 | 14 |
| 207 | DE534: Ingolstadt | 171 | 68,518 | 463,060 | 18 |
| 208 | FR038: Le Mans | 171 | 31,328 | 355,467 | 15 |
| 209 | DE021: Gottingen | 169 | 35,692 | 383,137 | 14 |
| 210 | DE524: Wurzburg | 168 | 41,216 | 497,551 | 16 |
| 211 | FR019: Orleans | 164 | 34,633 | 424,619 | 14 |
| 212 | USA69: Charleston | 152 | 43,545 | 711,407 | 9 |
| 213 | USA42: New Orleans | 150 | 56,524 | 1,219,579 | 8 |
| 214 | JPN53: Obihiro | 150 | 31,404 | 262,830 | 9 |
| 215 | DE527: Bremerhaven | 149 | 30,604 | 307,055 | 11 |
| 216 | USA37: Memphis | 146 | 47,895 | 1,302,172 | 10 |
| 217 | FR045: Pau | 146 | 34,751 | 267,702 | 11 |
| 218 | FR014: Amiens | 145 | 29,772 | 309,154 | 17 |
| 219 | UK019: Lincoln | 143 | 26,721 | 296,097 | 11 |
| 220 | DE052: Flensburg | 138 | 33,897 | 274,656 | 9 |
| 221 | FR025: Besancon | 138 | 29,345 | 270,164 | 15 |
| 222 | FR018: Reims | 137 | 35,964 | 320,879 | 15 |
| 223 | DE077: Schweinfurt | 136 | 44,541 | 267,890 | 16 |
| 224 | USA83: Hamilton (TN) | 134 | 40,424 | 542,036 | 11 |
| 225 | USA33: Jacksonville | 132 | 39,619 | 1,485,547 | 9 |
| 226 | DE074: Gorlitz | 130 | 27,186 | 264,402 | 17 |
| 227 | DE019: Magdeburg | 125 | 33,017 | 496,349 | 14 |
| 228 | USA24: Jackson (MO) | 124 | 52,441 | 1,977,173 | 9 |
| 229 | USA19: San Antonio | 122 | 41,750 | 2,298,261 | 8 |
| 230 | DE043: Rostock | 121 | 32,549 | 412,399 | 11 |
| 231 | UK550: Dundee City | 121 | 29,547 | 264,390 | 8 |
| 232 | USA39: Oklahoma | 120 | 50,025 | 1,281,128 | 9 |
| 233 | USA52: Albany | 118 | 45,650 | 976,721 | 8 |
| 234 | FR021: Poitiers | 118 | 31,591 | 266,275 | 13 |
| 235 | FR024: Limoges | 114 | 29,160 | 307,992 | 12 |
| 236 | FR020: Dijon | 111 | 36,390 | 402,912 | 15 |
| 237 | USA132: Lancaster (NE) | 110 | 49,898 | 328,854 | 11 |
| 238 | USA46: Richmond (Greater) | 101 | 51,870 | 1,112,531 | 9 |
| 239 | USA60: East Baton Rouge | 84 | 55,885 | 819,304 | 10 |
| 240 | USA119: Tallahassee | 81 | 35,883 | 373,212 | 9 |
| 241 | UK016: Aberdeen | 77 | 54,812 | 484,840 | 6 |
| 242 | USA59: El Paso (TX) | 70 | 30,194 | 833,522 | 8 |
| 243 | USA135: Roanoke | 65 | 42,757 | 311,993 | 8 |
| 244 | DE031: Schwerin | 64 | 29,287 | 303,031 | 11 |
| 245 | USA51: Tulsa | 59 | 59,447 | 1,002,698 | 10 |
| 246 | USA34: Salt Lake | 54 | 51,295 | 1,539,116 | 9 |
| 247 | USA108: Lafayette | 54 | 43,007 | 427,049 | 12 |
| 248 | USA89: Spokane | 51 | 37,376 | 501,584 | 8 |
| 249 | DE064: Neubrandenburg | 48 | 27,794 | 278,044 | 12 |
| 250 | USA162: Tuscaloosa | 43 | 43,490 | 244,054 | 11 |
| 251 | USA96: Montgomery (AL) | 39 | 33,516 | 451,815 | 11 |
| 252 | USA126: Lubbock | 29 | 33,053 | 351,009 | 6 |
| 253 | USA22: Las Vegas | 28 | 41,274 | 2,074,253 | 7 |
| Bottom 127 | USA54: Albuquerque | 28 | 38,603 | 929,424 | 7 |
Table A3.
Ranking of 254 cities into 5 subgroups by population.
Table A3.
Ranking of 254 cities into 5 subgroups by population.
| Rank | Cities | Population | Density | gdp/Capita | PM2.5 |
|---|---|---|---|---|---|
| 1 | JPN: Tokyo | 35,221,137 | 8635 | 42,785 | 16 |
| 2 | USA: New York (Greater) | 20,000,933 | 1757 | 70,399 | 10 |
| 3 | FR: Paris | 11,866,785 | 1186 | 61,301 | 17 |
| 4 | UK: London | 11,544,026 | 2897 | 55,954 | 15 |
| 5 | USA: Chicago | 9,548,402 | 1089 | 58,099 | 11 |
| 6 | USA: Washington (Greater) | 8,794,922 | 561 | 68,073 | 10 |
| 7 | JPN: Toyota | 8,498,701 | 2403 | 41,974 | 13 |
| 8 | USA: Dallas | 6,980,428 | 272 | 60,787 | 10 |
| 9 | USA: San Francisco (Greater) | 6,457,022 | 1285 | 84,921 | 11 |
| 10 | USA: Houston | 6,422,530 | 285 | 72,001 | 9 |
| 11 | USA: Philadelphia (Greater) | 6,407,666 | 756 | 61,836 | 10 |
| 12 | ES: Madrid | 6,379,915 | 991 | 42,105 | 10 |
| 13 | USA: Miami (Greater) | 6,014,211 | 3413 | 42,808 | 7 |
| 14 | USA: Atlanta | 5,183,715 | 465 | 52,745 | 10 |
| Top 15 | DE: Berlin | 4,950,913 | 302 | 36,248 | 14 |
| 16 | USA: Phoenix | 4,390,565 | 315 | 43,099 | 12 |
| 17 | USA: Detroit (Greater) | 4,360,382 | 885 | 48,811 | 11 |
| 18 | USA: Boston | 4,276,297 | 2343 | 73,186 | 8 |
| 19 | ES: Barcelona | 4,019,011 | 2076 | 42,739 | 14 |
| 20 | USA: Minneapolis | 3,405,918 | 238 | 61,415 | 10 |
| 21 | UK: Manchester | 3,246,448 | 1762 | 33,644 | 13 |
| 22 | DE: Hamburg | 3,143,783 | 487 | 52,487 | 11 |
| 23 | USA: Denver | 2,696,308 | 226 | 60,752 | 8 |
| 24 | JPN: Fukuoka | 2,680,715 | 5918 | 32,630 | 21 |
| 25 | DE: Stuttgart | 2,648,143 | 802 | 56,386 | 16 |
| 26 | USA: St. Louis | 2,596,184 | 237 | 49,457 | 10 |
| 27 | UK: Leeds | 2,550,810 | 740 | 30,926 | 12 |
| 28 | DE: Frankfurt am Main | 2,544,366 | 648 | 60,351 | 15 |
| 29 | USA: San Antonio | 2,298,261 | 122 | 41,750 | 8 |
| Top 30 | USA: Sacramento | 2,213,564 | 478 | 44,680 | 11 |
| 31 | USA: Portland | 2,209,459 | 201 | 61,332 | 6 |
| 32 | JPN: Sapporo | 2,192,770 | 1629 | 31,201 | 11 |
| 33 | USA: Cincinnati | 2,084,836 | 268 | 54,682 | 11 |
| 34 | USA: Las Vegas | 2,074,253 | 28 | 41,274 | 7 |
| 35 | USA: Jackson (MO) | 1,977,173 | 124 | 52,441 | 9 |
| 36 | FR: Lyon | 1,958,191 | 622 | 45,114 | 17 |
| 37 | USA: Indianapolis | 1,938,160 | 232 | 60,360 | 11 |
| 38 | USA: Columbus | 1,935,123 | 192 | 55,401 | 12 |
| 39 | USA: Austin | 1,894,164 | 257 | 55,841 | 8 |
| 40 | USA: Charlotte | 1,839,138 | 343 | 55,486 | 9 |
| 41 | USA: New Haven | 1,807,423 | 1068 | 69,899 | 10 |
| 42 | UK: Glasgow | 1,790,510 | 780 | 32,740 | 10 |
| 43 | ES: Valencia | 1,663,496 | 1243 | 28,298 | 12 |
| 44 | USA: Milwaukee | 1,571,740 | 485 | 58,426 | 10 |
| 45 | USA: Salt Lake | 1,539,116 | 54 | 51,295 | 9 |
| 46 | JPN: Kurashiki | 1,516,388 | 962 | 34,908 | 16 |
| 47 | DE: Dusseldorf | 1,511,967 | 1708 | 61,698 | 14 |
| 48 | ES: Seville | 1,498,774 | 372 | 24,789 | 13 |
| 49 | USA: Jacksonville | 1,485,547 | 132 | 39,619 | 9 |
| 50 | JPN: Sendai | 1,464,672 | 1435 | 36,011 | 13 |
| 51 | USA: Pittsburgh | 1,441,884 | 646 | 50,378 | 11 |
| 52 | JPN: Hiroshima | 1,432,615 | 3149 | 35,436 | 17 |
| 53 | FR: Lille | 1,366,909 | 1647 | 31,700 | 16 |
| 54 | JPN: Kitakyushu | 1,332,183 | 2680 | 32,749 | 20 |
| 55 | DE: Dresden | 1,327,534 | 241 | 31,378 | 16 |
| 56 | USA: Memphis | 1,302,172 | 146 | 47,895 | 10 |
| 57 | USA: Oklahoma | 1,281,128 | 120 | 50,025 | 9 |
| 58 | FR: Toulouse | 1,277,646 | 267 | 42,275 | 12 |
| 59 | DE: Hannover | 1,267,062 | 458 | 44,588 | 12 |
| Top 60 | DE: Bremen | 1,230,691 | 221 | 42,075 | 12 |
| 61 | USA: New Orleans | 1,219,579 | 150 | 56,524 | 8 |
| 62 | USA: Hartford | 1,216,966 | 585 | 64,337 | 9 |
| 63 | UK: Liverpool | 1,178,689 | 6204 | 29,312 | 13 |
| 64 | FR: Bordeaux | 1,174,012 | 235 | 35,367 | 12 |
| 65 | JPN: Naha | 1,170,320 | 3715 | 25,838 | 8 |
| 66 | USA: Virginia Beach | 1,165,789 | 286 | 46,383 | 9 |
| 67 | UK: Sheffield | 1,154,133 | 4197 | 26,220 | 12 |
| 68 | UK: Newcastle upon Tyne | 1,152,859 | 230 | 28,450 | 9 |
| 69 | DE: Mannheim-Ludwigshafen | 1,145,686 | 661 | 49,358 | 16 |
| 70 | USA: Erie (NY) | 1,136,993 | 823 | 43,694 | 11 |
| 71 | JPN: Kumamoto | 1,130,440 | 753 | 29,811 | 20 |
| 72 | USA: Richmond (Greater) | 1,112,531 | 101 | 51,870 | 9 |
| 73 | USA: Fresno (Greater) | 1,105,606 | 198 | 35,140 | 15 |
| 74 | JPN: Yokkaichi | 1,058,231 | 1145 | 38,989 | 14 |
| 75 | ES: Bilbao | 1,033,172 | 770 | 36,936 | 11 |
| 76 | USA: Tulsa | 1,002,698 | 59 | 59,447 | 10 |
| 77 | DE: Leipzig | 978,997 | 266 | 33,626 | 15 |
| 78 | DE: Braunschweig-Salzgitter Wolfsburg | 977,157 | 279 | 48,491 | 13 |
| 79 | USA: Albany | 976,721 | 118 | 45,650 | 8 |
| 80 | USA: Providence | 969,960 | 980 | 42,772 | 9 |
| 81 | JPN: Hamamatsu | 957,085 | 681 | 40,014 | 13 |
| 82 | USA: Albuquerque | 929,424 | 28 | 38,603 | 7 |
| 83 | FR: Nantes | 915,985 | 348 | 36,454 | 13 |
| 84 | UK: Bristol | 913,519 | 1048 | 40,865 | 14 |
| 85 | DE: Bonn | 889,551 | 797 | 51,515 | 13 |
| 86 | UK: Nottingham | 884,410 | 1068 | 29,576 | 13 |
| 87 | JPN: Utsunomiya | 882,046 | 646 | 38,171 | 14 |
| 88 | USA: Rochester (NY) | 857,051 | 320 | 46,221 | 10 |
| 89 | UK: Leicester | 849,964 | 728 | 31,141 | 13 |
| 90 | UK: Edinburgh | 849,720 | 582 | 42,842 | 9 |
| 91 | USA: El Paso (TX) | 833,522 | 70 | 30,194 | 8 |
| 92 | FR: Nice | 824,441 | 353 | 36,979 | 16 |
| 93 | USA: East Baton Rouge | 819,304 | 84 | 55,885 | 10 |
| 94 | JPN: Niigata | 805,385 | 1446 | 34,529 | 14 |
| 95 | DE: Saarbrucken | 800,458 | 586 | 40,635 | 14 |
| 96 | FR: Strasbourg | 771,559 | 449 | 35,874 | 16 |
| 97 | UK: Cardiff | 767,542 | 1095 | 27,691 | 13 |
| 98 | JPN: Oita | 732,952 | 568 | 32,635 | 17 |
| 99 | DE: Karlsruhe | 722,801 | 667 | 51,240 | 16 |
| 100 | JPN: Himeji | 720,892 | 1139 | 31,342 | 16 |
| 101 | JPN: Kagoshima | 715,775 | 1473 | 29,173 | 15 |
| 102 | USA: Charleston | 711,407 | 152 | 43,545 | 9 |
| 103 | JPN: Mito | 703,770 | 681 | 36,331 | 14 |
| 104 | FR: Rennes | 701,153 | 219 | 35,966 | 13 |
| 105 | USA: Montgomery (OH) | 697,435 | 646 | 43,485 | 11 |
| 106 | FR: Rouen | 689,626 | 313 | 34,337 | 16 |
| 107 | JPN: Kanazawa | 684,018 | 722 | 39,658 | 13 |
| 108 | DE: Heidelberg | 677,291 | 639 | 41,759 | 16 |
| 109 | FR: Montpellier | 668,380 | 372 | 31,425 | 12 |
| 110 | JPN: Toyohashi | 665,226 | 961 | 44,353 | 14 |
| 111 | UK: Southampton | 664,608 | 481 | 37,211 | 13 |
| 112 | FR: Grenoble | 661,221 | 282 | 34,031 | 16 |
| 113 | ES: Palma de Mallorca | 643,352 | 355 | 34,502 | 11 |
| 114 | JPN: Nagasaki | 641,205 | 1869 | 29,342 | 17 |
| 115 | DE: Augsburg | 639,038 | 345 | 40,217 | 17 |
| 116 | DE: Kiel | 632,735 | 195 | 36,979 | 10 |
| 117 | JPN: Matsuyama | 625,918 | 6137 | 32,249 | 17 |
| 118 | DE: Freiburg im Breisgau | 623,036 | 303 | 39,783 | 15 |
| 119 | ES: Las Palmas | 620,841 | 1127 | 25,354 | 13 |
| 120 | JPN: Toyama | 593,754 | 828 | 37,118 | 12 |
| 121 | UK: Kingston upon Hull | 593,260 | 246 | 26,879 | 11 |
| 122 | ES: Murcia | 591,669 | 1992 | 26,062 | 11 |
| 123 | JPN: Kofu | 586,614 | 433 | 34,222 | 12 |
| 124 | JPN: Nagano | 572,858 | 732 | 33,981 | 12 |
| 125 | JPN: Tokushima | 569,456 | 620 | 35,601 | 15 |
| 126 | JPN: Takamatsu | 562,614 | 1285 | 34,900 | 15 |
| Top 127 | FR: Toulon | 553,594 | 818 | 25,681 | 13 |
| 128 | JPN: Numazu | 553,358 | 1100 | 39,600 | 13 |
| 129 | JPN: Fukui | 547,512 | 306 | 36,794 | 14 |
| 130 | USA: Hamilton (TN) | 542,036 | 134 | 40,424 | 11 |
| 131 | JPN: Wakayama | 541,730 | 1180 | 34,473 | 15 |
| 132 | DE: Aachen | 539,521 | 995 | 38,469 | 13 |
| 133 | ES: Granada | 538,657 | 402 | 22,719 | 11 |
| 134 | ES: Vigo | 533,676 | 430 | 25,251 | 9 |
| 135 | UK: Oxford | 527,670 | 281 | 44,033 | 13 |
| 136 | FR: Saint-Etienne | 526,369 | 425 | 28,911 | 13 |
| 137 | DE: Erfurt | 519,509 | 201 | 33,561 | 15 |
| 138 | JPN: Koriyama | 518,284 | 513 | 33,754 | 12 |
| 139 | JPN: Kochi | 513,465 | 342 | 28,335 | 16 |
| 140 | DE: Muenster | 512,138 | 461 | 49,276 | 12 |
| 141 | DE: Osnabruck | 506,726 | 239 | 38,113 | 12 |
| 142 | USA: Spokane | 501,584 | 51 | 37,376 | 8 |
| 143 | DE: Wurzburg | 497,551 | 168 | 41,216 | 16 |
| 144 | DE: Magdeburg | 496,349 | 125 | 33,017 | 14 |
| 145 | JPN: Miyazaki | 493,598 | 639 | 29,868 | 15 |
| 146 | ES: Santa Cruz de Tenerife | 492,820 | 1311 | 27,235 | 12 |
| 147 | UK: Aberdeen | 484,840 | 77 | 54,812 | 6 |
| 148 | FR: Clermont-Ferrand | 476,713 | 202 | 34,545 | 13 |
| 149 | FR: Nancy | 474,407 | 176 | 30,446 | 14 |
| 150 | UK: Stoke-on-Trent | 472,866 | 822 | 26,405 | 11 |
| 151 | UK: Derby | 472,015 | 783 | 33,806 | 14 |
| 152 | DE: Ulm | 470,839 | 263 | 47,753 | 16 |
| 153 | UK: Middlesbrough | 467,304 | 1907 | 25,983 | 11 |
| 154 | USA: Knox | 463,248 | 723 | 38,534 | 9 |
| 155 | DE: Ingolstadt | 463,060 | 171 | 68,518 | 18 |
| 156 | UK: Exeter | 460,870 | 192 | 28,828 | 11 |
| 157 | FR: Tours | 460,093 | 183 | 31,733 | 14 |
| 158 | JPN: Fujieda | 457,650 | 1069 | 39,605 | 14 |
| 159 | UK: Northampton | 457,540 | 313 | 35,711 | 13 |
| 160 | DE: Wiesbaden | 453,599 | 559 | 51,140 | 14 |
| 161 | USA: Montgomery (AL) | 451,815 | 39 | 33,516 | 11 |
| 162 | JPN: Fukushima | 449,041 | 548 | 33,569 | 12 |
| 163 | DE: Heilbronn | 441,943 | 402 | 55,901 | 17 |
| 164 | UK: Brighton and Hove | 440,222 | 1502 | 32,843 | 16 |
| 165 | ES: Alicante | 439,642 | 3891 | 23,321 | 12 |
| 166 | DE: Regensburg | 436,621 | 178 | 50,009 | 18 |
| 167 | DE: Darmstadt | 434,462 | 661 | 46,621 | 16 |
| 168 | FR: Caen | 434,109 | 211 | 32,169 | 14 |
| 169 | DE: Kassel | 427,403 | 331 | 40,851 | 14 |
| 170 | USA: Lafayette | 427,049 | 54 | 43,007 | 12 |
| 171 | JPN: Matsumoto | 426,101 | 477 | 33,581 | 11 |
| 172 | FR: Orleans | 424,619 | 164 | 34,633 | 14 |
| 173 | JPN: Yamagata | 422,839 | 571 | 30,785 | 13 |
| 174 | DE: Iserlohn | 420,986 | 451 | 39,246 | 12 |
| 175 | DE: Halle an der Saale | 420,210 | 292 | 33,026 | 14 |
| 176 | ES: Valladolid | 414,196 | 431 | 30,983 | 8 |
| 177 | JPN: Morioka | 413,105 | 178 | 36,463 | 10 |
| 178 | DE: Rostock | 412,399 | 121 | 32,549 | 11 |
| 179 | DE: Offenburg | 412,179 | 232 | 42,147 | 15 |
| 180 | JPN: Kurume | 409,982 | 1898 | 34,202 | 19 |
| 181 | DE: Lubeck | 407,813 | 295 | 34,352 | 11 |
| 182 | FR: Mulhouse | 407,282 | 414 | 29,505 | 16 |
| 183 | FR: Angers | 406,872 | 227 | 29,380 | 14 |
| 184 | DE: Mainz | 405,874 | 671 | 49,981 | 15 |
| 185 | DE: Siegen | 405,088 | 244 | 38,160 | 12 |
| 186 | FR: Dijon | 402,912 | 111 | 36,390 | 15 |
| 187 | DE: Oldenburg (Oldenburg) | 402,152 | 224 | 36,096 | 11 |
| 188 | JPN: Akita | 399,793 | 624 | 30,093 | 13 |
| 189 | UK: Plymouth | 396,686 | 193 | 28,849 | 11 |
| 190 | USA: Allen | 396,450 | 453 | 41,952 | 10 |
| 191 | FR: Perpignan | 389,016 | 326 | 25,092 | 11 |
| 192 | JPN: Asahikawa | 388,628 | 232 | 32,090 | 9 |
| 193 | UK: Norwich | 388,299 | 266 | 30,726 | 12 |
| 194 | DE: Gottingen | 383,137 | 169 | 35,692 | 14 |
| 195 | UK: Swansea | 379,975 | 858 | 25,891 | 12 |
| 196 | USA: Tallahassee | 373,212 | 81 | 35,883 | 9 |
| 197 | ES: Santander | 372,909 | 608 | 27,833 | 9 |
| 198 | FR: Metz | 368,383 | 247 | 27,067 | 14 |
| 199 | DE: Aschaffenburg | 368,348 | 261 | 43,603 | 16 |
| 200 | FR: Brest | 365,055 | 336 | 29,048 | 10 |
| 201 | ES: Pamplona | 362,229 | 241 | 38,280 | 11 |
| 202 | UK: Cambridge | 360,154 | 232 | 40,261 | 13 |
| 203 | FR: Valenciennes | 358,729 | 687 | 32,133 | 16 |
| 204 | FR: Le Mans | 355,467 | 171 | 31,328 | 15 |
| 205 | ES: Cordoba | 355,038 | 577 | 22,057 | 11 |
| 206 | USA: Lubbock | 351,009 | 29 | 33,053 | 6 |
| 207 | UK: Ipswich | 349,520 | 235 | 31,738 | 13 |
| 208 | JPN: Hakodate | 345,811 | 562 | 30,317 | 10 |
| 209 | FR: Nimes | 338,177 | 414 | 24,987 | 11 |
| 210 | DE: Zwickau | 329,603 | 390 | 29,645 | 15 |
| 211 | USA: Lancaster (NE) | 328,854 | 110 | 49,898 | 11 |
| 212 | UK: Blackpool | 326,318 | 1966 | 26,076 | 13 |
| 213 | JPN: Hachinohe | 324,182 | 405 | 30,196 | 10 |
| 214 | FR: Reims | 320,879 | 137 | 35,964 | 15 |
| 215 | DE: Koblenz | 319,944 | 392 | 48,496 | 13 |
| 216 | FR: Avignon | 318,245 | 505 | 32,098 | 13 |
| 217 | UK: Colchester | 317,030 | 932 | 25,622 | 14 |
| 218 | JPN: Hitachi | 316,365 | 420 | 35,740 | 13 |
| 219 | USA: Roanoke | 311,993 | 65 | 42,757 | 8 |
| 220 | JPN: Aomori | 309,601 | 585 | 30,530 | 11 |
| 221 | FR: Amiens | 309,154 | 145 | 29,772 | 17 |
| 222 | FR: Limoges | 307,992 | 114 | 29,160 | 12 |
| 223 | DE: Pforzheim | 307,352 | 536 | 38,695 | 15 |
| 224 | DE: Rosenheim | 307,074 | 213 | 37,486 | 18 |
| 225 | DE: Bremerhaven | 307,055 | 149 | 30,604 | 11 |
| 226 | ES: Oviedo | 304,133 | 407 | 28,336 | 8 |
| 227 | DE: Schwerin | 303,031 | 64 | 29,287 | 11 |
| 228 | DE: Paderborn | 298,853 | 281 | 37,865 | 12 |
| 229 | FR: Le Havre | 297,916 | 537 | 33,328 | 16 |
| 230 | ES: Gijon | 296,163 | 863 | 25,587 | 9 |
| 231 | UK: Lincoln | 296,097 | 143 | 26,721 | 11 |
| 232 | USA: Nashville | 294,618 | 427 | 58,031 | 10 |
| 233 | UK: Blackburn with Darwen | 285,594 | 489 | 28,709 | 10 |
| 234 | ES: Marbella | 285,326 | 509 | 23,226 | 13 |
| 235 | DE: Neubrandenburg | 278,044 | 48 | 27,794 | 12 |
| 236 | DE: Hildesheim | 276,440 | 248 | 29,355 | 12 |
| 237 | DE: Flensburg | 274,656 | 138 | 33,897 | 9 |
| 238 | DE: Reutlingen | 273,578 | 272 | 42,986 | 16 |
| 239 | DE: Kaiserslautern | 273,554 | 226 | 30,696 | 14 |
| 240 | FR: Dunkerque | 273,513 | 425 | 30,390 | 17 |
| 241 | FR: Annecy | 272,588 | 256 | 32,023 | 15 |
| 242 | FR: Besancon | 270,164 | 138 | 29,345 | 15 |
| 243 | DE: Schweinfurt | 267,890 | 136 | 44,541 | 16 |
| 244 | FR: Pau | 267,702 | 146 | 34,751 | 11 |
| 245 | FR: Poitiers | 266,275 | 118 | 31,591 | 13 |
| 246 | ES: Vitoria | 264,719 | 200 | 46,600 | 10 |
| 247 | DE: Gorlitz | 264,402 | 130 | 27,186 | 17 |
| 248 | UK: Dundee City | 264,390 | 121 | 29,547 | 8 |
| 249 | UK: Guildford | 263,440 | 764 | 49,131 | 12 |
| 250 | JPN: Obihiro | 262,830 | 150 | 31,404 | 9 |
| 251 | DE: Wetzlar | 251,578 | 255 | 35,552 | 13 |
| 252 | ES: Elche/Elx | 249,200 | 4224 | 25,221 | 12 |
| 253 | DE: Trier | 248,567 | 227 | 33,037 | 13 |
| Bottom 127 | USA: Tuscaloosa | 244,054 | 43 | 43,490 | 11 |
References
- Han, L.; Zhou, W.; Pickett, S.T.A.; Li, W.; Li, L. An Optimum City Size? The Scaling Relationship for Urban Population and Fine Particulate (PM2.5) Concentration. Environ. Pollut. 2016, 208, 96–101. [Google Scholar] [CrossRef] [PubMed]
- Hao, Y.; Liu, Y.M. The Influential Factors of Urban PM2.5 Concentrations in China: A Spatial Econometric Analysis. J. Clean. Prod. 2016, 112, 1443–1453. [Google Scholar] [CrossRef]
- Wu, J.; Zhang, P.; Yi, H.; Qin, Z. What Causes Haze Pollution? An Empirical Study of PM2.5 Concentrations in Chinese Cities. Sustainability 2016, 8, 132. [Google Scholar] [CrossRef] [Green Version]
- Cheng, Z.; Li, L.; Liu, J. Identifying the spatial effects and driving factors of urban PM2.5 pollution in China. Ecol. Indic. 2017, 82, 61–75. [Google Scholar] [CrossRef]
- Wang, G.; Zhang, R.; Gomez, M.E.; Yang, L.; Zamora, M.L.; Hu, M.; Lin, Y.; Peng, J.; Guo, S.; Meng, J.; et al. Persistent sulfate formation from London Fog to Chinese haze. Int. J. Sociol. Soc. Policy 2016, 113, 13630–13635. [Google Scholar] [CrossRef] [PubMed] [Green Version]
- Wang, Z.B.; Fang, C.L. Spatial-temporal characteristics and determinants of PM2.5 in the Bohai Rim Urban Agglomeration. Chemosphere 2016, 148, 148–162. [Google Scholar] [CrossRef] [PubMed]
- Zhou, M.; He, G.; Fan, M.; Wang, Z.; Liu, Y.; Ma, J.; Ma, Z.; Liu, J.; Liu, Y.; Wang, L.; et al. Smog episodes, fine particu-late pollution and mortality in China. Environ. Res. 2015, 136, 396–404. [Google Scholar] [CrossRef] [PubMed]
- Wu, J.; Zheng, H.; Zhe, F.; Xie, W.; Song, J. Study on the relationship between urbanization and fine particulate matter (PM2.5) concentration and its implication in China. J. Clean. Prod. 2018, 182, 872–882. [Google Scholar] [CrossRef]
- Liu, Q.; Wang, S.; Zhang, W.; Li, J.; Dong, G. The effect of natural and anthropogenic factors on PM2.5: Empirical evidence from Chinese cities with different income levels. Sci. Total Environ. 2019, 653, 157–167. [Google Scholar] [CrossRef]
- Zhang, Y.; Shuai, C.; Bian, J.; Chen, X.; Wu, Y.; Shen, L. Socioeconomic factors of PM2.5 concentrations in 152 Chinese cities: Decomposition analysis using LMDI. J. Clean. Prod. 2019, 218, 96–107. [Google Scholar] [CrossRef]
- Han, L.; Zhou, W.; Li, W.; Li, L. Impact of Urbanization Level on Urban Air Quality: A Case of Fine Particles (PM2.5) in Chinese Cities. Environ. Pollut. 2014, 194, 163–170. [Google Scholar] [CrossRef]
- Lou, C.R.; Liu, H.Y.; Li, Y.F.; Li, Y.L. Socioeconomic Drivers of PM2.5 in the Accumulation Phase of Air Pollution Episodes in the Yangtze River Delta of China. Int. J. Environ. Res. Public Health 2016, 13, 928. [Google Scholar] [CrossRef] [Green Version]
- Carozzi, F.; Roth, S. Dirty Density: Air Quality and the Density of American Cities; IZA Discussion Papers No. 13191; IZA: Bonn, Germany, 2019. [Google Scholar]
- Borck, R.; Schrauth, P. Population density and urban air quality. Reg. Sci. Urban Econ. 2021, 86, 103596. [Google Scholar] [CrossRef]
- Zhou, C.; Chen, J.; Wang, S. Examining the effects of socioeconomic development on fine particulate matter (PM2.5) in China’s cities using spatial regression and the geographical detector technique. Sci. Total Environ. 2018, 619–620, 436–445. [Google Scholar] [CrossRef]
- Stone, B. Urban sprawl and air quality in large US cities. J. Environ. Manag. 2008, 86, 688–698. [Google Scholar] [CrossRef] [PubMed]
- Marshall, J.D.; Granvold, P.W.; Hoats, A.S.; McKone, T.E.; Deakin, E.; Nazaroff, W.W. Inhalation intake of ambient air pollution in California’s South Coast Air Basin. Atmos. Environ 2006, 40, 4381–4392. [Google Scholar] [CrossRef] [Green Version]
- Su, J.G.; Larson, T.; Gould, T.; Cohen, M.; Buzzelli, M. Transboundary air pollution and environmental justice: Vancouver and Seattle compared. GeoJournal 2010, 75, 595–608. [Google Scholar] [CrossRef]
- Bereitschaft, B.; Debbage, K. Urban Form, Air Pollution, and CO2 Emissions in Large U.S. Metropolitan Areas. Prof. Geogr. 2013, 65, 612–635. [Google Scholar] [CrossRef]
- Shah, R.U.; Robinson, E.S.; Gu, P.; Apte, J.S.; Marshall, J.D.; Robinson, A.L.; Presto, A.A. Socio-economic disparities in exposure to urban restaurant emissions are larger than for traffic. Environ. Res. Lett. 2020, 15, 4039. [Google Scholar] [CrossRef]
- Daouda, M.; Henneman, L.; Kioumourtzoglou, M.A.; Gemmill, A.; Zigler, C.; Casey, J.A. Association between county-level coal-fired power plant pollution and racial disparities in preterm births from 2000 to 2018. Environ. Res. Lett. 2021, 16, 4055. [Google Scholar] [CrossRef]
- Anenberg, S.C.; Achakulwisut, P.; Brauer, M.; Moran, D.; Apte, J.S.; Henze, D.K. Particulate matter-attributable mortality and relationships with carbon dioxide in 250 urban areas worldwide. Sci. Rep. 2019, 9, 11552. [Google Scholar] [CrossRef] [PubMed]
- Zhang, Y.; Chen, X.; Wu, Y.; Shuai, C.; Ye, G. Peaks of transportation CO2 emissions of 119 countries for sustainable development: Results from carbon Kuznets curve. Sustain Dev. 2020, 28, 550–571. [Google Scholar] [CrossRef]
- Lin, X.; Chen, J.; Lu, T.; Huang, D. Air Pollution Characteristics and Meteorological Correlates in Lin’an, Hangzhou, China. Aerosol Air Qual. Res. 2019, 19, 2770–2780. [Google Scholar] [CrossRef]
- Wang, S.; Zhou, C.; Wang, Z.; Feng, K.; Hubacek, K. The characteristics and drivers of fine particulate matter (PM2.5) distribution in China. J. Clean. Prod. 2017, 142, 1800–1809. [Google Scholar] [CrossRef]
- Han, L.; Zhou, W.; Li, W. City as a major source area of fine particulate (PM2.5) in China. Environ. Pollut. 2015, 206, 183–187. [Google Scholar] [CrossRef] [PubMed]
- Ahlfeldt, G.M.; Pietrostefani, E. The economic effects of density: A synthesis. J. Urban Econ. 2019, 111, 93–107. [Google Scholar] [CrossRef] [Green Version]
- Schweitzer, L.; Zhou, J. Neighborhood Air Quality, Respiratory Health, and Vulnerable Populations in Compact and Sprawled Regions. J. Am. Plann. Assoc. 2010, 76, 363–371. [Google Scholar] [CrossRef]
- Ewing, R.; Cervero, R. Travel and the Built Environment. J. Am. Plann. Assoc. 2010, 76, 265–294. [Google Scholar] [CrossRef]
- Clark, L.P.; Millet, D.B.; Marshall, J.D. Air Quality and Urban Form in U.S. Urban Areas: Evidence from Regulatory Monitors. Environ. Sci. Technol. 2011, 45, 7028–7035. [Google Scholar] [CrossRef]
- Rodríguez, M.C.; Courtade, L.D.; Oueslati, W. Air pollution and urban structure linkages: Evidence from European cities. Renew. Sustain. Energy Rev. 2016, 53, 1–9. [Google Scholar] [CrossRef]
- Han, S.; Sun, B.; Zhang, T. Mono- and polycentric urban spatial structure and PM2.5 concentrations: Regarding the dependence on population density. Habitat Int. 2020, 104, 102257. [Google Scholar] [CrossRef]
- Yuan, M.; Huang, Y.; Shen, H.; Li, T. Effects of urban form on haze pollution in China: Spatial regression analysis based on PM2.5 remote sensing data. Appl. Geogr. 2018, 98, 215–223. [Google Scholar] [CrossRef]
- Xiaohong, L. Effects of Urban Density and City Size on Haze Pollution in China: Spatial Regression Analysis Based on 253 Prefecture-Level Cities PM 2.5 Data. Discret. Dyn. Nat. Soc. 2019, 2019, 1–8. [Google Scholar] [CrossRef] [Green Version]
- Ouyang, X.; Qinglong, S.; Xiang, Z.; Qingyun, H.; Chao, X.; Guoen, W. Environmental regulation, economic growth and air pollution: Panel threshold analysis for OECD countries. Sci. Total Environ. 2019, 657, 234–241. [Google Scholar] [CrossRef] [PubMed]
- Dietz, T.; Rosa, E.A.; York, R. Environmentally efficient well-being: Rethinking sustainability as the relationship between human well-being and environmental impacts. J. Hum. Ecol. 2009, 16, 114–123. [Google Scholar]
- Steinberger, J.K.; Krausmann, F.; Eisenmenger, N. Global patterns of materials use: A socioeconomic and geophysical analysis. Ecol. Econ. 2010, 69, 1148–1158. [Google Scholar] [CrossRef]
- Kowalski, F.M.; Krausmann, F.; Giljum, S.; Mayer, L.A.; Bringezu, S.; Moriguchi, Y.; Schutz, H.; Weisz, S.H. Methodology and indicators of economy-wide material flow accounting: State of the art and reliability across sources. J. Ind. Ecol. 2011, 15, 855–876. [Google Scholar] [CrossRef]
- Wei, T. What STIRPAT tells about effects of population and affluence on the environment? Ecol. Econ. 2011, 72, 70–74. [Google Scholar] [CrossRef]
- Wang, M.; Che, Y.; Yang, K.; Wang, M.; Xiong, L.; Huang, Y. A local-scale low-carbon plan based on the STIRPAT model and the scenario method: The case of Minhang District, Shanghai, China. Energy Policy 2011, 39, 6981–6990. [Google Scholar] [CrossRef]
- Liddle, B. Urban Density and Climate Change: A STIRPAT Analysis using City-level Data. J. Transp. Geogr. 2013, 28, 22–29. [Google Scholar] [CrossRef] [Green Version]
- Lin, S.; Zhao, D.; Marinova, D. Environmental impact of China: Analysis based on the STIRPAT model. Environ. Impact Assess Rev. 2009, 29, 341–347. [Google Scholar] [CrossRef]
- Xu, B.; Lin, B. Regional differences of pollution emissions in China: Contributing factors and mitigation strategies. J. Clean. Prod. 2016, 112, 1454–1463. [Google Scholar] [CrossRef]
- Xu, R.; Xu, L.; Xu, B. Assessing CO2 emissions in China’s iron and steel industry: Evidence from quantile regression approach. J. Clean. Prod. 2017, 152, 259–270. [Google Scholar] [CrossRef]
- Ji, X.; Yao, Y.; Long, X. What causes PM2.5 pollution? Cross-economy empirical analysis from socioeconomic perspective. Energy Policy 2018, 119, 458–472. [Google Scholar] [CrossRef]
- Xu, B.; Lin, B. What cause large regional differences in PM2.5 pollutions in China? Evidence from quantile regression model. J. Clean. Prod. 2018, 174, 447–461. [Google Scholar] [CrossRef]
- Chertow, R.M. The IPAT Equation and Its Variants and Environmental Impact. J. Ind. Ecol. 2008, 4, 13–29. [Google Scholar] [CrossRef]
- Cole, M.A.; Neumayer, E. Examining the impact of demographic factors on air pollution. Popul. Environ. 2004, 26, 5–21. [Google Scholar] [CrossRef] [Green Version]
- Uddin, G.; Alam, K.; Gow, J. Estimating the major contributors to environmental impacts in Australia. Int. J. Ecol. Econ. Stat. 2016, 37, 1–14. [Google Scholar]
- Hansen, B.E. Threshold effects in non-dynamic panels: Estimation, testing, and inference. J. Econom. 1999, 93, 345–368. [Google Scholar] [CrossRef] [Green Version]
- Chang, H.T.; Huang, C.M.; Lee, M.C. Threshold effect of the economic growth rate on the renewable energy development from a change in energy price: Evidence from OECD countries. Energy Policy 2009, 37, 5796–5802. [Google Scholar] [CrossRef]
- Qi, S.; Li, Y. Threshold effects of renewable energy consumption on economic growth under energy transformation. Chin. J. Popul. Resour. Environ. 2017, 15, 312–321. [Google Scholar] [CrossRef]
- Yi, S.; Li, A.X. Application of threshold regression analysis to study the impact of regional technological innovation level on sustainable development. Renew. Sustain. Energ. Rev. 2018, 89, 27–32. [Google Scholar] [CrossRef]
- Wu, H.; Hao, Y.; Weng, J.H. How does energy consumption affect China’s urbanization? New evidence from dynamic threshold panel models. Energy Policy 2019, 127, 24–38. [Google Scholar] [CrossRef]
- Qi, J. Study on the threshold effect of China’s industrial structure on carbon emission. IOP Conf. Ser. Earth Environ. Sci. 2020, 546, 022053. [Google Scholar] [CrossRef]
- Han, D.; Li, T.; Feng, S.; Shi, Z. Application of Threshold Regression Analysis to Study the Impact of Clean Energy Development on China’s Carbon Productivity. Int. J. Environ. Res. Public Health 2020, 17, 1060. [Google Scholar] [CrossRef] [Green Version]
- Raza, S.A.; Shah, N.; Qureshi, M.A.; Qaiser, S.; Ali, R.; Ahmed, F. Non-linear threshold effect of financial development on renewable energy consumption: Evidence from panel smooth transition regression approach. Environ. Sci. Pollut. Res. 2020, 27, 32034–32047. [Google Scholar] [CrossRef] [PubMed]
- Levin, A.; Lin, C.F.; James Chu, C.S. Unit root tests in panel data: Asymptotic and finite-sample properties. J. Econom. 2002, 108, 1–24. [Google Scholar] [CrossRef]
- Phillips, P.C.B.; Perron, P. Testing for a Unit Root in Time Series Regression; Oxford University Press: New York, NY, USA, 1988. [Google Scholar]
- Chatterjee, S.; Hadi, A.S.; Price, B. Regression Analysis by Example, 3rd ed.; Wiley-Interscience Press: New York, NY, USA, 2000. [Google Scholar]
- Beck, N.; Katz, J.N. What to do (and not to do) with time-series cross-section data. Am. Polit. Sci. Rev. 1995, 89, 634–647. [Google Scholar] [CrossRef]
- He, L.; Wang, L.; Huang, B.; Wei, J.; Zhou, Z.; Zhong, Y. Anthropogenic and meteorological drivers of 1980–2016 trend in aerosol optical and radiative properties over the Yangtze River Basin. Atmos. Environ. 2020, 223, 117188. [Google Scholar] [CrossRef]
- Gao, Y.; Liu, X.; Zhao, C.; Zhang, M. Emission controls versus meteorological conditions in determining aerosol concentrations in Beijing during the 2008 Olympic Games. Atmos. Chem. Phys. 2011, 11, 12437–12451. [Google Scholar] [CrossRef] [Green Version]
- Wang, K.; Yang, L.; Kucharek, M. Investigation of the effect of thermal insulation materials on packaging performance. Packag. Technol. Sci. 2020, 33, 227–236. [Google Scholar] [CrossRef] [Green Version]
- Jing, Z.; Liu, P.; Wang, T.; Song, H.; Lee, J.; Xu, T.; Xing, Y. Effects of Meteorological Factors and Anthropogenic Precursors on PM2. 5 Concentrations in Cities in China. Sustainability 2020, 12, 3550. [Google Scholar] [CrossRef]
- Luo, X.; Bing, H.; Luo, Z.; Wang, Y.; Jin, L. Impacts of atmospheric particulate matter pollution on environmental biogeochemistry of trace metals in soil-plant system: A review. Environ. Pollut. 2019, 255, 113138. [Google Scholar] [CrossRef] [PubMed]
Publisher’s Note: MDPI stays neutral with regard to jurisdictional claims in published maps and institutional affiliations. |
© 2021 by the authors. Licensee MDPI, Basel, Switzerland. This article is an open access article distributed under the terms and conditions of the Creative Commons Attribution (CC BY) license (https://creativecommons.org/licenses/by/4.0/).