
Assessing the Risk of Respiratory-Related Healthcare Visits Associated with Wildfire Smoke Exposure in Children 0–18 Years Old: A Systematic Review


Abstract
:
1. Introduction
2. Materials and Methods
2.1. Protocol, Registration and Search Strategy
2.2. Eligibility Criteria and Study Selection
2.3. Data Collection
2.4. Risk of Bias, Evidence Synthesis and Certainty
3. Results
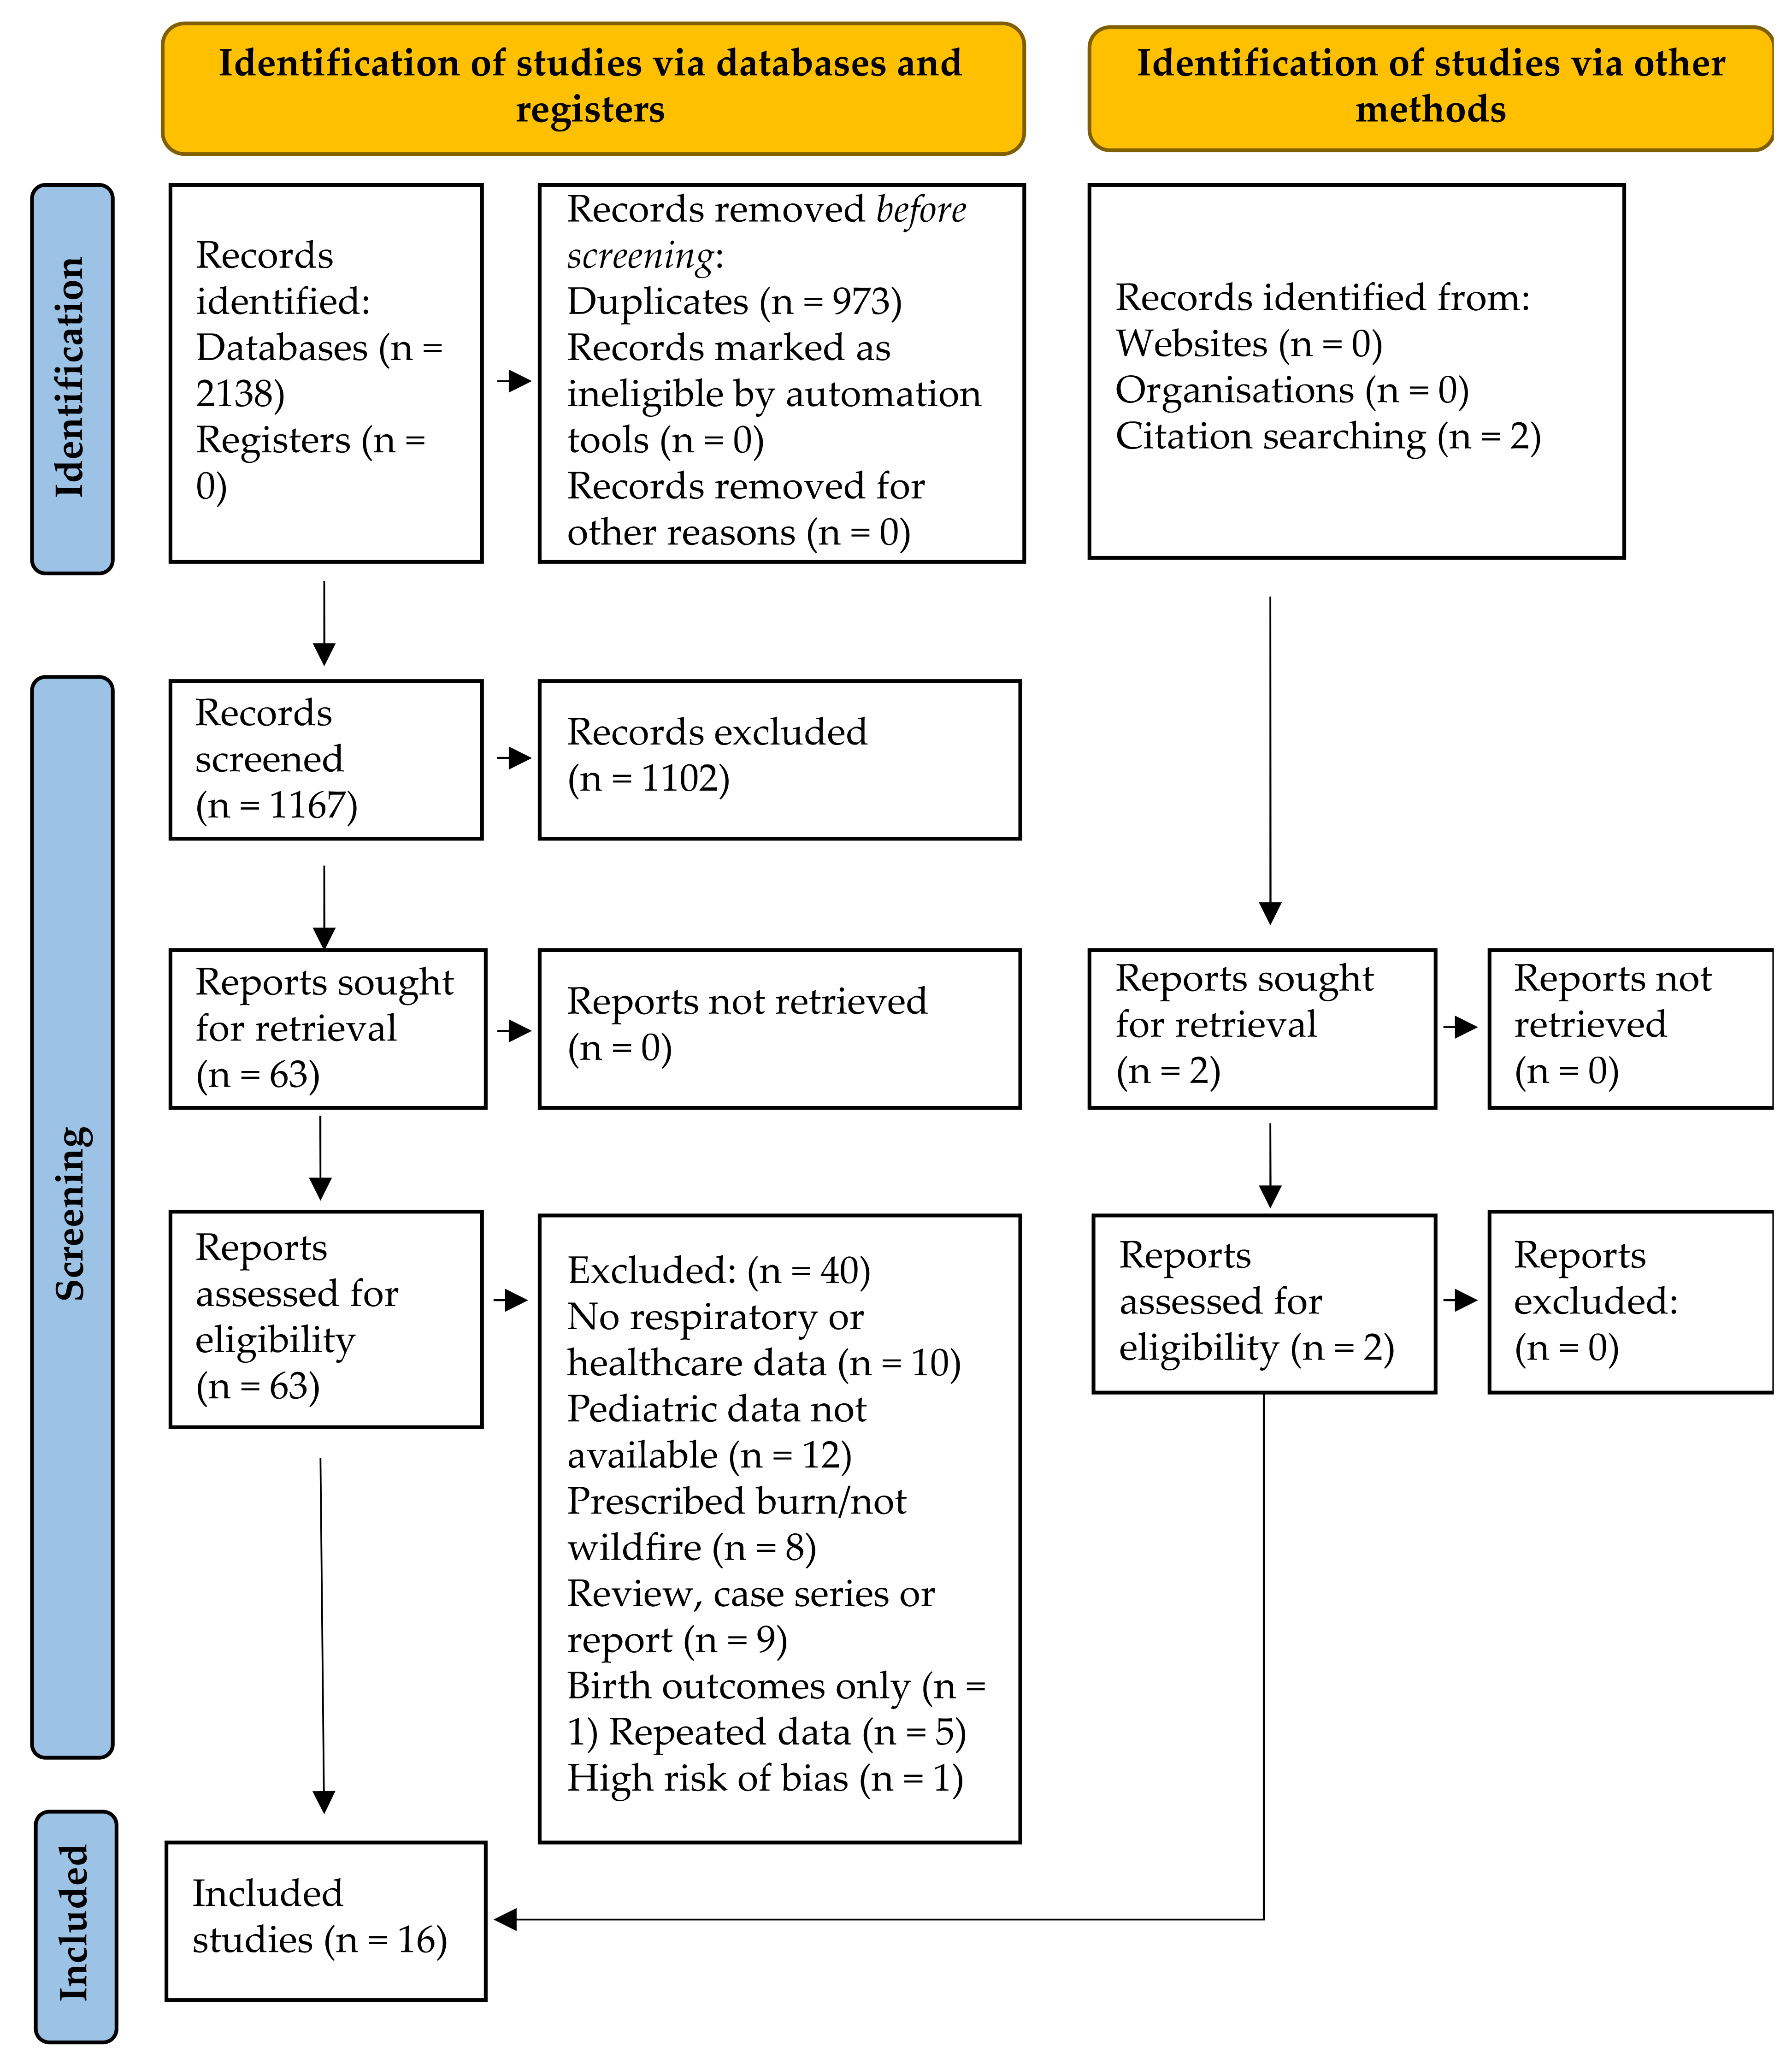
3.1. Search Results
3.2. Study and Population Characteristics
3.3. Exposure Characterization
3.4. Outcomes
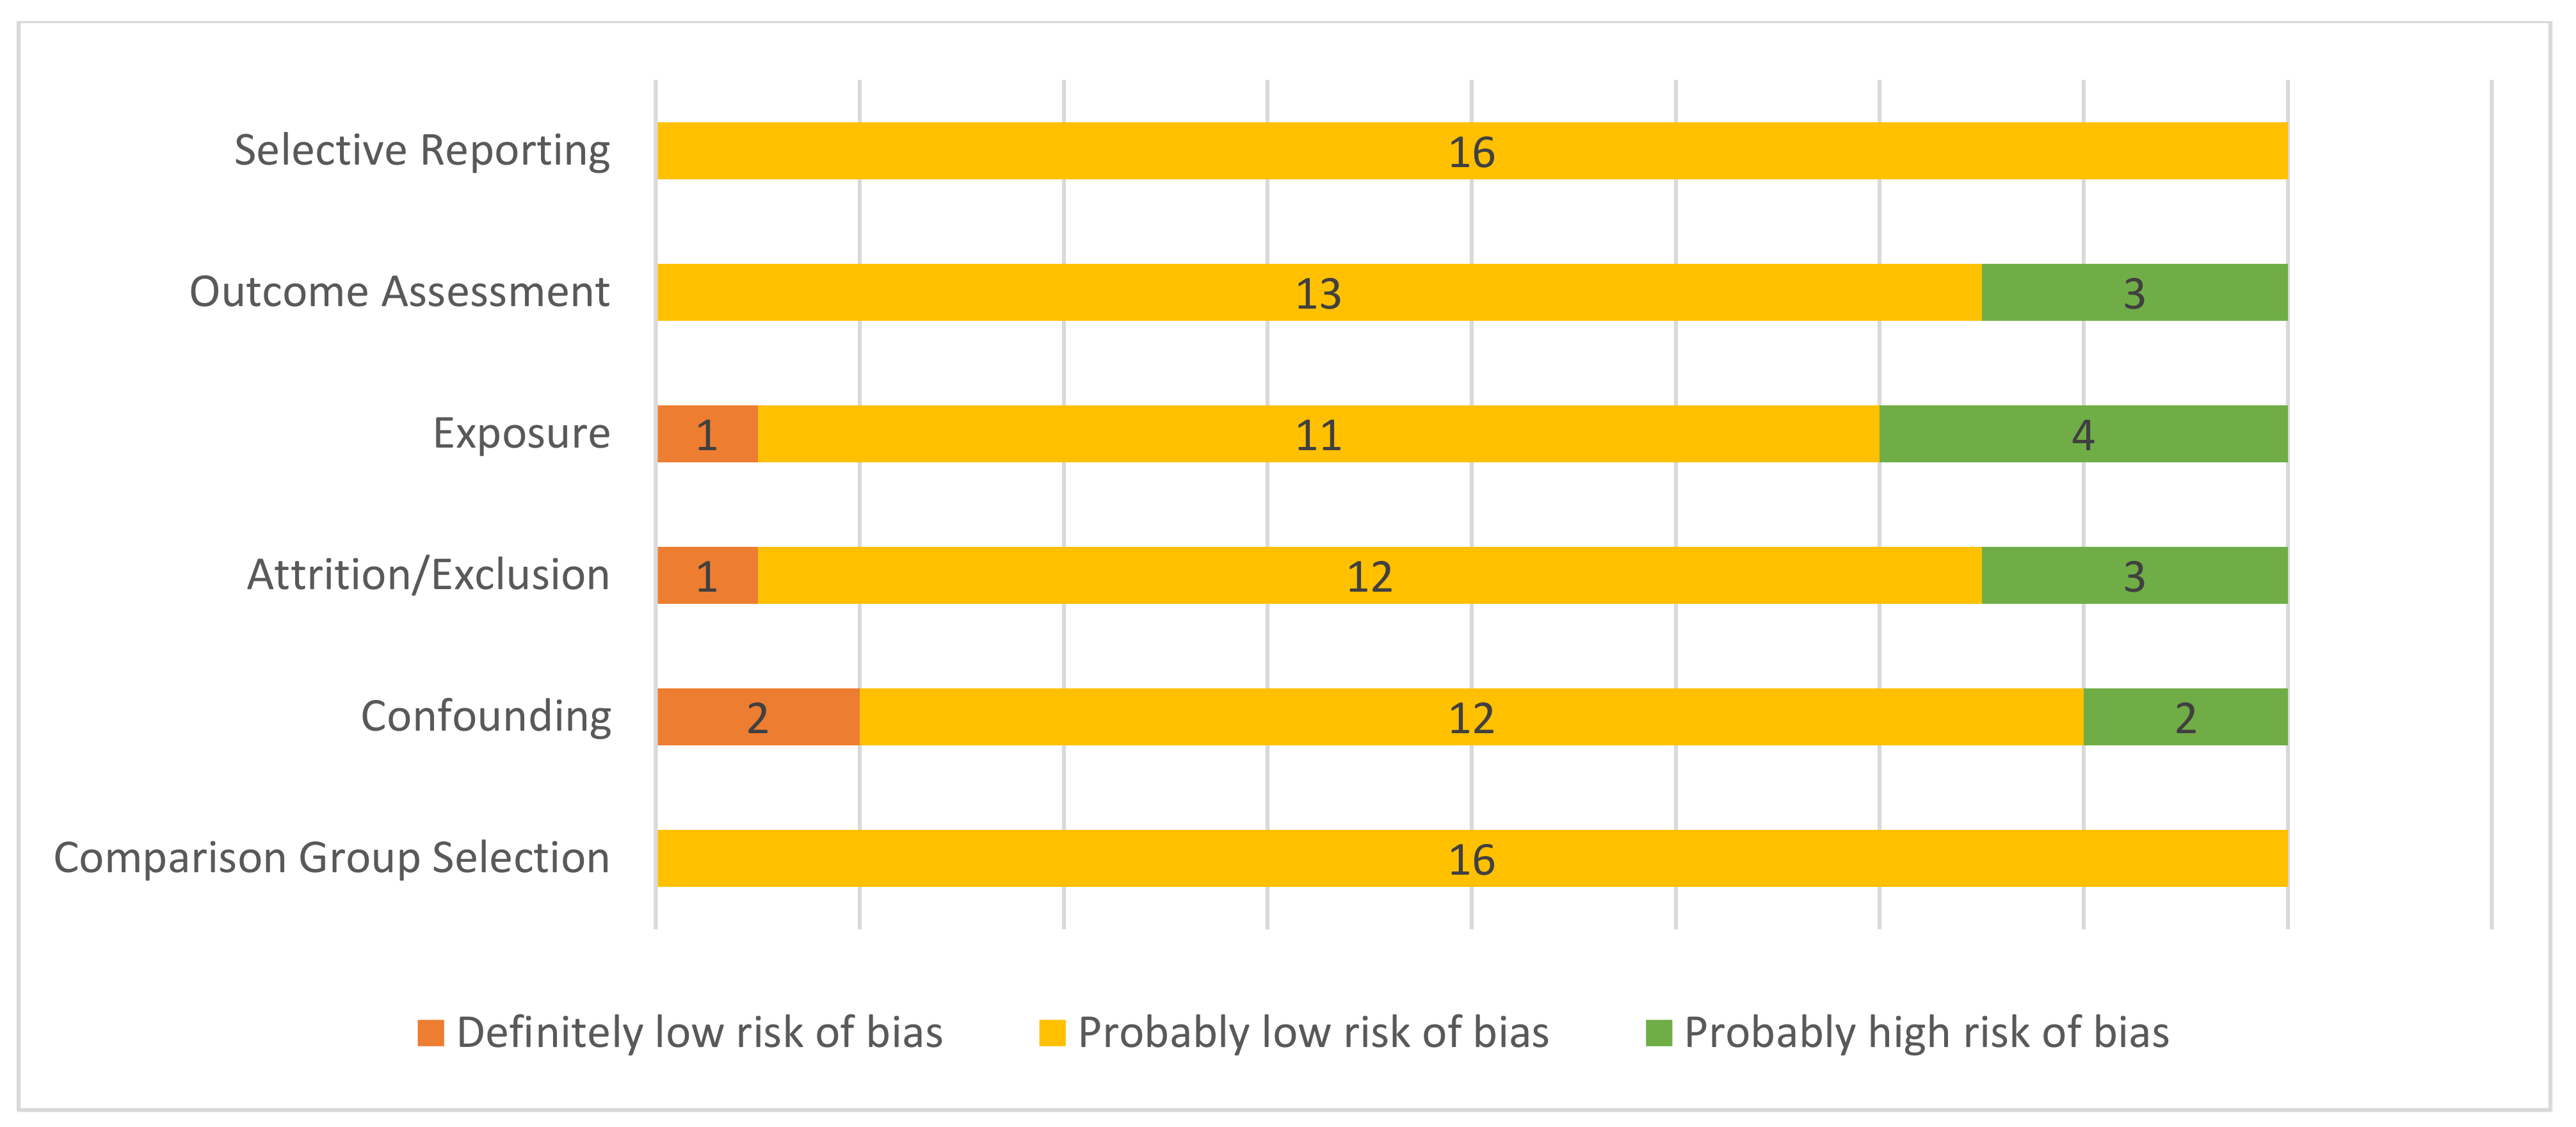
3.5. Risk of Bias Assessment
3.6. Association between Wildfire Smoke Exposure and Healthcare Visits
3.7. Association between Wildfire Smoke Exposure and Symptoms
3.8. Special Populations
4. Discussion
4.1. Summary of Evidence
4.2. Challenges Associated with Synthesis
4.3. Strengths and Limitations
5. Conclusions
Supplementary Materials
Author Contributions
Funding
Institutional Review Board Statement
Informed Consent Statement
Data Availability Statement
Acknowledgments
Conflicts of Interest
Appendix A

| Section and Topic | Item # | Checklist Item | Location Where Item is Reported |
|---|---|---|---|
| TITLE | |||
| Title | 1 | Identify the report as a systematic review. | Title Page 1 |
| ABSTRACT | |||
| Abstract | 2 | See the PRISMA 2020 for Abstracts checklist. | Abstract Page 1 |
| INTRODUCTION | |||
| Rationale | 3 | Describe the rationale for the review in the context of existing knowledge. | Section 1 Page 2, line 28 |
| Objectives | 4 | Provide an explicit statement of the objective(s) or question(s) the review addresses. | Section 1 Page 2, line 34 |
| METHODS | |||
| Eligibility criteria | 5 | Specify the inclusion and exclusion criteria for the review and how studies were grouped for the syntheses. | Eligibility: Section 2.3 Page 3 line 66 Grouping: Section 2.3 Page 3, line 84 |
| Information sources | 6 | Specify all databases, registers, websites, organisations, reference lists and other sources searched or consulted to identify studies. Specify the date when each source was last searched or consulted. | Section 2.2 Page 2, line 49 |
| Search strategy | 7 | Present the full search strategies for all databases, registers and websites, including any filters and limits used. | Section 2.2 Page 2, line 48; Supplementary Materials S1 Page 26, line 423 |
| Selection process | 8 | Specify the methods used to decide whether a study met the inclusion criteria of the review, including how many reviewers screened each record and each report retrieved, whether they worked independently, and if applicable, details of automation tools used in the process. | Section 2.4 Page 3, line 93 |
| Data collection process | 9 | Specify the methods used to collect data from reports, including how many reviewers collected data from each report, whether they worked independently, any processes for obtaining or confirming data from study investigators, and if applicable, details of automation tools used in the process. | Section 2.5 Page 3, line 100 |
| Data items | 10a | List and define all outcomes for which data were sought. Specify whether all results that were compatible with each outcome domain in each study were sought (e.g., for all measures, time points, analyses), and if not, the methods used to decide which results to collect. | Section 2.5 Page 3, line 103 |
| 10b | List and define all other variables for which data were sought (e.g., participant and intervention characteristics, funding sources). Describe any assumptions made about any missing or unclear information. | Section 2.5 Page 3, line 103 | |
| Study risk of bias assessment | 11 | Specify the methods used to assess risk of bias in the included studies, including details of the tool(s) used, how many reviewers assessed each study and whether they worked independently, and if applicable, details of automation tools used in the process. | Section 2.6 Page 4, line 121 |
| Effect measures | 12 | Specify for each outcome the effect measure(s) (e.g., risk ratio, mean difference) used in the synthesis or presentation of results. | Section 2.5 Page 3, line 110 |
| Synthesis methods | 13a | Describe the processes used to decide which studies were eligible for each synthesis (e.g., tabulating the study intervention characteristics and comparing against the planned groups for each synthesis (item #5)). | Section 2.7 Page 4, line 136 |
| 13b | Describe any methods required to prepare the data for presentation or synthesis, such as handling of missing summary statistics, or data conversions. | Section 2.7 Page 4, line 137 | |
| 13c | Describe any methods used to tabulate or visually display results of individual studies and syntheses. | Section 2.7 Page 4, lines 137 and 149 | |
| 13d | Describe any methods used to synthesize results and provide a rationale for the choice(s). If meta-analysis was performed, describe the model(s), method(s) to identify the presence and extent of statistical heterogeneity, and software package(s) used. | Section 2.7 Page 4, line 135 | |
| 13e | Describe any methods used to explore possible causes of heterogeneity among study results (e.g., subgroup analysis, meta-regression). | NA | |
| 13f | Describe any sensitivity analyses conducted to assess robustness of the synthesized results. | Section 2.7 Page 4, line 142 | |
| Reporting bias assessment | 14 | Describe any methods used to assess risk of bias due to missing results in a synthesis (arising from reporting biases). | Section 2.6 Page 4, line 123 |
| Certainty assessment | 15 | Describe any methods used to assess certainty (or confidence) in the body of evidence for an outcome. | Section 2.7 Page 4, line 142 |
| RESULTS | |||
| Study selection | 16a | Describe the results of the search and selection process, from the number of records identified in the search to the number of studies included in the review, ideally using a flow diagram. | Section 3.1 Page 4, line 154 and Figure 1 |
| 16b | Cite studies that might appear to meet the inclusion criteria, but which were excluded, and explain why they were excluded. | Section 3.1 Page 4, line 163 | |
| Study characteristics | 17 | Cite each included study and present its characteristics. | Section 3.2 Page 19, line 176 and Table 1 |
| Risk of bias in studies | 18 | Present assessments of risk of bias for each included study. | Section 3.7 Page 22, line 252 |
| Results of individual studies | 19 | For all outcomes, present, for each study: (a) summary statistics for each group (where appropriate) and (b) an effect estimate and its precision (e.g., confidence/credible interval), ideally using structured tables or plots. | Section 3.2 Page 19, line 176 and Table 1 |
| Results of syntheses | 20a | For each synthesis, briefly summarise the characteristics and risk of bias among contributing studies. | Section 3.6–3.10 Page 21, line 241 and Table 2 |
| 20b | Present results of all statistical syntheses conducted. If meta-analysis was done, present for each the summary estimate and its precision (e.g., confidence/credible interval) and measures of statistical heterogeneity. If comparing groups, describe the direction of the effect. | NA | |
| 20c | Present results of all investigations of possible causes of heterogeneity among study results. | NA | |
| 20d | Present results of all sensitivity analyses conducted to assess the robustness of the synthesized results. | NA | |
| Reporting biases | 21 | Present assessments of risk of bias due to missing results (arising from reporting biases) for each synthesis assessed. | Section 3.7 Page 22, line 251 and Figure 2 |
| Certainty of evidence | 22 | Present assessments of certainty (or confidence) in the body of evidence for each outcome assessed. | Section 3.8 Page 22, line 268 and Table 3 |
| DISCUSSION | |||
| Discussion | 23a | Provide a general interpretation of the results in the context of other evidence. | Section 4.1 Page 24, line 309 |
| 23b | Discuss any limitations of the evidence included in the review. | Section 4.2 Page 25, line 379 | |
| 23c | Discuss any limitations of the review processes used. | Section 4.3 Page 25, line 390 | |
| 23d | Discuss implications of the results for practice, policy, and future research. | Section 5 line 416 | |
| OTHER INFORMATION | |||
| Registration and protocol | 24a | Provide registration information for the review, including register name and registration number, or state that the review was not registered. | Section 2.1 Page 2, line 46 |
| 24b | Indicate where the review protocol can be accessed, or state that a protocol was not prepared. | Section 2.1 Page 2, line 46 | |
| 24c | Describe and explain any amendments to information provided at registration or in the protocol. | Section 2.3 Page 3, lines 64 and 67 | |
| Support | 25 | Describe sources of financial or non-financial support for the review, and the role of the funders or sponsors in the review. | Funding: Page 26, line 431 |
| Competing interests | 26 | Declare any competing interests of review authors. | Conflicts of Interest: Page 26, line 436 |
| Availability of data, code and other materials | 27 | Report which of the following are publicly available and where they can be found: template data collection forms; data extracted from included studies; data used for all analyses; analytic code; any other materials used in the review. | Supplemental Materials |
Appendix B
| SWiM Reporting Item | Item Description | Page in Manuscript Where Item Is Reported |
|---|---|---|
| (1a) Provide a description of, and rationale for, the groups used in the synthesis (e.g., groupings of populations, interventions, outcomes, study design) | Section 2.7 Page 4, line 134 |
| (1b) Detail and provide rationale for any changes made subsequent to the protocol in the groups used in the synthesis | Section 2.3 Page 3, lines 64 and 67 | |
| Describe the standardised metric for each outcome. Explain why the metric(s) was chosen, and describe any methods used to transform the intervention effects, as reported in the study, to the standardised metric, citing any methodological guidance consulted | Section 2.3 Page 3, line 68 |
| Describe and justify the methods used to synthesise the effects for each outcome when it was not possible to undertake a meta-analysis of effect estimates | Section 2.7 Page 3, line 134 |
| Where applicable, provide the criteria used, with supporting justification, to select the particular studies, or a particular study, for the main synthesis or to draw conclusions from the synthesis (e.g., based on study design, risk of bias assessments, directness in relation to the review question) | Section 2.7 Page 3, line 142 |
| State the method(s) used to examine heterogeneity in reported effects when it was not possible to undertake a meta-analysis of effect estimates and its extensions to investigate heterogeneity | Section 2.7 Page 3, line 137 |
| Describe the methods used to assess certainty of the synthesis findings | Section 2.7 Page 3, line 142 |
| Describe the graphical and tabular methods used to present the effects (e.g., tables, forest plots, harvest plots). Specify key study characteristics (e.g., study design, risk of bias) used to order the studies, in the text and any tables or graphs, clearly referencing the studies included | Section 2.6, Section 2.7 Page 3; Section 2.3 Page 2, Table 2 Page 21, Figure 2 Page 22 |
| For each comparison and outcome, provide a description of the synthesised findings, and the certainty of the findings. Describe the result in language that is consistent with the question the synthesis addresses, and indicate which studies contribute to the synthesis | Table 3 Page 23, Sections 3.8–3.10 Page 22 |
| Discussion | ||
| Report the limitations of the synthesis methods used and/or the groupings used in the synthesis, and how these affect the conclusions that can be drawn in relation to the original review question | Section 4.2 and Section 4.3 Page 25 |
References
- Anderson, J.; Bausch, C. Climate Change and Natural Disasters: Scientific Evidence of a Possible Relation between Recent Natural Disasters and Climate Change (IP/A/ENVI/FWC/2005-35); Institute for European Environmental Policy: Brussels, Belgium, 2005; Volume 35. [Google Scholar]
- Pechony, O.; Shindell, D.T. Driving forces of global wildfires over the past millennium and the forthcoming century. Proc. Natl. Acad. Sci. USA 2010, 107, 19167–19170. [Google Scholar] [CrossRef] [PubMed] [Green Version]
- Westerling, A.L.; Hidalgo, H.G.; Cayan, D.R.; Swetnam, T.W. Warming and earlier spring increase Western U.S. forest wildfire activity. Science 2006, 313, 940–943. [Google Scholar] [CrossRef] [PubMed] [Green Version]
- Wang, X.; Parisien, M.A.; Taylor, S.W.; Candau, J.N.; Stralberg, D.; Marshall, G.A.; Little, J.M.; Flannigan, M.D. Projected changes in daily fire spread across Canada over the next century. Environ. Res. Lett. 2017, 12, 025005. [Google Scholar] [CrossRef]
- Dupuy, J.-L.; Fargeon, H.; Martin-StPaul, N.; Pimont, F.; Ruffault, J.; Guijarro, M.; Hernando, C.; Madrigal, J.; Fernandes, P. Climate change impact on future wildfire danger and activity in southern Europe: A review. Ann. For. Sci. 2020, 77, 1–24. [Google Scholar] [CrossRef]
- Abatzoglou, J.T.; Kolden, C.A. Climate change in Western US deserts: Potential for increased wildfire and invasive annual grasses. Rangel. Ecol. Manag. 2011, 64, 471–478. [Google Scholar] [CrossRef]
- Liu, J.C.; Peng, R.D. The impact of wildfire smoke on compositions of fine particulate matter by ecoregion in the Western US. J. Expo. Sci. Environ. Epidemiol. 2019, 29, 765–776. [Google Scholar] [CrossRef]
- Xing, Y.F.; Xu, Y.H.; Shi, M.H.; Lian, Y.X. The impact of PM2.5 on the human respiratory system. J. Thorac. Dis. 2016, 8, E69–E74. [Google Scholar] [CrossRef]
- Matz, C.J.; Egyed, M.; Xi, G.; Racine, J.; Pavlovic, R.; Rittmaster, R.; Henderson, S.B.; Stieb, D.M. Health impact analysis of PM2.5 from wildfire smoke in Canada (2013–2015, 2017–2018). Sci. Total Environ. 2020, 725, 138506. [Google Scholar] [CrossRef] [PubMed]
- Amjad, S.; Chojecki, D.; Osornio-vargas, A.; Ospina, M.B. Wildfire exposure during pregnancy and the risk of adverse birth outcomes: A systematic review. Environ. Int. 2021, 156, 106644. [Google Scholar] [CrossRef] [PubMed]
- Xie, Y.; Lin, M.; Horowitz, L.W. Summer PM2.5 Pollution Extremes Caused by Wildfires Over the Western United States During 2017–2018. Geophys. Res. Lett. 2020, 47, 1–11. [Google Scholar] [CrossRef]
- Shi, H.; Jiang, Z.; Zhao, B.; Li, Z.; Chen, Y.; Gu, Y.; Jiang, J.H.; Lee, M.; Liou, K.N.; Neu, J.L.; et al. Modeling Study of the Air Quality Impact of Record-Breaking Southern California Wildfires in December 2017. J. Geophys. Res. Atmos. 2019, 124, 6554–6570. [Google Scholar] [CrossRef] [PubMed]
- Nolte, C.G.; Dolwick, P.D.; Fann, N.; Horowitz, L.W.; Naik, V.; Pinder, R.W.; Spero, T.L.; Winner, D.A.; Ziska, L.H. Air Qulality. In Impacts, Risks and Adaptation in the United States: Fourth National Climate Assessment; United States Global Change Research Program: Washington, DC, USA, 2018; Volume 2, pp. 1–24. ISBN 978-1-46658-445-7. [Google Scholar]
- Lu, F.; Xu, D.; Cheng, Y.; Dong, S.; Guo, C.; Jiang, X.; Zheng, X. Systematic review and meta-analysis of the adverse health effects of ambient PM2.5 and PM10 pollution in the Chinese population. Environ. Res. 2015, 136, 196–204. [Google Scholar] [CrossRef] [PubMed]
- Künzli, N.; Avol, E.; Wu, J.; Gauderman, W.J.; Rappaport, E.; Millstein, J.; Bennion, J.; McConnell, R.; Gilliland, F.D.; Berhane, K.; et al. Health effects of the 2003 Southern California wildfires on children. Am. J. Respir. Crit. Care Med. 2006, 174, 1221–1228. [Google Scholar] [CrossRef] [PubMed] [Green Version]
- Vicedo-Cabrera, A.M.; Esplugues, A.; Iñíguez, C.; Estarlich, M.; Ballester, F. Health effects of the 2012 Valencia (Spain) wildfires on children in a cohort study. Environ. Geochem. Health 2016, 38, 703–712. [Google Scholar] [CrossRef]
- Black, C.; Tesfaigzi, Y.; Bassein, J.A.; Miller, L.A. Wildfire smoke exposure and human health: Significant gaps in research for a growing public health issue. Environ. Toxicol. Pharmacol. 2017, 55, 186–195. [Google Scholar] [CrossRef]
- Dietert, R.R.; Etzel, R.A.; Chen, D.; Halonen, M.; Holladay, S.; Jarabek, A.M.; Landreth, K.; Peden, E.B.; Pinkerton, K.; Smialowicz, R.J.; et al. Workshop to identify critical windows of exposure for children’s health: Reproductive health in children and adolescents work group summary. Environ. Health Perspect. 2000, 108, 483–490. [Google Scholar] [CrossRef] [Green Version]
- Mirabelli, M.C.; Künzli, N.; Avol, E.; Gilliland, F.D.; Gauderman, W.J.; McConnell, R.; Peters, J.M. Respiratory symptoms following wildfire smoke exposure: Airway size as a susceptibility factor. Epidemiology 2009, 20, 451–459. [Google Scholar] [CrossRef] [Green Version]
- Page, M.J.; McKenzie, J.E.; Bossuyt, P.M.; Boutron, I.; Hoffmann, T.C.; Mulrow, C.D.; Shamseer, L.; Tetzlaff, J.M.; Akl, E.A.; Brennan, S.E.; et al. The PRISMA 2020 statement: An updated guideline for reporting systematic reviews. BMJ 2021, 372, n71. [Google Scholar] [CrossRef]
- Tjosvold, L.; Campbell, S.; Dorgan, M. Filter to Retrieve Pediatrics Articles in OVID Medline; John W. Scott Health Sciences Library, University of Alberta: Edmonton, AB, Canada, 2015; p. 14026652. [Google Scholar] [CrossRef]
- Morgan, R.L.; Whaley, P.; Thayer, K.A.; Shunemann, H.J. Identifying the PECO: A framework for formulating good questions to explore the association of environmental and other exposures with health outcomes. Environ. Int. 2018, 121, 1027–1031. [Google Scholar] [CrossRef]
- Henderson, S.B.; Johnston, F.H. Measures of forest fire smoke exposure and their associations with respiratory health outcomes. Curr. Opin. Allergy Clin. Immunol. 2012, 12, 221–227. [Google Scholar] [CrossRef] [PubMed]
- Campbell, M.; McKenzie, J.E.; Sowden, A.; Katikireddi, S.V.; Brennan, S.E.; Ellis, S.; Hartmann-Boyce, J.; Ryan, R.; Shepperd, S.; Thomas, J.; et al. Synthesis without meta-analysis (SWiM) in systematic reviews: Reporting guideline. BMJ 2020, 368, 1–6. [Google Scholar] [CrossRef] [Green Version]
- NTP (National Toxicology Program). Handbook for Conducting a Literature-Based Health Assessment Using OHAT Approach for Systemic Review and Evidence Integration; NTP: Research Triangle Park, NC, USA, 2015; pp. 1–98. [Google Scholar]
- National Toxicology Program. OHAT Risk of Bias Rating Tool for Human and Animal Studies Organization of This Document Indirectness, Timing, and Other Factors Related to Risk of Bias. Available online: https://ntp.niehs.nih.gov/ntp/ohat/pubs/riskofbiastool_508.pdf (accessed on 14 August 2020).
- Eick, S.M.; Goin, D.E.; Chartres, N.; Lam, J.; Woodruff, T.J. Assessing risk of bias in human environmental epidemiology studies using three tools: Different conclusions from different tools. Syst. Rev. 2020, 9, 1–13. [Google Scholar] [CrossRef] [PubMed]
- Morgan, R.L.; Beverly, B.; Ghersi, D.; Schunemann, H.J.; Rooney, A.A.; Whaley, P.; Zhu, Y.-G.; Thayer, K.A. GRADE guidelines for environmental and occupational health: A new series of articles in Environment International. Environ. Int. 2019, 128, 11–12. [Google Scholar] [CrossRef] [PubMed]
- Mott, J.A.; Mannino, D.M.; Alverson, C.J.; Kiyu, A.; Hashim, J.; Lee, T.; Falter, K. Cardiorespiratory hospitalizations associated with smoke exposure during the 1997 Southeast Asian forest fires. Int. J. Hyg. Environ. Health 2005, 208, 75–85. [Google Scholar] [CrossRef] [PubMed] [Green Version]
- Delfino, R.J.; Brummel, S.; Wu, J.; Stern, H.; Ostro, B.; Lipsettt, M.; Winer, A.; Street, D.H.; Zhang, L.; Tjoa, T.; et al. The relationship of respiratory and cardiovascular hospital admissions ot the southern California wildfires of 2003. Occup. Environ. Med. 2009, 66, 189–197. [Google Scholar] [CrossRef] [Green Version]
- Gan, R.W.; Ford, B.; Lassman, W.; Gabriele, P.; Vaidyanathan, A.; Fischer, E.; Volckens, J.; Pierce, J.R.; Magzamen, S. Comparison of wildfire smoke estimation methods and associations with cardiopulmonary-related hospital admissions. GeoHealth 2017, 1, 122–136. [Google Scholar] [CrossRef]
- Hanigan, I.C.; Johnston, F.H.; Morgan, G.G. Vegetation fire smoke, indigenous status and cardio-respiratory hospital admissions in Darwin, Australia, 1996–2005: A time-series study. Environ. Health Glob. Access Sci. Source 2008, 7, 1–12. [Google Scholar] [CrossRef] [Green Version]
- Hutchinson, J.A.; Vargo, J.; Milet, M.; French, N.H.F.; Billmire, M.; Johnson, J.; Hoshiko, S. The San Diego 2007 wildfires and Medi-Cal emergency department presentations, inpatient hospitalizations, and outpatient visits: An observational study of smoke exposure periods and a bidirectional case-crossover analysis. PLoS Med. 2018, 15, 1–21. [Google Scholar] [CrossRef] [Green Version]
- Johnston, F.H.; Purdie, S.; Jalaludin, B.; Martin, K.L.; Henderson, S.B.; Morgan, G.G. Air pollution events from forest fires and emergency department attendances in Sydney, Australia 1996–2007: A case-crossover analysis. Environ. Health Glob. Access Sci. Source 2014, 13, 1–9. [Google Scholar] [CrossRef] [Green Version]
- Lee, T.S.; Falter, K.; Meyer, P.; Mott, J.; Gwynn, C. Risk factors associated with clinic visits during the 1999 forest fires near the Hoopa Valley Indian Reservation, California, USA. Int. J. Environ. Health Res. 2009, 19, 315–327. [Google Scholar] [CrossRef]
- Leibel, S.; Nguyen, M.; Brick, W.; Parker, J.; Ilango, S.; Aguilera, R.; Gershunov, A.; Benmarhnia, T. Increase in pediatric respiratory visits associated with Santa ana wind–driven wildfire smoke and PM2.5 levels in San Diego County. Ann. Am. Thorac. Soc. 2020, 17, 313–320. [Google Scholar] [CrossRef]
- Pratt, J.R.; Gan, R.W.; Ford, B.; Brey, S.; Pierce, J.R.; Fischer, E.V.; Magzamen, S. A national burden assessment of estimated pediatric asthma emergency department visits that may be attributed to elevated ozone levels associated with the presence of smoke. Environ. Monit. Assess. 2019, 191, 269. [Google Scholar] [CrossRef]
- Reid, C.E.; Jerrett, M.; Tager, I.B.; Petersen, M.L.; Mann, J.K.; Balmes, J.R. Differential respiratory health effects from the 2008 northern California wildfires: A spatiotemporal approach. Environ. Res. 2016, 150, 227–235. [Google Scholar] [CrossRef] [PubMed] [Green Version]
- Resnick, A.; Woods, B.; Krapfl, H.; Toth, B. Health outcomes associated with smoke exposure in Albuquerque, New Mexico, during the 2011 Wallow fire. J. Public Health Manag. Pract. 2015, 21, S55–S61. [Google Scholar] [CrossRef] [PubMed]
- Stowell, J.D.; Geng, G.; Saikawa, E.; Chang, H.H.; Fu, J.; Yang, C.E.; Zhu, Q.; Liu, Y.; Strickland, M.J. Associations of wildfire smoke PM2.5 exposure with cardiorespiratory events in Colorado 2011–2014. Environ. Int. 2019, 133, 105151. [Google Scholar] [CrossRef] [PubMed]
- Tham, R.; Erbas, B.; Akram, M.; Dennekamp, M.; Abramson, M.J. The impact of smoke on respiratory hospital outcomes during the 2002-2003 bushfire season, Victoria, Australia. Respirology 2009, 14, 69–75. [Google Scholar] [CrossRef] [PubMed]
- Tinling, M.A.; West, J.J.; Cascio, W.E.; Kilaru, V.; Rappold, A.G. Repeating cardiopulmonary health effects in rural North Carolina population during a second large peat wildfire. Environ. Health Glob. Access Sci. Source 2016, 15, 1–12. [Google Scholar] [CrossRef] [Green Version]
- Johnston, F.H.; Webby, R.J.; Pilotto, L.S.; Bailie, R.S.; Parry, D.L.; Halpin, S.J. Vegetation fires, particulate air pollution and asthma: A panel study in the Australian monsoon tropics. Int. J. Environ. Health Res. 2006, 16, 391–404. [Google Scholar] [CrossRef] [PubMed]
- Bowman, D.M.J.S.; Johnston, F.H. Wildfire smoke, fire management, and human health. Ecohealth 2005, 2, 76–80. [Google Scholar] [CrossRef]
- Higgins, J.P.; Thomas, J.; Chandler, J.; Cumpston, M.; Li, T.; Page, M.J.; Welch, V.A. (Eds.) Cochrane Handbook for Systematic Reviews of Interventions; Version 6; John Wiley & Sons: Hoboken, NJ, USA, 2021. [Google Scholar]
| Study | Trial Characteristics | Population Characteristics | “Smoke Event” Days | Comparison Group | Measurement Characteristics | Outcomes ED Visits | Outcomes: Hospitalizations | Outcomes: Symptoms | Outcomes: Outpatient Visits |
|---|---|---|---|---|---|---|---|---|---|
| Delfino et al., 2009 [30] Site: Southern California, USA Funding: South Coast Air Quality Management District and NIH research grant | Design: Pre/post Enrollment: October 1–20 (pre-fire), 21–30 October (during the fire), 31 October–15 November (post-fire) 2003 Setting: | N: 3374 Age: <19 years Data source: Office of Statewide Health Planning and Development (OSHPD) Other: None | Definition: All cardiorespiratory hospital admissions Number of days: 10 Exposed population: Zip code during the exposure period | Population: All patients admitted to hospital in California state Comparator: Periods directly before and after wildfire smoke peak in 2003 | PM2.5: per 10 mg/m3 increase in PM2.5 PM10: Not reported Other measure: Temperature, humidity, surface pressure gradient Monitoring: governmental network site data Time between exposure and outcome: no lag time | Not reported | Age 0–4 wildfire period All resp RR 1.05 (1.01–1.08) Asthma RR 1.08 (1.02–1.15) Acute bronchitis/bronchiolitis RR 1.09 (1.00–1.20) Acute Pneumonia RR 1.02 (0.95–1.09) post-wildfire period All resp RR 0.89 (0.81–0.99) Asthma RR 0.92 (0.77–1.11) bronchitis/bronchiolitis RR 1.03 (0.87–1.22) Pneumonia RR 0.82 (0.65–1.04) Age 5–19 wildfire period All resp RR 1.03 (0.98–1.08) Asthma RR 1.00 (0.94–1.07) Pneumonia RR 1.06 (0.99–1.14) post-wildfire period All resp RR 0.96 (0.85–1.08) Asthma RR 0.92 (0.79–1.07) Pneumonia RR 1.02 (0.77–1.35) | Not reported | Not reported |
| Gan et al., 2017 [31] Site: Washington State, USA Funding: Research grant | Design: Cross-sectional Enrollment: 1 July–31 October 2012 Setting: Urban and rural | N: 1304 Age: <15 years Data source: Washington State department of Health Comprehensive Hospital Abstract Reporting System (CHARS) Other: limited to emergency or urgent care | Definition: respiratory ED and urgent care visits Number of days: 123 Exposed population: wildfire smoke exposure by zip code | Population: respiratory ED and urgent care visits associated with air pollution attributed to wildfire smoke Comparator: Fracture of radius and ulna in the same population during the same time period | PM2.5: >10 mg/m3 = smoke day PM10: not reported Other measure: not reported Monitoring: Weather Research and Forecasting with Chemistry (WRF-Chem) and Geographically Weighted Regression (GRF) (aerosol optical depth modelling) Time between exposure and outcome: 0 to 5 days prior to admission | Not reported | GWR Smoke All resp OR 1.07 (1.00–1.14) WRF-Chem Smoke All resp OR 1.06 (1.01–1.11) Asthma OR 1.11 (1.05–1.18) | Not reported | Not reported |
| Hanigan et al., 2008 [32] Site: Darwin, Australia Funding: Research grant and Norther Territory Government and Bureau of Meteorology | Design: Cross-sectional Enrollment: 1 April to 30 November 1996–2005 Setting: Urban | N: not reported Age: <15 years Data source: Northern Territory Department of Health and Community Services Other: Indigenous status for subgroup analysis | Definition: respiratory ED visits and hospital admissions for children on wildfire smoke impacted days Number of days: 2410 dry season days over 10 years; not all smoke days Exposed population: children in Darwin on smoke days | Population: children living in Darwin on smoke days Comparator: the same population on non-smoke days | PM2.5: not reported PM10: estimates based on visibility measures Other measure: none reported Monitoring: in 2000, PM10 was measured using a Tapered Element Oscillating Microbalance; in 1995 a gravimetric stacked filter unit was used Time between exposure and outcome: No lag and 1–3 day lags | Data not expressed as OR, RR, or excess visit “% < 15 years for each category (proportional)” Positive trend in respiratory admissions with same-day increased PM10 for respiratory infections and asthma with no breakdown for <15 years | |||
| Henderson et al., 2011 [23] Site: British Columbia, Canada Funding: Research grants | Design: Cross-sectional Enrollment: 1 July to 30 September 2003 Setting: Mixed rural and urban | N: 60,848 Age: <20 years Data source: British Columbia Medical Services Plan Other: none | Definition: All respiratory claims by date Number of days: 92 Exposed population: By physical address, corroborated by postal code in medical file | Population: all British Columbia Medical Services Plan users in the study period, based on the postal code data being up to date within a year before or after the study period Comparator: year before and year after; three different categories of smoke exposure | PM2.5: not measured PM10: mean exposure 29 Other measure: satellite estimates of exposure and PM10 Monitoring: Tapered element oscillating microbalance and satellite images Time between exposure and outcome: no lag | All outcomes day of peak exposure: Age 0–4 All respiratory outcomes OR 1.02 (0.97–1.07) Age 5–9 All respiratory outcomes OR 0.95 (0.89–1.01) Age 10–19 All respiratory outcomes OR 1.03 (0.99–1.07) * OR estimated by manually measuring graphically reported results in the manuscript; the authors no longer retained original data ** All health care visit types combined | |||
| Hutchinson et al., 2018 [33] Site: California, USA Funding: Research grants | Design: Cross-sectional Enrollment: 16 August to 15 December 2007; three fire periods P1: 22–26 October, P2: 27–31 October and P3: 1–3 November 2007 Setting: Mixed rural and urban | N: 7932 Age: 0–17 Data source: Medi-Cal administrative claims data form the California Department of Health Care Services (DHCS) Management Information System/Decision Support System (MIS/DSS), San Diego County Other: | Definition: All cardiorespiratory Medi-Cal claims for outpatient and ED visits and hospitalizations (first day within 14 days of fire period) Number of days: 15 Exposed population: zip code during the exposure period | Population: all patients with Medi-Cal claims during the enrollment period Comparator: Periods starting 3, 4, 5, 6, 8 and 9 weeks before each exposure period and all-cause (total) visits for each healthcare setting to provide context for outcomes of interest | PM2.5: 24 h mean P1 89.1 mg/m3, P2 9.33 mg/m3, P3 0.26 mg/m3 PM10: not reported Other measure: Air Quality Index (AQI) Monitoring: Geospatial tool Wildland Fire Emissions Information System (WFEIS) Time between exposure and outcome: no lag time (P1 no lag, P2 low exposure and lag, P3 lag and cumulative effects) | All outcomes 5 days peak exposure Age 0–1 All resp index RR 1.77 (1.15–1.66) Asthma RR 3.43 (1.49–7.38) Acute Bronchitis RR 2.95 (1.15–6.85) Bronchitis RR 0.00 (0.00–6.57) Pneumonia RR 0.84 (0.13–3.12) URI RR 1.82 (1.25–2.66) Respiratory Symptoms RR 2.06 (1.33–3.22) Age 2–4 All resp index RR 1.50 (0.91–2.48) Asthma RR 1.39 (0.41–3.76) Acute Bronchitis RR 1.33 (0.06–9.03) Bronchitis RR 2.00 (0.08–15.92) Pneumonia RR 1.14 (0.05–7.39) URI RR 1.63 (0.85–3.12) Respiratory Symptoms RR 1.45 (0.55–3.31) Age 0–4 All resp index RR 1.70 (1.32–2.19) Asthma RR 2.36 (1.27–4.39) Acute Bronchitis RR 2.56 (1.09–5.54) Bronchitis RR 0.89 (0.04–5.41) Pneumonia RR 0.92 (0.22–2.76) URI RR 1.77 (1.28–2.45) Respiratory Symptoms RR 1.91 (1.29–2.82) Age 5–17 All resp index RR 1.19 (0.80–1.79) Asthma RR 2.00 (1.09–3.67) Acute Bronchitis RR 1.78 (0.26–7.46) Bronchitis RR 0.00 (0.00–8.92) Pneumonia RR 1.45 (0.22–5.85) URI RR 1.03 (0.46–2.07) Respiratory Symptoms RR 1.14 (0.62–2.09) | All outcomes 5 days peak exposure Age 0–1 All resp index RR 0.99 (0.46–1.90) Asthma RR 2.18 (0.49–7.27) Acute Bronchitis RR 1.78 (0.26–7.46) Pneumonia RR 1.26 (0.30–3.90) URI RR 1.50 (0.35–4.74) Respiratory Symptoms RR 0.86 (0.26–2.24) Age 2–4 All resp index RR 2.13 (0.61–6.11) Asthma RR 3.43 (0.72–13.05) Acute Bronchitis RR 0.00 (0.00–13.72) Pneumonia RR 2.67 (0.10–25.02) URI RR 0.00 (0.00–6.57) Respiratory Symptoms RR 1.33 (0.06–9.03) Age 0–4 All resp index RR 1.18 (0.66–2.12) Asthma RR 2.67 (0.97–6.53) Acute Bronchitis RR 1.33 (0.20–5.28) Pneumonia RR 1.45 (0.43–3.95) URI RR 1.14 (0.27–3.49) Respiratory Symptoms RR 0.93 (0.33–2.20) Age 5–17 All resp index RR 1.13 (0.53–2.18) Asthma RR 0.76 (0.12–1.18) Acute Bronchitis RR 0.00 (0.00–13.72) Pneumonia RR 0.64 (0.10–2.31) URI RR 0.00 (0.00–5.18) Respiratory Symptoms RR 1.74 (0.59–4.35) | Not reported | All outcomes 5 days peak exposure Age 0–1 All resp index RR 1.09 (0.99–1.2) Asthma RR 1.54 (1.11–2.12) Acute Bronchitis RR 1.63 (1.21–2.19) Bronchitis RR 1.17 (0.45–2.62) Pneumonia RR 1.55 (0.95–2.54) URI RR 1.00 (0.89–1.12) Respiratory Symptoms RR 1.34 (1.02–1.76) Age 2–4 All resp index RR 1.13 (1.00–1.28) Asthma RR 1.18 (0.91–1.55) Acute Bronchitis RR 0.94 (0.37–2.08) Bronchitis RR 0.57 (0.09–2.04) Pneumonia RR 1.55 (0.93–2.56) URI RR 1.04 (0.88–1.21) Respiratory Symptoms RR 1.75 (1.28–2.39) Age 0–4 All resp index RR 1.11 (1.03–1.19) Asthma RR 1.31 (1.07–1.61) Acute Bronchitis RR 1.52 (1.15–2.00) Bronchitis RR 0.93 (0.42–1.85) Pneumonia RR 1.55 (1.09–2.20) URI RR 1.01 (0.92–1.11) Respiratory Symptoms RR 1.49 (1.22–1.84) Age 5–17 All resp index RR 0.93 (0.83–1.05) Asthma RR 1.25 (1.05–1.48) Acute Bronchitis RR 1.25 (0.64–2.43) Bronchitis RR 1.64 (0.72–3.39) Pneumonia RR 0.75 (0.32–1.54) URI RR 0.70 (0.59–0.84) Respiratory Symptoms RR 0.93 (0.64–1.36) |
| Johnston et al., 2014 [34] Site: Sydney, Australia Funding: Research grants, government | Design: Cross-sectional (case-crossover) Enrollment: 1 July 1996–30 June 2007 Setting: Metropolitan area | N: 344,933 (52% of 663,333 were pediatric) Age: <15 years Data source: NSW Emergency Department Data Collection Other: ICD codes for respiratory, cardiac and cerebrovascular ED visits | Definition: Citywide PM > 99th percentile (44/46 days wildfire, 2/46 days prescribed burn) Number of days: 46 Exposed population: by postal code | Population: same individuals Comparator: Matched non-smoke days in the same year, month and day of the week | PM2.5: mean 39.1 (non-smoke 9.9) mg/m3 PM10: mean 60.5 (non-smoke 17.8) mg/m3 Other measure: not reported Monitoring: Government air quality stations Time between exposure and outcome: Lag 0, 1, 2, 3 days | Lag 0 All Resp OR: 1.01 (0.97–1.06) Asthma OR 1.06 (0.97–1.17) Pneumonia/Bronchitis OR 0.96 (0.85–1.07) Lag 1 All Resp OR 1.00 (0.96–1.05) Asthma OR 1.05 (0.96–1.15) Pneumonia/Bronchitis OR 0.97 (0.87–1.09) Lag 2 All Resp OR 0.94 (0.90–0.98) Asthma OR 0.97 (0.89–1.07) Pneumonia/Bronchitis OR 1.05 (0.94–1.18) Lag 3 All Resp OR 0.97 (0.93–1.01) Asthma OR 1.00 (0.91–1.09) Pneumonia/Bronchitis OR 1.01 (0.90–1.13) | Not reported | Not reported | Not reported |
| Kunzli et al., 2006 [15] Site: Southern California Funding: Data provision by South Coast Air Quality Management District 041829 | Design: Cross-sectional (case-crossover) survey of an existing cohort Enrollment: 20 October to 3 November 2003 Setting: Mixed rural and urban | N: 834 age 17–18; 3775 age 6–7; 4609 total Age: 6–7 and 17–18 years Data source: Questionnaires Other: Participants were recruited from the existing University of California Children’s Health Study (CHS) (Kunzli) | Definition: Population exposed to the fire or smoke from the fire Number of days: not described Exposed population: by address (survey of existing cohort); 35 participants lost their home in the fire | Population: children enrolled in the University of California Children’s Health Study Comparator: Same population before the fire | PM2.5: not reported PM10: 2, 3, 4 or 5-day mean PM10 level depending on length of fire smoke exposure of a community Other measure: “smell of fire smoke” indoors Monitoring: local air quality monitors, Time between exposure and outcome: 1–2 days, 3–5 days, ≥6 days | Not reported | Not reported | 1–5 days smoke smell Itchy/Watery eyes OR 2.26 (1.90–2.68) Irritated eyes OR 2.38 (2.01–2.82) sneezing/nasal symptoms OR 1.98 (1.68–2.33) cold OR 1.50 (1.25–1.81) sore throat OR 1.81 (1.53–2.14) dry cough at night OR 2.25 (1.87–2.71) dry cough in morning 2.24 (1.85–2.72) dry cough other times OR 2.67 (2.20–3.24) wet cough OR 1.42 (1.13–1.79) wheezing or whistling OR 2.15 (1.63–2.83) wheeze/disturb sleep OR 2.29 (1.56–3.37) wheeze/limit speech OR 2.23 (1.03–4.83) asthma attack OR 1.32 (0.84–2.07) bronchitis OR 1.33 (0.87–2.02) medication for above OR 1.82 (1.51–2.19) miss school for above OR 1.59 (1.25–2.02) >6 days smoke smell Itchy/Watery eyes OR 4.11 (3.36–5.02) Irritated eyes OR 4.42 (3.61–5.41) sneezing/nasal symptoms OR 2.79 (2.30–3.39) cold OR 2.13 (1.73–2.63) sore throat OR 2.50 (2.05–3.05) dry cough at night OR 3.35 (2.71–4.15) dry cough in morning OR 2.91 (2.33–3.63) dry cough other times OR 3.27 (2.61–4.09) wet cough OR 2.15 (1.67–2.77) wheezing or whistling OR 3.53 (2.62–4.75) wheeze/disturb sleep OR 4.94 (3.33–7.33) wheeze/limit speech OR 5.49 (2.63–11.48) asthma attack OR 1.63 (1.00–2.67) bronchitis OR 2.23 (1.45–3.43) medication for above OR 2.33 (1.89–2.88) miss school for above OR 2.24 (1.72–2.91) | 1–5 days smoke smell visit doctor for symptoms OR 1.33 (1.02–1.74) >6 days smoke smell visit doctor for symptoms OR 2.03 (1.53–2.71) |
| Lee et al., 2009 [35] Site: Hoopa Valley, California, USA Funding: None reported | Design: Pre/post Enrollment: 17 August to 4 November 1999 Setting: Indigenous Reserve/Rural | N: 1211 Age: <19 years Data source: Hoopa Reservation Medical Clinic electronic medical record Other: Patients with unknown residence were excluded | Definition: Population exposed to wildfire smoke was presumed by presenting to the Hoopa Valley Medical Centre Number of days: 84 Exposed population: Residents with addresses from Hoopa Valley, Burnt Ranch, Salyer Area, Weitchpec and Willow Creek Area and non-residents (presumed to be firefighters deployed to the area) | Population: All individuals who visited the Hoopa Valley Medical Centre Clinic for cardiorespiratory outcomes Comparator: Same calendar days in the previous year (1998) | PM2.5: Not reported PM10: Maximum daily PM10 in 1999 were 619.8 mg/m3 and in 1998 were 175 mg/m3 Other measure: not reported Monitoring: Hoopa’s Tribal Environmental Protection Agency used a tapered element oscillating microbalance ambient particulate monitor for hourly measurements Time between exposure and outcome: no lag time | Not reported | Not reported | Not reported | All resp clinic visit Resident in fire zone OR 1.74 (1.24–2.43) Resident nearby fire zone OR 0.86 (0.26–2.81) Non- resident OR 2.99 (0.33–26.90) Asthma clinic visits OR 1.39 (0.77–2.51) |
| Leibel et al., 2020 [36] Site: San Diego County, California, USA Funding: | Design: Cross-sectional Enrollment: 6–17 December 2017 Setting: Mixed rural and urban | N: 30,087 Age: <19 years; subdivided into 0–5, 6–12, 13+ years Data source: Rady Children’s Hospital and University of California Clinics Electronic Medical Record Other: None | Definition: Exposed population residing in San Diego County based on zip code Number of days: 12 Exposed population: Zip code during the exposure period | Population: Patients visiting the Rady Children’s Hospital and University of California pediatric clinics Comparator: Same weeks (during same calendar month) in 2011 to 2016 | PM2.5: average daily increase of 5.6 mg/m3 PM10: Not reported Other measure: Correlated with satellite imaging from the Moderate Resolution Imaging Spectroradiometer (MODIS) Rapid Response System Monitoring: US EPA Air Quality System from San Diego County Time between exposure and outcome: No lag time | Age 0–5 All resp ED excess visit 7.30 (3.00–11.70) All resp Urgent Care excess visit 7.7 (4.1–11.3) Age 6–12 All resp ED excess visit 3.40 (2.30–4.60) All resp Urgent Care excess visit 3.60 (2.30–4.90) Age 13–19 All resp ED excess visit 2.00 (1.00–3.00) All resp Urgent Care excess visit 3.30 (2.30–4.20) All Ages (0–19) All resp ED excess visit 16.00 (11.60–21.60) All resp Urgent Care excess visit 16.60 (11.60–21.60) | Not reported | Not reported | Not reported |
| Pratt et al., 2019 Site: USA [37] Funding: None reported | Design: Cross-sectional Enrollment: May to September 2005–2014 Setting: Mixed rural and urban (country-level data) | N: not reported Age: 0–18 years Data source: No primary data; secondary estimates based on US Centers for Disease Control reported values for children with asthma Other: Behavioral Risk Factor Surveillance System (BRFSS; US Centers for Disease Control), National Health Interview Survey (US Centers for Disease Control) to estimate the number of children with asthma | Definition: ED visits for asthma in children attributable to wildfire smoke exposure Number of days: not reported Exposed population: Children living in areas where ozone and PM2.5 were elevated by ≥1 standard deviation above the local mean based on nearest US Environmental Protection Agency measuring device | Population: Median ED visits per 100,000 children in the presence of wildfire smoke Comparator: Median ED visits per 100,000 children in the absence of wildfire smoke exposure | PM2.5: ≥1 standard deviation > the station mean PM10: not reported Other measure: Elevated ozone attributable to wildfire smoke (EOAS); smoke present in the atmospheric column Monitoring: Time between exposure and outcome: not reported | Data not expressed as OR, RR, or excess visit “overall median estimated ED visit in children with asthma that may be attributed to EOAS for the study period” The number of visits attributed to EOAS was 2403 (95% CB 235–5383) ED visits | |||
| Reid et al., 2016 [38] Site: Northern California: Sacramento valley, san Francisco Bay Area, mountain Counties, Lake County, North Central Coast, northern San Joaquin Valley Funding: Research grants, US EPA | Design: Pre/post Enrollment: Pre-fire 6 May–19 June 2008 (43 days); Fire period 20 June to 31 July 2008 (42 days), Post-fire period 1 August to 15 September 2008 (46 days) Setting: Mixed rural and urban | N: 10,363 (ED visits); 648 (hospitalizations) Age: <20 years Data source: Office of Statewide Health, Planning and Development (California, USA) Other: Hospital admission and ED visits (OSHPD) | Definition: smoke attributable to wildfire Number of days: 42 Exposed population: by zip code during fire period | Population: Cross-sectional review of ED visits and hospitalizations by age on each day of exposed and comparison periods Comparator: Pre-fire period | PM2.5: Before 6.3, during 19.1, after 8.5 mg/m3 PM10: Not reported Other measure: Ozone before 54.4, during 47.6, after 60.0 ppb Monitoring: Modelling including 112 monitoring stations and aerosol optic depth from Geostationary Operational Environmental Satellite Time between exposure and outcome: same-day, 1 and 2 days after exposure | During fire All resp RR 0.99 (0.98–1.00) Asthma RR 1.03 (1.00–1.05) Pneumonia RR 0.98 (0.94–1.01) | During fire All resp RR 0.99 (0.96–1.03) Asthma RR 1.01 (0.94–1.09) Pneumonia RR 1.01 (0.96–1.07) | Not reported | Not reported |
| Resnick et al., 2015 [39] Site: Albuquerque, New Mexico, USA Funding: US Centers for Disease Control | Design: Pre/post Enrollment: 1 May to 8 July 2011 Setting: Urban | N: 1369 Age: <19 years Data source: New Mexico Department of Health Other: None | Definition: Population exposed to wildfire smoke Number of days: 13 Exposed population: Individuals residing in the Albuquerque area who reported to the ED for cardiorespiratory visits during the exposure period | Population: Patients visiting an Albuquerque-area ED for cardiorespiratory visits Comparator: Daily average ED visits during periods with no acute exposure | PM2.5: 24-h averages: pre-fire mean 6.8 mg/m3, acute mean 31.3 mg/m3, post-acute mean 14.5 mg/m3 PM10: not reported Other measure: AQI (comparator) Monitoring: City of Albuquerque air quality monitors (2), hourly recordings Time between exposure and outcome: No lag time reported | 12 days during fire All resp RR 0.70 (0.61–0.82) Asthma RR 1.02 (0.74–1.30) Other resp RR 1.24 (0.62–2.50) 3 weeks post peak smoke All resp RR 0.54 (0.48–0.62) Asthma RR 0.79 (0.59–1.04) Other resp RR 0.75 (0.39–1.47) | Not reported | Not reported | Not reported |
| Stowell et al., 2019 [40] Site: Colorado, USA Funding: Research grants, US EPA | Design: Cross-sectional (case-crossover) Enrollment: May-August 2011 to May-August 2014 Setting: Statewide (urban and rural) | N: 94,022 Age: 0–18 Data source: Colorado Department of Public Health and Environment Other: ED visits and hospitalizations by ICD-9 code | Definition: smoke attributable to wildfire Number of days: not reported Exposed population: by 1 km2 spatial grid (exposure) and zip code | Population: same individuals Comparator: Four non-smoke days per smoke day per individual on the same day of the week and calendar month | PM2.5: Wildfire PM2.5 minus daily PM2.5 means; 0–37 mg/m3 PM10: Not reported Other measure: not reported Monitoring: Combined satellite and US EPA ground monitors Time between exposure and outcome: Lag 2 days cardiac, 3 days respiratory presentations | 3 day average All Resp OR 1.02 (1.00–1.03) Asthma OR 1.08 (1.04–1.12) Bronchitis OR 0.97 (0.89–1.06) URI OR 1.01 (0.99–1.03) | Not reported | Not reported | Not reported |
| Tham et al., 2009 [41] Site: Victoria, Australia Funding: Post-doctoral fellowship | Design: Cross-sectional Enrollment: 1 October 2002–1 April 2003 Setting: Mixed rural and urban | N: not reported Age: <15 years Data source: Victorian Department of Human Services Other: | Definition: respiratory ED visits and hospital admissions for children on wildfire smoke impacted days Number of days: Not reported Exposed population: Children living in the area on smoke-exposed days based on elevated PM10, PM0.1–1 and ozone | Population: respiratory ED visits and hospital admissions on smoke-exposed days Comparator: respiratory ED visits and hospital admissions for the same location on non-smoke days | PM2.5: not reported PM10: 24-h averages Other measure: API (PM0.1–1) and ozone Monitoring: Tapered element oscillating microbalance, Airborne Particle Index and chemiluminescence for ozone Time between exposure and outcome: No lag and 1-day lag | Data not expressed as OR, RR, or excess visit “daily ED and hospital admissions”. A trend toward increased hospital admissions and ED visits on days with elevated wildfire smoke was not broken into individual age groups and did not reach significance. | |||
| Tinling et al., 2016 [42] Site: North Carolina, USA Funding: No identified funding | Design: Cross-sectional Enrollment: May 5 to June 18 2011 Setting: Mixed rural and urban | N: 7900 Age: <18 years Data source: North Carolina Disease Event tracking and Epidemiologic Collection Tool (NCDETECT) Other: None | Definition: Exposed population residing in North Carolina by county Number of days: 45 Exposed population: County-level daily exposures to wildfire PM2.5 | Population: All ED visits for cardiorespiratory outcomes Comparator: ED visits for bone fractures (not anticipated to have any wildfire-related changes) | PM2.5: Peak exposure days > 100 mg/m3 PM10: not reported Other measure: not reported Monitoring: Smoke Forecasting System (National Air Resources Laboratory of the National Oceanic and Atmospheric Administration) Time between exposure and outcome: 0- and 2- day lag time from exposure | Lag day 0–2 All resp ED visit RR 1.09 (1.01–1.17) Asthma RR 0.97 (0.86–1.09) URI RR 1.14 (1.04–1.24) Respiratory/other chest symptoms visit RR 1.18 (1.06–1.33) | Not reported | Not reported | Not reported |
| Vicedo-Cabrera et al., 2016 [16] Site: Valencia, Spain Funding: Research Grant | Design: Cross-sectional survey of an existing cohort Enrollment: 16–27 June; 28 June–8 July 2012 Setting: Mixed rural and urban including cities and villages | N: 496 Age: 5 Data source: The Infancia y Medio Ambiente (INMA) Project, Spain (Valencia Cohort) https://www.proyectoinma.org/ (accessesd on 19 August 2021) Other: Participants were recruited from an existing cohort to report on wildfire exposure symptoms | Definition: Population exposed to wildfire smoke Number of days: 11 Exposed population: Based on postal code and individual report of being present at that address during the smoke period | Population: 5 year old children enrolled in the INMA Project Comparator: Same population in the 11 day period immediately before the fire | PM2.5: not reported PM10: not reported Other measure: self-reported “perception of exposure” Monitoring: not reported Time between exposure and outcome: not reported | Not reported | Not reported | Overall Itchy/Water eyes OR 3.11 (1.62–5.97) Sneezing OR 1.39 (0.76–2.54) Sore throat OR 3.02 (1.41–6.44) Dry cough OR 1.29 (0.64–2.59) Smoke smell outdoors at least 1 day Itchy/Watery eyes OR 3.53 (1.79–6.98) Sneezing OR 1.38 (0.73–2.61) Sore throat OR 3.20 (1.47–6.98) Dry cough OR 1.41 (0.68–2.94) Smoke smell indoors at least 1 day Itchy/Watery eyes OR 3.45 (1.60–7.44) Sneezing OR 1.51 (0.67–3.38) Sore throat OR 4.21 (1.76–10.05) Dry cough OR 1.68 (0.69–4.11) Dense air outdoors at least 1 day Itchy/Watery eyes OR 3.84 (1.76–8.35) Sneezing OR 1.91 (0.87–4.22) Sore throat OR 4.23 (1.78–10.04) Dry cough OR 2.03 (0.85–4.85) Distance to fires >30 km Itchy/Watery eyes OR 2.85 (1.47–5.51) Sneezing OR 1.47 (0.79–2.72) Sore throat OR 3.28 (1.48–7.28) Dry cough OR 1.39 (0.69–2.83) Distance to fires ≤30 km Itchy/Watery eyes OR 2.06 (0.77–5.53) Sneezing OR 2.06 (0.66–6.43) Sore throat OR 4.61 (1.43–4.88) Dry cough OR 1.57 (0.46–5.36) Children without Rhinitis Itchy/watery eyes OR 3.23 (1.58–6.59) Sneezing OR 1.22 (0.66–2.27) Sore throat OR 2.56 (1.18–5.55) Dry cough OR 1.15 (0.55–2.42) Children with Rhinitis Itchy/watery eyes OR 8.06 (1.98–32.88) Sneezing OR 7.19 (1.34–38.58) Sore throat OR 2.48 (0.39–5.91) Dry cough OR 3.08 (0.49–19.33) Children without Asthma Itchy/watery eyes in OR 3.23 (1.63–6.40) Sneezing OR 1.33 (0.72–2.46) Sore throat OR 2.81 (1.30–6.05) Dry cough OR 1.29 (0.64–2.60) Children with Asthma Itchy/watery eyes OR 9.26 (2.14–40.12) Sneezing OR 11.40 (2.01–4.52) Sore throat OR 6.25 (1.14–34.30) Dry cough OR 3.93 (0.63–24.62) | Not reported |
| Study | Study Design | Risk of Bias Issues | Wildfire Measure | Age (Years) | Respiratory Outcomes: Effect Direction | |||||
|---|---|---|---|---|---|---|---|---|---|---|
| ED or Clinic Visits | Hospitalizations | Symptoms | ||||||||
| RV | AV | RV | AV | Respiratory | Other | |||||
| Delfino et al., 2009 [30] | Pre-post | NA | PM2.5, humidity, temperature | 0–4 5–19 | NR | NR | ⇑ ◊ | ◊ ◊ | NR | NR |
| Gan et al., 2017 [31] | Cross-sectional | NA | PM2.5 | <15 | NR | NR | ⇑ | ⇑ | NR | NR |
| Hanigan et al., 2008 [32] | Cross-sectional | Confounding, attrition, exposure characterization | Visibility index | <15 | NR | NR | ⇑ | ⇑ | NR | NR |
| Henderson et al., 2011 [23] | Cross-sectional | NA | PM10, satellite | 0–4 5–9 10–19 | ◊ ◊ ◊ | NR | NR | NR | NR | NR |
| Hutchinson et al., 2018 [33] | Cross-sectional | NA | PM2.5, AQI | 0–4 5–17 | ⇑ ◊ | ⇑ ⇑ | ◊ ◊ | ◊ ◊ | NR | NR |
| Johnston et al., 2014 [34] | Cross-sectional | NA | PM2.5, PM10 | <15 | ◊ | ◊ | NR | NR | NR | NR |
| Kunzli et al., 2006 [15] | Cross-sectional | Attrition, outcome assessment | PM10, smell of fire smoke | ⇑ | ◊ | NR | NR | ⇑ | ◊ | |
| Lee et al., 2009 [35] | Pre-post | Exposure characterization, attrition | PM10 | <19 | ⇑ | ◊ | NR | NR | NR | NR |
| Leibel et al., 2020 [36] | Cross-sectional | Outcome assessment | PM2.5, satellite | <19 | ⇑ | NR | NR | NR | NR | NR |
| Pratt et al., 2019 [37] | Cross-sectional | Exposure characterization | PM2.5, ozone | 0–18 | NR | ⇑ | NR | NR | NR | NR |
| Reid et al., 2016 [38] | Pre-post | NA | PM2.5, ozone | <20 | ◊ | ◊ | NR | NR | NR | NR |
| Resnick et al., 2015 [39] | Pre-post | Confounding variables | PM2.5, AQI | <19 | ⇓ | ◊ | NR | NR | NR | NR |
| Stowell et al., 2019 [40] | Cross-sectional | NA | PM2.5 | 0–18 | ◊ | ⇑ | NR | NR | NR | NR |
| Tham et al., 2009 [41] | Cross-sectional | NA | PM10, PM2.5, ozone | <15 | ◊ | NR | NR | NR | NR | NR |
| Tinling et al., 2016 [42] | Cross-sectional | NA | PM2.5 | <18 | ⇑ | ◊ | NR | NR | NR | NR |
| Vicedo-Cabrera et al., 2016 [16] | Cross-sectional | Exposure characterization, outcome assessment | Self-reported exposure | 5 | NR | NR | NR | NR | ◊ | ⇑ |
| Outcomes | Effect a | Number of Participants (Number of Studies) | Certainty of Evidence (GRADE) [28] |
|---|---|---|---|
| Outpatient clinic visits for any respiratory cause | All three studies observed a positive association between wildfire smoke and clinic visits for respiratory problems | 9977 (3) [15,33,35] | Low All observational studies, some concerns about risk of bias. |
| Outpatient clinic visits for asthma exacerbation | No significant effect of wildfire smoke on asthma clinic visits with only one of three studies showing a positive association | 9977 (3) [15,33,35] | Very low All observational studies, some concerns about risk of bias. |
| ED visits for any respiratory cause | Five of eight studies noted a positive association between wildfire smoke exposure and respiratory ED visits; two showed no difference and one showed a negative association | 557,454 (8) [23,33,34,36,38,39,40,42] | Moderate Observational studies however participant numbers are high and some evidence of dose–response relationship |
| ED visits for asthma exacerbation | No significant association between wildfire exposure and ED asthma visits with three of eight studies showing a positive association and five no association | 557,454 (8) [23,33,34,36,38,39,40,42] | Moderate Observational studies however participant numbers are high and some evidence of dose–response relationship |
| Hospitalization for any respiratory cause | Three of four studies showed a positive association between wildfire smoke and respiratory hospitalizations and one no association | 13,258 (4) [30,31,33,38] | Moderate Some evidence of dose response |
| Hospitalization for asthma exacerbation | No significant association between asthma hospitalizations and wildfire smoke, with two of four studies showing a positive association and two no association | 13,258 (4) [30,31,33,38] | Moderate Some evidence of dose response |
| Any respiratory symptoms or self-reported diagnoses: dry or wet cough, asthma exacerbation, bronchitis | No clear association between wildfire smoke and respiratory symptoms shown with one study positive and one smaller study showing no association | 1330 (2) [15,16] | Very low Risk of bias with exposure characterization and outcome assessment |
| Itchy/watery eyes, nasal congestion or sneezing, rhinitis and sore throat | Strong association between eye, nose and throat symptoms and wildfire smoke exposure in two studies | 1330 (2) [15,16] | Low Risk of bias for exposure characterization |
Publisher’s Note: MDPI stays neutral with regard to jurisdictional claims in published maps and institutional affiliations. |
© 2021 by the authors. Licensee MDPI, Basel, Switzerland. This article is an open access article distributed under the terms and conditions of the Creative Commons Attribution (CC BY) license (https://creativecommons.org/licenses/by/4.0/).
Share and Cite
Henry, S.; Ospina, M.B.; Dennett, L.; Hicks, A. Assessing the Risk of Respiratory-Related Healthcare Visits Associated with Wildfire Smoke Exposure in Children 0–18 Years Old: A Systematic Review. Int. J. Environ. Res. Public Health 2021, 18, 8799. https://doi.org/10.3390/ijerph18168799
Henry S, Ospina MB, Dennett L, Hicks A. Assessing the Risk of Respiratory-Related Healthcare Visits Associated with Wildfire Smoke Exposure in Children 0–18 Years Old: A Systematic Review. International Journal of Environmental Research and Public Health. 2021; 18(16):8799. https://doi.org/10.3390/ijerph18168799
Chicago/Turabian StyleHenry, Shelby, Maria B. Ospina, Liz Dennett, and Anne Hicks. 2021. "Assessing the Risk of Respiratory-Related Healthcare Visits Associated with Wildfire Smoke Exposure in Children 0–18 Years Old: A Systematic Review" International Journal of Environmental Research and Public Health 18, no. 16: 8799. https://doi.org/10.3390/ijerph18168799
APA StyleHenry, S., Ospina, M. B., Dennett, L., & Hicks, A. (2021). Assessing the Risk of Respiratory-Related Healthcare Visits Associated with Wildfire Smoke Exposure in Children 0–18 Years Old: A Systematic Review. International Journal of Environmental Research and Public Health, 18(16), 8799. https://doi.org/10.3390/ijerph18168799