Abstract
Background: We conducted this systematic review and meta-analysis to address the crucial public health issue of the suspected association between air pollution exposure during pregnancy and the risk of infant mortality. Methods: We searched on MEDLINE ® databases among articles published until February, 2019 for case-control, cohort, and ecological studies assessing the association between maternal exposure to Nitrogen Dioxide (NO2) or Particular matter (PM) and the risk of infant mortality including infant, neonatal, and post-neonatal mortality for all-and specific-causes as well. Study-specific risk estimates were pooled according to random-effect and fixed-effect models. Results: Twenty-four articles were included in the systematic review and 14 of the studies were taken into account in the meta-analysis. We conducted the meta-analysis for six combinations of air pollutants and infant death when at least four studies were available for the same combination. Our systematic review has revealed that the majority of studies concluded that death risk increased with increased exposure to air pollution including PM10, PM2.5, and NO2. Our meta-analysis confirms that the risk of post-neonatal mortality all-causes for short-term exposure to PM10 increased significantly (pooled-OR = 1.013, 95% CI (1.002, 1.025). When focusing on respiratory-causes, the risk of post-neonatal death related to long-term exposure to PM10 reached a pooled-OR = 1.134, 95% CI (1.011, 1.271). Regarding Sudden Infant Death Syndrome (SIDS), the risk also increased significantly: pooled-OR = 1.045, 95% CI (1.01, 1.08) per 10 µg/m3), but no specific gestational windows of exposure were identified. Conclusion: In spite of a few number of epidemiological studies selected in the present literature review, our finding is in favor of a significant increase of infant death with the increase of air pollution exposure during either the pregnancy period or the first year of a newborn’s life. Our findings have to be interpreted with caution due to weaknesses that could affect the strength of the associations and then the formulation of accurate conclusions. Future studies are called to overcome these limitations; in particular, (i) the definition of infant adverse outcome, (ii) exposure assessment, and (iii) critical windows of exposure, which could affect the strength of association.
1. Introduction
Despite considerable improvement in the prevention, management, and regulation of air pollution, it remains a leading environmental health issue worldwide and has been identified as a health priority on the sustainable development agenda [1]. Having clean air to breathe is a fundamental requirement for human health and well-being. While the increased risk to health of air pollution is relatively low in comparison with other risk factors, the total number of people affected is significant. According to the Organisation for Economic Cooperation and Development, air pollution is known to be the main environmental cause of premature death (2014) [2]. Environmental policies aiming to tackle the air pollution issue have proved to be effective, having health benefits. However, using a recent air quality model, the World Health Organisation (WHO) has calculated that 92% of the population lives in places where air quality levels exceed WHO limits [3]. Certain groups within the population are known to be more vulnerable to the health effects of air pollution exposure, and one such group is newborns and infants because of their overall physiological immaturity [4,5].
While the findings of epidemiological studies investigating risk factors are essential in public health, quantitative Health Impact Assessments (HIAs) are key to public policy regulatory and decision-making processes because they provide valuable information on future health concerns related to any potential intervention. HIA methodology calls upon a diverse set of data sources, including the dose-response function which indicates the expected change in a given outcome per unit change of pollutant deriving from epidemiological studies that assess the relative risk associated with the observed or modelled exposure [6]. This relative risk may come from meta-analyses providing pooled estimates. The benefits of a meta-analysis are that it offers relative risk estimation within a specific vulnerable population as well as a better fit with the geographical context of exposure.
In previous years, there has been an increase in the number of studies investigating links between infant mortality and air pollution. The potential impact of air pollution exposures on infant mortality has already been reviewed in 2004; that study suggested a stronger association between particulate air pollution and some causes of infant death [7]. Since then, several recent studies have been published [8,9,10]. In this context, an updated literature synthesis might tell us whether the current epidemiological evidence favours an association between infant mortality and air pollution, with a view to suggesting future directions for research.
2. Material and Methods
2.1. Search Strategy
A systematic literature search was conducted using the PubMed platform which provides access to the MEDLINE® database and Academic Search Complete databases, among articles published up until February, 2019. The search strategy followed the PRISMA (Preferred Reporting Items for Systematic reviews and Meta-Analyses) guidelines [11] and was performed with the following keywords found in articles’ titles and/or abstracts:
“Air pollution” OR “Air pollutant” OR “Air Pollutants” or “outdoor Pollution” OR “Particular matter” OR “PM25” OR “PM10” OR “Black Emission” OR “Black Carbon” OR “Nitrogen Dioxide” AND “Infant Mortality” OR “Infant Mortalities” OR “Infant Death” OR “Child Mortality” OR “Child Mortalities” OR “Child Death” OR “Child Deaths” OR “Under-one Mortality” OR “Under-one Mortalities” OR “Under-one Death” OR “Under-one Deaths” OR “Neonatal Mortality” OR “Neonatal Mortalities” OR “Neonatal Death” OR “Neonatal Deaths”.
2.2. Selection of Studies
In line with PRISMA recommendations, Figure 1 summarizes the different stages of the selection process.
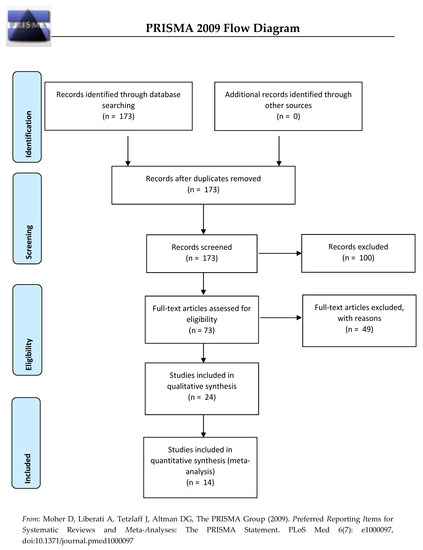
Figure 1.
Flow diagram for the inclusion and exclusion of studies.
In the first stage, the inclusion criteria were peer-reviewed papers written in English and articles published after 2000 without restriction on geographical location and human studies. We restricted our systematic review on the children aged under 1 year. Papers presenting non-original studies (e.g., comments, systematic reviews, meta-analysis, reports, case reports, animal and mechanistic studies, and biological experiments) were ultimately excluded. Using these criteria, 173 of the 280 articles published were selected for inclusion.
In the second stage, titles and abstracts of the 173 articles were screened. A total of 100 studies were then excluded when they:
- (i)
- Investigated adult mortality, other pregnancy, birth, infant, or child outcomes
- (ii)
- Considered indoor air pollution, smoking exposure, or were traffic-related (industrial plants, all types of wastes, cooking and biomass fuels consumption, ambient conditions, other environmental exposures)
- (iii)
- Dealt with other outdoor air pollutants measured (not including PM2.5, PM10, or NO2)
In the third stage, full manuscripts of the remaining 73 articles (of the 173 initially selected) were read thoroughly by two independent experts; 24 studies were retained if:
- (i)
- Studies investigated the death among children aged between 0 and 1 years old.
- (ii)
- Studies considered only the air exposure traffic related.
- (iii)
- The outdoor air pollutants measured included at least PM2.5, PM10, or NO2, the three pollutants of interest.
- (iv)
- Studies were original studies quantifying the relationship between infant mortality and outdoor air exposure related traffic (not non-original studies, opinion articles, comments, critical, narrative, and systematic reviews and meta-analysis, Global Burden of Disease studies, HIAs, environmental health indicators, risk assessments)
Ultimately, a total of 24 articles met the inclusion criteria for the systematic literature review.
In order to perform a meta-analysis, studies were excluded where there was:
- (i)
- no measure of association
- (ii)
- a measure of exposure not expressed as a pollutant concentration (for instance: exposed/not exposed)
- (iii)
- when either outcome (neonatal mortality) or exposure (NOx in the summer season) was not pertinent for the meta-analysis
Also, meta-analysis was not performed where measures of association between a given outcome and a pollutant were available for at least four studies.
Hence, of the 24 articles included in this systematic literature review, 10 did not meet the inclusion criteria for the meta-analysis. In the end, 14 articles were included in the meta-analysis.
2.3. Data Extraction
For each study, we extracted and reported the following information in several tables:
- (i)
- General information: first author’s name, date of study, and country of origin,
- (ii)
- Main study characteristics: study design, spatial unit, statistical methods, population definition, main findings (related to infant outcomes and PM10, PM2.5, and NO2 only),
- (iii)
- Participant characteristics: information on confounders and exposure measures,
- (iv)
- Outcome measures: outcomes classification, definition, and source,
- (v)
- Measures of association were extracted including Hazard Ratios (HRs), Odds Ratios (ORs), Relative Risks (RRs), and other metrics measuring the strength of association between mortality and exposure to different pollutants including PM10, PM2.5, and NO2. Where several measures of association were available, we reported those taken from the fully adjusted models.
2.4. Meta-Analysis
The pooled estimate between exposure to air pollution and mortality was computed only where at least four studies were available. All risk estimates were expressed as unit risks corresponding to an increase of 10 µg/m3. The combined effect was obtained from a fixed or random model based on the Cochran Q-test, the I-square statistic, and the associated p-value. Where the Cochran Q-test revealed significant heterogeneity between studies, a random model was implemented; conversely, a fixed model was applied where the Q-test was not significant. The I-square (I2) indicator quantifies the level of heterogeneity between studies. Where the value varies between 25% and 50%, 50% and 75%, and >75%, this corresponds to a low, medium, and high level of heterogeneity, respectively. Forest plots were created to represent the combined risk estimates. All statistical analyses was performed using STATA 11.
2.4.1. Publication Bias
Funnel plots, which present effect sizes plotted against their standard errors, were used to assess for potential publication bias. The asymmetry of the funnel plot is an indication of publication bias which can be confirmed by applying the begg‘s rank test for small-study effects. This test examines the correlation between the effect size and their corresponding sampling variances, with a strong value of correlation meaning a publication bias.
2.4.2. Sensitivity Analysis
In addition, we also evaluated the influence of each individual study on the overall meta-analysis estimate; we implemented several meta-analyses in which the meta-risk is re-estimated, omitting each study in turn (we used the metaninf function in STATA software (StataCorp, College Station, TX, USA). While there is no formal statistical test to prove that such a study should, or should not, be removed from the analysis, we followed two general guidelines to assess the influence of a given study. We analyzed if the point estimate of this omitted analysis lies outside the confidence interval of the combined analysis and second, if the omitted study excessively influenced the significance of the combined risk.
3. Results
3.1. Main Characteristics of the Studies
3.1.1. General Description
Table 1 provides the characteristics of all the studies reviewed by year of publication, type of study design, infant mortality outcome, exposure assessment, and major findings and conclusions.

Table 1.
Main characteristics of the selected studies, ordered by year of publication.
Since 2000, 24 studies (covering more than 400,000 infant deaths) had been published to estimate the association between outcomes and exposure to three ambient pollutants: PM2.5, PM10, and NO2. Of these, infant mortality all causes, post-neonatal infant mortality all causes, respiratory causes of infant and post-neonatal mortality, and sudden infant death syndrome were investigated (Table 1). Only 14 of the studies were eligible for meta-analyses.
3.1.2. Study Design and Location
Most of the studies were conducted in the United-States (in both the north and south) [8,10,12,13,14,15,16,17,18,19,20,21]. There were also 6 studies conducted in Europe and the UK [9,22,23,24,25], 7 studies conducted in Asia [26,27,28,29,30,31], and a single study conducted in Africa [32]. Our systematic review is grouped by study design: a majority are ecological studies [9,12,19,20,23,24,31]; others are case crossover studies [8,18,22,25,26,28,29,30], case-control studies [15,16,17], cohort, and cross sectional studies [10,13,14,27,32].
3.1.3. Cases Definition and Data Sources
While many studies investigated only the overall group of infant mortality [9,10,15,21,23,24,25,26,32], post-neonatal [8,9,13,21,25,26,27,28], and neonatal death [9,10,15,21,23,25,26], others explored specific cause of death, mainly by respiratory causes [8,10,12,13,14,15,16,18,21,25,26,27,31] and Sudden Infant Death Syndrome (SIDS) [13,15,17,19,21,22,26,27]. Several studies stratified their analysis on an additional covariate. In 2011, Scheers et al. [25] analyzed the risk of death among a subgroup of newborns according to their birth weight (low birth weight versus normal birth weight) as well as the studies of Son et al. in 2011 [27] and Woodruff et al. in 2008 and 2006 [13,16]. Other authors stratified their analysis according to birth term (preterm versus at term) [15]. The definition of infant mortality by causes was relatively homogeneous across studies (see Table S1). Among studies investigating respiratory causes of death or SIDS, all but four (which did not give any precision [10,17,19,21]) based their outcome definition on the International Classification of Disease 9 and 10 (ICD 9–10). Databases were drawn mainly from birth and death certificates as well as from institutes such as the Institute of National Health Statistics or the Ministry of Health (see Table S1).
3.2. Air Pollution Exposure Assessment
In Table 2, the study’s results were structured by approaches that have been used to assess the level of residential exposure. Table 3 describes the different definitions of exposure windows considered in the 24 studies included in the systematic review.
Table 2.
Summary of approaches used to assess the residential exposure measures.
Table 3.
Definition and assessment of window of exposure.
3.2.1. Pollutants of Interest
Most studies investigated the effects of a single air pollutant, although a few looked at the effects of multiple pollutants [13,15,19,20]. The most frequently analysed air pollutants were PM10, PM2.5, NO2, CO, O3, NO2, and SO2 [9,19,20,21,22,28,29,30], although others studied considered more specific pollutants such as PM10-2.5 and TSP [27], PM7-2.5 and SPM [26]. The number of air pollutants included in studies to investigate the health consequences of exposure varied between 1 and 5: most analysed the effects of PM10, NO2, CO, O3, and SO2 [9,19,20,21,22,28,29,30], though others considered only PM10, CO, O3, and SO2 [10,13] or PM10, CO, O3, and NO2 [15]. Few studies focused on the effects of certain pollutants, namely PM10, PM2.5, and CO [14], or indeed the effects of just two pollutants, PM10 and O3 [8,12,18] or NO2 and CO [17]. Five studies considered a single pollutant, namely PM2.5 [16,32], PM10 [25], or NO2 [23,24].
3.2.2. Exposure Definition
All studies considered air pollution data from monitoring stations, except four studies [23,24,25,32] which based their measures of exposure on a modelling approach (Table 2). Whichever methodology was applied to characterize residential exposure, most often it was on a daily basis (except in four studies [21,23,24,32], which examined annual indicators). For all air pollutants (PM10, PM2.5, CO, NO2, and SO2), the authors most often used the daily (24 h) average, except in two studies which selected the maximum daily concentrations observed as the indicator of exposure [10,17]. Daily average O3 exposure was used by all studies bar three [8,12,18], which estimated the daily maximum of the eight-hour moving average as the exposure indicator.
The description of all studies included in the systematic review (n = 24) by approaches used to assess the residential exposure measures and Level exposure assigned to the population is shown in Table 3.
3.2.3. Window of Exposure
Table 3 revealed that both short- and long-term exposure to air pollution were used to investigate the relationship between residential exposure and infant mortality; short-term exposures were the most commonly explored exposure windows using various indicators that include daily exposure and cumulative exposure. Moreover, some studies chose not to focus on a particular critical window of exposure, instead measuring annual average pollutant concentrations at dwelling [21,23,24].
3.3. Meta Analysis
3.3.1. Main Characteristics
Our meta-analysis was conducted for 6 combinations between one air pollutant and one infant death when at least four studies were available for the same combination. More precisely, the 6 combinations were post-neonatal death all-causes related with (1) NO2 exposure and (2) PM10 exposure, post-neonatal death due to respiratory causes related with (3) PM2.5 and with (4) PM10 exposure, as well as sudden infant death syndrome (SIDS) related with (5) PM2.5 and with (6) PM10 exposure. All the measures of the association of the studies included in the meta-analysis are detailed in Table S2.
Where possible, stratified analyses have been performed in order to differentiate the health effect related to short- and long-term and daily or cumulative exposure. In all, 12 meta-analyses were implemented: of these, heterogeneity (Q-test) tests indicated eight meta-analyses with high I2 values (above or close to 50%) for which random effects models were applied (for the other four combinations, fixed models were used). Heterogeneity varied from 0% to 96.5%, indicating that measurement methods, sample properties, and characteristics varied both among and within different studies.
3.3.2. Specific Causes Death
Post-Neonatal Death All-Causes
As shown in the Figure 2, we found no significant increase of pooled-OR for exposure to NO2, while it clearly became significant with short-term PM10 exposure: pooled-OR = 1.013, 95% CI (1.002, 1.025).
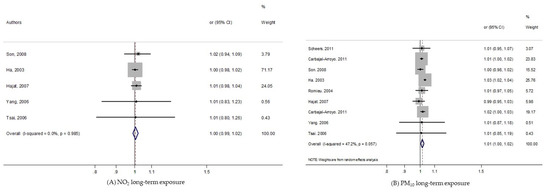
Figure 2.
Forest plots for combinations of post-neonatal death all-causes and pollutant. The size of each square represents the weight that contributes to the combined effect, respectively for: (A) NO2; (B) PM10.
Respiratory Post-Neonatal Death
As shown in the Figure 3, the long-term exposure of PM2.5 on post-neonatal death due to respiratory causes was not statistically significant. While the overall analysis of PM10 exposure did reveal a significant increase in pooled-risk (pooled-OR = 1.082, 95% CI (1.005, 1.165)), the stratified analysis indicated that it only remained significant among studies considering long-term windows of exposure: OR = 1.134, 95% CI (1.011, 1.271).
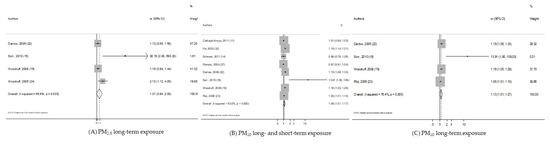
Figure 3.
Forest plots for combinations of post-neonatal death Respiratory-causes and pollutant. The size of each square represents the weight that contributes to the combined effect, respectively for: (A) Long-term PM2.5; (B) long- and short-term PM10; (C) long-term PM10.
Sudden Infant Death Syndrome
Regarding sudden infant death syndrome, 2 meta-analyses, with PM10 and PM2.5, were performed. As shown in the Figure 4, we found significant pooled-OR when considering PM10 exposure (pooled-OR = 1.045, 95% CI (1.01, 1.08) per 10 µg/m3); although when we kept only the three studies exploring the long term PM10 effect, the level of heterogeneity fell to 0%, yet the meta-risk was not significant at all: pooled-OR = 1.029, 95% CI (0.988, 1.072). In addition, the pooled-risk between SIDS and PM2.5 was not statistically significant.
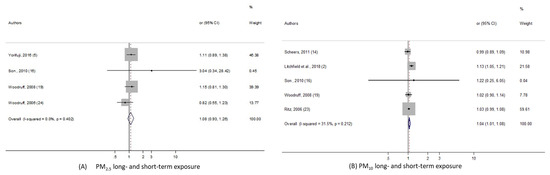
Figure 4.
Forest plots for combinations of sudden infant death syndrome and pollutant. The size of each square represents the weight that contributes to the combined effect, respectively for: (A) Long- and short-term PM2.5; (B) long- and short-term PM10.
3.3.3. Publication Bias
Funnel plot and Begg’s rank tests were applied to determine whether there was publication bias. All funnel plots are in Figure S1. The results summarized in Table 4 present a low probability of publication bias, reporting a p-value for Begg’s rank test over 0.05, except for respiratory post-neonatal deaths for which borderline p-values were obtained.
Table 4.
Begg’s test on the effect of air pollutants on infant mortality.
3.3.4. Sensitivity Analysis
Sensitivity analyses were performed to estimate the stability of our results by recalculating the pooled effects estimates after omitting one study each time (Table S3). For three meta analyses, we did not perform it due to too few numbers of studies. We found that the effect estimate of each 10 µg/m3 increase in NO2 and PM10 on post-neonatal death showed no significant change by removing one single study, suggesting that the combined results were relatively stable and reliable. Small variations were visible for respiratory post neonatal death and sudden death syndrome related to PM10 long- and short-term exposure; while point combined estimates were rather similar, the precision level of the confidence interval weakly decreased, leading to insignificant results with a lower limit of the 95% confidence interval less than but close to 1.
4. Discussion
4.1. Main Finding
Our systematic review has revealed that most studies conclude that there is an increased risk of infant death as a result of exposure to air pollution including PM10, PM2.5, and NO2. More precisely, our meta-analysis estimated a significant excess risk of post-neonatal mortality all-causes for short-term only exposure to PM10. We have also shown that the risk of respiratory post-neonatal death increased with a 10 µg/m3 increase in PM10 for long-term exposure specifically, as did the risk of SIDS with no specific gestational windows of exposure. In contrast, no significant excess risk of infant death was found regardless of pollutant or gestational window of exposure (including short- or long-term).
Taking into account the characteristics of the different studies (design, adjustment, definition of the outcomes....) (see S1, Table S4), these did not change the meta-risks estimated with the classical meta-analysis approach (data not shown).
These results could be partially explained by methodological limitations inherent to (i) definition of infant adverse outcome, (ii) exposure assessment and (iii) critical windows of exposure, which could affect the strength of the association. In addition, several inaccuracies and biases inherent to meta-analysis methods may bias cross-study comparisons and any conclusions drawn from them.
4.2. Outcome Data: Case Selection
We identified several pathways through which outcome data can lead to a bias in the measures of association. Firstly, outcome definition itself could constitute a source of uncertainty. The definitions of infant mortality used were (surprisingly) heterogeneous between studies, rendering comparisons difficult. For instance, although most of the studies have considered all deaths occurring among infants aged <1 year, few excluded neonatal mortality (death < 28 days) in order to consider the deaths most plausibly associated with air pollution [13,28] in terms of biological mechanisms. In addition, findings may be distorted as a result of some studies that were excluded, for instance, accidental [8,29,30,31] or external [15]. With regard to the definition of SID, two studies (26, 29) based their case definition on autopsies while other studies based the definition of SIDS cases on all unexplained deaths [21].
Another source of limitation lies in the health databases analyzed, which led the authors to collect different newborn and maternal characteristics. For instance, several studies investigated air pollution effects on infant death by cause [10,21,23,24], whereas others restricted their analysis to specific cause of death [12] or indeed considered all-causes of death due to lack of precise information [32].
Also, many studies ignored well-known risk factors for infant death such as gestational age, birth weight, and maternal age [9,10,12,18,20,22,23,24,25,26,32]. Furthermore, several other studies considered birth weight and/or gestational age as potential modifiers of the association between infant death and air pollution exposure. In order to do this, these studies stratified their analysis on birth weight by considering the infant death effect of air pollution exposure separately among the low and normal birth weight [21,27], or among preterm and normal term birth [25]. Two other studies combined birth weight and gestational age including only births beyond 44 weeks of gestation [13] or between weeks 37 and 44 [27].
4.3. Exposure Assessment
Different approaches for exposure assessment were implemented, and this may induce misclassification of exposure. Most of the studies used air pollution data from monitoring stations as a proxy for individual exposure. The main advantages of these databases relate to their easy accessibility and availability. However, their use presents several limitations, particularly when the objective is to quantify individual levels of exposure and investigate the health consequences of exposure.
The first of these limitations is related to the method used to convert concentration measures from monitoring stations to individual exposure: most of the studies either averaged air pollution concentrations from all monitoring stations covering the study area or selected a sub-sample of monitoring stations—just one, perhaps the one the closest to the dwelling [9,18,21,22,27,28,29,30]—while in others, no detail was given at all [8,12,13,14,19,20]. Many studies developed a methodology for identifying the nearest monitoring stations, then estimated the exposure level of the pregnant women [10,15,16,17,26]. For instance, one study defined the closest monitors at the zip/post code scale [17], whereas another quantified the maximum distance from the maternal dwelling to the monitoring station [16]. One study extended this procedure by using the inverse of the distance to nearby stations to weight measurement of the pollution estimate for each of the 56 municipalities in Mexico City [10]. In 2016, Yorifuji et al. considered air pollution data measured at a monitoring station located about 12 km from the central point of the ward’s spatial scale [26]. Another study combined identification of the nearest air monitoring station with the geographic features and wind flow patterns of the zip/post code at place of birth [15] (see Table 2). In addition, both the number of monitoring stations and the size of the study area vary between studies and this may increase the level of heterogeneity of air pollution measurement between studies. To be precise, the number of monitoring stations varied between a minimum of 5 [18] and a maximum of 27 [27,28]. There is also a risk that a small number of monitoring stations covering a large area may limit spatial representativeness of exposure, which may in turn introduce bias in assessment of the residential exposure of pregnant women. A further limitation comes from missing residential postal addresses; in such cases, the spatial unit chosen by the authors ranged from post-code level [22] to country level [27,28]. Misclassifications of exposure may result from the spatial unit used, with the largest spatial scale being less appropriate for the capture of fine spatial dispersion of air pollution concentrations.
Although data from monitoring stations is based on both national air quality requirements and guidelines and legislation that are compliant with approved methods [33], environmental modeling approaches now provide a higher level of spatial precision in exposure estimates than approaches based on routine monitoring station data. In our systematic review, two French studies used atmospheric dispersion modelling to estimate annual average NO2 at a census block level (9, 4), which was recognized as appropriate for the capture of spatial variabilities of air pollution. In 2011, Scheers et al. used a land use regression model to interpolate PM10 concentrations at a municipality level [25] (see Table 2). Only one study used satellite-based measurements of annual average PM2.5 concentrations at country level [32] (see Table 3). Environmental modelling is relatively cumbersome, labour-intensive, and computer-intensive, and also requires extensive data input; however, it is still held up as the gold standard for environmental and health impact assessment.
Lastly, regardless of which approach is chosen, exposure misclassification can also occur following changes in residential place during pregnancy. In general, studies are unable to take this limitation into account due to a lack of information about the residential mobility of pregnant women. However, residential mobility among pregnant women is not insignificant; in 2012, Bell et al. showed that the percentage of women who moved house during pregnancy ranged from 9% to 32%, with a median of 20% [34]. In addition to this residential mobility, it is even more difficult to estimate the daily mobility of pregnant women across the study area. No study included in the systematic review considered this important parameter, although some studies did suggest that pregnant women’s everyday mobility across the city would increase daily exposure [35].
The choice of pollutant used to describe exposure to air pollution is also crucial. Among the studies of our systematic review, few estimated possible multi-pollutant health effects [13,15,19,20]. Yet the fact that the health consequences of pollutant exposure does not result from a single pollutant is already well established; every day, everywhere, we are exposed to a cocktail of pollutants (including both indoor and outdoor air pollution) and new methodological developments are required in order to consider this issue and overcome method limitations.
4.4. Critical Windows of Exposure
Exposure misclassifications also depend on the definition of window of exposure. In our systematic review, two main approaches define the window of exposure in order to investigate the relationship between residential exposure and infant deaths: (i) short-term exposure (≤2 weeks) and (ii) long-term exposure (>2 weeks).
Even if we separately analyzed the effects of short- or long-term exposure, exposure heterogeneity may result from the various indicators implemented to measure the level of exposure. For instance, different indicators defining the daily exposure were identified: the day of the death (Lag0) [8,20,25,26,31], the day before death (Lag1) [8,18,22], or longer lags such as from lag 1 to lag 3 [18,22,25] or from lag 1 to lag 6 [22] (see Table 3). The studies that investigated short-term cumulative exposure also examined different windows of exposure including over 2 days (Lag0–2) [9,18,22,29,30], 3 days (Lag0–3) [8,12,17,18,19,25], 4 days (Lag0–4) [26], 6 days (Lag 0–6) [22], or over 7 days before death (Lag 0–7) [17]. More specific windows of exposure were also examined by Lin et al.; they considered exposure from two to seven days before death (Lag 2–7) [20]. Only one study focused on longer periods of exposure: 2 weeks before death [15] (see Table 3).
Regarding long-term exposure, two types of windows of exposure were identified (i) exposure during pregnancy and (ii) exposure of the newborn. In both cases, their exposure measures were based on cumulative exposure during a given period. During pregnancy, the studies measured exposure by trimester or during the entire period of pregnancy [27,32]. After birth, different windows of exposure were investigated including: the first month of life [15,17], the first 2 months before death [13,14,15], or the 6 months before death [15]. Larger windows of exposure were also examined—for instance, exposure during the first year of a newborn’s life [16,17,27,32] (see Table 3). Several other studies did not focus on a particular window of exposure and measured the annual average of pollutant concentrations at the residential place as a proxy of newborn exposure [21,23,24] (see Table 3).
4.5. Assessment of the Relation between Air Ambient Pollution and Infant Mortality
Our findings have to be interpreted with caution due to weaknesses that could affect the strength of the associations and then the formulation of accurate conclusions. In particular, the various confounding factors and the different sample size may lead to difficult between studies comparisons. Indeed, several studies adjusted for only meteorological characteristics (e.g., temperature, humidity, and seasonality) [28,29,30,31]. Some studies did not use any covariates [23,24,32], while others adjusted other studies adjusted on both baby and mother characteristics (maternal age, education, and marital status) and less often, on neighborhood characteristics, such as neighborhood socio-economic status [13,14,16,17,21,27].
Because of the lack of available information on dietary factors (such as folic acid supplementation, folic acid and vitamin intake during pregnancy), no study has adjusted risk estimates for these variables. An absence of systematic adjustment on common known confounders may affect the measure of association and thus, the comparison of all the risk estimates.
In addition, as any epidemiological study, the sample size may affect the statistical power: the higher the sample size, the higher the statistical power. Thus, in our study, we included studies with small sample sizes that provided imprecise estimates [36].
The features of the studies described above—such as study population, study design, sample size, the classification and definition of infant death, exposure assessment, and confounding factors—could all, independently or in combination, affect the quality of each study itself and, also, their comparison in our systematic review.
4.6. Strengths and Limitations
In addition to the limitations listed above, both our systematic review and our meta-analysis, like all studies, present their own strengths and limitations. Firstly, our work may suffer from study selection biases. Non-English publications of relevant articles may have been ignored. In addition, we cannot rule out the possibility that our systematic review, like most, could be impacted by publication bias. Indeed, unpublished results (including, in particular, results not statistically significant and grey literature, which is not available on open sources) may distort our meta-analysis findings towards the statistical significance of the risk estimates.
Also, the global level of air pollution in each country was not taken into account in our studies comparison, while we know that differences exist between countries. Thus, the health effect of a 10 µg/m3 increase in a pollutant could be measured in an area with a globally low level of air pollution or in an area with a high level. However, we had too few studies in our systematic review to stratify our analysis on the global level of air pollution. For similar reasons, it was not possible to perform a dose-response function analysis due to the low number of studies and the heterogeneity between them.
However, our review could form the basis for future research. Our systematic review was based on a large number of original studies and our meta-analysis presented six combinations of air pollutants and outcomes. We also detailed several sources of variability which may partially explain the observed measures of association. Future studies could be based on this analysis of limitations of the current body of research, which may provide inspiration for research agenda improvements.
4.7. Public Health Implication
Scientific works have been providing evidence of the health consequences of pollutants for a long time now. An increasing number of studies are now addressing the question of which policy strategies are needed to reduce exposure to environmental pollutants very early in life, before birth and sometimes also a few months before conception. Alongside this, attention on health impact assessment of air pollution has been on the rise in recent decades. The WHO recommends its use for both quantitative estimation of the current health effects attributable to air pollution and as a source of further evidence for public health action. According to the WHO, “health impact assessment (HIA) is a practical approach used to judge the potential health effects of a policy, programme or project on a population, particularly on vulnerable or disadvantaged groups” [37]. HIAs estimate the expected public health impact in the event that air pollution levels change to a given extent [38]. A crucial indicator required for quantification of the health burden of air pollution is the dose-response function, which is obtained from meta-analysis. This function indicates the expected change, on average, in a given outcome per unit change of pollutant. Our meta-analysis results provide pooled-risk for 6 combinations of air pollutants and infant death, which may provide the first step of the HIA. Because an HIA can estimate the human health impacts of current policy or implemented actions, it can become a useful tool for both policymakers and planners.
Supplementary Materials
The following are available online at https://www.mdpi.com/1660-4601/17/8/2623/s1, Figure S1: funel plot, Table S1: Definitions of Infant mortality outcomes and studied population (order by outcome), Table S2: Definitions of Infant mortality outcomes and measures of association for meta-analysis, Table S3: Sensitivity analysis, Table S4: Characteristics of the included studies in meta-analysis: the scores for each criterion and the quality index, S1: Text. Quality effect model methods.
Author Contributions
Conceptualization, W.K.-T., G.P.M. and S.D.; methodology, W.K.-T., G.P.M. and S.D.; software, W.K.-T., G.P.M. and S.D.; validation, W.K.-T. and S.D.; formal analysis, W.K.-T., G.P.M. and S.D.; investigation, W.K.-T., G.P.M. and S.D.; resources, W.K.-T. and S.D.; data curation, W.K.-T. and S.D.; writing—original draft preparation, W.K.-T., G.P.M. and S.D.; writing—review and editing, W.K.-T. and S.D.; visualization, W.K.-T., G.P.M. and S.D.; supervision, W.K.-T. and S.D.; project administration, W.K.-T. and S.D.; funding acquisition, W.K.-T. and S.D. All authors have read and agreed to the published version of the manuscript.
Funding
This research was funded by Institute for Research in Public Health (Institut de Recherche en santé publique, IReSP), grant number 18II068-00.
Acknowledgments
This work is supported by the Institute for Research in Public Health (Institut de Recherche en santé publique, IReSP).
Conflicts of Interest
The authors declare that they have no actual or potential competing financial interests.
References
- WHO. Environmental Health in the Sustainable Development Goals: Preventing Disease through Actions across the SDG Spectrum. Available online: http://www.who.int/sustainable-development/sdg-briefs/en/ (accessed on 9 March 2020).
- OECD. The Cost of Air Pollution | READ Online. Available online: https://read.oecd-ilibrary.org/environment/the-cost-of-air-pollution_9789264210448-en (accessed on 6 February 2020).
- WHO. WHO | Ambient Air Quality. Available online: http://www.who.int/phe/health_topics/outdoorair/en/ (accessed on 6 February 2020).
- Stieb, D.M.; Chen, L.; Eshoul, M.; Judek, S. Ambient air pollution, birth weight and preterm birth: A systematic review and meta-analysis. Environ. Res. 2012, 117, 100–111. [Google Scholar] [CrossRef] [PubMed]
- Klepac, P.; Locatelli, I.; Korošec, S.; Künzli, N.; Kukec, A. Ambient air pollution and pregnancy outcomes: A comprehensive review and identification of environmental public health challenges. Environ. Res. 2018, 167, 144–159. [Google Scholar] [CrossRef] [PubMed]
- Ostro, B.; World Health Organization. Outdoor Air Pollution: Assessing the Environmental Burden of Disease at National and Local Levels; World Health Organization: Geneva, Switzerland, 2004; ISBN 978-92-4-159146-1. [Google Scholar]
- Glinianaia, S.V.; Rankin, J.; Bell, R.; Pless-Mulloli, T.; Howel, D. Does particulate air pollution contribute to infant death? A systematic review. Environ. Health Perspect. 2004, 112, 1365–1371. [Google Scholar] [CrossRef] [PubMed]
- Carbajal-Arroyo, L.; Miranda-Soberanis, V.; Medina-Ramón, M.; Rojas-Bracho, L.; Tzintzun, G.; Solís-Gutiérrez, P.; Méndez-Ramírez, I.; Hurtado-Díaz, M.; Schwartz, J.; Romieu, I. Effect of PM10 and O3 on infant mortality among residents in the Mexico City Metropolitan Area: A case-crossover analysis, 1997–2005. J. Epidemiol. Community Health 2011, 65, 715–721. [Google Scholar] [CrossRef]
- Hajat, S.; Armstrong, B.; Wilkinson, P.; Busby, A.; Dolk, H. Outdoor air pollution and infant mortality: Analysis of daily time-series data in 10 English cities. J. Epidemiol. Community Health 2007, 61, 719–722. [Google Scholar] [CrossRef]
- Arceo, E.; Hanna, R.; Oliva, P. Does the Effect of Pollution on Infant Mortality Differ Between Developing and Developed Countries? Evidence from Mexico City. Econ. J. 2016, 126, 257–280. [Google Scholar] [CrossRef]
- Liberati, A.; Altman, D.G.; Tetzlaff, J.; Mulrow, C.; Gøtzsche, P.C.; Ioannidis, J.P.A.; Clarke, M.; Devereaux, P.J.; Kleijnen, J.; Moher, D. The PRISMA statement for reporting systematic reviews and meta-analyses of studies that evaluate healthcare interventions: Explanation and elaboration. BMJ 2009. [Google Scholar] [CrossRef]
- Gouveia, N.; Junger, W.L.; ESCALA investigators. Effects of air pollution on infant and children respiratory mortality in four large Latin-American cities. Environ. Pollut. Barking Essex 1987 2018, 232, 385–391. [Google Scholar] [CrossRef]
- Woodruff, T.J.; Darrow, L.A.; Parker, J.D. Air pollution and postneonatal infant mortality in the United States, 1999–2002. Environ. Health Perspect. 2008, 116, 110–115. [Google Scholar] [CrossRef]
- Darrow, L.A.; Woodruff, T.J.; Parker, J.D. Maternal smoking as a confounder in studies of air pollution and infant mortality. Epidemiol. Camb. Mass 2006, 17, 592–593. [Google Scholar] [CrossRef]
- Ritz, B.; Wilhelm, M.; Zhao, Y. Air pollution and infant death in southern California, 1989–2000. Pediatrics 2006, 118, 493–502. [Google Scholar] [CrossRef] [PubMed]
- Woodruff, T.J.; Parker, J.D.; Schoendorf, K.C. Fine particulate matter (PM2.5) air pollution and selected causes of postneonatal infant mortality in California. Environ. Health Perspect. 2006, 114, 786–790. [Google Scholar] [CrossRef] [PubMed]
- Klonoff-Cohen, H.; Lam, P.K.; Lewis, A. Outdoor carbon monoxide, nitrogen dioxide, and sudden infant death syndrome. Arch. Dis. Child. 2005, 90, 750–753. [Google Scholar] [CrossRef] [PubMed]
- Romieu, I.; Ramírez-Aguilar, M.; Moreno-Macias, H.; Barraza-Villarreal, A.; Miller, P.; Hernández-Cadena, L.; Carbajal-Arroyo, L.A.; Hernandez-Avila, M. Infant mortality and air pollution: Modifying effect by social class. J. Occup. Environ. Med. 2004, 46, 1210–1216. [Google Scholar] [PubMed]
- Dales, R.; Burnett, R.T.; Smith-Doiron, M.; Stieb, D.M.; Brook, J.R. Air pollution and sudden infant death syndrome. Pediatrics 2004, 113, e628–e631. [Google Scholar] [CrossRef]
- Lin, C.A.; Pereira, L.A.A.; Nishioka, D.C.; Conceição, G.M.S.; Braga, A.L.F.; Saldiva, P.H.N. Air pollution and neonatal deaths in São Paulo, Brazil. Braz. J. Med. Biol. Res. Rev. 2004, 37, 765–770. [Google Scholar] [CrossRef]
- Lipfert, F.W.; Zhang, J.; Wyzga, R.E. Infant mortality and air pollution: A comprehensive analysis of U.S. data for 1990. J. Air Waste Manag. Assoc. 1995 2000, 50, 1350–1366. [Google Scholar] [CrossRef]
- Litchfield, I.J.; Ayres, J.G.; Jaakkola, J.J.K.; Mohammed, N.I. Is ambient air pollution associated with onset of sudden infant death syndrome: A case-crossover study in the UK. BMJ Open 2018, 8, e018341. [Google Scholar]
- Padilla, C.M.; Kihal-Talantikit, W.; Vieira, V.M.; Deguen, S. City-Specific Spatiotemporal Infant and Neonatal Mortality Clusters: Links with Socioeconomic and Air Pollution Spatial Patterns in France. Int. J. Environ. Res. Public. Health 2016, 13, 624. [Google Scholar] [CrossRef]
- Padilla, C.M.; Deguen, S.; Lalloue, B.; Blanchard, O.; Beaugard, C.; Troude, F.; Navier, D.Z.; Vieira, V.M. Cluster analysis of social and environment inequalities of infant mortality. A spatial study in small areas revealed by local disease mapping in France. Sci. Total Environ. 2013, 454–455, 433–441. [Google Scholar] [CrossRef]
- Scheers, H.; Mwalili, S.M.; Faes, C.; Fierens, F.; Nemery, B.; Nawrot, T.S. Does air pollution trigger infant mortality in Western Europe? A case-crossover study. Environ. Health Perspect. 2011, 119, 1017–1022. [Google Scholar] [CrossRef] [PubMed]
- Yorifuji, T.; Kashima, S.; Doi, H. Acute exposure to fine and coarse particulate matter and infant mortality in Tokyo, Japan (2002–2013). Sci. Total Environ. 2016, 551–552, 66–72. [Google Scholar] [CrossRef] [PubMed]
- Son, J.-Y.; Bell, M.L.; Lee, J.-T. Survival analysis of long-term exposure to different sizes of airborne particulate matter and risk of infant mortality using a birth cohort in Seoul, Korea. Environ. Health Perspect. 2011, 119, 725–730. [Google Scholar] [CrossRef] [PubMed]
- Son, J.-Y.; Cho, Y.-S.; Lee, J.-T. Effects of air pollution on postneonatal infant mortality among firstborn infants in Seoul, Korea: Case-crossover and time-series analyses. Arch. Environ. Occup. Health 2008, 63, 108–113. [Google Scholar] [CrossRef] [PubMed]
- Yang, C.-Y.; Hsieh, H.-J.; Tsai, S.-S.; Wu, T.-N.; Chiu, H.-F. Correlation between air pollution and postneonatal mortality in a subtropical city: Taipei, Taiwan. J. Toxicol. Environ. Health A 2006, 69, 2033–2040. [Google Scholar] [CrossRef] [PubMed]
- Tsai, S.-S.; Chen, C.-C.; Hsieh, H.-J.; Chang, C.-C.; Yang, C.-Y. Air pollution and postneonatal mortality in a tropical city: Kaohsiung, Taiwan. Inhal. Toxicol. 2006, 18, 185–189. [Google Scholar] [CrossRef]
- Ha, E.-H.; Lee, J.-T.; Kim, H.; Hong, Y.-C.; Lee, B.-E.; Park, H.-S.; Christiani, D.C. Infant susceptibility of mortality to air pollution in Seoul, South Korea. Pediatrics 2003, 111, 284–290. [Google Scholar] [CrossRef]
- Heft-Neal, S.; Burney, J.; Bendavid, E.; Burke, M. Robust relationship between air quality and infant mortality in Africa. Nature 2018, 559, 254–258. [Google Scholar] [CrossRef]
- WHO. Ambient (Outdoor) Air Quality and Health. Fact Sheet. 2016. Available online: https://www.who.int/news-room/fact-sheets/detail/ambient-(outdoor)-air-quality-and-health (accessed on 8 February 2020).
- Bell, M.L.; Belanger, K. Review of research on residential mobility during pregnancy: Consequences for assessment of prenatal environmental exposures. J. Expo. Sci. Environ. Epidemiol. 2012, 22, 429–438. [Google Scholar] [CrossRef]
- Shekarrizfard, M.; Faghih-Imani, A.; Hatzopoulou, M. An examination of population exposure to traffic related air pollution: Comparing spatially and temporally resolved estimates against long-term average exposures at the home location. Environ. Res. 2016, 147, 435–444. [Google Scholar] [CrossRef]
- Hajian-Tilaki, K. Sample size estimation in epidemiologic studies. Casp. J. Intern. Med. 2011, 2, 289–298. [Google Scholar]
- WHO Health Impact Assessment (HIA). 2010. Available online: http://www.who.int/hia/en/ (accessed on 8 February 2020).
- Malmqvist, E.; Oudin, A.; Pascal, M.; Medina, S. Choices Behind Numbers: A Review of the Major Air Pollution Health Impact Assessments in Europe. Curr. Environ. Health Rep. 2018, 5, 34–43. [Google Scholar] [CrossRef] [PubMed]
© 2020 by the authors. Licensee MDPI, Basel, Switzerland. This article is an open access article distributed under the terms and conditions of the Creative Commons Attribution (CC BY) license (http://creativecommons.org/licenses/by/4.0/).