The Relationship between Under-Nutrition and Hypertension among Ellisras Children and Adolescents Aged 9 to 17 Years


Abstract
1. Introduction
2. Materials and Methods
2.1. Geographical Area
2.2. Study Population and Sampling
2.3. Ethical Clearance
2.4. Anthropometric Measurements
- Total upper arm area (TUAA) = C2/4 × π);C is the MUAC;
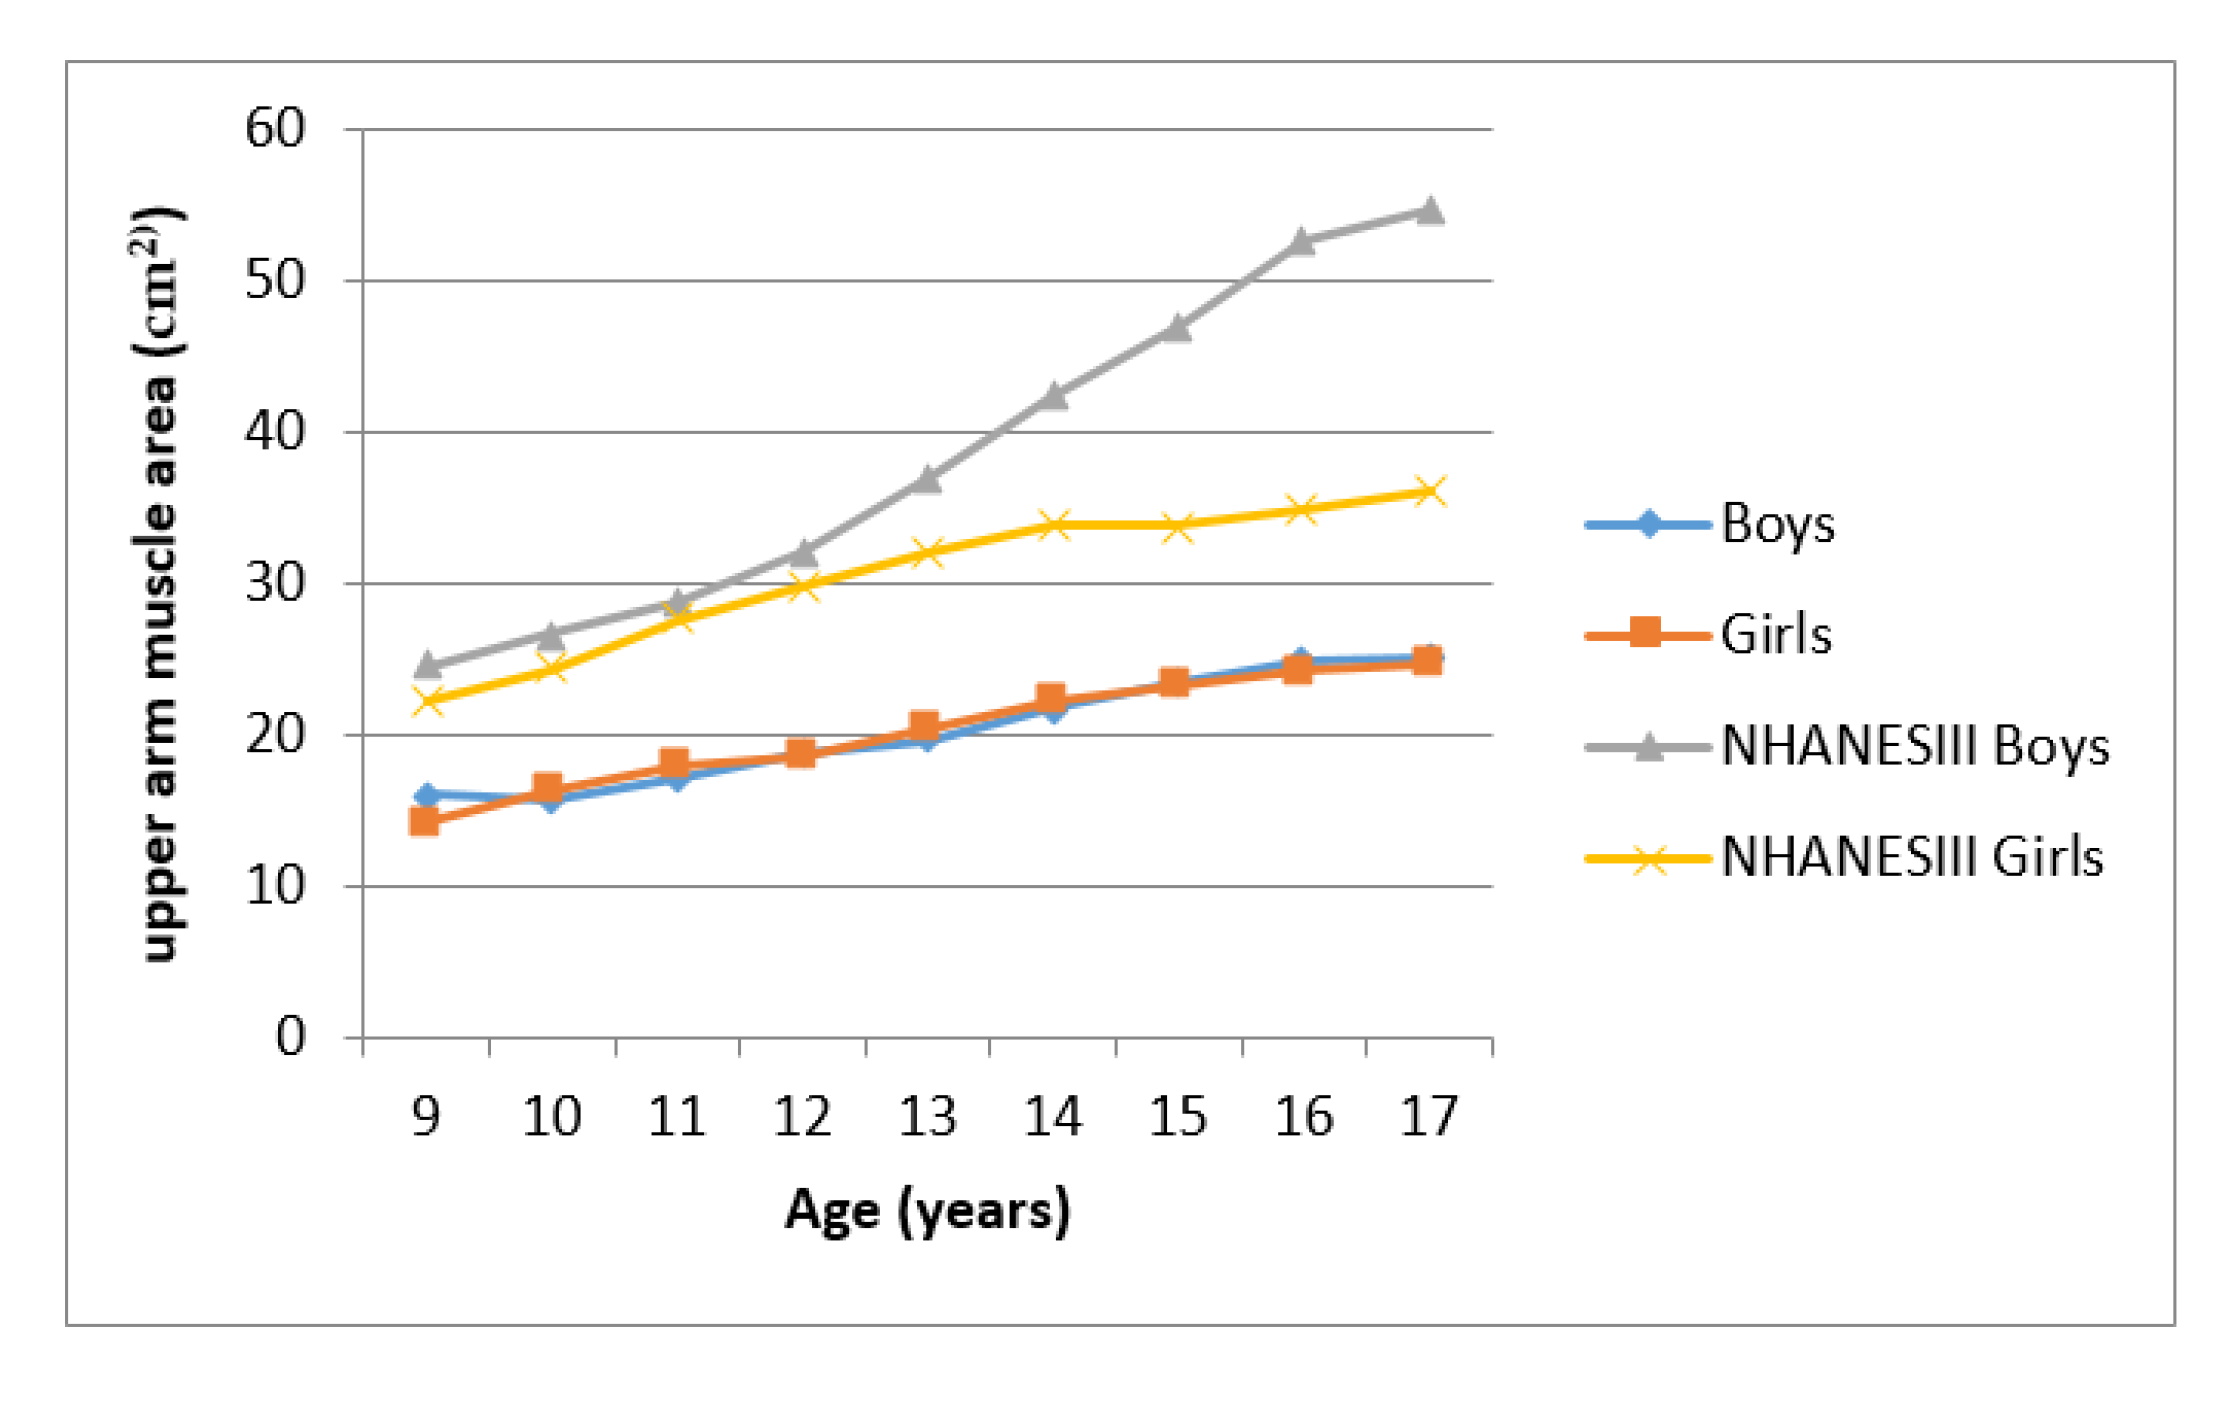
- Upper arm muscle area (UMA) = [C−(Ts × π)]2/(4 × π);C is MUAC and Ts is the triceps skinfold;
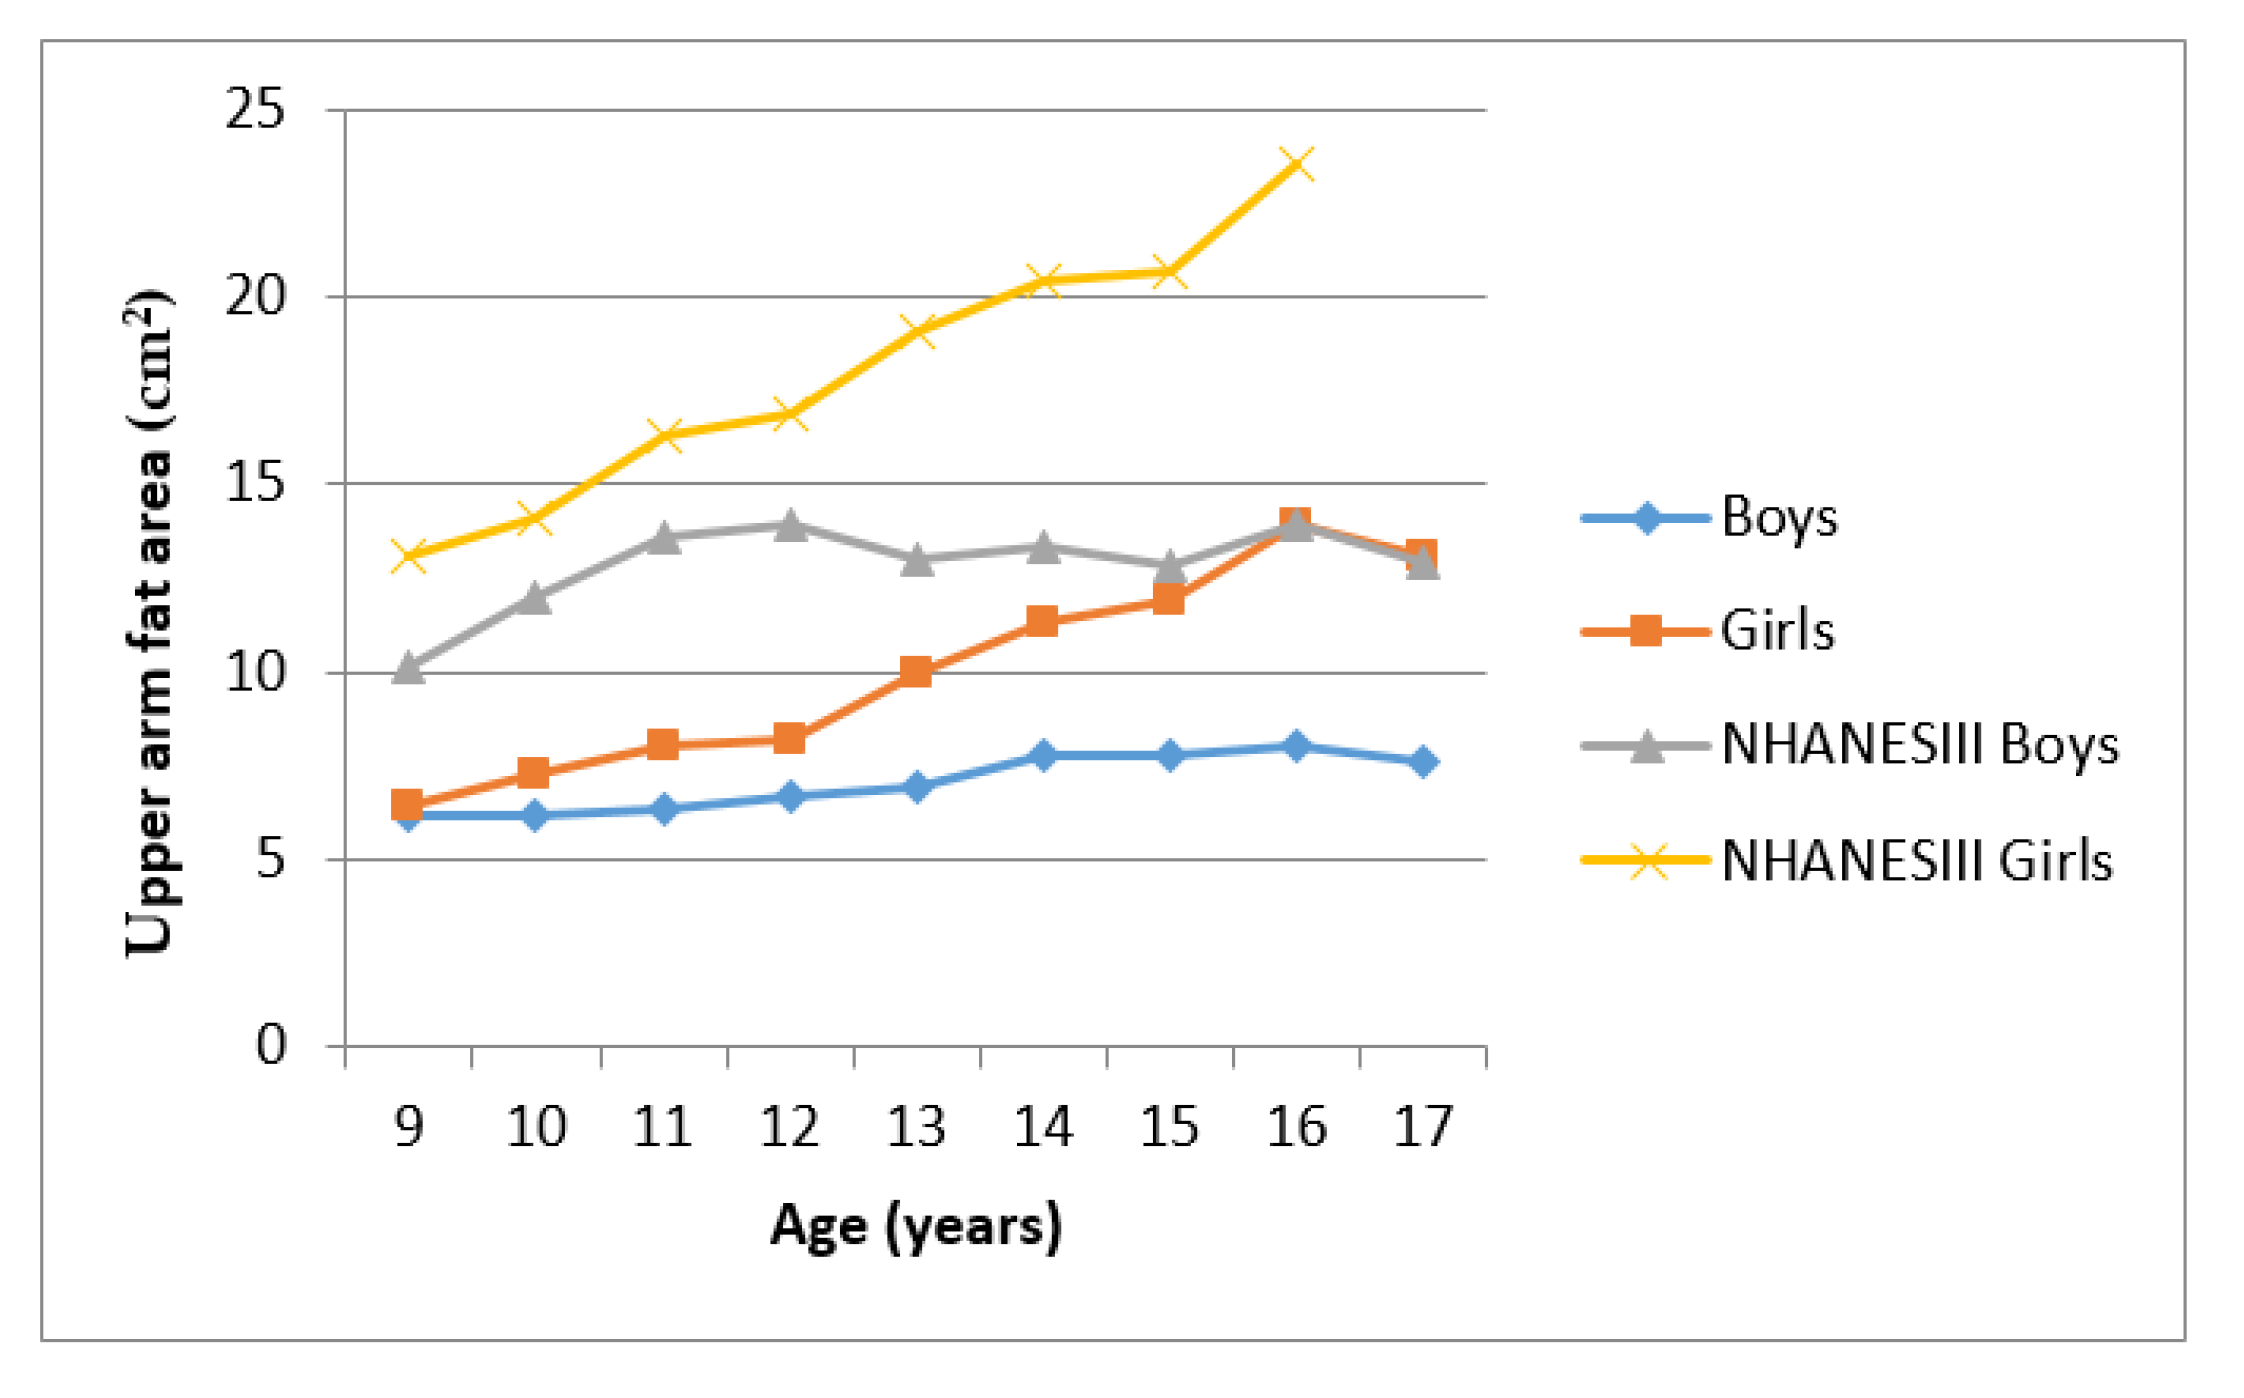
- Upper arm fat area (UFA) = TTUA−UMA.
2.5. Blood Pressure (BP)
2.6. Quality Control
2.7. Statistical Analysis
3. Results
4. Discussion
5. Conclusions
Author Contributions
Funding
Acknowledgments
Conflicts of Interest
References
- World Health Organization. Guideline: Updates on the Management of Severe Acute Malnutrition in Infants and Children; World Health Organization: Geneva, Switzerland, 2013.
- Sawaya, A.L.; Sesso, R.; Florêncio, T.M.; Fernandes, M.T.; Martins, P.A. Association between chronic undernutrition and hypertension. Matern. Child Nutr. 2005, 1, 155–163. [Google Scholar] [CrossRef] [PubMed]
- Addo, Y.O.; Himes, J.H.; Zemel, B.S. Reference ranges for midupper arm circumference, upper arm muscle area, and upper arm fat area in US children and adolescents aged 1–20 y. Am. J. Clin. Nutr. 2017, 105, 111–120. [Google Scholar] [CrossRef] [PubMed]
- National High Blood Pressure Education Programme Working Group on Hypertension Control in Children and Adolescents. Task Force Report on High Blood Pressure in Children and Adolescents: A working group report from the National High Blood Pressure Programme. Paediatrics 1996, 98, 649–658. [Google Scholar]
- Labadarios, D.; Steyn, N.P.; Maunder, E.; MacIntyre, U.; Swart, R.; Gericke, G.; Huskisson, J.; Dannhauser, A.; Voster, H.H.; Nesmvuni, A.E. The National Food Consumption Survey: Children Aged 1–9 Years, South Africa, 1999; Department of Health: Pretoria, South Africa, 2000; pp. 23–152.
- Steyn, N.P.; Labadarios, D.; Maunder, E.; Nel, J.; Lombard, C.; Directors of the National Food Consumption Survey. Secondary anthropometric data analysis of the national food consumption survey in South Africa: The double burden. Nutrition 2005, 21, 4–13. [Google Scholar] [CrossRef]
- Department of Health. South African Demographic and Health Survey 2003; Preliminary Report; Department of Health: Pretoria, South Africa, 2004; pp. 134–206.
- Frisancho, A.R. Anthropometric Standards for the Assessment of Growth and Nutritional Status; The University of Michigan Press: Ann Arbor, MI, USA, 1990; pp. 39–40. [Google Scholar]
- Gibson, R.S. Principles of Nutritional Assessment; Oxford University Press: Oxford, UK, 1990. [Google Scholar]
- Monyeki, K.D.; Cameron, N.; Getz, B. Growth and nutritional status of rural South African children 3–10 years old: The Ellisras growth study. Am. J. Hum. Biol. 2000, 12, 42–49. [Google Scholar] [CrossRef]
- Cameron, N. The monitoring of growth and nutritional status in South Africa. Am. J. Hum. Biol. 1992, 4, 223–234. [Google Scholar] [CrossRef]
- Bin, D.; Jun, M.A.; Jun, W.H.; Qiang, W.Z. The Association of Overweight and Obesity with Blood Pressure among Chinese Children and Adolescents. Biomed. Environ. Sci. 2013, 26, 437–444. [Google Scholar]
- Somova, L.I.; Moodley, K. The effect of proteinenergy malnutrition on development of hypertension, glucose metabolism and insulin sensitivity in genetically hypertensive rats. Nutr. Metab. Cardio Dis. 2000, 10, 188–194. [Google Scholar]
- Sesso, R.; Barreto, G.P.; Neves, J.; Sawaya, A.L. Malnutrition is associated with increased blood pressure in childhood. N. Clin. Practic. 2004, 97, 61–66. [Google Scholar] [CrossRef]
- Yoshida, W.B.; Muller, S.S.; Carvalho, I.; Fabris, V.E.; Naresse, L.E.; Maffei, F.H. Tensile strength and histological changes of abdominal aorta of malnourished rats. Cardio Surg 1995, 3, 437–439. [Google Scholar] [CrossRef]
- Okop, K.J.; Levitt, N.; Puoane, T. Weight underestimation and body size dissatisfaction among black African adults with obesity: Implications for health promotion. Afr. J. Prim Health Care Fam. Med. 2019, 11, e1–e8. [Google Scholar] [CrossRef] [PubMed]
- Hingorjo, M.R.; Qureshi, M.A.; Mehdi, A. Neck circumference as a useful marker of obesity: A comparison with body mass index and waist circumference. J. Pak Med. Assoc. 2012, 62, 36–40. [Google Scholar] [PubMed]
- Zhou, J.Y.; Ge, H.; Zhuet, M.F. Neck circumference as an independent predictive contributor to cardio-metabolic syndrome. Cardiovasc Diabetol. 2013, 12, 76. [Google Scholar] [CrossRef] [PubMed]
- Kruger, H.S.; Faber, M.; Schutter, A.E.; Ellis, S.M. A proposed cut-off point of waist-to-height ratio for metabolic risk in African township adolescents. Nutrition 2013, 29, 502–507. [Google Scholar] [CrossRef]
- Monyeki, K.D.; Monyeki, M.A.; Brits, S.J.; Kemper, H.C.; Makgae, P.J. Development and tracking of body mass index from preschool age into adolescence in rural South African children: Ellisras Longitudinal Growth and Health Study. J. Health Popul. Nutr. 2008, 26, 405–417. [Google Scholar] [CrossRef]
- Monyeki, K.; Kemper, H.; Mogale, A.; Hay, L.; Sekgala, M.; Mashiane, T.; Monyeki, S.; Sebati, B. Association between Blood Pressure and Birth Weight among Rural South African Children: Ellisras Longitudinal Study. Int. J. Environ. Res. Public Health 2017, 14, 974. [Google Scholar] [CrossRef]
- Mphekgwana, P.M.; Makgopa, H.M.; Monyeki, K.D.; Malatji, J.M.; Mabila, T.E. Ellisras Longitudinal Study 2017: Childhood underweight and blood pressure status in a rural black population of South Africa (ELS 26). Cardiovasc J. Afr. 2019, 30, 146–150. [Google Scholar] [CrossRef]
- Sidiropoulos, E.; Jeffery, A.; Mackay, S.; Gallocher, R.; Forgey, H.; Chips, C. South Africa Survey 1995/1996; South African Institute of Race and Relations: Johannesburg, South Africa, 1996; pp. 234–360. [Google Scholar]
- Monyeki, K.D.; Van Lenthe, F.J.; Steyn, N.P. Obesity: Does it occur in African children in a rural community. Int. J. Epidemiol. 1999, 28, 287–292. [Google Scholar] [CrossRef]
- Monyeki, K.D.; Toriola, A.L.; de Ridder, J.H.; Kemper, H.C.; Steyn, N.P.; Nthangeni, M.E.; Twisk, J.W.; van Lenthe, F.J. Stability of somatotypes in 4 to 10 year-old rural South African girls. Ann. Hum. Biol. 2002, 29, 37–49. [Google Scholar] [CrossRef]
- Norton, K.; Olds, T. Anthropometrica; University of New South Wales Press: Sydney, Australia, 1996. [Google Scholar]
- National High Blood Pressure Education Program Working Group on High Blood Pressure in Children and Adolescents. The Fourth Report on the Diagnosis, Evaluation, and Treatment of High Blood Pressure in Children and Adolescents. Paediatrics 2004, 114, 555–576. [Google Scholar] [CrossRef]
- Monyekia, K.D.; Kemper, H.C.; Makgae, P.J. Relationship between fat patterns, physical fitness and blood pressure of rural South African children: Ellisras Longitudinal Growth and Health Study. J. Hum. Hypertens 2008, 22, 311–319. [Google Scholar] [CrossRef]
- Nembidzane, C.; Lesaoana Monyeki, K.D.; Boateng, A.; Makgae, P.J. Using the SITAR Method to Estimate Age at Peak Height Velocity of Children in Rural South Africa: Ellisras Longitudinal Study. Children 2020, 7, 17. [Google Scholar] [CrossRef]
- Cole, T.J.; Flegal, K.M.; Nicholls, D.; Jackson, A.A. Body mass index cut offs to define thinness in children and adolescents: International survey. Br. Med. J. 2007, 335, 194. [Google Scholar] [CrossRef]
- Cameron, N. Body mass index cut offs to define thinness in children and adolescents. BMJ 2007, 335, 166–167. [Google Scholar] [CrossRef]
- Altman, D.G. Practical statistics for Medical Research; Chapman & Hall: London, UK, 1991; pp. 32–88. [Google Scholar]
- IBM SPSS Statistics or earlier versions of SPSS. 2014. Available online: http://www01.ibm.com/support/docview.wss?uid=swg21476197 (accessed on 31 August 2014).
- Silva, K.S.; Silva, R.C.; Duarte, M.F.; Lopes, A.S.; Silva, F.M. Under-nutrition and obesity associated with high blood pressure in children and adolescents from João Pessoa, Paraíba, Brazil. Pediatr Cardiol. 2009, 30, 248–255. [Google Scholar] [CrossRef]
- Ma, C.M.; Li, Y.; Gao, G.Q.; Yin, F.Z.; Wang, R.; Liu, X.L.; Lu, Q. Mid-upper arm circumference as a screening measure for identifying children with hypertension. Blood Press Monit. 2015, 20, 189–193. [Google Scholar] [CrossRef]
- Mazicioğlu, M.M.; Yalcin, B.M.; Ozturk, A.; Ustunbas, H.B.; Kurtoglu, S. Anthropometric risk factors for elevated blood pressure in adolescents in Turkey aged 11–17. Pediatr Nephrol. 2010, 25, 2327–2334. [Google Scholar] [CrossRef]
- Guercio, G.; Rivarola, M.A.; Chaler, E.; Maceiras, M.; Belgorosky, A. Relationship between the growth hormone/insulin-like growth factor-I axis, insulin sensitivity and adrenal androgens in normal prepubertal and pubertal girls. J. Clin. Endocrinol. Metab. 2003, 88, 1389–1393. [Google Scholar] [CrossRef]
- Twisk, J.W.; Kemper, H.C.G.; Van Mechelen, W.; Post, G.B.; Van Lenthe, F.J. Body fatness: Longitudinal relationship of body mass index and the sum of skinfolds with other risk factors for coronary heart disease. Int. J. Obes. Relat. Metab. Disord. 1998, 22, 915–922. [Google Scholar] [CrossRef]
- Piperata, B.A. Nutritional status of Ribeirinhos in Brazil and the nutrition transition. Am. J. Phys. Anthropol. 2007, 133, 868–878. [Google Scholar] [CrossRef]
- Jaswant, S.; Nitish, M. Use of Upper-arm anthropometry as a measure of body composition and nutritional assessment in children and adolescents (6–20 years) of Assam, Northeast India. Ethiop. J. Health Sci. 2014, 24, 243–252. [Google Scholar] [CrossRef][Green Version]
- Gharib, N.; Rasheed, P. Energy and macronutrient intake and dietary pattern among school children in Bahrain: A cross-sectional study. Nutr. J. 2011, 10, 62. [Google Scholar] [CrossRef]
- Kemper, H.C.G. Amsterdam Growth and Health Longitudinal Study: A 23 Year Follow up from Teenagers to Adult about Lifestyle and Health; Karger Press: New York, NY, USA, 2004; pp. 1–20. [Google Scholar]
- Vorster, H.H.; Kruger, A. Poverty, malnutrition, underdevelopment and cardiovascular disease: A South African perspective. Cardiovasc J. Afr. 2007, 18, 321–324. [Google Scholar]
- Kruger, H.S.; Barrie, M.M.; Horster, H.H. Evidence for relatively greater subcutaneous fat deposition in stunted girls in the North-West province, South Africa as compared with non-stunted girls. Nutrition 2004, 20, 564–569. [Google Scholar] [CrossRef]
- Monyeki, K.D.; Kemper, H.C.G. Longitudinal Development and Tracking of Anthropometric Risk Indicators for Under-Nutrition of Lephalale Rural Children, South Africa: Ellisras Longitudinal Study, in Science, Technology and Innovation for Socio-Economic Development Success Stories from Africa; ICSU Regional Office for Africa: Pretoria, South Africa, 2009; pp. 41–56. [Google Scholar]
- Ciolac, E.G.; Bocchi, E.A.; Bortolotto, L.A.; Carvalho, V.O.; Greve, J.M.; Guimarães, G.V. Effects of high-intensity aerobic interval training vs. moderate exercise on hemodynamic, metabolic and neuro-humoral abnormalities of young normotensive women at high familial risk for hypertension. Hypertens Res. 2010, 33, 836–843. [Google Scholar] [CrossRef]


| Variable | Age 9–11 Years | Age 12–14 Years | Age 15–17 Years | |||||||||
|---|---|---|---|---|---|---|---|---|---|---|---|---|
| Boys | Girls | Boys | Girls | Boys | Girls | |||||||
| N = 164 | N = 147 | N = 413 | N = 392 | N = 296 | N = 289 | |||||||
| M | (sd) | M | (sd) | M | (sd) | M | (sd) | M | (sd) | M | (sd) | |
| Age (years) | 10.9 | (0.79) | 10.9 | (0.72) | 13.7 | (0.84) | 13.7 | (0.82) | 15.9 | (0.60) | 15.9 | (0.62) |
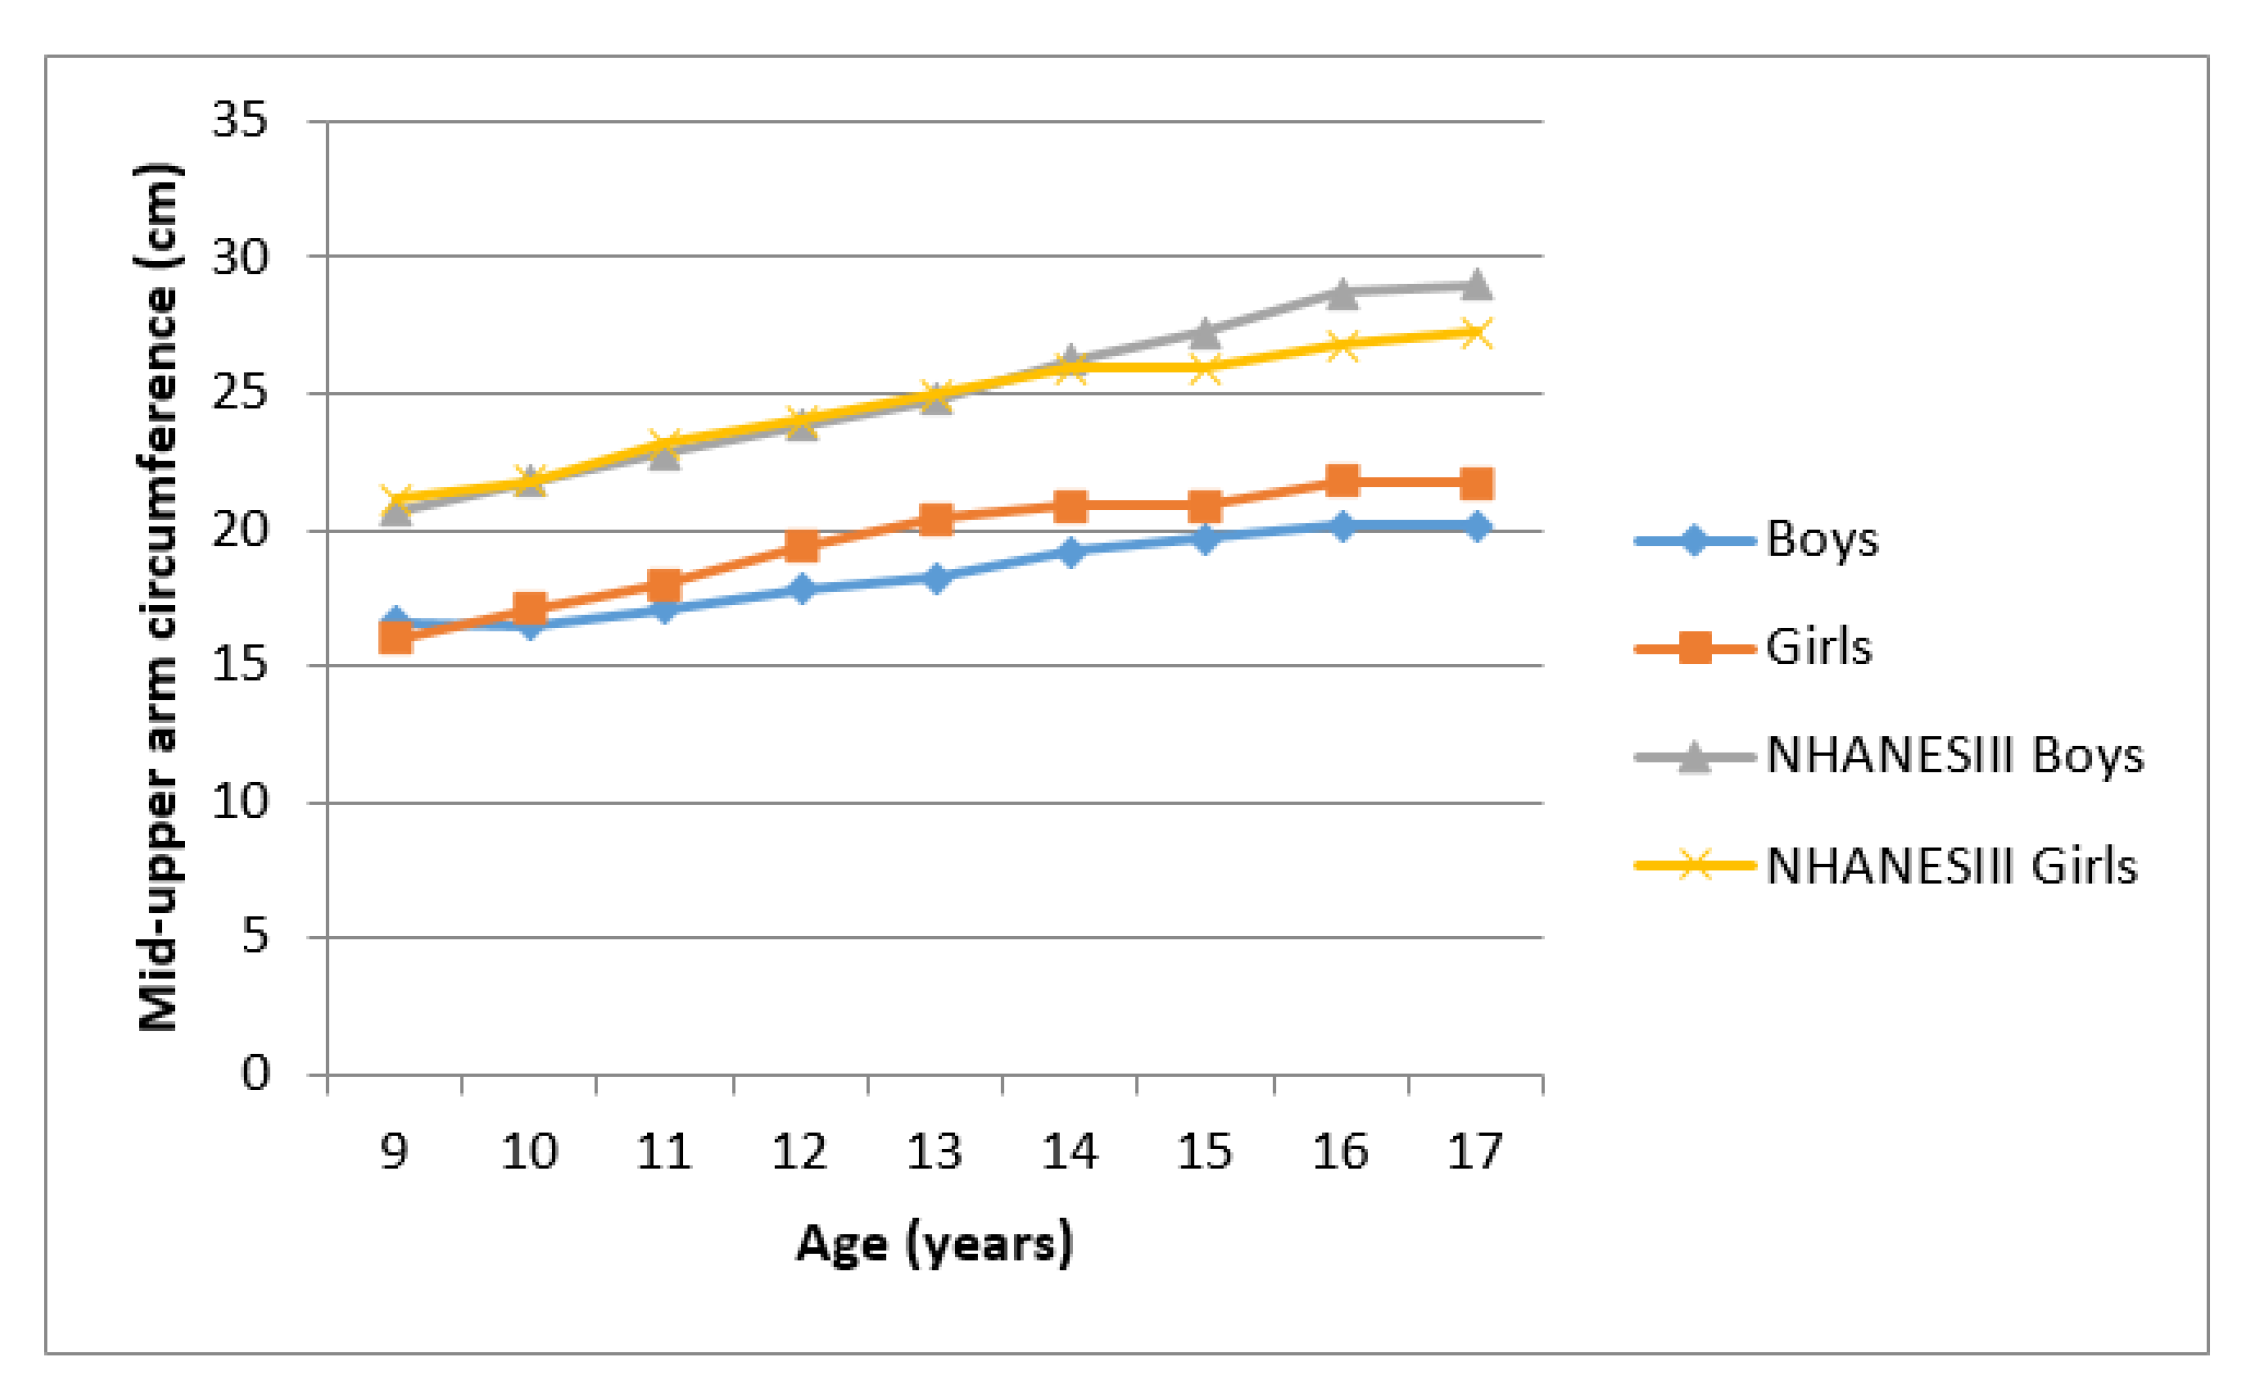
| Arm girth (cm) | 16.8 ** | (1.21) | 17.5 ** | (1.89) | 18.5 ** | (1.65) | 19.6 ** | (2.23) | 19.9 ** | (2.07) | 21.2 ** | (2.38) |
| Triceps (mm) | 7.9 ** | (1.82) | 9.4 ** | (2.74) | 8.3 ** | (2.52) | 11.2 ** | (3.97) | 8.4 ** | (2.89) | 12.9 ** | (4.72) |
| Weight (kg) | 28.7 ** | (3.99) | 30.4 ** | (6.26) | 38.1 ** | (7.03) | 41.9 ** | (8.09) | 45.6 ** | (7.91) | 48.4 ** | (7.57) |
| Height (cm) | 139.2 | (6.80) | 141 | (8.24) | 152.9 * | (8.55) | 155.1 * | (7.55) | 162.1 | (9.06) | 161.5 | (6.25) |
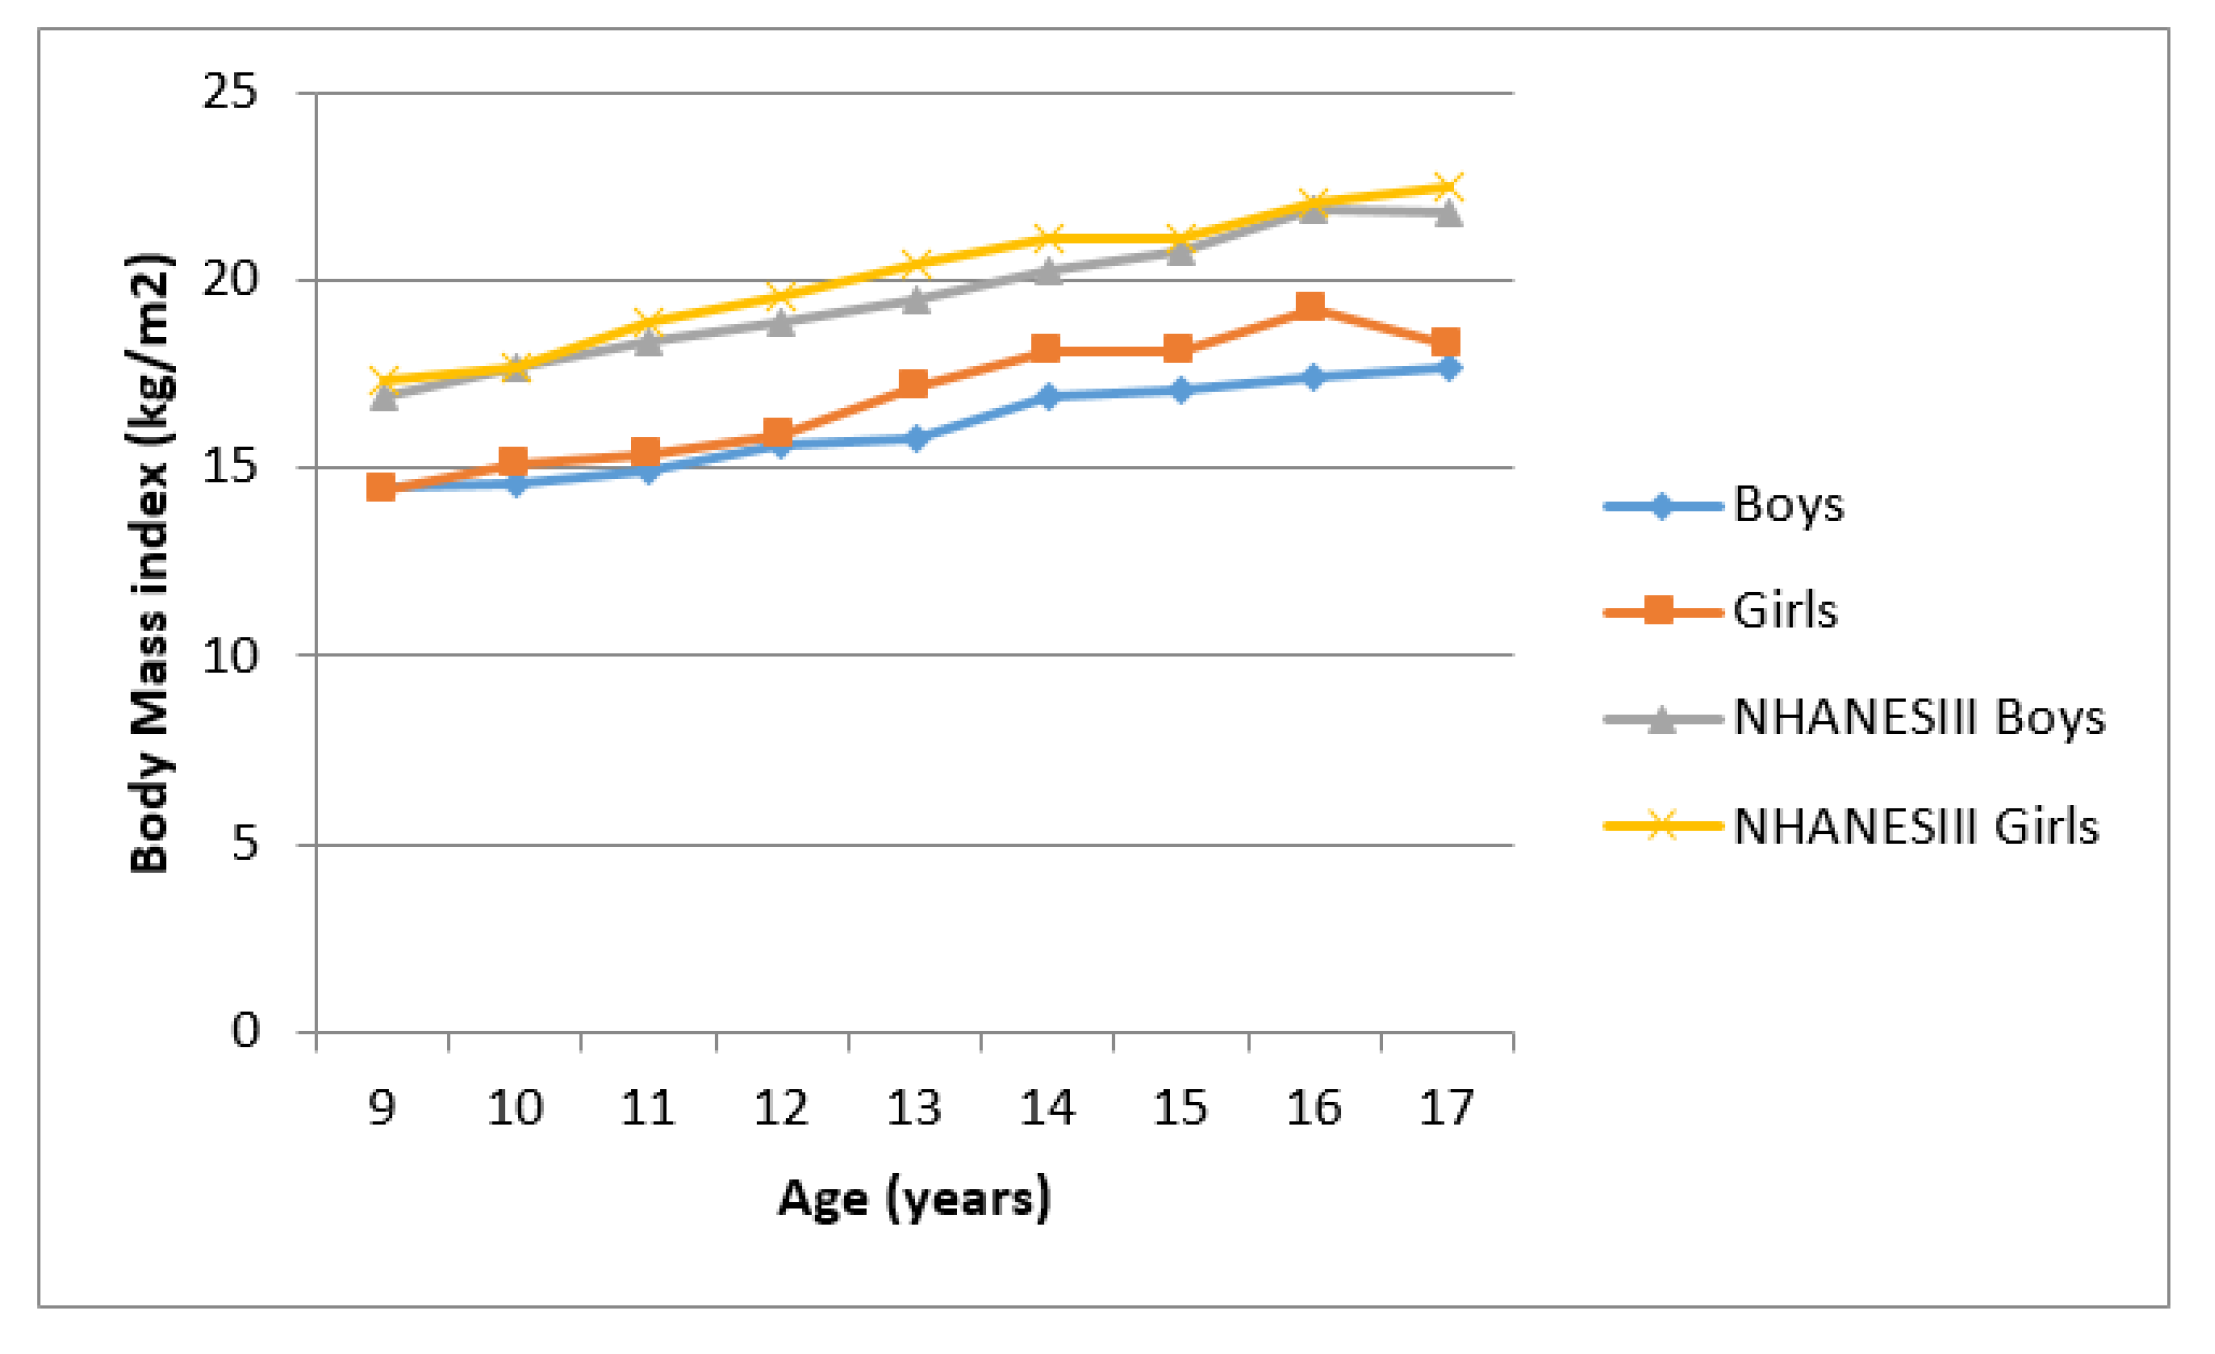
| BMI (kg/m2) | 14.7 ** | (1.25) | 15.2 ** | (1.99) | 16.2 * | (1.84) | 17.3 * | (2.46) | 17.2 * | (2.01) | 18.5 * | (2.48) |
| TUAA (cm2) | 22.6 * | (3.24) | 24.5 * | (5.47) | 27.5 ** | (5.11) | 30.9 ** | (7.35) | 31.9 ** | (6.92) | 36.2 ** | (8.54) |
| UMA (cm2) | 16.4 * | (2.49) | 16.9 * | (3.91) | 20.3 * | (3.61) | 20.7 * | (4.03) | 24.1 | (5.02) | 23.6 | (4.53) |
| UAF (cm2) | 6.19 ** | (1.59) | 7.6 ** | (2.62) | 7.2 ** | (2.64) | 10.2 ** | (4.53) | 7.9 ** | (3.38) | 12.6 ** | (5.77) |
| SBP (mmHg) | 94.2 | (12.41) | 94.1 | (11.29) | 99.8 * | (11.65) | 102.4 * | (11.89) | 107.6 * | (13.96) | 111.8 * | (12.43) |
| DBP (mmHg) | 58.2 | (9.94) | 58.5 | (8.79) | 60.5 * | (9.39) | 62.1 * | (8.98) | 61.5 * | (9.13) | 65.6 * | (9.64) |
| Prevalence | ||||||||||||
| % | (n) | % | (n) | % | (n) | % | (n) | % | (n) | % | (n) | |
| TUAA | 4.3 | (7) | 7.5 | (11) | 5.3 | (22) | 6.1 | (24) | 4.4 | (13) | 5.2 | (15) |
| UMA | 6.1 | (10) | 4.8 | (19) | 4.8 | (20) | 4.8 | (19) | 5.1 | (15) | 4.8 | (14) |
| UFA | 4.9 | (8) | 6.1 | (9) | 4.8 | (20) | 5.1 | (20) | 5.1 | (15) | 4.8 | (14) |
| TU | 56.1 * | (92) | 49.7 * | (73) | 51.6 * | (213) | 40.8 * | (160) | 53.7 * | (159) | 40.8 * | (118) |
| Mild | 38.4 * | (63) | 30.6 * | (45) | 32.4 * | (134) | 23.2 * | (91) | 13.5 * | (40) | 25.3 * | (73) |
| Moderate | 14 | (23) | 11.6 | (17) | 12.3 | (51) | 12.8 | (50) | 13.5 * | (40) | 9.3 * | (27) |
| Severe | 3.7 | (6) | 7.5 | (11) | 6.8 * | (28) | 4.8 * | (19) | 11.1 | (33) | 6.2 | (18) |
| High systolic | 3.7 | (6) | 4.1 | (6) | 6.3 | (26) | 7.9 | (31) | 12.5 | (37) | 15.2 | (44) |
| HD | 9.1 | (15) | 6.8 | (10) | 6.1 | (25) | 7.7 | (30) | 5.7 | (17) | 12.8 | (37) |
| Hypertension | 2.4 | (4) | 3.4 | (5) | 2.4 | (10) | 2.8 | (11) | 2.0 | (6) | 5.5 | (16) |
| Variables | Unadjusted | Adjusted for Age and Gender | ||||||
|---|---|---|---|---|---|---|---|---|
| β | p-Value | 95% CI | β | p-Value | 95% CI | |||
| Systolic Blood Pressure | ||||||||
| MUAC | 2.78 | 0.000 | 2.54 | 3.02 | 2.00 | 0.000 | 1.71 | 2.28 |
| BMI | 2.49 | 0.000 | 2.25 | 2.74 | 1.67 | 0.000 | 1.40 | 1.94 |
| TUAA | 0.84 | 0.000 | 0.76 | 0.91 | 0.59 | 0.000 | 0.50 | 1.94 |
| UMA | 1.32 | 0.000 | 1.20 | 1.44 | 0.92 | 0.000 | 0.78 | 1.06 |
| UFA | 1.01 | 0.000 | 0.87 | 1.15 | 0.65 | 0.000 | 0.50 | 0.79 |
| Diastolic Blood Pressure | ||||||||
| MUAC | 1.08 | 0.000 | 0.90 | 1.26 | 0.80 | 0.000 | 0.57 | 1.03 |
| BMI | 0.97 | 0.000 | 0.79 | 1.15 | 0.66 | 0.000 | 0.45 | 0.87 |
| TUAA | 0.33 | 0.000 | 0.27 | 0.39 | 0.24 | 0.000 | 0.18 | 0.31 |
| UMA | 0.40 | 0.000 | 0.31 | 0.50 | 0.24 | 0.000 | 0.13 | 0.35 |
| UFA | 0.55 | 0.000 | 0.45 | 0.65 | 0.41 | 0.000 | 0.14 | 1.75 |
| Variables | Unadjusted | Adjusted for Age and Gender | ||||||
|---|---|---|---|---|---|---|---|---|
| OR | p-Value | 95% CI | OR | p-Value | 95% CI | |||
| High Systolic Blood Pressure | ||||||||
| TUAA | - | - | - | - | - | - | - | - |
| UMA | 0.24 | 0.047 | 0.06 | 0.98 | 0.24 | 0.046 | 0.06 | 0.97 |
| UFA | 0.12 | 0.033 | 0.02 | 0.84 | 0.11 | 0.032 | 0.02 | 0.83 |
| TU | 0.38 | 0.000 | 0.26 | 0.55 | 0.39 | 0.000 | 0.27 | 0.57 |
| Mild | 0.59 | 0.012 | 0.39 | 0.89 | 0.64 | 0.000 | 0.42 | 0.97 |
| Moderate | 0.43 | 0.018 | 0.22 | 0.87 | 0.45 | 0.025 | 0.23 | 0.90 |
| Severe | 0.17 | 0.014 | 0.04 | 0.70 | 0.15 | 0.008 | 0.04 | 0.61 |
| High Diastolic Blood Pressure | ||||||||
| TUAA | 0.66 | 0.374 | 0.26 | 1.65 | 0.65 | 0.364 | 0.28 | 1.64 |
| UMA | 0.88 | 0.774 | 0.38 | 2.06 | 0.89 | 0.790 | 0.38 | 2.09 |
| UFA | - | - | - | - | - | - | - | - |
| TU | 0.60 | 0.007 | 0.42 | 0.87 | 0.63 | 0.015 | 0.44 | 0.91 |
| Mild | 0.72 | 0.125 | 0.48 | 1.09 | 0.76 | 0.169 | 0.50 | 1.15 |
| Moderate | 0.62 | 0.142 | 0.33 | 1.17 | 0.64 | 0.166 | 0.34 | 1.21 |
| Severe | 0.75 | 0.462 | 0.34 | 1.63 | 0.74 | 0.462 | 0.34 | 1.64 |
| Hypertension | ||||||||
| TUAA | - | - | - | - | - | - | - | - |
| UMA | - | - | - | - | - | - | - | - |
| UFA | - | - | - | - | - | - | - | - |
| TU | 0.39 | 0.003 | 0.21 | 0.73 | 0.41 | 0.006 | 0.22 | 0.77 |
| Mild | 0.51 | 0.065 | 0.24 | 1.05 | 0.54 | 0.096 | 0.26 | 1.11 |
| Moderate | 0.59 | 0.316 | 0.21 | 1.65 | 0.61 | 0.347 | 0.22 | 1.71 |
| Severe | 0.26 | 0.189 | 0.03 | 1.93 | 0.27 | 0.194 | 0.04 | 1.96 |
Publisher’s Note: MDPI stays neutral with regard to jurisdictional claims in published maps and institutional affiliations. |
© 2020 by the authors. Licensee MDPI, Basel, Switzerland. This article is an open access article distributed under the terms and conditions of the Creative Commons Attribution (CC BY) license (http://creativecommons.org/licenses/by/4.0/).
Share and Cite
Mphahlele, T.P.; Monyeki, K.D.; Dibakwane, W.M.; Mokgoatšana, S. The Relationship between Under-Nutrition and Hypertension among Ellisras Children and Adolescents Aged 9 to 17 Years. Int. J. Environ. Res. Public Health 2020, 17, 8926. https://doi.org/10.3390/ijerph17238926
Mphahlele TP, Monyeki KD, Dibakwane WM, Mokgoatšana S. The Relationship between Under-Nutrition and Hypertension among Ellisras Children and Adolescents Aged 9 to 17 Years. International Journal of Environmental Research and Public Health. 2020; 17(23):8926. https://doi.org/10.3390/ijerph17238926
Chicago/Turabian StyleMphahlele, Tumisho Praise, Kotsedi Daniel Monyeki, Winnie Maletladi Dibakwane, and Sekgothe Mokgoatšana. 2020. "The Relationship between Under-Nutrition and Hypertension among Ellisras Children and Adolescents Aged 9 to 17 Years" International Journal of Environmental Research and Public Health 17, no. 23: 8926. https://doi.org/10.3390/ijerph17238926
APA StyleMphahlele, T. P., Monyeki, K. D., Dibakwane, W. M., & Mokgoatšana, S. (2020). The Relationship between Under-Nutrition and Hypertension among Ellisras Children and Adolescents Aged 9 to 17 Years. International Journal of Environmental Research and Public Health, 17(23), 8926. https://doi.org/10.3390/ijerph17238926