Risk Prediction for Early Chronic Kidney Disease: Results from an Adult Health Examination Program of 19,270 Individuals


Abstract
1. Introduction
2. Materials and Methods
2.1. Data Source
2.2. Method
3. Results
4. Discussion
5. Conclusions
Author Contributions
Funding
Conflicts of Interest
References
- Official Journal of the International Society of Nephrology KDIGO Clinical Practice Guideline for the Management of Blood Pressure in Chronic Kidney Disease. Available online: https://kdigo.org/wp-content/uploads/2016/10/KDIGO-2012-Blood-Pressure-Guideline-English.pdf (accessed on 27 May 2020).
- Collister, D.; Ferguson, T.; Komenda, P.; Tangri, N. The patterns, risk factors, and prediction of progression in chronic kidney disease: A narrative review. Semin. Nephrol. 2016, 36, 273–282. [Google Scholar] [CrossRef] [PubMed]
- Tsai, M.H.; Hsu, C.Y.; Lin, M.Y.; Yen, M.F.; Chen, H.H.; Chiu, Y.H.; Hwang, S.J. Incidence, prevalence, and duration of chronic kidney disease in Taiwan: Results from a community-based screening program of 106,094 individuals. Nephron 2018, 140, 175–184. [Google Scholar] [CrossRef] [PubMed]
- National Health Research Institutes Annual Report on Kidney Disease in Taiwan. Available online: http://w3.nhri.org.tw/nhri_org/rl/lib/NewWeb/nhri/ebook/39000000448683.pdf (accessed on 27 May 2020).
- The National Health Insurance Statistics. 2017. Available online: https://www.nhi.gov.tw/english/Content_List.aspx?n=0D39BCF70F478274&topn=616B97F8DF2C3614 (accessed on 27 May 2020).
- Taal, M.W. Predicting renal risk in the general population: Do we have the right formula? Clin. J. Am. Soc. Nephrol. 2011, 6, 1523–1525. [Google Scholar] [CrossRef] [PubMed]
- Echouffo-Tcheugui, J.B.; Kengne, A.P. Risk models to predict chronic kidney disease and its progression: A systematic review. PLOS Med. 2012, 9, e1001344. [Google Scholar] [CrossRef] [PubMed]
- Chang, P.Y.; Chien, L.N.; Lin, Y.F.; Wu, M.S.; Chiu, W.T.; Chiou, H.Y. Risk Factors of Gender for Renal Progression in Patients with Early Chronic Kidney Disease. Med. 2016, 95, e4203. [Google Scholar] [CrossRef] [PubMed]
- Wu, W.C.; Hsieh, P.C.; Hu, F.K.; Kuan, J.C.; Chu, C.M.; Sun, C.A.; Yang, T.; Su, S.L.; Chou, Y.C. Long-Term Predictive Models of Risk Factors for Early Chronic Kidney Disease: A Longitudinal Study. Oncotarget 2018, 9, 19745–19752. [Google Scholar] [CrossRef][Green Version]
- Berns, J.S. Routine Screening for CKD Should Be Done in Asymptomatic Adults... selectively. Clin. J. Am. Soc. Nephrol. 2014, 9, 1988–1992. [Google Scholar] [CrossRef]
- Nam, K.H.; Chang, T.I.; Joo, Y.S.; Kim, J.; Lee, S.; Lee, C.; Yun, H.R.; Park, J.T.; Yoo, T.H.; Sung, S.A.; et al. KNOW-CKD (Korean Cohort Study for Outcomes in Patients with Chronic Kidney Disease) Investigators Association Between Serum High-Density Lipoprotein Cholesterol Levels and Progression of Chronic Kidney Disease: Results from the KNOW-CKD. J. Am. Heart Assoc. 2019, 8, e011162. [Google Scholar] [CrossRef]
- Gluba-Brzozka, A.; Franczyk, B.; Rysz, J. Cholesterol Disturbances and the Role of Proper Nutrition in CKD Patients. Nutrients 2019, 11, 2820. [Google Scholar] [CrossRef]
- Dusseux, E.; Albano, L.; Fafin, C.; Hourmant, M.; Guérin, O.; Couchoud, C. A simple clinical tool to inform the decision-making process to refer elderly incident dialysis patients for kidney transplant evaluation. Kidney Int. 2015, 88, 121–129. [Google Scholar] [CrossRef]
- Miskulin, D.; Bragg-Gresham, J.; Gillespie, B.W.; Tentori, F.; Pisoni, R.L.; Tighiouart, H. Key comorbid conditions that are predictive of survival among hemodialysis patients. Clin. J. Am. Soc. Nephrol. 2009, 4, 1818–1826. [Google Scholar] [CrossRef]
- Fraser, S.D.S.; Roderick, P.J.; May, C.R.; McIntyre, N.; McIntyre, C.; Fluck, R.J.; Shardlow, A.; Taal, M.W. The burden of Comorbidity in people with chronic kidney disease stage 3: A cohort study. BMC Nephrol. 2015, 1, 16–19. [Google Scholar] [CrossRef] [PubMed]
- Tseng, C.J.; Chang, C.C.; Lu, C.J.; Chen, G.D. Application of machine learning to predict the recurrence-proneness for cervical cancer. Neural. Comput. Appl. 2014, 24, 1311–1316. [Google Scholar] [CrossRef]
- Tseng, C.J.; Lu, C.J.; Chang, C.C.; Chen, G.D.; Cheewakriangkrai, C. Integration of data mining classification techniques and ensemble learning to identify risk factors and diagnose ovarian cancer recurrence. Artif. Intell. Med. 2017, 78, 47–54. [Google Scholar] [CrossRef] [PubMed]
- Ting, W.C.; Lu, Y.C.; Lu, C.J.; Cheewakriangkrai, C.; Chang, C.C. Recurrence impact of primary site and pathologic stage in patients diagnosed with colorectal cancer. J. Qual. 2018, 25, 166–184. [Google Scholar]
- Chang, C.C.; Chen, S.H. Developing a novel machine learning-based classification scheme for predicting SPCs in breast cancer survivors. Front. Genet. 2019, 10, 848. [Google Scholar] [CrossRef] [PubMed]
- Ting, W.-C.; Chang, H.-R.; Chang, C.-C.; Lu, C.-J. Developing a Novel Machine Learning-Based Classification Scheme for Predicting SPCs in Colorectal Cancer Survivors. Appl. Sci. 2020, 10, 1355. [Google Scholar] [CrossRef]
- Breiman, L.; Friedman, J.H.; Olshen, R.A.; Stone, C.J. Classification and Regression Trees; Wadsworth, Champman &Hall/CRC: New York, NY, USA, 1984. [Google Scholar]
- Sun, Z.; Wang, J.; Chen, Y.; Lu, H. Influence Factors on Injury Severity of Traffic Accidents and Differences in Urban Functional Zones: The Empirical Analysis of Beijing. Int. J. Environ. Res. Public Health 2018, 15, 2722. [Google Scholar] [CrossRef]
- Quinlan, J.R.C. Programs for Machine Learning; Morgan Kaufmann Publishers: Burlington, MA, USA, 1993. [Google Scholar]
- Dima, S.; Wang, K.-J.; Chen, K.-H.; Huang, Y.-K.; Chang, W.-J.; Lee, S.-Y.; Teng, N.-C. Decision Tree Approach to the Impact of Parents’ Oral Health on Dental Caries Experience in Children: A Cross-Sectional Study. Int. J. Environ. Res. Public Health 2018, 15, 692. [Google Scholar] [CrossRef] [PubMed]
- Johnson, R.A.; Wichern, D.W. Applied Multivariate Statistical Analysis, 4th ed.; Prentice Hall: Upper Saddle River, NJ, USA, 1998. [Google Scholar]
- Pham, T.-H.; Vicnesh, J.; Wei, J.K.E.; Oh, S.L.; Arunkumar, N.; Abdulhay, E.W.; Ciaccio, E.J.; Acharya, U.R. Autism Spectrum Disorder Diagnostic System Using HOS Bispectrum with EEG Signals. Int. J. Environ. Res. Public Health 2020, 17, 971. [Google Scholar] [CrossRef]
- Huang, G.B.; Zhu, Q.Y.; Siew, C.X. Extreme Learning Machine: Theory and Applications. Neurocomputing 2006, 70, 489–501. [Google Scholar] [CrossRef]
- Olivares, R.; Munoz, R.; Soto, R.; Crawford, B.; Cárdenas, D.; Ponce, A.; Taramasco, C. An Optimized Brain-Based Algorithm for Classifying Parkinson’s Disease. Appl. Sci. 2020, 10, 1827. [Google Scholar] [CrossRef]
- Rpart: Recursive Partitioning and Regression Trees. Available online: https://www.rdocumentation.org/packages/rpart (accessed on 10 February 2020).
- Create the Best Train for Classification Models. Available online: https://www.rdocumentation.org/packages/OptimClassifier (accessed on 10 February 2020).
- R/Weka Interface. Available online: https://www.rdocumentation.org/packages/RWeka (accessed on 10 February 2020).
- Classification and Regression Training. Available online: https://www.rdocumentation.org/packages/caret (accessed on 10 February 2020).
- Support Functions and Datasets for Venables and Ripley’s MASS. Available online: https://www.rdocumentation.org/packages/MASS (accessed on 10 February 2020).
- Implementation of ELM (Extreme Learning Machine) Algorithm for SLFN (Single Hidden Layer Feedforward Neural Networks). Available online: https://www.rdocumentation.org/packages/elmNN (accessed on 10 February 2020).
- Xiao, J.; Ding, R.; Xu, X.; Guan, H.; Feng, X.; Sun, T.; Zhu, S.; Ye, Z. Comparison and development of machine learning tools in the prediction of chronic kidney disease progression. J. Transl. Med. 2019, 17, 119. [Google Scholar] [CrossRef] [PubMed]
- Korbut, A.I.; Klimontov, V.V.; Vinogradov, I.V.; Romanov, V.V. Risk factors and urinary biomarkers of non-albuminuric and albuminuric chronic kidney disease in patients with type 2 diabetes. World J. Diabetes 2019, 10, 517–533. [Google Scholar] [CrossRef]
- Kshirsagar, A.V.; Bang, H.; Bomback, A.S. A simple algorithm to predict incident kidney disease. Arch Intern. Med. 2008, 168, 2466–2473. [Google Scholar] [CrossRef] [PubMed]
- Xue, N.; Fang, Y.; Ding, X.; Wang, L.; Xu, L.; Jiang, X.; Zhang, X. Serum Triglycerides Are Related to Chronic Kidney Disease (CKD) Stage 2 in Young and Middle-Aged Chinese Individuals During Routine Health Examination. Med. Sci. Monit. 2019, 25, 2445–2451. [Google Scholar] [CrossRef]
- Mahmood, U.; Healy, H.G.; Kark, A.; Cameron, A.; Wang, Z.; Abeysekera, R.; Hoy, W.E. Spectrum (characteristics) of patients with chronic kidney disease (CKD) with increasing age in a major metropolitan renal service. BMC Nephrology 2017, 18, 372. [Google Scholar] [CrossRef]


| Stage | Description | Estimated GFR |
|---|---|---|
| 1 | Kidney damage with normal or increased GFR | ≥90 mL/min/1.73 m2 |
| 2 | Kidney damage with small decrease in GFR | 60–89.9 mL/min/1.73 m2 |
| 3 | Kidney damage with moderate decrease in GFR | 30–59.9 mL/min/1.73 m2 |
| 3a | 45–59.9 mL/min/1.73 m2 | |
| 3b | 30–44.9 mL/min/1.73 m2 | |
| 4 | Kidney damage with large decrease in GFR | 15–29.9 mL/min/1.73 m2 |
| 5 | Kidney failure with need for dialysis (end-stage renal disease) | <15 mL/min/1.73 m2 |
| Variable | Name | Definition of Normal Test Data |
|---|---|---|
| X1 | Gender | Male/Female |
| X2 | Age | Age greater than 40 years |
| X3 | Red blood cells (RBC) | 0–5 |
| X4 | Glucose Fasting (GLU) | 70–100 |
| X5 | Triglycerides (TG) | 50–150 |
| X6 | Total Cholesterol (T-CHO) | 50–200 |
| X7 | High-Density Lipoprotein Cholesterol (HDL-C) | >40 |
| X8 | Low-Density Lipoprotein Cholesterol (LDL-C) | <130 |
| X9 | Albumin (ALB) | 3.5–5.0 |
| X10 | Proteinuria (PRO) | +/− |
| X11 | Urine protein and creatinine ratio (UPCR) | <150 |
| Y | Glomerular filtration rate (GFR) | ≥90 mL/min/1.73 m2 |
| Characteristic | Non-CKD | CKD | p-Value |
|---|---|---|---|
| N (%) | 14,169 (73.5%) | 5101 (26.5%) | |
| Gender | |||
| Male | 5608 (39.6%) | 2465 (48.3%) | <0.001 ** |
| Female | 8561 (60.4%) | 2636 (51.7%) | |
| Age | |||
| Mean (±SD) | 63.37 ± 11.56 | 69.19 ± 10.74 | <0.001 * |
| RBC | |||
| Normal | 11,460 (80.9%) | 3917 (76.8%) | <0.001 ** |
| Abnormal | 2709 (19.1%) | 1184 (23.2%) | |
| GLU | |||
| Normal | 11,502 (81.2%) | 1055 (20.7%) | 0.004 ** |
| Abnormal | 2667 (18.8%) | 4046 (79.3%) | |
| TG | |||
| Normal | 5878 (41.5%) | 2012 (39.4%) | 0.011 * |
| Abnormal | 8291 (58.5%) | 3089 (60.6%) | |
| T-CHO | |||
| Normal | 9198 (64.9%) | 3284 (64.4%) | 0.491 |
| Abnormal | 4971 (35.1%) | 1817 (35.6%) | |
| HDL-C | |||
| Normal | 11,954 (84.4%) | 4369 (85.6%) | 0.029 * |
| Abnormal | 2215 (15.6%) | 732 (14.4%) | |
| LDL-C | |||
| Normal | 11,400 (80.5%) | 4095 (80.3%) | 0.782 |
| Abnormal | 2769 (19.5%) | 1006 (19.7%) | |
| ALB | |||
| Normal | 14,162 (100.0%) | 5097 (99.9%) | 0.457 |
| Abnormal | 7 (0.0%) | 4 (0.1%) | |
| PRO | |||
| Normal | 9203 (65.0%) | 915 (17.9%) | <0.001 * |
| Abnormal | 4966 (35.0%) | 4186 (82.1%) | |
| UPCR | |||
| Normal | 12,364 (87.3%) | 1639 (32.1%) | <0.001 * |
| Abnormal | 1805 (12.7%) | 3462 (67.9%) |
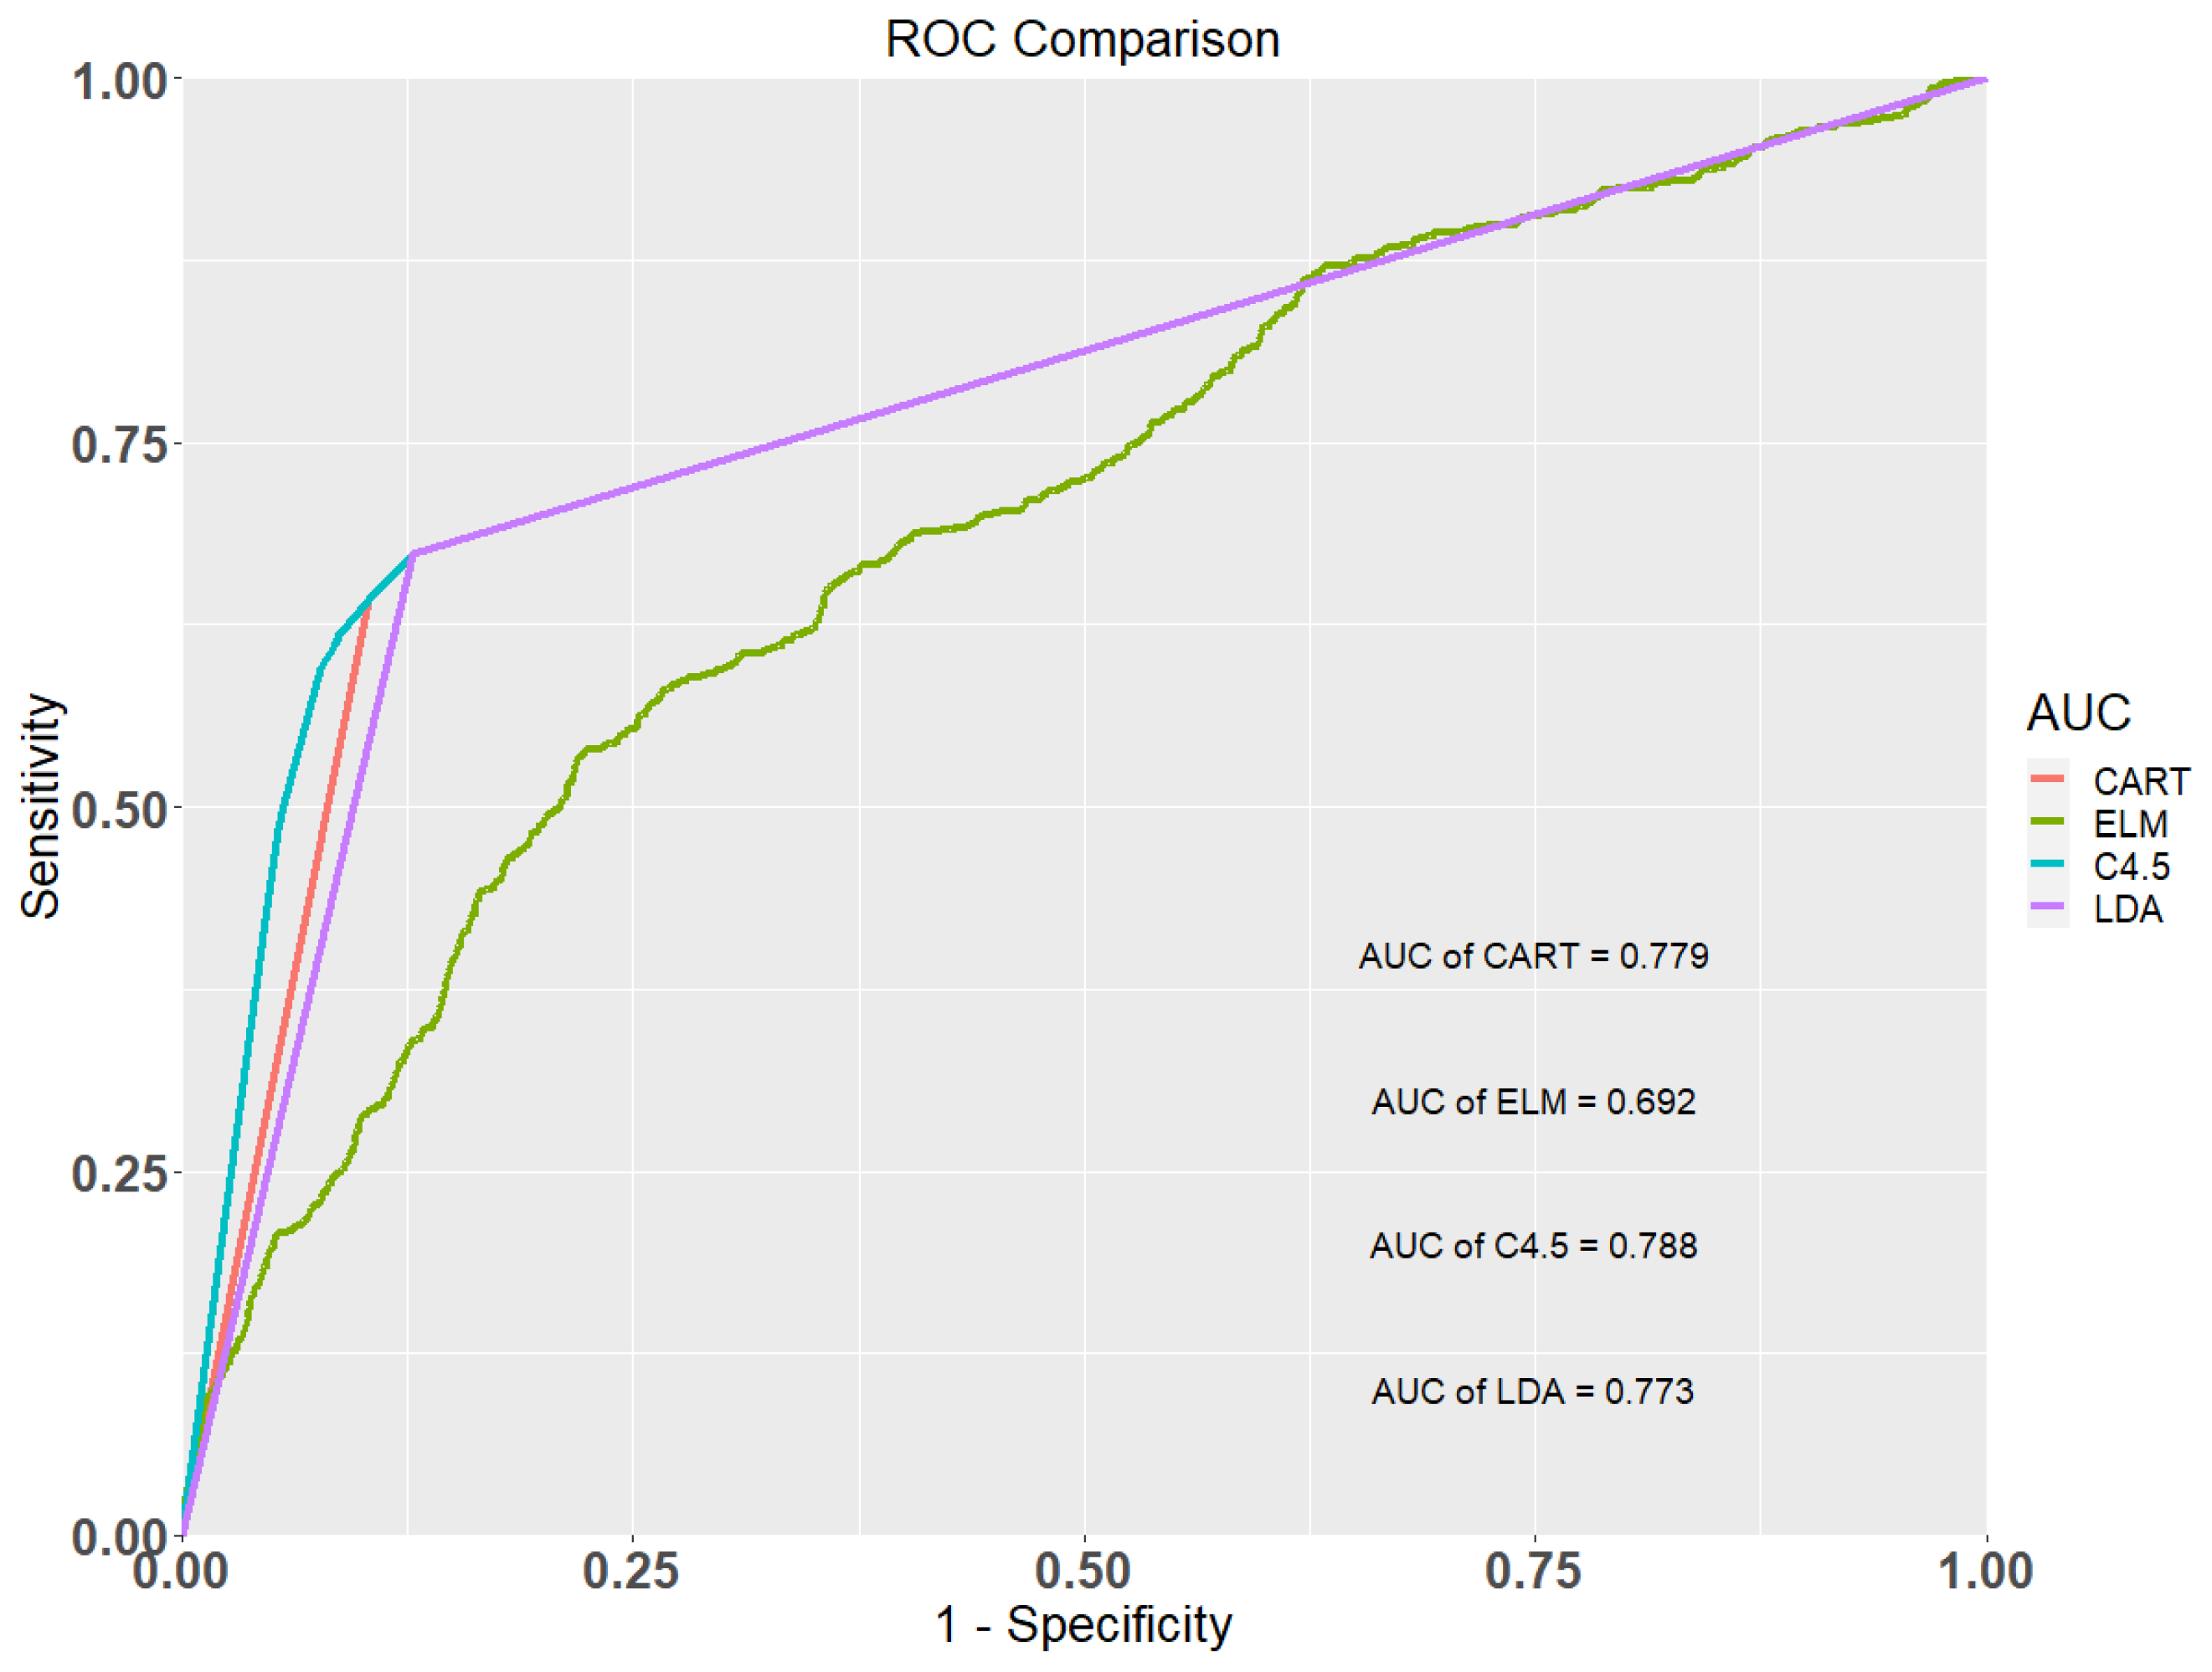
| Methods | Accuracy | Sensitivity | Specificity | AUC |
|---|---|---|---|---|
| Classification and Regression Tree (CART) | 0.819 | 0.670 | 0.871 | 0.779 |
| Extreme Learning Machine (ELM) | 0.715 | 0.539 | 0.777 | 0.692 |
| C4.5 | 0.820 | 0.673 | 0.872 | 0.788 |
| Linear Discriminant Analysis (LDA) | 0.818 | 0.669 | 0.868 | 0.773 |
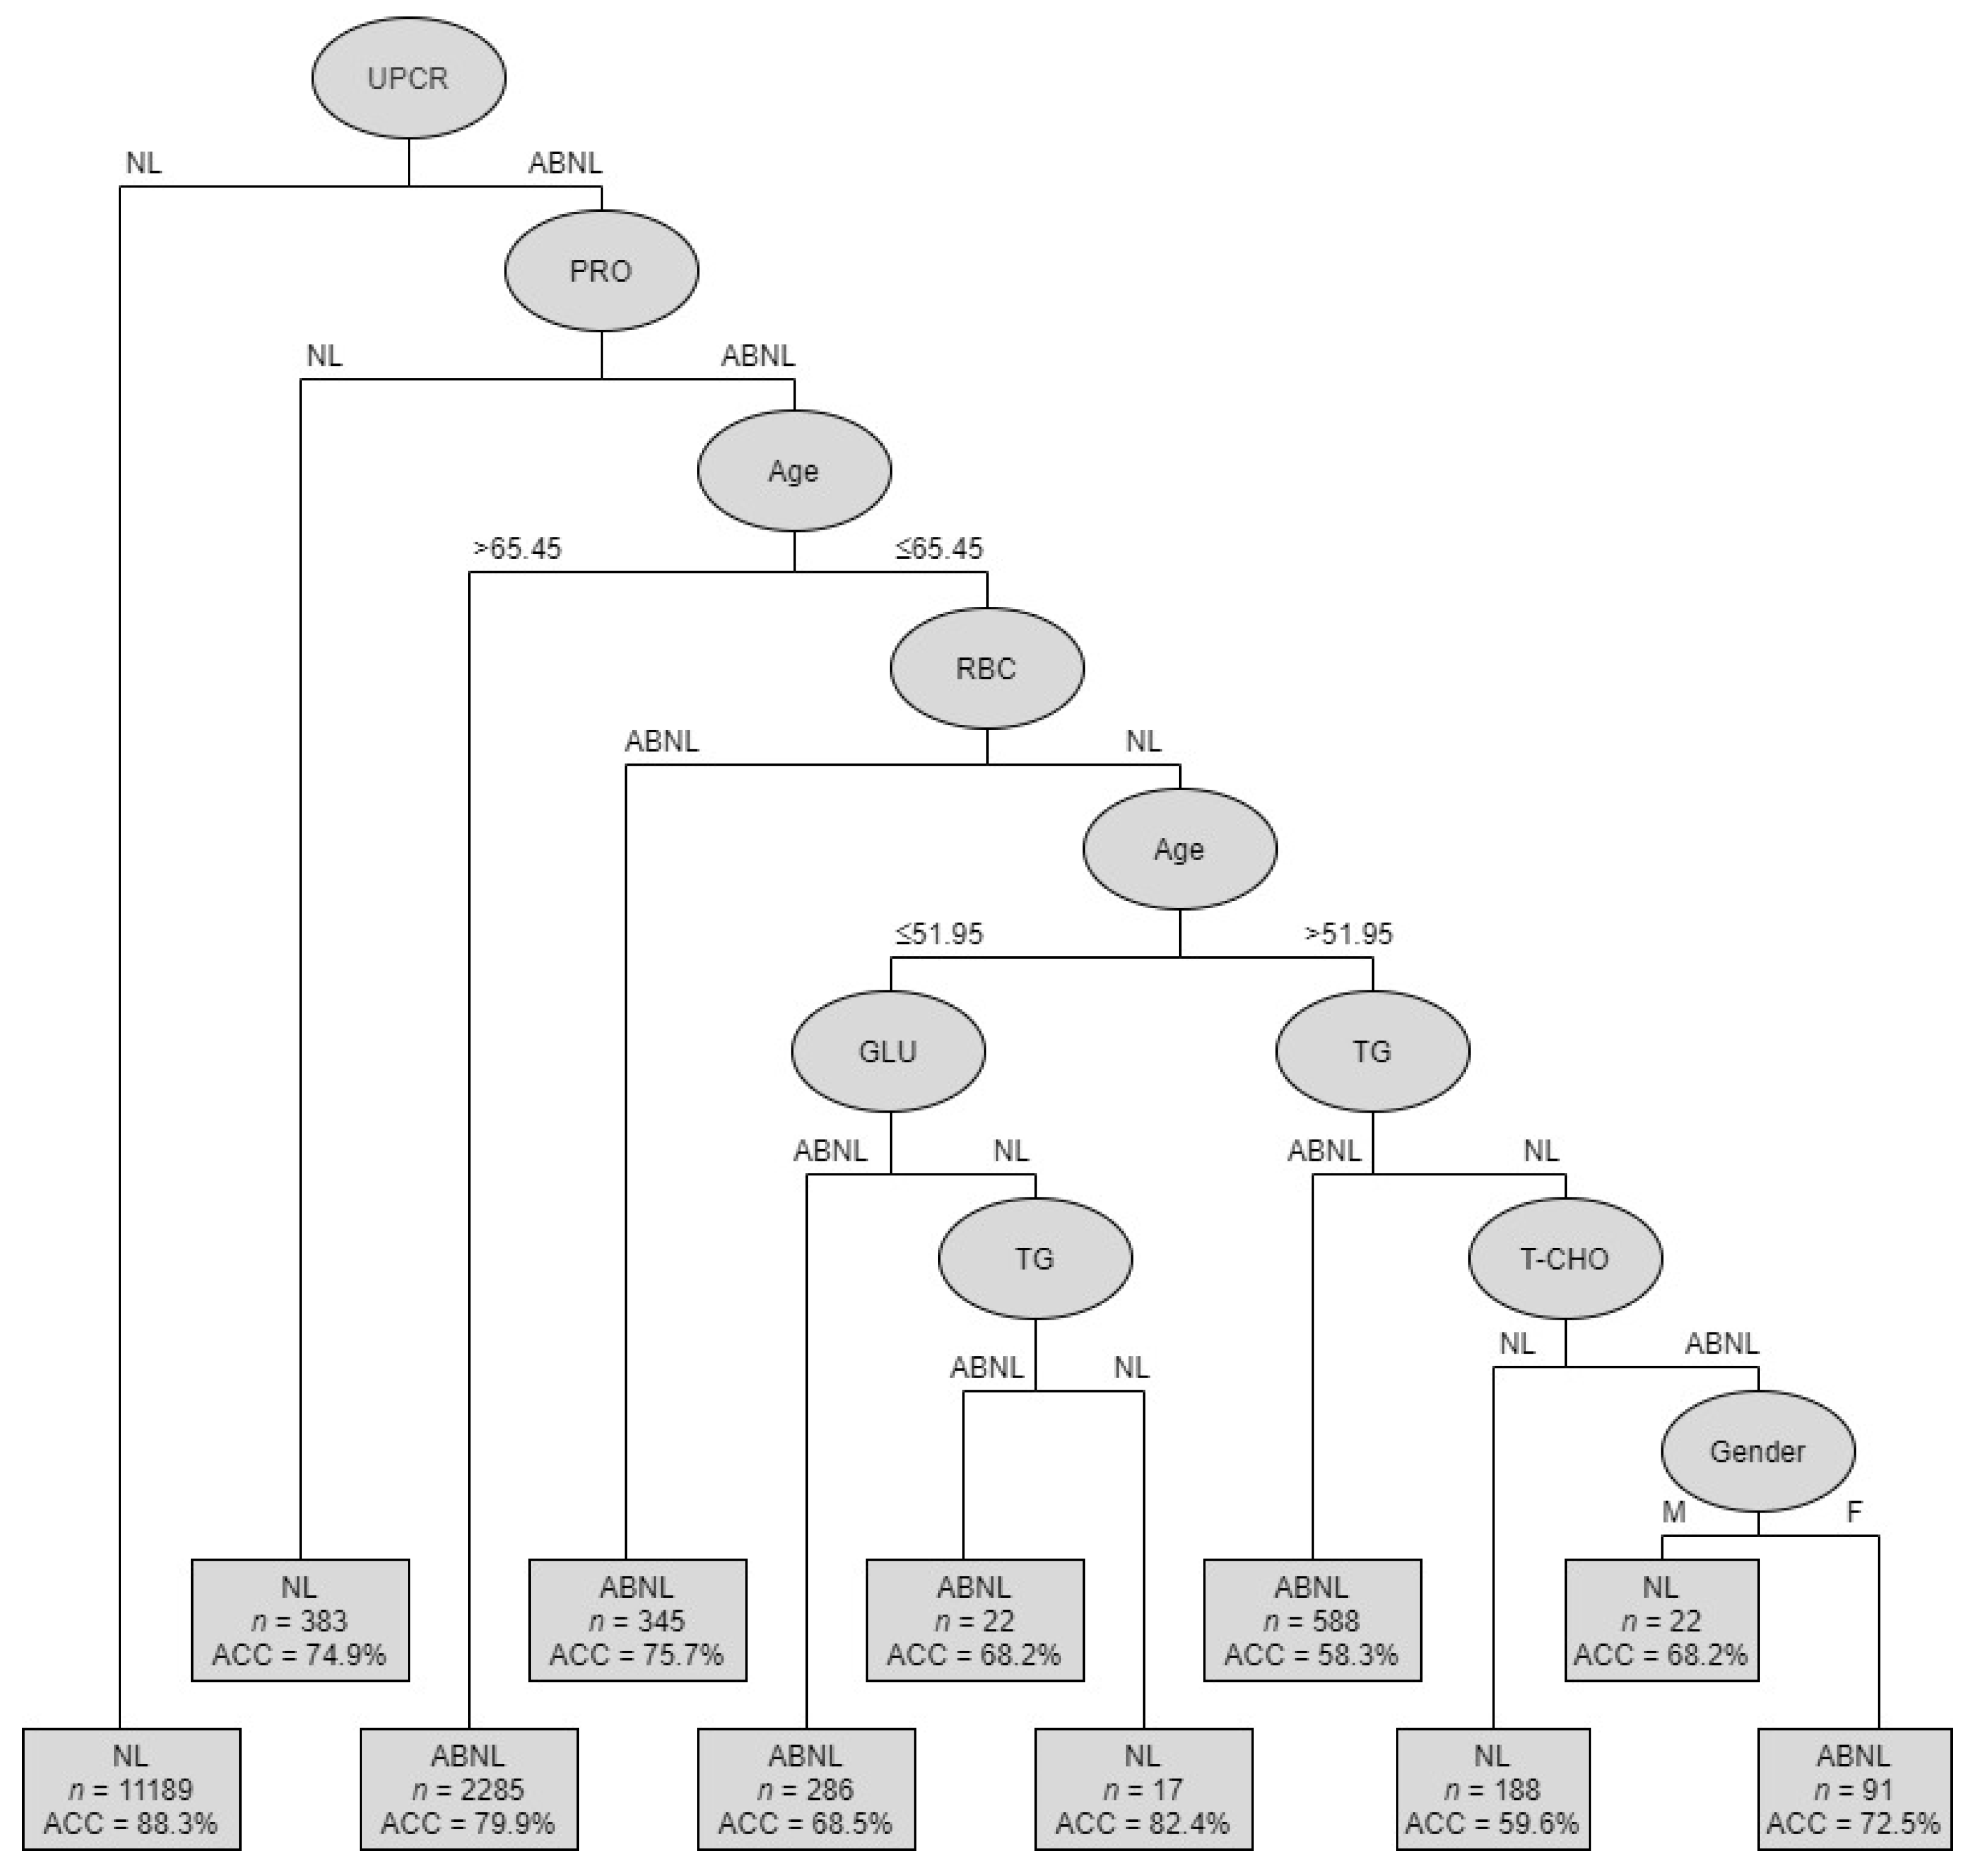
| Rules No. | Combinations of Condition Variables | Cases of (Ab)normal | Accuracy | |
|---|---|---|---|---|
| 1 | UPCR (NL) | 9879 | NL | 88.3% |
| 2 | UPCR (ABNL) + PRO (NL) | 287 | NL | 74.9% |
| 3 | UPCR (ABNL)+PRO (ABNL) + Age (>65.45) | 1826 | ABNL | 79.9% |
| 4 | UPCR (ABNL) + PRO (ABNL) + Age (≤65.45) + RBC (ABNL) | 261 | ABNL | 75.7% |
| 5 | UPCR (ABNL) + PRO (ABNL) + Age (≤65.45) + RBC (NL) + Age (≤51.95) + GLU (ABNL) | 196 | ABNL | 68.5% |
| 6 | UPCR (ABNL) + PRO (ABNL) + Age (≤65.45) + RBC(NL) + Age (>51.95) + TG(ABNL) | 343 | ABNL | 58.3% |
| 7 | UPCR (ABNL) + PRO (ABNL) + Age (≤65.45) + RBC (NL) + Age (≤51.95) + GLU (ABNL) + TG (ABNL) | 15 | ABNL | 68.2% |
| 8 | UPCR (ABNL) + PRO (ABNL) + Age (≤65.45) + RBC(NL) + Age (≤51.95) + GLU (ABNL) + TG(NL) | 14 | NL | 82.4% |
| 9 | UPCR (ABNL) + PRO (ABNL) + Age (≤65.45) + RBC (NL) + Age (≤51.95) + GLU (ABNL) + TG (NL) + T-CHO (NL) | 112 | NL | 59.6% |
| 10 | UPCR (ABNL) + PRO (ABNL) + Age (≤65.45) + RBC (NL) + Age (≤51.95) + GLU (ABNL) + TG (NL) + T-CHO (ABNL) + Gender (M) | 15 | NL | 68.2% |
| 11 | UPCR (ABNL) + PRO (ABNL) + Age (≤65.45) + RBC (NL) + Age (≤51.95) + GLU (ABNL) + TG (NL) + T-CHO (ABNL) + Gender (F) | 66 | ABNL | 72.5% |
© 2020 by the authors. Licensee MDPI, Basel, Switzerland. This article is an open access article distributed under the terms and conditions of the Creative Commons Attribution (CC BY) license (http://creativecommons.org/licenses/by/4.0/).
Share and Cite
Shih, C.-C.; Lu, C.-J.; Chen, G.-D.; Chang, C.-C. Risk Prediction for Early Chronic Kidney Disease: Results from an Adult Health Examination Program of 19,270 Individuals. Int. J. Environ. Res. Public Health 2020, 17, 4973. https://doi.org/10.3390/ijerph17144973
Shih C-C, Lu C-J, Chen G-D, Chang C-C. Risk Prediction for Early Chronic Kidney Disease: Results from an Adult Health Examination Program of 19,270 Individuals. International Journal of Environmental Research and Public Health. 2020; 17(14):4973. https://doi.org/10.3390/ijerph17144973
Chicago/Turabian StyleShih, Chin-Chuan, Chi-Jie Lu, Gin-Den Chen, and Chi-Chang Chang. 2020. "Risk Prediction for Early Chronic Kidney Disease: Results from an Adult Health Examination Program of 19,270 Individuals" International Journal of Environmental Research and Public Health 17, no. 14: 4973. https://doi.org/10.3390/ijerph17144973
APA StyleShih, C.-C., Lu, C.-J., Chen, G.-D., & Chang, C.-C. (2020). Risk Prediction for Early Chronic Kidney Disease: Results from an Adult Health Examination Program of 19,270 Individuals. International Journal of Environmental Research and Public Health, 17(14), 4973. https://doi.org/10.3390/ijerph17144973