Abstract
Prevalence of nine chronic medical conditions in the population-based Ft. Devens Cohort (FDC) of GW veterans were compared with the population-based 2013–2014 National Health and Nutrition Examination Survey (NHANES) cohort. Excess prevalence was calculated as the difference in prevalence estimates from the Ft. Devens and NHANES cohorts; and confidence intervals and p-values are based on the standard errors for the two prevalence estimates. FDC males were at increased risk for reporting seven chronic medical conditions compared with NHANES males. FDC females were at decreased risk for high blood pressure and increased risk for diabetes when compared with NHANES females. FDC veterans reporting war-related chemical weapons exposure showed higher risk of high blood pressure; diabetes; arthritis and chronic bronchitis while those reporting taking anti-nerve gas pills had increased risk of heart attack and diabetes. GW veterans are at higher risk of chronic conditions than the general population and these risks are associated with self-reported toxicant exposures.
1. Introduction
From August 1990 to June 1991, nearly 700,000 U.S. troops were deployed to the Persian Gulf to serve in Operations Desert Shield and Desert Storm. Shortly after returning, many Gulf War (GW) veterans began reporting a variety of symptoms in multiple body systems that medical professionals could not diagnose. This array of symptoms was termed “Gulf War Illness” (GWI) or “Chronic Multisymptom Illness” (CMI) [1,2]. Researchers have found that this illness continues to affect about a third of all GW veterans [3]. A recent meta-analysis of health symptoms experienced by GW veterans conducted by our research team found that the most commonly reported concerns were fatigue, pain, cognitive and mood problems, skin rash, gastrointestinal and respiratory conditions [4]. This symptom complex was consistent with what was found in a Kansas cohort, which was used to determine one of the two most widely used case criteria [1].
While the exact etiology and pathobiology of these symptoms remains undetermined, research clearly suggests that neurotoxicant exposures in theater contributed to the disorder [5,6,7,8]. GW exposures that have been implicated in the etiology of GWI include low-level sarin chemical warfare agent, pesticides and prophylactic anti-nerve agent pills (pyridostigmine bromide; PB) [5,8]. These exposures can result in both immediate and delayed health effects including chronic cognitive and mood problems and have recently been termed ‘toxic wounds’ to describe this cause-effect relationship [5,7].
Correspondingly, GW veterans have shown increased prevalence of chronic multisymptom illnesses, including GWI, fibromyalgia [1,3,9,10], chronic fatigue syndrome (CFS) [1,3,5,8,9,10,11,12,13,14] irritable bowel syndrome (IBS) [9,13], and functional gastric disorders, for which they can receive presumption for health care service at VA hospitals. GW veterans are also more likely to develop chronic neurological disorders, which may or may not be associated with GWI but have been associated with exposures during the war, including amyotrophic lateral sclerosis (ALS) [15,16,17], brain cancer [3,5,18,19,20], repeated seizures [1,3,5,9,21,22], neuralgias and neuritis [3,5,9,22] and chronic migraine headaches [1,3,5,11,12,13,22,23].
For non-neurological disorders, there have been reports of higher rates of arthritis [1,9,11,12,13,14,22], various lung diseases [1,9,12,13,14,21,22,24], eye or vision problems [1,22], high blood pressure [1,9,10,12,13,14,22], and heart disease [1,9,11,14,21,22] in GW veterans relative to other veteran control groups (GW vs. GW-era veterans, deployed vs. non-deployed veterans, GWI vs. non-GWI veterans). We are unaware of any studies to date in which GW veterans have been compared with the general population on chronic health outcomes. Therefore, it remains unknown whether GW veterans are showing more age-related chronic conditions than the general population and whether or not toxicant exposures are associated with these conditions. There is precedent for this type of toxicant-induced disorder in veterans from other wars. For instance, many Vietnam veterans developed chronic conditions of high blood pressure, diabetes and many types of cancers which the National Academy of Sciences’ (NAS) Institute of Medicine (IOM) concluded were related to remote exposure to Agent Orange [25]. The conditions mentioned above related to GW deployment are also of particular relevance, as one of the most commonly used GWI criteria, the Kansas criteria, excludes chronic medical conditions such as heart disease and diabetes. It is, therefore, necessary to compare the rates of various medical conditions in GW veterans to the general population using a well-established national data set.
One of the earliest and the longest-running studies of GW veterans’ health symptoms was conducted with the Ft. Devens, MA Cohort (FDC). This cohort was surveyed in regard to their health symptom reporting and provided important information regarding the rates and types of current health patterns [26,27]. Results of initial studies from the early 1990s revealed that joint pain, headaches, memory and attention difficulties, skin rash, gastrointestinal difficulties and sleep problems were the most commonly reported chronic symptoms 24 months post-deployment. Early FDC studies also showed that women and those reporting taking 20 or more PB pills were more likely to meet criteria for GWI [26]. In the most recent survey of this cohort it was found that individuals are still experiencing health symptoms at high rates [28]. What was not initially clear was whether or not these rates were higher than those in the general public.
Epidemiologic studies of health symptoms have compared rates of cohort samples to the National Health and Nutrition Examination Survey (NHANES) data set. This is a program of studies created by the Centers of Disease Control and Prevention (CDC) to assess the health and nutritional status of adults in the United States. The NHANES surveys began in the early 1960s and continue to this day.
In the current study, we build upon, extend and update prior work by comparing the rates of chronic conditions in GW veterans to that of the general population. Specifically, we compared the FDC survey data to the general population (2013–2014 NHANES), to compare rates of self-reported doctor diagnosed chronic medical conditions between cohorts. We also investigated the health status of GW veterans from the FDC survey of 2013–2014 as it relates to self-reported neurotoxicant exposures. We hypothesized that GW veterans would have higher rates of chronic conditions than the general population. We also hypothesized that GW veterans who reported neurotoxicant exposures would have higher rates of chronic conditions than GW veterans who did not report neurotoxicant exposures, similar to other deployment-related toxicant exposed veteran groups.
2. Materials and Methods
2.1. Participants
Comparison data for this study came from two different population-based cohorts. The first cohort included the Ft. Devens, MA Cohort of GW veterans (FDC), and the second cohort was the NHANES dataset. The FDC is one of the few longitudinal cohorts of GW veterans and is the longest running cohort of GW veterans. The most recent Time 5 resurvey began in 2013 and 448 participants who had data for at least one medical condition responded to the FDC Reunion Survey (47 women). Data for the comparison group (n = 2949) was obtained from the NHANES survey for the year 2013–2014, restricted to the age range of the FDC respondents. For the current analyses, veterans were excluded from the NHANES sample.
2.2. Self-Report of Medical Conditions
The FDC veterans were asked to self-report if a doctor had ever diagnosed them with 9 chronic medical conditions: high blood pressure (HBP), high cholesterol, heart attack, diabetes, stroke, cancer, asthma, arthritis, and chronic bronchitis. Responses were recorded dichotomously (yes/no). NHANES participants also self-reported whether or not a doctor had ever diagnosed them with these conditions (yes/no) and these data were compared with the FDC survey data.
2.3. Self-Report of Exposures
FDC veterans were asked during this resurvey to self-report if they were ever exposed to chemical or biological warfare (CBW) agents or pyridostigmine bromide (PB) anti-nerve agent pills. CBW was used as a proxy for chemical weapons (sarin/cyclosarin) exposure.
2.4. Statistical Analysis
Since the FDC and NHANES used different sampling strategies, prevalence estimates and their standard errors were calculated separately for each cohort. NHANES employed a complex survey design and prevalence was estimated using SAS survey procedures to account for weighting and clustering in estimating both parameters estimates and standard errors. The FDC was analyzed as a random sample from the Ft. Devens population. Excess prevalence was calculated as the difference in prevalence estimates from the Ft. Devens and NHANES cohorts, and confidence intervals and p-values are based on the standard errors for the two prevalence estimates. Odds ratios and test-based confidence intervals were calculated from the prevalence estimates and standard errors from the two cohorts, similar to what was done in Yun et al. 2006 [29].
Comparisons were made separately for men and women to assess for gender- and age-specific associations. For the age-specific associations, we compared three different age groupings: 40s, 50s, and 60s+ by cohort. Reflecting the Ft. Devens population, the FDC sample was largely white (94%), with high school education or higher (99%). To account for demographic differences between cohorts, we restricted both cohorts to White/Caucasian individuals with a high school or above education. After restriction, there were some demographic differences between cohorts on age (Ft. Devens women were younger) and education (Ft. Devens men were more likely to have other training or some college), and analyses adjusted for these demographic differences by modifying the NHANES weights to match the age and education distribution, for men and women separately, of the Ft. Devens cohort. After restriction and weighting (now listed as restricted analyses), there were no significant differences in current smoking between the two cohorts.
Chi-square tests of independence were used to examine the association between gender and medical conditions, as well as the association between exposures and medical conditions, and to calculate odds ratios in the FDC. Multinomial logistic regressions were run to obtain the adjusted ORs, when applicable. For all analyses, two-sided p < 0.05 was considered significant, and no adjustments were made for multiple comparisons.
Data Availability Statement: Analyses were performed using raw data that are only available within the US Department of Veterans Affairs firewall in a secure research environment. VA privacy and data security policies and regulatory constraints provide that only aggregate summary data may be removed from the VA for publication. The authors have provided detailed results of these analyses in the paper. These restrictions are in place in order to maintain patient privacy and confidentiality. Access to these data can be granted to persons who are not an employee of the VA; however, there is an official protocol that must be followed for doing so. The authors invite those wishing to access the raw data that were used for this analysis to contact Maxine Krengel (Maxine.Krengel@va.gov) to discuss the details of the VA data access approval process.
3. Results
3.1. Demographics
The mean age of the FDC was 53.93 years. The mean age of the NHANES cohort was 55.86 years. The two cohorts differed significantly in age, sex, race, education, and current smoking status. For the FDC exposure analyses, veterans who were exposed and unexposed did not differ on any of the demographic variables. However, adjusted analyses for exposure were performed to control for gender and current smoking, potential risk factors for these chronic conditions. Demographics are reported in Table 1.

Table 1.
Demographics.
3.2. Chronic Conditions in the FDC and NHANES Cohort
Non-restricted analyses are presented in Table 2. Non-restricted analyses revealed that FDC males had significantly higher odds of reporting HBP, high cholesterol, heart attack, arthritis, and chronic bronchitis than NHANES males. Restricted analyses revealed that the FDC males had significantly higher odds of reporting HBP, high cholesterol, heart attack, diabetes, stroke, arthritis, and chronic bronchitis (p < 0.05). The FDC excess prevalence ranged from 2.7 to 12.2% higher for these conditions (Table 2). This resulted in the FDC men having more than 2.5 times the odds of reporting a heart attack (OR = 2.63) and more than 4 times the odds of reporting chronic bronchitis (OR = 4.50). The odds of HBP, diabetes, and arthritis was at least 1.47 times higher in the FDC (Table 2).
Table 2.
Cohort comparison of prevalence of medical conditions—non-restricted sample.
Non-restricted and restricted analyses revealed that the FDC females reported a significantly lower rate of HBP and a significantly higher rate of diabetes compared with the NHANES females (p < 0.05). The FDC women had a 16.4% lower prevalence of HBP and a 19.5% higher prevalence of diabetes compared to the NHANES general population. There was no significant association between cohort and high cholesterol, heart attack, stroke, cancer, asthma, arthritis, and chronic bronchitis (p > 0.05). FDC and NHANES cohort comparison results are shown in Figure 1 and Table 2.
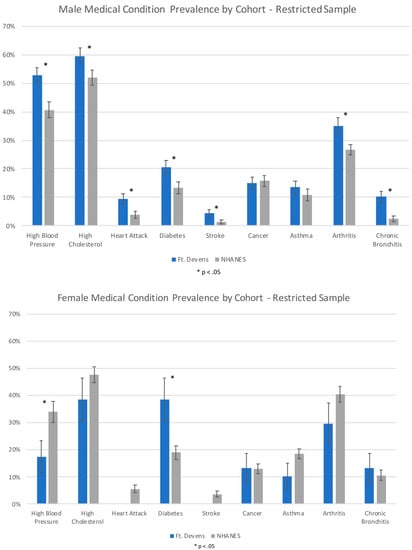
Figure 1.
Prevalence of medical conditions in male and female participants from FDC and NHANES cohorts in the restricted sample. (Error bars represent Standard Error).
3.3. Age and Gender Comparisons in FDC and NHANES Cohorts
For males in their 40s, the non-restricted analyses indicated significant associations between cohort and HBP and high cholesterol (p < 0.05), with the FDC reporting higher prevalence (Table 3). In the restricted analyses, there was a significant association between cohort and heart attack (p < 0.05), with the FDC reporting a higher prevalence than the NHANES cohort. The excess prevalence for heart attack was 4.4% (Table 3). The odds of FDC men reporting a heart attack was 27.36 times higher than NHANES men (Table 3). There was no significant association between cohort and the eight other chronic conditions.
Table 3.
Cohort comparison of male rates of medical conditions by age group.
For males in their 50s, the non-restricted analyses indicated significant associations between cohort and HBP, high cholesterol, cancer, arthritis and chronic bronchitis (p < 0.05), with the FDC reporting more chronic conditions. In the restricted analyses, there was a significant association between cohort and arthritis and chronic bronchitis (p < 0.05) with the FDC reporting more chronic conditions than NHANES men. The FDC excess prevalence for these conditions ranged from 9.0 to 17.9% (Table 3). The odds of FDC men reporting chronic bronchitis was 3.94 times higher than the NHANES men. There was no significant association between cohort and the seven other chronic conditions in this age group (p > 0.05).
For males in their 60s, the non-restricted analyses indicated significant associations between cohort and high cholesterol, stroke, cancer, asthma, arthritis, and chronic bronchitis (p < 0.05), with the FDC reporting higher prevalence. In the restricted analyses, there was a significant association between cohort and two chronic conditions including stroke and chronic bronchitis (p < 0.05) with FDC reporting higher rates than NHANES men. The excess prevalence was 12.1 and 10.5% respectively (Table 3). The odds of FDC men reporting stroke and chronic bronchitis were 5.69 and 4.83 times higher respectively than the NHANES men.
Non-restricted and restricted male age comparison results of prevalence and odds ratios are summarized in Table 3. Due to the small number of women in the FDC, female age grouping analyses did not yield sufficient power, and thus are not reported.
3.4. Chronic Conditions and Toxicant Exposures in the Ft. Devens Cohort
For the comparison of chronic medical conditions and toxicant exposures in the FDC, the same 9 chronic conditions were assessed as in the prior FDC and NHANES comparisons. There was a significant association between self-reported chemical/biological weapons (CBW) exposure and 4 chronic conditions (p < 0.05), with CBW-exposed veterans reporting higher prevalence rates of HBP, diabetes, arthritis and chronic bronchitis (Table 4). The excess prevalence of these conditions ranged from 10 to 21% higher prevalence. CBW-exposed veterans had greater than 4 times the odds of reporting diabetes in unadjusted analyses and 3 times the odds in adjusted analyses compared with unexposed veterans.
Table 4.
Rates of medical conditions for exposed and unexposed Ft. Devens veterans.
There was also a significant association between PB pill usage during the war and 2 chronic conditions (p < 0.05) with PB exposed veterans reporting higher prevalence rates of heart attack and diabetes (p < 0.05). The excess prevalence for these two conditions were 10% and 12.5% respectively. PB-exposed veterans had 11 times the odds of reporting a heart attack in unadjusted analyses and 12 times the odds in adjusted analyses than the non-PB-exposed FDC veterans (Table 4).
3.5. Direct Comparison of Prevalence of Chronic Conditions in Men and Women within the Ft. Devens Cohort
When rates of the 9 chronic conditions were directly compared between men and women in the FDC, gender was significantly associated with 3 outcomes: HBP, for which FDC men had nearly 3.5 times the odds of reporting compared to FDC women (OR = 3.45); high cholesterol, for which FDC men had more than 2 times the odds of reporting compared to FDC women (OR = 2.25); and diabetes, for which FDC men had decreased odds of reporting compared to FDC women (OR = 0.38). Gender was not associated with any of the other chronic conditions (Table 5).
Table 5.
Direct comparison of medical condition prevalence in men & women of the Ft. Devens cohort.
4. Discussion
More than 25 years post-deployment, GW veterans continue to report more chronic health symptoms and chronic medical conditions than non-deployed veterans [1,4,9,10,12,13,14,22,23,30]. A recent meta-analysis of chronic health symptoms in deployed GW veterans versus non-deployed GW-era veterans showed that GW veterans had higher odds of reporting mood-cognition, fatigue, musculoskeletal, gastrointestinal, and dermatological symptoms compared with non-deployed veterans when 21 studies encompassing 129,000 veterans were compared [4]. The meta-analysis suggested that the symptom categories encompassed in the Kansas GWI criteria are appropriate for determining the multi-symptom disorder called GWI [1]. In addition to GWI, as veterans age, they continue to develop chronic medical conditions and diseases of aging, as would be expected in the general population. Chronic illness is common in aging individuals, and an estimate in 2000 reported that 45% of Americans had chronic conditions, with over 20% having multiple chronic conditions [31]. In general, non-veteran women report more increased chronic conditions than men and one report suggested that GW veteran women may show increased rates of chronic conditions that have been used as exclusionary medical conditions for the Kansas GWI criteria [32]. This raises the question of whether the exclusionary criteria currently used for GWI case criteria are still appropriate in an aging population of veterans, and whether these GW veterans are showing the same age-related rates in chronic health conditions as the general population, or are showing unique age- and gender-related patterns of development of chronic medical conditions. To our knowledge, the current study is the first to compare GW veterans’ health status to that of the general public by comparing the Ft. Devens Cohort (FDC) with the NHANES cohort and thus builds upon and extends prior GW studies comparing chronic health conditions.
Results showed that male GW veterans have significantly greater odds of developing chronic conditions including HBP, high cholesterol, heart attack, diabetes, stroke, arthritis, and chronic bronchitis. Specifically, FDC men in their 40s have 27 times higher odds of reporting a heart attack compared to the NHANES cohort of the same age. Rates of chronic conditions such as arthritis and chronic bronchitis also appear to be significantly higher in FDC males in their 50s and stroke risk is five times higher in the 60s age range compared to the NHANES cohort. These results correspond with prior accelerated aging cognitive patterns previously noted in the FDC veterans [27]. The fact that heart attack risk is significantly higher in the 4th decade, but not later in the 5–6th decades, in the FDC males suggests that GW veterans may be at increased risk for cardiovascular insults earlier than the general population. The additionally higher risk of stroke in the 6th decade of FDC males appears to suggest earlier cerebrovascular disease risk as well. These results also correspond with reports of increased prevalence over a 10-year period (1995–2005) for arthritis, hypertension, heart disease and diabetes in a large National Survey of Gulf War veterans [14]. Significant new onset of chronic conditions including hypertension, coronary heart disease, and arthritis was also reported by Li et al. (2011) in GW veterans when compared with non-deployed era veterans [14]. However, these studies did not specifically assess gender differences.
Important gender differences were also observed in this study. Male GW veterans had significantly higher odds of developing seven out of the nine chronic conditions assessed when compared with age-matched NHANES males. Conversely, female GW veterans had lower odds of developing HBP and higher odds of developing diabetes when compared with age-matched NHANES females. The FDC was one of the first studies to report a 1.8 times higher risk of GWI in women veterans [26]. Although there were trends for higher odds of developing medical conditions for women in this study, statistical differences were not found in this latest FDC survey, which showed that women veterans have at least the same rate of GWI than their male counterparts. In addition, prior studies in other GW veteran cohorts have reported increased chronic conditions and/or exclusionary medical conditions for GWI in women GW veterans [32]. The current study found fewer chronic conditions in women veterans compared with the general population, while the male veterans showed more chronic conditions than the general population sample of men. When FDC men and women were directly compared for rates of chronic conditions, men had higher rates of HBP and high cholesterol and lower rates of diabetes compared to FDC women. Therefore, it is clear that the trajectory of chronic conditions in male and female GW veterans is different and therefore, their treatment planning should be considered based on these different risk patterns [33,34]. Specifically, men should be aggressively screened and treated for HBP and high cholesterol and women should be screened for diabetes to reduce further potential heart disease and cardiovascular events.
GW veterans’ chronic medical conditions were also compared by exposure status. Results indicated that neurotoxicant exposures during deployment were associated with higher rates of chronic conditions, compared to unexposed FDC veterans. In several prior studies, CBWs including sarin and cyclosarin were associated with GWI, as well as with altered brain imaging outcomes and other chronic illnesses including brain cancer [19,20,35,36,37,38]. PB has been associated with increased risk of GWI in the FDC and other cohorts as well as with other health outcomes including symptom severity, cognitive decrements and altered neuroendocrine function [5,6,7,8,26,30,39,40]. Although prior studies have reported these chronic medical conditions to be higher in GW veterans, this is the first study that we are aware of to report these toxicant exposures to be related to increased prevalence of these chronic conditions.
Collectively, these results indicate that toxic wounds from GW deployment related exposures appear to be associated with more than the chronic health symptoms of GWI but also with chronic conditions of aging. These results are similar to those observed in aging Vietnam veterans who were also shown to have increased risk of developing HBP, diabetes and multiple types of cancer if they were exposed to Agent Orange, the signature toxic wound during the Vietnam era [25,41]. Further assessment of chronic conditions and their causes in other confirmatory cohorts of GW veterans and reconsideration of some Kansas GWI exclusionary criteria is warranted given the current findings. The chronic conditions identified in this study are of importance for future studies of GW veterans and the impact of potential accelerated aging and development of age-related neurodegenerative conditions. While the biological mechanisms for possible accelerated aging in GW veterans are unknown, recent studies in human research participants and laboratory animals have implicated mitochondrial dysfunction and chronic neuroinflammation in GWI [42,43,44,45]. Additionally, understanding prevalence rate differences or excess prevalence of these chronic conditions is important not only to devise appropriate inclusion and exclusion criteria for GWI in an aging population, but also to assess the impact of prior toxicant exposures on GWI pathology.
Strengths and Limitations
The strengths of the current study are that it includes comparisons of chronic conditions in two population-based cohorts including a cohort of deployed GW veterans who were followed within a week after their return from the Gulf War and the well-designed general population cohort called the National Health and Nutrition Examination Surveys (NHANES). Both cohorts were designed as population-based survey study cohorts. The limitations of the current study are the relatively low response rate of the current FDC survey (35%), which could have introduced some response bias, where sicker veterans responded to the survey. However, recent other longitudinal cohorts of GW veterans including the National Survey of Gulf War veterans have reported almost identical response rates on recent surveys with no response bias when prior participant rates were compared suggesting this may be less of an issue with population-based GW veteran cohorts [24]. In addition, although the FDC men were reporting increased rates of chronic conditions compared to NHANES men, the FDC women veterans actually showed lower prevalence of most chronic conditions when compared with the NHANES cohort. These results suggest against response bias in that sicker GW women veterans were not in fact responding to the FDC cohort in this latest FDC survey. Additionally, the FDC includes a large number of National Guardsmen and Reservists, and thus may not be representative of all Gulf War veterans. Furthermore, the small number of women may have limited the analyses and added some uncertainty to the results. Due to demographic differences between cohorts, restricted analyses were performed that limited the sample to White/Caucasians with at least a high school education. This limits the generalizability of our findings to not only other Gulf War veterans but to Gulf War veterans of different gender, races, and education levels.
Lastly, in splitting the samples by age, the sample was smaller for each age group, which may have introduced statistical power issues. Future work is needed to replicate these findings with larger cohorts.
5. Conclusions
In summary, GW veterans in the FDC cohort had significantly increased odds for reporting chronic conditions including high blood pressure, high cholesterol, heart attack, diabetes, stroke, arthritis and chronic bronchitis compared with the NHANES general population cohort. This was true for comparison of males in the two cohorts with heart attack being higher in the FDC 4th decade and chronic bronchitis and arthritis being higher in the FDC 5th decade and the addition of stroke risk being higher is the 6th decade. Female comparisons showed a different pattern with FDC women veterans having significantly lower odds of high blood pressure and significantly higher odds of diabetes when compared with NHANES women. Direct comparisons of male and female FDC showed male veterans had higher odds for reporting HBP and high cholesterol and lower odds of reporting diabetes than FDC women veterans. Gulf War-related exposures, including self-report of chemical weapons, was associated with significantly higher odds of HBP, diabetes, arthritis and chronic bronchitis and self-report of PB exposure was associated with higher risk of heart attack and diabetes. Results indicate that GW veterans are at higher risk of chronic conditions than the general population and these risks are associated with self-reported toxicant exposures. These results should be considered when assessing the functionality of exclusionary criteria for currently used GWI case definitions.
Author Contributions
Conceptualization, M.H.K. and K.S.; Methodology, C.G.Z., M.H.K., T.H., M.K.Y., S.S.C., P.A.J.L., K.S.; Formal Analysis, C.G.Z., T.H.; Data Curation, C.G.Z.; Writing—Original Draft Preparation, C.G.Z., K.S.; Writing—Review and Editing, C.G.Z., M.H.K., T.H., S.S.C., M.K.Y., P.A.J.L., C.M.G., K.S.; Supervision, M.H.K., K.S.; Project Administration, C.G.Z., M.H.K., C.M.G.
Funding
Funds for this study came from the Congressionally Directed Medical Research Program (CDMRP), Gulf War Illness Research Program grant # W81XWH-11-1-0818 to Maxine Krengel.
Acknowledgments
The authors would like to thank all of the Gulf War veterans who participated in this study.
Conflicts of Interest
The authors declare no conflict of interest. Opinions, interpretations, conclusions and recommendations are those of the authors and are not necessarily endorsed by the Department of Defense or the Department of Veterans Affairs. The U.S. Army Medical Research Acquisition Activity, 820 Chandler Street, Fort Detrick MD 21702-5014 is the awarding and administering acquisition office for this work.
References
- Steele, L. Prevalence and Patterns of Gulf War Illness in Kansas Veterans: Association of Symptoms and Characteristics of Person, Place, and Time of Military Service. Am. J. Epidemiol. 2000, 152, 992–1002. [Google Scholar] [CrossRef]
- Fukuda, K.; Nisenbaum, R.; Stewart, G.; Thompson, W.; Robin, L.; Washko, R.; Noah, D.; Barrett, D.; Randall, B.; Herwaldt, B.; et al. Chronic Multisymptom Illness Affecting Air Force Veterans of the Gulf War. J. Am. Med. Assoc. 1998, 280, 981–988. [Google Scholar] [CrossRef]
- Research Advisory Committee on Gulf War Veteran’s Illnesses. Gulf War Illness and the Health of Gulf War Veterans: Research Update and Recommenations, 2009–2013; 2014 Updated Scientific Findings and Recommendations; US Government Printing Office: Washington, DC, USA, 2008.
- Maule, A.L.; Janulewicz, P.A.; Sullivan, K.A.; Krengel, M.H.; Yee, M.K.; McClean, M.; White, R.F. Meta-analysis of self-reported health symptoms in 1990–1991 Gulf War and Gulf War-era veterans. BMJ Open 2018, 8, e016086. [Google Scholar] [CrossRef] [PubMed]
- White, R.F.; Steele, L.; O’Callaghan, J.P.; Sullivan, K.; Binns, J.H.; Golomb, B.A.; Bloom, F.E.; Bunker, J.A.; Crawford, F.; Graves, J.C.; et al. Recent research on Gulf War illness and other health problems in veterans of the 1991 Gulf War: Effects of toxicant exposures during deployment. Cortex 2016, 74, 449–475. [Google Scholar] [CrossRef] [PubMed]
- Sullivan, K.; Krengel, M.; Proctor, S.P.; Devine, S.; Heeren, T.; White, R.F. Cognitive Functioning in Treatment-Seeking Gulf War Veterans: Pyridostigmine Bromide Use and PTSD. J. Psychopathol. Behav. Assess. 2003, 25, 95–103. [Google Scholar] [CrossRef]
- Sullivan, K.; Krengel, M.; Bradford, W.; Stone, C.; Thompson, T.A.; Heeren, T.; White, R.F. Neuropsychological functioning in military pesticide applicators from the Gulf War: Effects on information processing speed, attention and visual memory. Neurotoxicol. Teratol. 2018, 65, 1–13. [Google Scholar] [CrossRef] [PubMed]
- Golomb, B.A. Acetylcholinesterase inhibitors and Gulf War illnesses. Proc. Natl. Acad. Sci. USA 2008, 105, 4295–4300. [Google Scholar] [CrossRef]
- Kang, H.K.; Li, B.; Mahan, C.M.; Eisen, S.A.; Engel, C.C. Health of US veterans of 1991 Gulf War: A follow-up survey in 10 years. J. Occup. Environ. Med. 2009, 51, 401–410. [Google Scholar] [CrossRef]
- Ismail, K.; Kent, K.; Sherwood, R.; Hull, L.; Seed, P.; David, A.S.; Wessely, S. Chronic fatigue syndrome and related disorders in UK veterans of the Gulf War 1990–1991: Results from a two-phase cohort study. Psychol. Med. 2008, 38, 953–961. [Google Scholar] [CrossRef]
- Porter, B.; Long, K.; Rull, R.P.; Dursa, E.K.; Millennium Cohort Study Team. Health Status of Gulf War and Era Veterans Serving in the US Military in 2000. J. Occup. Environ. Med. 2018, 60, e261–e267. [Google Scholar] [CrossRef]
- Unwin, C.; Blatchley, N.; Coker, W.; Ferry, S.; Hotopf, M.; Hull, L.; Ismail, K.; Palmer, I.; David, A.; Wessely, S. Health of UK servicemen who served in Persian Gulf War. Lancet 1999, 353, 169–178. [Google Scholar] [CrossRef]
- Gray, G.C.; Reed, R.J.; Kaiser, K.S.; Smith, T.C.; Gastañaga, V.M. Self-reported Symptoms and Medical Conditions among 11,868 Gulf War-era Veterans. Am. J. Epidemiol. 2002, 155, 1033–1044. [Google Scholar] [CrossRef]
- Li, B.; Mahan, C.M.; Kang, H.K.; Eisen, S.A.; Engel, C.C. Longitudinal health study of US 1991 Gulf War veterans: Changes in health status at 10-year follow-up. Am. J. Epidemiol. 2011, 174, 761–768. [Google Scholar] [CrossRef] [PubMed]
- Haley, R.W. Excess Incidence of ALS in young Gulf War veterans. Am. Acad. Neurol. 2003, 61, 750–756. [Google Scholar] [CrossRef]
- Horner, R.D.; Kamins, K.G.; Feussner, J.R.; Grambow, S.C.; Hoff-Lindquist, J.; Harati, Y.; Mitsumoto, H.; Pascuzzi, R.; Spencer, P.S.; Tim, R.; et al. Occurrence of amyotrophic lateral scelrosis among Gulf War veterans. Am. Acad. Neurol. 2003, 61, 742–749. [Google Scholar]
- Horner, R.D.; Grambow, S.C.; Coffman, C.J.; Lindquist, J.H.; Oddone, E.Z.; Allen, K.D.; Kasarskis, E.J. Amyotrophic lateral sclerosis among 1991 Gulf War veterans: Evidence for a time-limited outbreak. Neuroepidemiology 2008, 31, 28–32. [Google Scholar] [CrossRef] [PubMed]
- Young, H.A.; Maillard, J.D.; Levine, P.H.; Simmens, S.J.; Mahan, C.M.; Kang, H.K. Investigating the risk of cancer in 1990–1991 US Gulf War veterans with the use of state cancer registry data. Ann. Epidemiol. 2010, 20, 265.e1–272.e1. [Google Scholar] [CrossRef]
- Bullman, T.A.; Mahan, C.M.; Kang, H.K.; Page, W.F. Mortality in US Army Gulf War veterans exposed to 1991 Khamisiyah chemical munitions destruction. Am. J. Public Health 2005, 95, 1382–1388. [Google Scholar] [CrossRef] [PubMed]
- Barth, S.K.; Kang, H.K.; Bullman, T.A.; Wallin, M.T. Neurological mortality among U.S. veterans of the Persian Gulf War: 13-year follow-up. Am. J. Ind. Med. 2009, 52, 663–670. [Google Scholar] [CrossRef] [PubMed]
- McCauley, L.A.; Lasarev, M.; Sticker, M.; Rischitelli, G.; Spencer, P.S. Illness Experience of Gulf War Veterans Possibly Exposed to Chemical Warfare Agents. Am. J. Prev. Med. 2002, 23, 200–206. [Google Scholar] [CrossRef]
- Kang, H.K.; Mahan, C.M.; Lee, K.Y.; Magee, C.A.; Murphy, F.M. Illnesses Among United States Veterans of the Gulf War: A Population-Based Survey of 30,000 Veterans. J. Occup. Environ. Med. 2000, 42, 491–501. [Google Scholar] [CrossRef] [PubMed]
- Kelsall, H.L.; Sim, M.R.; Forbes, A.B.; Glass, D.C.; McKenzie, D.P.; Ikin, J.F.; Abramson, M.J.; Blizzard, L.; Ittak, P. Symptoms and medical conditions in Australian veterans of the 1991 Gulf War: Relation to immunisations and other Gulf War exposures. Occup. Environ. Med. 2004, 61, 1006–1013. [Google Scholar] [CrossRef]
- Cowan, D.N.; Lange, J.L.; Heller, J.; Kirkpatrick, J.; DeBakey, S. A Case-Control Study of Asthma among U.S. Army Gulf War Veterans and Modeled Exposure to Oil Well Fire Smoke. Mil. Med. 2002, 167, 777–782. [Google Scholar] [CrossRef] [PubMed]
- Institute of Medicine. Veterans and Agent Orange: Update 2014; The National Academies Press: Washington, DC, USA, 2014. [Google Scholar]
- Wolfe, J.; Proctor, S.P.; Erickson, D.J.; Hu, H. Risk Factors for Multisymptom Illness in US Army Veterans of the Gulf War. J. Occup. Environ. Med. 2002, 44, 271–281. [Google Scholar] [CrossRef] [PubMed]
- Proctor, S. Health status of Persian Gulf War veterans: Self-reported symptoms, environmental exposures and the effect of stress. Int. J. Epidemiol. 1998, 27, 1000–1010. [Google Scholar] [CrossRef] [PubMed]
- Krengel, M. Redefining Gulf War Illness Using Longitudinal Health Data: The Fort Devens Cohort Annual Report; W81XWH-11-1-0818; U.S. Army Medical Research and Materiel Command: Fort Detrick, MD, USA, August 2013. [Google Scholar]
- Yun, S.; Zhu, B.P.; Black, W.; Brownson, R.C. A comparison of national estimates of obesity prevalence from the behavioral risk factor surveillance system and the National Health and Nutrition Examination Survey. Int. J. Obes. (Lond.) 2006, 30, 164–170. [Google Scholar] [CrossRef]
- Cherry, N.; Creed, F.; Silman, A.; Dunn, G.; Baxter, D.; Smedley, J.; Taylor, S.; Macfarlane, G.J. Health and exposures of United Kingdom Gulf war veterans. Part II: The relation of health to exposure. Occup. Environ. Med. 2001, 58, 299–306. [Google Scholar] [CrossRef] [PubMed]
- Anderson, G.; Horvath, J. The Growing Burden of Chronic Disease in America. Public Health Rep. 2004, 119, 263–270. [Google Scholar] [CrossRef]
- Coughlin, S.S.; McNeil, R.B.; Provenzale, D.T.; Dursa, E.K.; Thomas, C.M. Method Issues in Epidemiological Studies of Medically Unexplained Symptom-based Conditions in Veterans. J. Mil. Veterans Health 2013, 21, 4–10. [Google Scholar]
- Smylie, A.L.; Broderick, G.; Fernandes, H.; Razdan, S.; Barnes, Z.; Collado, F.; Sol, C.; Fletcher, M.A.; Klimas, N. A comparison of sex-specific immune signatures in Gulf War illness and chronic fatigue syndrome. BMC Immunol. 2013, 14, 29. [Google Scholar] [CrossRef]
- Craddock, T.J.; Fritsch, P.; Rice, M.A., Jr.; del Rosario, R.M.; Miller, D.B.; Fletcher, M.A.; Klimas, N.G.; Broderick, G. A role for homeostatic drive in the perpetuation of complex chronic illness: Gulf War Illness and chronic fatigue syndrome. PLoS ONE 2014, 9, e84839. [Google Scholar] [CrossRef]
- Heaton, K.J.; Palumbo, C.L.; Proctor, S.P.; Killiany, R.J.; Yurgelun-Todd, D.A.; White, R.F. Quantitative magnetic resonance brain imaging in US army veterans of the 1991 Gulf War potentially exposed to sarin and cyclosarin. Neurotoxicology 2007, 28, 761–769. [Google Scholar] [CrossRef] [PubMed]
- Chao, L.L.; Rothlind, J.C.; Cardenas, V.A.; Meyerhoff, D.J.; Weiner, M.W. Effects of low-level exposure to sarin and cyclosarin during the 1991 Gulf War on brain function and brain structure in US veterans. Neurotoxicology 2010, 31, 493–501. [Google Scholar] [CrossRef] [PubMed]
- Chao, L.L.; Abadjian, L.; Hlavin, J.; Meyerhoff, D.J.; Weiner, M.W. Effects of low-level sarin and cyclosarin exposure and Gulf War Illness on brain structure and function: A study at 4T. Neurotoxicology 2011, 32, 814–822. [Google Scholar] [CrossRef] [PubMed]
- Proctor, S.P.; Heaton, K.J.; Heeren, T.; White, R.F. Effects of sarin and cyclosarin exposure during the 1991 Gulf War on neurobehavioral functioning in US army veterans. Neurotoxicology 2006, 27, 931–939. [Google Scholar] [CrossRef] [PubMed]
- Steele, L.; Sastre, A.; Gerkovich, M.M.; Cook, M.R. Complex factors in the etiology of Gulf War illness: Wartime exposures and risk factors in veteran subgroups. Environ. Health Perspect. 2012, 120, 112–118. [Google Scholar] [CrossRef] [PubMed]
- Golier, J.A.; Legge, J.; Yehuda, R. The ACTH response to dexamethasone in Persian Gulf War veterans. Ann. N. Y. Acad. Sci. 2006, 1071, 448–453. [Google Scholar] [CrossRef]
- Sullivan, K.; Krengel, M.; Janulewicz, P.; Chamberlain, J. An overview of toxicant exposures in veterans cohorts from Vietnam to Iraq. In Military Medical Care: From Predeployment to Post-Separation; Routledge Publishers: Abingdon, UK, 2013. [Google Scholar]
- Koslik, H.J.; Hamilton, G.; Golomb, B.A. Mitochondrial dysfunction in Gulf War illness revealed by 31Phosphorus Magnetic Resonance Spectroscopy: A case-control study. PLoS ONE 2014, 9, e92887. [Google Scholar] [CrossRef]
- Abdullah, L.; Evans, J.E.; Joshi, U.; Crynen, G.; Reed, J.; Mouzon, B.; Baumann, S.; Montague, H.; Zakirova, Z.; Emmerich, T.; et al. Translational potential of long-term decreases in mitochondrial lipids in a mouse model of Gulf War Illness. Toxicology 2016, 372, 22–33. [Google Scholar] [CrossRef]
- Zakirova, Z.; Reed, J.; Crynen, G.; Horne, L.; Hassan, S.; Mathura, V.; Mullan, M.; Crawford, F.; Ait-Ghezala, G. Complementary proteomic approaches reveal mitochondrial dysfunction, immune and inflammatory dysregulation in a mouse model of Gulf War Illness. Proteom. Clin. Appl. 2017, 11, 1600190. [Google Scholar] [CrossRef]
- Koo, B.B.; Michalovicz, L.T.; Calderazzo, S.; Kelly, K.A.; Sullivan, K.; Killiany, R.J.; O’Callaghan, J.P. Corticosterone potentiates DFP-induced neuroinflammation and affects high-order diffusion imaging in a rat model of Gulf War Illness. Brain Behav. Immun. 2018, 67, 42–46. [Google Scholar] [CrossRef]

© 2019 by the authors. Licensee MDPI, Basel, Switzerland. This article is an open access article distributed under the terms and conditions of the Creative Commons Attribution (CC BY) license (http://creativecommons.org/licenses/by/4.0/).