Assessing Residential Exposure Risk from Spills of Flowback Water from Marcellus Shale Hydraulic Fracturing Activity


Abstract
:1. Introduction
2. Materials and Methods
2.1. Residential Tap Water Exposure Scenario
- Cw = Chemical concentration in residential drinking water (mg/L)
- Cflowback = Chemical concentration in flowback water (mg/L)
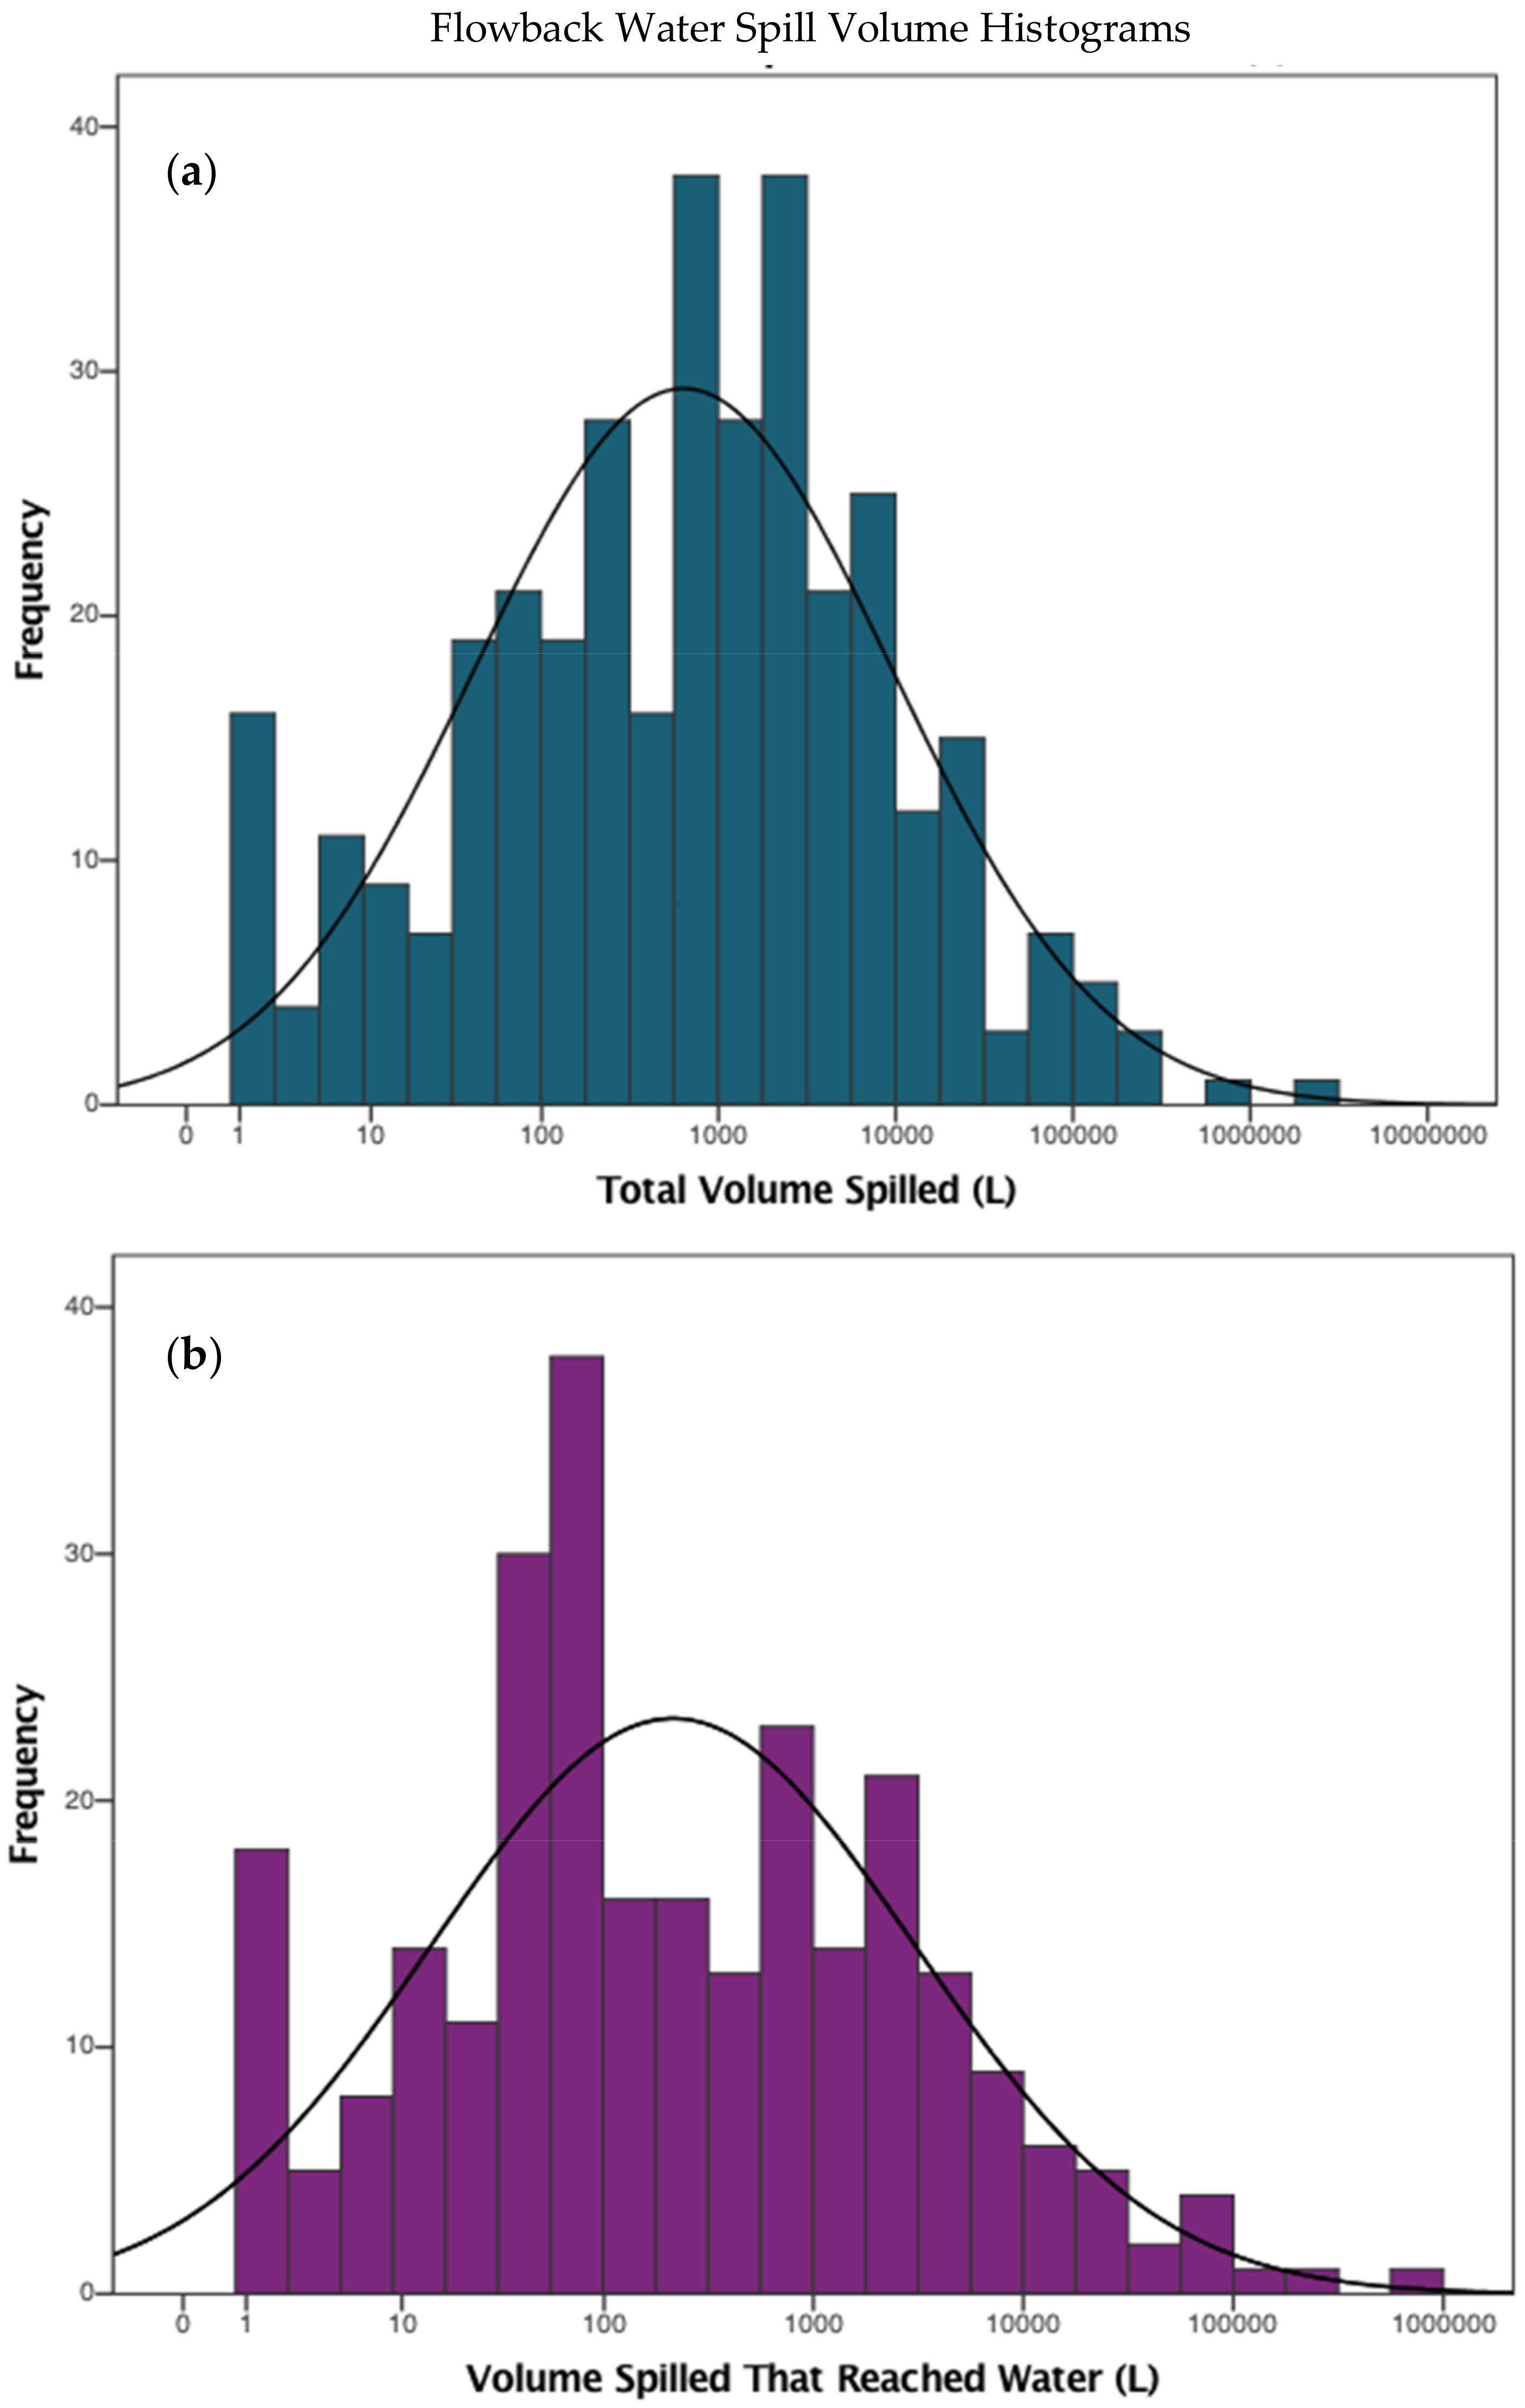
- Vflowback = Volume of flowback water spilled (L)
- Vpond = Volume of drinking water reservoir/holding pond (L)
- Ingestion of contaminated drinking water: This scenario assumes direct ingestion of unfiltered residential drinking water. An average daily water ingestion rate of 2.5 L/day was used in this calculation [49].
- Inhalation of VOCs that may volatilize from the water to the air: This exposure pathway applies to chemicals with a Henry’s Law constant greater than 1 × 10⁻⁵ atm⋅m3/mole and a molecular weight less than 200 g/mole, as they are most likely to volatilize from water during use and contaminate the air. Three carcinogens examined in this assessment meet these criteria, benzene, 1,2-dichloroethane, and vinyl chloride, as well as the radionuclides which may volatilize or aerosolize. This scenario assumes a default volatilization rate of 0.0005 × 1000 L/m3 based on an equation defining the relationship between a volatile chemical’s concentration in water and its average volatilized concentration in the air [50]. This includes all household uses of water (showering/bathing, dish washing, cooking, etc.), and assumes an average daily air inhalation rate of 15 m3/day [49].
- Dermal exposure to contaminated water: This pathway examines direct skin contact with contaminated water during showering or bathing. This scenario assumes total skin surface area exposure for 43 min every day based on average values recommended by the Exposure Factors Handbook [49].
2.2. Residential Swimming Exposure Scenario
2.3. Monte Carlo Simulation
2.4. Residential Risk Assessment for Carcinogens
2.5. Residential Toxicity Assessment for Non-Carcinogens
3. Results
3.1. Residential Exposure from Tap-Water
3.2. Residential Exposure from Swimming
3.3. Uncertainty
4. Discussion
5. Conclusions
Author Contributions
Conflicts of Interest
Appendix A

| Variable | Variable Description | Source |
|---|---|---|
| ABSGI | Fraction absorbed in gastrointestinal tract (dimensionless) | [33] |
| AT | Averaging time (70 years) | [55] |
| B | Correlation coefficient (dimensionless) | [55] |
| BW | Average adult body weight (80 kg) | [55] |
| DAD | Dermal absorbed dose (mg/kg⋅day) | [55] |
| Cw | Chemical concentration in water (mg/cm3) | Table 2; Equation (1) |
| FA | Fraction absorbed water (dimensionless) | [59] |
| K | Volatilization rate (0.5 m3/L) | [55] |
| KP | Dermal permeability coefficient of compound in water (cm/h) | [49] |
| IUR | Inhalation unit risk | Table A3 |
| RfCi | Inhalation reference concentration (mg/m3) | Table A3 |
| RfDABS | Absorbed reference dose (mg/kg⋅day) | Table A3; Exhibit B2b |
| RfDi | Inhalation reference dose (mg/kg⋅day) | Table A3; Exhibit B3 |
| RfDO | Oral reference dose (mg/kg⋅day) | Table A3 |
| SFABS | Absorbed slope factor (mg/kg⋅day)−1 | Table A3; Exhibit B2b |
| SFi | Inhalation slope factor (mg/kg⋅day)−1 | Table A3; Exhibit B3 |
| SFimm | Immersion slope factor (mg/kg⋅day)−1 | Table A4 |
| SFO | Oral slope factor (mg/kg⋅day)−1 | Table A3 |
| Variable | Variable Description | Value | Source |
|---|---|---|---|
| AT | Averaging time (years) | 70 years | [55] |
| BW | Average adult body weight (kg) | 80 kg | [55] |
| ED | Exposure duration (years) | 30 years | [59] |
| EF | Exposure frequency (days/year) | 350 days/year | [49] |
| EV | Event frequency (events/day) | 1 event/day | [49] |
| IRw | Daily water ingestion rate (L/day) | 2.5 L/day | [49] |
| IRa | Daily air inhalation rate (m3/day) | 15 m3/day | [49] |
| SA | Exposed skin surface area (cm2) | 19,652 cm2 (avg. adult skin surface area) | [49] |
| t* | Time to reach steady-state (h) | Chemical specific | Exhibit B3 |
| tevent | Event duration (h/event) | Typical adult exposure = 0.71 h/day | [49] |
| τevent | Lag time per event (h/event) | Chemical specific | Exhibit B3 |
| Chemical | SFo (mg/kg-day)−1 | RfDo (mg/kg-day) | ABSGI | IUR (μg/m3) | RfCi (mg/m3) |
|---|---|---|---|---|---|
| Aluminum | - | 1.0 | 1 | - | 5.0 × 10⁻³ |
| Antimony | - | 4.0 × 10⁻⁴ | 0.15 | - | - |
| Arsenic | 1.5 | 3.0 × 10⁻⁴ | 1 | 4.3 × 10⁻³ | 1.5 × 10⁻⁵ |
| Barium | - | 2.0 × 10⁻¹ | 0.07 | - | 5.0 × 10⁻⁴ |
| Benzene | 5.5 × 10⁻² | 4.0 × 10⁻³ | 1 | 7.8 × 10⁻⁶ | 3.0 × 10⁻² |
| Benzo(a)pyrene | 7.3 | - | 1 | 1.10 × 10⁻³ | - |
| Beryllium | - | 2.0 × 10⁻³ | 0.007 | 2.4 × 10⁻³ | 2.0 × 10⁻⁵ |
| Cadmium | - | 5.0 × 10⁻⁴ | 0.05 | 1.8 × 10⁻³ | 1.0 × 10⁻⁵ |
| Copper | - | 4.0 × 10⁻² | 1 | - | - |
| Dibromochloromethane | 8.4 × 10⁻² | 2.0 × 10⁻² | 1 | - | - |
| 1,2-Dichloroethane | 9.1 × 10⁻² | 6.0 × 10⁻³ | 1 | - | - |
| Heptachlor | 4.5 | 5.0 × 10⁻⁴ | 1 | 2.6 × 10⁻⁵ | 7.0 × 10⁻³ |
| Heptachlor Epoxide | 9.1 | 1.3 × 10⁻⁵ | 1 | 1.3 × 10⁻³ | - |
| Iron | - | 7.0 × 10⁻¹ | 1 | 2.6 × 10⁻³ | - |
| Lead | 8.5 × 10⁻³ | - | 1 | - | - |
| Manganese | - | 2.4 × 10⁻² | 1 | 1.2 × 10⁻⁵ | - |
| Nitrite as N | - | 1.0 × 10⁻¹ | 1 | - | 5.0 × 10⁻⁵ |
| Pentachlorophenol | 4.0 × 10⁻¹ | 5.0 × 10⁻³ | 1 | - | - |
| Thallium | - | 1.0 × 10⁻⁵ | 1 | 5.1 × 10⁻⁶ | - |
| Vinyl Chloride | 7.2 × 10⁻¹ | 3.0 × 10⁻³ | 1 | - | - |
Appendix B
Exhibit B1a. Equations for estimating cancer risk and hazard quotient following ingestion of contaminants in residential drinking water [50].
Exhibit B1b. Sample calculation estimating cancer risk and hazard quotient following ingestion of residential drinking water with median concentration of Benzene [50].
Exhibit B2a. Equations for estimating cancer risk and hazard quotient following dermal exposure to contaminants in residential drinking water [55].
Exhibit B2b. Additional equations for estimating cancer risk and hazard quotient following dermal exposure to contaminants in residential drinking water [55].
Exhibit B2c. Sample calculation estimating cancer risk and hazard quotient following dermal exposure to flowback water with median concentration of Benzene (full hand exposure for 3 h) [55].
References
- Colborn, T.; Schultz, K.; Herrick, L.; Kwiatkowski, C. An exploratory study of air quality near natural gas operations. Hum. Ecol. Risk Assess. Int. J. 2014, 20, 86–105. [Google Scholar] [CrossRef]
- Stephenson, M.H. Shale gas in North America and Europe. Energy Sci. Eng. 2016, 4, 4–13. [Google Scholar] [CrossRef]
- Clark, C.; Burnham, A.; Harto, C.; Horner, R. Hydraulic Fracturing and Shale Gas Production: Technology, Impacts, and Regulations; Argonne National Laboratory: Argonne, IL, USA, 2013.
- NY State Department of Environmental Conservation. Final SGEIS on the Oil, Gas and Solution Mining Regulatory Program; Regulatory Program for Horizontal Drilling and High-Volume Hydraulic Fracturing to Develop the Marcellus Shale and Other Low-Permeability Gas Reservoirs; NY State Department of Environmental Conservation: New York, NY, USA, 2015.
- Rozell, D.J.; Reaven, S.J. Water pollution risk associated with natural gas extraction from the Marcellus Shale. Risk Anal. 2012, 32, 1382–1393. [Google Scholar] [CrossRef] [PubMed]
- Aminto, A.; Olson, M.S. Four-compartment partition model of hazardous components in hydraulic fracturing fluid additives. J. Nat. Gas Sci. Eng. 2012, 7, 16–21. [Google Scholar] [CrossRef]
- US Environmental Protection Agency. Assessment of the Potential Impacts of Hydraulic Fracturing for Oil and Gas on Drinking Water Resources (External Review Draft); EPA/600/R-15/047; U.S. Environmental Protection Agency: Washington, DC, USA, 2015.
- Schramm, E. What Is Flowback, and How Does It Differ from Produced Water; Institute for Energy and Environmental Research of Northeastern Pennsylvania Clearinghouse: University Park, PA, USA, 2011. [Google Scholar]
- Brantley, S.L.; Yoxtheimer, D.; Arjmand, S.; Grieve, P.; Vidic, R.; Pollak, J.; Llewellyn, G.T.; Abad, J.; Simon, C. Water resource impacts during unconventional shale gas development: The Pennsylvania experience. Int. J. Coal Geol. 2014, 126, 140–156. [Google Scholar] [CrossRef]
- Small, M.J.; Stern, P.C.; Bomberg, E.; Christopherson, S.M.; Goldstein, B.D.; Israel, A.L.; Jackson, R.B.; Krupnick, A.; Mauter, M.S.; Nash, J.; et al. Risks and risk governance in unconventional shale gas development. Environ. Sci. Technol. 2014, 48, 8289–8297. [Google Scholar] [CrossRef] [PubMed]
- Beaver, W. Environmental Concerns in the Marcellus Shale. Bus. Soc. Rev. 2014, 119, 125–146. [Google Scholar] [CrossRef]
- Bloomdahl, R.; Abualfaraj, N.; Olson, M.; Gurian, P.L. Assessing worker exposure to inhaled volatile organic compounds from Marcellus Shale flowback pits. J. Nat. Gas Sci. Eng. 2014, 21, 348–356. [Google Scholar] [CrossRef]
- Esswein, E.; Kiefer, S.M.J.; Breitenstein, M. NIOSH FIeld Effort to Assess Chemical Exposure Risks to Gas and Oil Workers; Department of Health and Human Services, Centers for Disease Control and Prevention, National Institute for Occupational Safety and Health: Washington, DC, USA, 2012.
- McKenzie, L.M.; Witter, R.Z.; Newman, L.S.; Adgate, J.L. Human health risk assessment of air emissions from development of unconventional natural gas resources. Sci. Total Environ. 2012, 424, 79–87. [Google Scholar] [CrossRef] [PubMed]
- Howarth, R.W.; Santoro, R.; Ingraffea, A. Methane and the greenhouse-gas footprint of natural gas from shale formations. Clim. Chang. 2011, 106, 679–690. [Google Scholar] [CrossRef]
- Annevelink, M.P.J.A.; Meesters, J.A.J.; Hendriks, A.J. Environmental contamination due to shale gas development. Sci. Total Environ. 2016, 550, 431–438. [Google Scholar] [CrossRef] [PubMed]
- Ferrar, K.J.; Michanowicz, D.R.; Christen, C.L.; Mulcahy, N.; Malone, S.L.; Sharma, R.K. Assessment of Effluent Contaminants from Three Facilities Discharging Marcellus Shale Wastewater to Surface Waters in Pennsylvania. Environ. Sci. Technol. 2013, 47, 3472–3481. [Google Scholar] [CrossRef] [PubMed]
- Gordalla, B.C.; Ewers, U.; Frimmel, F.H. Hydraulic fracturing: A toxicological threat for groundwater and drinking-water? Environ. Earth Sci. 2013, 70, 3875–3893. [Google Scholar] [CrossRef]
- Jackson, R.B.; Vengosh, A.; Darrah, T.H.; Warner, N.R.; Down, A.; Poreda, R.J.; Osborn, S.G.; Zhao, K.; Karr, J.D. Increased stray gas abundance in a subset of drinking water wells near Marcellus shale gas extraction. Proc. Natl. Acad. Sci. USA 2013, 110, 11250–11255. [Google Scholar] [CrossRef] [PubMed]
- Lutz, B.D.; Lewis, A.N.; Doyle, M.W. Generation, transport, and disposal of wastewater associated with Marcellus shale gas development. Water Resour. Res. 2013, 49, 647–656. [Google Scholar] [CrossRef]
- Osborn, S.G.; Vengosh, A.; Warner, N.R.; Jackson, R.B. Methane contamination of drinking water accompanying gas-well drilling and hydraulic fracturing. Proc. Natl. Acad. Sci. USA 2011, 108, 8172–8176. [Google Scholar] [CrossRef] [PubMed]
- Soeder, D.J.; Kappel, W.M. Water Resources and Natural Gas Production from the Marcellus Shale; U.S. Geological Survey; U.S. Department of the Interior: Reston, VA, USA, 2009.
- Vengosh, A.; Jackson, R.B.; Warner, N.; Darrah, T.H.; Kondash, A. A critical review of the risks to water resources from unconventional shale gas development and hydraulic fracturing in the United States. Environ. Sci. Technol. 2014, 48, 8334–8348. [Google Scholar] [CrossRef] [PubMed]
- Vidic, R.D.; Brantley, S.L.; Vandenbossche, J.M.; Yoxtheimer, D.; Abad, J.D. Impact of Shale Gas Development on Regional Water Quality. Science 2013, 340, 1235009. [Google Scholar] [CrossRef] [PubMed]
- Warner, N.R.; Christie, C.A.; Jackson, R.B.; Vengosh, A. Impacts of Shale Gas Wastewater Disposal on Water Quality in Western Pennsylvania. Environ. Sci. Technol. 2013, 47, 11849–11857. [Google Scholar] [CrossRef] [PubMed]
- Zhang, X.; Sun, A.Y.; Duncan, I.J. Shale gas wastewater management under uncertainty. J. Environ. Manag. 2016, 165, 188–198. [Google Scholar] [CrossRef] [PubMed]
- Energy Information Administration. Pennsylvania State Profile and Energy Estimates; U.S. Energy Information Administration: Washington, DC, USA, 2015.
- Energy Information Administration. Monthly Crude Oil and Natural Gas Production; U.S. Energy Information Administration: Washington, DC, USA, 2017.
- Heilweil, V.M.; Grieve, P.L.; Hynek, S.A.; Brantley, S.L.; Solomon, D.K.; Risser, D.W. Stream Measurements Locate Thermogenic Methane Fluxes in Groundwater Discharge in an Area of Shale-Gas Development. Environ. Sci. Technol. 2015, 49, 4057–4065. [Google Scholar] [CrossRef] [PubMed]
- Siegel, D.I.; Azzolina, N.A.; Smith, B.J.; Perry, A.E.; Bothun, R.L. Methane Concentrations in Water Wells Unrelated to Proximity to Existing Oil and Gas Wells in Northeastern Pennsylvania. Environ. Sci. Technol. 2015, 49, 4106–4112. [Google Scholar] [CrossRef] [PubMed]
- Molofsky, L.J.; Connor, J.A.; Wylie, A.S.; Wagner, T.; Farhat, S.K. Evaluation of Methane Sources in Groundwater in Northeastern Pennsylvania. Groundwater 2013, 51, 333–349. [Google Scholar] [CrossRef] [PubMed]
- Balaba, R.S.; Smart, R.B. Total Arsenic and Selenium Analysis in Marcellus Shale, High-Salinity Water and Hydrofracture Flowback Wastewater. Chemosphere 2012, 89, 1437–1442. [Google Scholar] [CrossRef] [PubMed]
- Abualfaraj, N.; Gurian, P.L.; Olson, M.S. Characterization of Marcellus Shale Flowback Water. Environ. Eng. Sci. 2014, 31, 514–524. [Google Scholar] [CrossRef]
- Blauch, M.E.; Myers, R.R.; Moore, T.; Lipinski, B.A.; Houston, N.A. Marcellush Shale Post-Frac Flowback Waters—Where is All the Salt Coming from and What are the Implications? In Proceedings of the SPE Eastern Regional Meeting, Society of Petroleum Engineers, Charleston, WV, USA, 23–25 September 2009. [Google Scholar]
- Dresel, P.E.; Rose, A.W. Chemistry and Origin of Oil and Gas Well Brines in Western Pennsylvania; 4th Series; Pennsylvania Geological Survey: Pittsburgh, PA, USA, 2010.
- Haluszczak, L.O.; Rose, A.W.; Kump, L.R. Geochemical evaluation of flowback brine from Marcellus gas wells in Pennsylvania, USA. Appl. Geochem. 2013, 28, 55–61. [Google Scholar] [CrossRef]
- Hayes, T. Sampling and Analysis of Water Streams as- Sociated with the Development of Marcellus Shale Gas; Gas Technology Institute: Des Plaines, IL, USA, 2009. [Google Scholar]
- Olmstead, S.M.; Muehlenbachs, L.A.; Shih, J.S.; Chu, Z.; Krupnick, A.J. Shale gas development impacts on surface water quality in Pennsylvania. Proc. Natl. Acad. Sci. USA 2013, 110, 4962–4967. [Google Scholar] [CrossRef] [PubMed]
- US Environmental Protection Agency. Hydraulic Fracturing for Oil and Gas: Impacts from the Hydraulic Fracturing Water Cycle on Drinking Water Resources in the United States (Final Report); EPA/600/R-16/236F; Environmental Protection Agency: Washington, DC, USA, 2016.
- Rahm, B.G.; Vedachalam, S.; Bertoia, L.R.; Mehta, D.; Vanka, V.S.; Riha, S.J. Shale gas operator violations in the Marcellus and what they tell us about water resource risks. Energy Policy 2015, 82, 1–11. [Google Scholar] [CrossRef]
- Abualfaraj, N.; Olson, M.S.; Gurian, P.L.; De Roos, A.; Gross-Davis, C.A. Statistical Analysis of Compliance Violations for Natural Gas Wells in Pennsylvania. Energy Policy 2016, 97, 421–428. [Google Scholar] [CrossRef]
- Ingraffea, A.R.; Wells, M.T.; Santoro, R.L.; Shonkoff, S.B. Assessment and risk analysis of casing and cement impairment in oil and gas wells in Pennsylvania, 2000–2012. Proc. Natl. Acad. Sci. USA 2014, 111, 10955–10960. [Google Scholar] [CrossRef] [PubMed]
- Llewellyn, G.T.; Dorman, F.; Westland, J.L.; Yoxtheimer, D.; Grieve, P.; Sowers, T.; Humston-Fulmer, E.; Brantley, S.L.C. Evaluating a groundwater supply contamination incident attributed to Marcellus Shale gas development. Proc. Natl. Acad. Sci. USA 2015, 112, 6325–6330. [Google Scholar] [CrossRef] [PubMed]
- Gross, S.A.; Avens, H.J.; Banducci, A.M.; Sahmel, J.; Panko, J.M.; Tvermoes, B.E. Analysis of BTEX groundwater concentrations from surface spills associated with hydraulic fracturing operations. J. Air Waste Manag. Assoc. 2013, 63, 424–432. [Google Scholar] [CrossRef] [PubMed]
- Abualfaraj, N.; Gurian, P.L.; Olson, M.S. Frequency Analysis of Failure Scenarios from Shale Gas Development. 2018. in preparation. [Google Scholar]
- Krupnick, A.; Gordon, H.; Olmstead, S.M. Pathways to Dialogue: What the Experts Say about the Environmental Risks of Shale Gas Development; Resources for the Future: Washington, DC, USA, 2013. [Google Scholar]
- Galada, H.C.; Gurian, P.L.; Olson, M.S.; Teng, J.; Kumar, A.; Wardell, M.; Eggers, S.; Casman, E. Development of failure scenarios for biosolids land application risk assessment. Water Environ. Res. 2013, 85, 141–150. [Google Scholar] [CrossRef] [PubMed]
- US Environmental Protection Agency. Guide to Septage Treatment and Disposal; EPA/625/R-94/002; U.S. Environmental Protection Agency: Washington, DC, USA, 1994.
- US Environmental Protection Agency. Exposure Factors Handbook: 2011 Edition; U.S. Environmental Protection Agency: Washington, DC, USA, 2011.
- US Environmental Protection Agency. Risk Assessment Guidance for Superfund Volume I: Human Health Evaluation Manual; OSRT. Innovation; U.S. Environmental Protection Agency: Washington, DC, USA, 2004.
- USCG. National Response Center. 2016. Available online: http://www.nrc.uscg.mil (accessed on 13 March 2016).
- US Environmental Protection Agency. Risk Assessment Guidance for Superfund Volume I: Human Health Evaluation Manual (Part E, Supplemental Guidance for Dermal Risk Assessment); OSRT. Innovation; U.S. Environmental Protection Agency: Washington, DC, USA, 2004.
- US Environmental Protection Agency. Risk Assessment Guidance for Superfund Volume I: Human Health Evaluation Manual (Part B, Development of Risk-Based Preliminary Remidiation Goals); OSRT. Innovation; U.S. Environmental Protection Agency: Washington, DC, USA, 2004.
- US Environmental Protection Agency. Limiting Values of Radionuclide Intake and Air Concentration and Dose Conversion Factors for Inhalation, Submersion, and Ingestion; Federal Guidance Report No. 11, OR. Programs; EPA-520/1-88-020; U.S. Environmental Protection Agency: Washington, DC, USA, 1988.
- US Environmental Protection Agency. Risk Assessment Guidance for Superfund Volume I: Human Health Evaluation Manual (Part F, Supplemetal Guidance for Inhalation Risk Assessment); OSRT. Innovation; U.S. Environmental Protection Agency: Washington, DC, USA, 2004.
- Durant, B.; Abualfaraj, N.; Olson, M.S.; Gurian, P.L. Assessing dermal exposure risk to workers from flowback water during shale gas hydraulic fracturing activity. J. Nat. Gas Sci. Eng. 2016, 34, 969–978. [Google Scholar] [CrossRef]
- U.S. Environmental Protection Agency. Integrated Risk Inormation System (IRIS). 2016. Available online: www.epa.gov/IRIS (accessed on 12 June 2016).
- ATSDR, Agency for Toxic Substances and Disease Registry. Health Effects of Exposure to Substances and Carcinogens; ATSDR: Atlanta, GA, USA, 2011.
- National Institute for Occupational Safety and Health (NIOSH). Pocket Guide to Chemical Hazards; NIOSH: Atlanta, GA, USA, 2007.
- U.S. Environmental Protection Agency. OSWER Directive 9200.1-120; U.S. Environmental Protection Agency: Washington, DC, USA, 2014.
- CALEPA. The California Environmental Protection Agency (OEHHA) Office of Environmental Health Hazard Assessment; CALEPA: Sacramento, CA, USA, 2008.
- Health Effects Assessment Summary Tables for Superfund (HEAST). EPA Superfund and Resource Conservation and Recovery Act (RCRA) Hazardous Waste Programs; HEAST: Washington, DC, USA, 2011.
- PPRTV. Provisional Peer Reviewed Toxicity Values for Superfund for Aluminum; Office of Superfund Remediation and Technology Innovation: Washington, DC, USA, 2006.
- PPRTV. Provisional Peer Reviewed Toxicity Values for Superfund for Iron; Office of Superfund Remediation and Technology Innovation: Washington, DC, USA, 2006.
- PPRTV. Provisional Peer Reviewed Toxicity Values for Superfund for 1,2-Dichloroethane; Office of Superfund Remediation and Technology Innovation: Washington, DC, USA, 2011.
- PPRTV. Provisional Peer Reviewed Toxicity Values for Superfund for Thallium; Office of Superfund Remediation and Technology Innovation: Washington, DC, USA, 2012.


| Contaminants | Ingestion | Dermal | Inhalation |
|---|---|---|---|
| Aluminum | Neurobehavioral alterations; skeletal effects (e.g., osteomalacia) | No known dermal health effects | Impaired lung function and fibrosis |
| Antimony | Nausea, vomiting, diarrhea; stomach cramps | Skin irritation | Irritation to nose, throat, mouth; cough; dizziness |
| Arsenic * | Gastrointestinal and reproductive effects; possible liver damage | Dermatitis; hyperpigmentation of skin; potential occupational carcinogen | Respiratory distress in animals |
| Barium | Gastroenteritis; muscle spasm; slow pulse | No known dermal health effects | Upper respiratory system effects |
| Benzene * | Headache, nausea, staggered gait; anorexia, weakness, exhaustion | Skin irritation; dermatitis | Respiratory system effects; dizziness; headache; associated with leukemia |
| Benzo(a)pyrene * | Causes tumors in animals; birth defects | Dermatitis; regressive verrucae (i.e., warts); skin tumors in animals | Causes tumors in animals |
| Beryllium | Ulcerative gastrointestinal lesions | Dermatitis; skin granulomas | Nasopharyngitis; shortness of breath; labored breathing; chemical pneumonitis |
| Cadmium | Renal tubular damage; increased risk of bone fractures | No known dermal health effects | Decreased lung function; emphysema |
| Copper | Nausea; vomiting; diarrhea | Dermatitis | Irritation to eyes, nose, pharynx; nasal septum perforation |
| Dibromochloromethane * | Nervous system disorders; liver and kidney disease | Skin irritation; potential occupational carcinogen | Mucous membranes and upper respiratory tract irritation |
| 1,2-Dichloroethane * | Nervous system disorders; liver and kidney disease | Skin lesions; pulmonary tumors; potential occupational carcinogen | Lung effects |
| Heptachlor * | Liver damage; neurological effects; reproductive system dysfunction | Potential occupational carcinogen | Nervous and immune system effects |
| Heptachlor Epoxide * | Liver damage; neurological effects; reproductive system dysfunction | Potential occupational carcinogen | Nervous and immune system effects |
| Iron | No known ingestion health effects | No known dermal health effects | Benign pneumoconiosis |
| Lead * | Malnutrition; constipation, abdominal pain, colic; neurological impairment | No known dermal health effects | Encephalopathy; neurological effects |
| Manganese | Adverse neurological effects | No known dermal health effects | Difficulty breathing; neurological disorder |
| Nitrite as N | Methemoglobinemia; abdominal cramps; vomiting | No known dermal health effects | No known inhalation effects |
| Pentachlorophenol * | Weakness; nausea; vomiting | Dermatitis; skin lesions; liver effects; renal effects | Irritation to eyes, nose, throat; sneezing, cough; difficulty breathing |
| Thallium | Vomiting; diarrhea; liver and kidney damage | Alopecia (hair loss) | Nervous system effects; pulmonary edema |
| Vinyl chloride * | Gastrointestinal bleeding; enlarged liver | Skin thickening; frostbite; potential occupational carcinogen | Liver cancer |
| Monte Carlo Simulation Input Variables | N | Distribution | Median | 95th% |
|---|---|---|---|---|
| Flowback Water Spill Volume (L) 1 | 194 | Lognormal | 128.00 | 114,900.00 |
| Aluminum Concentration (mg/L) 2 | 220 | Lognormal | 0.29 | 2.80 |
| Antimony Concentration (mg/L) 2 | 186 | Triangular | 0.05 | 0.09 |
| Arsenic Concentration (mg/L) 2 | 219 | Logistic | 0.05 | 0.09 |
| Barium Concentration (mg/L) 2 | 220 | Lognormal | 164.00 | 20,009.00 |
| Benzene Concentration (mg/L) 2 | 123 | Lognormal | 0.01 | 0.17 |
| Benzo(a)pyrene Concentration (mg/L) 2 | 111 | Logistic | 0.01 | 0.01 |
| Beryllium Concentration (mg/L) 2 | 216 | Minimum Extreme | 0.02 | 0.01 |
| Cadmium Concentration (mg/L) 2 | 218 | Lognormal | 0.01 | 0.06 |
| Copper Concentration (mg/L) 2 | 219 | Lognormal | 33,500.00 | 0.45 |
| 1,2-Dichloroethane Concentration (mg/L) 2 | 143 | Lognormal | 0.01 | 0.02 |
| Heptachlor Concentration (mg/L) 2 | 73 | Pareto | 0.01 | 0.02 |
| Heptachlor Epoxide Concentration (mg/L) 2 | 73 | Lognormal | 0.01 | 0.02 |
| Iron Concentration (mg/L) 2 | 233 | Lognormal | 29.70 | 178.20 |
| Lead Concentration (mg/L) 2 | 212 | Lognormal | 0.03 | 0.20 |
| Manganese Concentration (mg/L) 2 | 220 | Lognormal | 2.17 | 12.40 |
| Nitrite as N Concentration (mg/L) 2 | 91 | Lognormal | 0.11 | 060.81 |
| Pentachlorophenol Concentration (mg/L) 2 | 111 | Weibull | 0.01 | 0.02 |
| Thallium Concentration (mg/L) 2 | 192 | Weibull | 0.02 | 0.28 |
| Radium-226 Concentration (PCi/L) 2 | 34 | Lognormal | 1.30 | 48,190.20 |
| Radium-228 Concentration (PCi/L) 2 | 30 | Lognormal | 0.23 | 4470.00 |
| Exposure Pathway | Maximum Exposure Duration (ED) | |
|---|---|---|
| Drinking Water Scenario | Swimming Scenario | |
| Total Ingestion Cancer Risk | 120 days | 16.5 years |
| Total Dermal Cancer Risk | 68 days | 55 days |
| Total Inhalation Cancer Risk | 1.2 years | 2.1 years |
| Total Risk (Ingestion + Dermal + Inhalation) | 39 days | 49 days |
| Total Radionuclide Cancer Risk | 8 h | 11 days |
| Exposure Pathway | Maximum Exposure Duration (ED) | |
|---|---|---|
| Drinking Water Scenario | Swimming Scenario | |
| Ingestion Hazard Quotient | 36 weeks | 56 years |
| Dermal Hazard Quotient | 17 years | 12 years |
| Inhalation Hazard Quotient | >100 years | >100 years |
| Hazard Index (Ingestion + Dermal + Inhalation) | 31 weeks | 9 years |
| Input Variables | Spearman’s ρ—Output Variables | |
|---|---|---|
| Total Cancer Risk | Total Hazard Index | |
| Flowback Water Spill Volume (L) 1 | 0.975 ** | 0.915 ** |
| Aluminum Concentration (mg/L) | 0.046 | 0.027 |
| Antimony Concentration (mg/L) | 0.005 | 0.000 |
| Arsenic Concentration (mg/L) | 0.016 | 0.032 |
| Barium Concentration (mg/L) | 0.043 | 0.184 ** |
| Benzene Concentration (mg/L) | 0.053 * | 0.034 |
| Benzo(a)pyrene Concentration (mg/L) | 0.061 * | 0.019 |
| Beryllium Concentration (mg/L) | 0.028 | 0.057 * |
| Cadmium Concentration (mg/L) | 0.012 | 0.039 |
| Copper Concentration (mg/L) | 0.007 | 0.016 |
| Dibromochloromethane Concentration (mg/L) | 0.034 | 0.055 * |
| 1,2-Dichloroethane Concentration (mg/L) | 0.048 | 0.057 * |
| Heptachlor Concentration (mg/L) | 0.025 | 0.021 |
| Heptachlor Epoxide Concentration (mg/L) | 0.008 | 0.014 |
| Iron Concentration (mg/L) | 0.006 | 0.017 |
| Lead Concentration (mg/L) | 0.019 | 0.018 |
| Manganese Concentration (mg/L) | 0.010 | 0.022 |
| Nitrite as N Concentration (mg/L) | 0.013 | 0.022 |
| Pentachlorophenol Concentration (mg/L) | 0.032 | 0.030 |
| Thallium Concentration (mg/L) | 0.023 | 0.157 ** |
| Vinyl chloride Concentration (mg/L) | 0.015 | 0.016 |
| Input Variables | Total Radionuclide Cancer Risk | |
| Flowback Water Spill Volume (L) 1 | 0.901 ** | |
| Radium-226 Concentration (PCi/L) | 0.362 ** | |
| Radium-228 Concentration (PCi/L) | 0.142 ** | |
© 2018 by the authors. Licensee MDPI, Basel, Switzerland. This article is an open access article distributed under the terms and conditions of the Creative Commons Attribution (CC BY) license (http://creativecommons.org/licenses/by/4.0/).
Share and Cite
Abualfaraj, N.; Gurian, P.L.; Olson, M.S. Assessing Residential Exposure Risk from Spills of Flowback Water from Marcellus Shale Hydraulic Fracturing Activity. Int. J. Environ. Res. Public Health 2018, 15, 727. https://doi.org/10.3390/ijerph15040727
Abualfaraj N, Gurian PL, Olson MS. Assessing Residential Exposure Risk from Spills of Flowback Water from Marcellus Shale Hydraulic Fracturing Activity. International Journal of Environmental Research and Public Health. 2018; 15(4):727. https://doi.org/10.3390/ijerph15040727
Chicago/Turabian StyleAbualfaraj, Noura, Patrick L. Gurian, and Mira S. Olson. 2018. "Assessing Residential Exposure Risk from Spills of Flowback Water from Marcellus Shale Hydraulic Fracturing Activity" International Journal of Environmental Research and Public Health 15, no. 4: 727. https://doi.org/10.3390/ijerph15040727
APA StyleAbualfaraj, N., Gurian, P. L., & Olson, M. S. (2018). Assessing Residential Exposure Risk from Spills of Flowback Water from Marcellus Shale Hydraulic Fracturing Activity. International Journal of Environmental Research and Public Health, 15(4), 727. https://doi.org/10.3390/ijerph15040727