‘Obesogenic’ School Food Environments? An Urban Case Study in The Netherlands

 ,
,
Abstract
1. Introduction
2. Materials and Methods
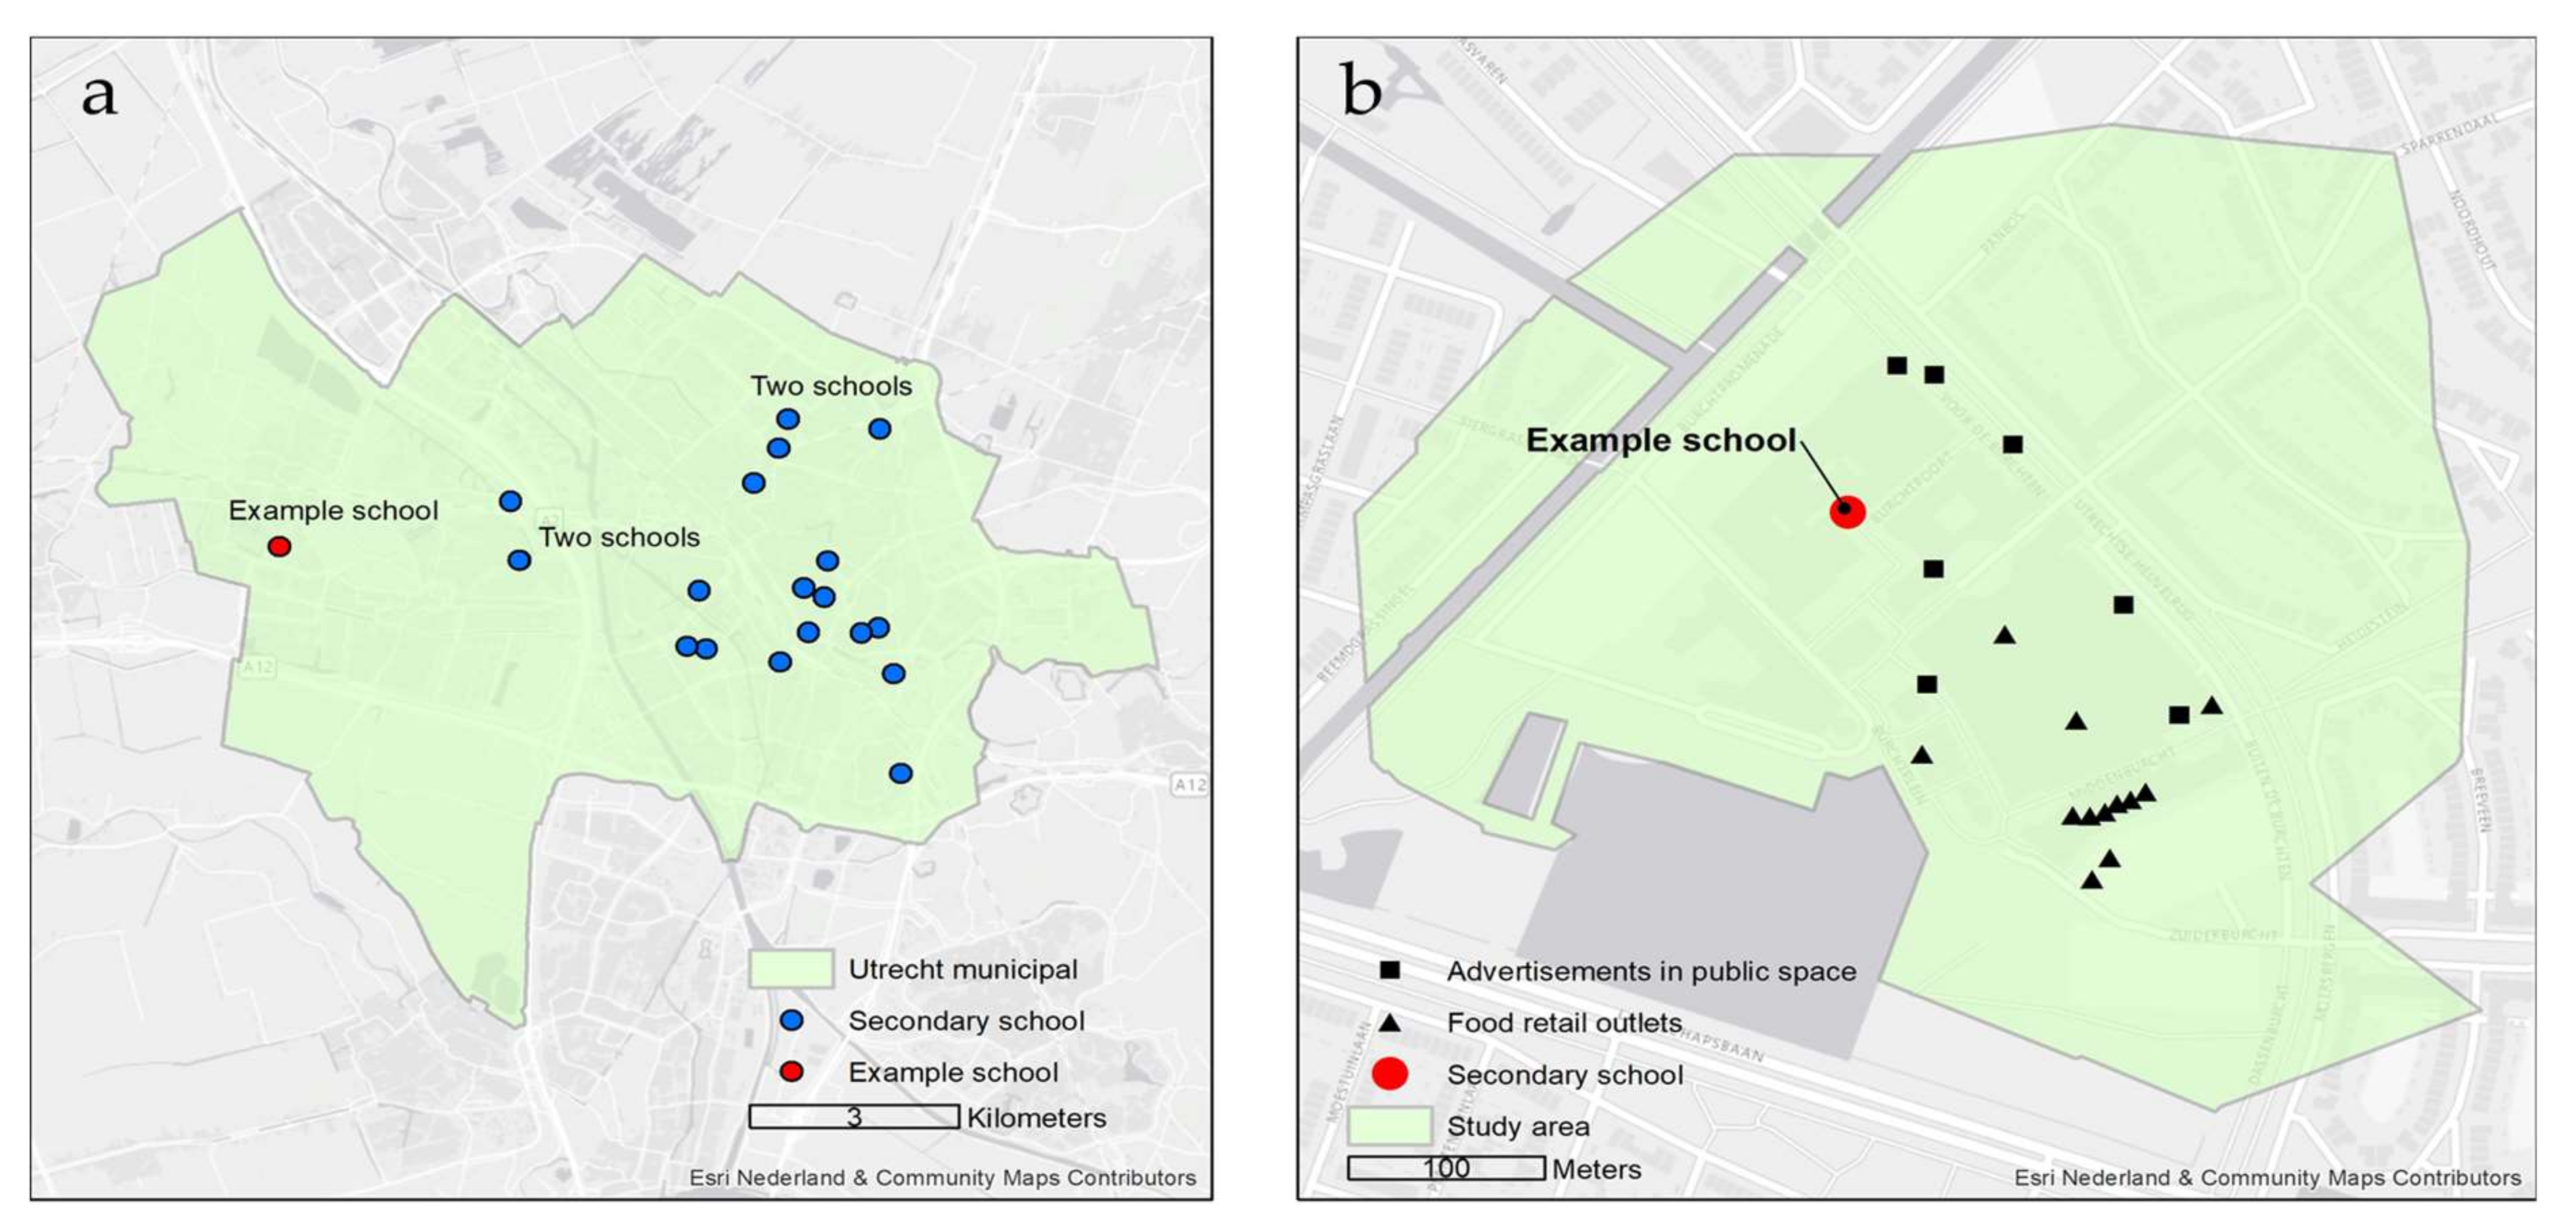
2.1. Study Design and Setting
2.2. Study Procedure
2.3. Data and Measures
2.3.1. Retail Food Outlets (Type and Healthiness)
2.3.2. Ready-to-Eat Food Assortment and In-Store Promotions
2.3.3. Public Food Advertisements
2.3.4. Neighborhood Socioeconomic Status and Commercialization
2.4. Spatial and Statistical Data Analysis
3. Results
3.1. Retail Outlets Selling Food
3.2. Ready-to-Eat Food Assortment
3.3. Public Food Advertisements
4. Discussion
5. Conclusions
Acknowledgments
Author Contributions
Conflicts of Interest
Appendix A. School Food Environmental Checklists
| Checklist—Ready-to-eat assortment for sale per retail outlet | ||
| Retail outlet: Locatus ID: | ||
| If not correct in Locatus enter name, type and ID and make picture in which location tag is on | ||
| Open during school hours (10 a.m.–15 p.m.) □ yes □ no (yes—continue/no—stop audit) | ||
| Unhealthy products (ready-to-eat) | For sale | Sales promotion |
| Savory pastries | □ yes □ no | □ yes □ no |
| Fried snacks and fries | □ yes □ no | □ yes □ no |
| Sweet and savory snacks (candy, crisps and chocolate) | □ yes □ no | □ yes □ no |
| Hamburgers/kebab | □ yes □ no | □ yes □ no |
| Pizza | □ yes □ no | □ yes □ no |
| Sugar sweetened beverages | □ yes □ no | □ yes □ no |
| Sport and energy drinks | □ yes □ no | □ yes □ no |
| Other, namely… | □ yes □ no | □ yes □ no |
| Healthy products (ready-to-eat) | For sale | Sales promotion |
| Fruit (and fruit salad) | □ yes □ no | □ yes □ no |
| Light (soft) drinks | □ yes □ no | □ yes □ no |
| Water | □ yes □ no | □ yes □ no |
| Vegetable snacks | □ yes □ no | □ yes □ no |
| Non-sugared dairy | □ yes □ no | □ yes □ no |
| Other, namely | □ yes □ no | □ yes □ no |
| Checklist—Public food advertisements | |
| ID: | |
| Type of advertisement: | |
| Are there foods or drinks promoted? □ yes □ no (yes—continue/no—stop audit) | |
| Ready to eat product □ yes □ no | |
| Take a picture of the food advertisement □ done | |
| Select the advertised food or drink from the list below ➔ | |
| Unhealthy products | Healthy products |
| □ Savory pastries | □ Fruit (or fruit salad) |
| □ Fried snacks and fries | □ Lite/diet (soft) drinks |
| □ Sweet and savory snacks (candy, crisps and chocolate) | □ Water |
| □ Hamburgers/kebab | □ Vegetable snacks |
| □ Pizza | □ Non-sugared dairy |
| □ Sugar sweetened beverages | |
| □ Sport and energy drinks | |
| □ not-ready to eat, namely | □ not-ready to eat, namely |
Appendix B. Food Outlet Availability, Differentiated by Neighborhood Socioeconomic Status and Commercialization

| Total | Neighborhood Socioeconomic Status | Neighborhood Commercialization | ||||||||
|---|---|---|---|---|---|---|---|---|---|---|
| Low | High | Low | High | |||||||
| Type (Score) | N | % | N | % | N | % | N | % | N | % |
| Fast-food (−4.9) | 18 | 15.7 | 8 | 28.6 | 10 | 11.5 | 3 | 18.8 | 15 | 15.3 |
| Grillroom(−4.8) | 4 | 3.5 | 2 | 7.1 | 2 | 2.3 | 0 | 0.0 | 4 | 4.1 |
| Liquor store (−4.6) | 6 | 5.2 | 2 | 7.1 | 4 | 4.5% | 1 | 6.3 | 5 | 0.0 |
| Petrol station (−4.5) | 1 | 0.9 | 0 | 0.0 | 1 | 1.1 | 1 | 6.3 | 0 | 0.0 |
| Chocolate store (−4.3) | 3 | 2.6 | 0 | 0.0 | 3 | 3.4 | 0 | 0.0 | 3 | 3.1 |
| Drugstore (−4.0) | 9 | 7.8 | 4 | 14.3 | 5 | 5.7 | 2 | 12.5 | 7 | 7.1 |
| Ice-cream store (−3.9) | 2 | 1.7 | 1 | 3.6 | 1 | 1.1 | 0 | 0.0 | 2 | 2.0 |
| Take away (−3.7) | 8 | 7.0 | 1 | 3.6 | 7 | 8.0 | 1 | 6.3 | 7 | 7.1 |
| Café-Restaurant (−1.9) | 6 | 5.2 | 0 | 0 | 6 | 6.8 | 0 | 0.0 | 6 | 6.1 |
| Lunchroom (−1.5) | 20 | 17.4 | 1 | 3.6 | 19 | 21.8 | 1 | 6.3 | 18 | 18.4 |
| Butcher (−0.4) | 2 | 1.7 | 0 | 0.0 | 2 | 2.3 | 1 | 6.3 | 1 | 1.0 |
| Delicacies (0.2) | 3 | 2.6 | 0 | 0.0 | 3 | 3.4 | 0 | 0.0 | 3 | 3.1 |
| Mini super (0.3) | 4 | 3.5 | 1 | 3.6 | 3 | 3.4 | 1 | 6.3 | 3 | 3.1 |
| Reform shop (1.0) | 2 | 1.7 | 0 | 0.0 | 2 | 2.3 | 0 | 0.0 | 2 | 2.0 |
| Bakery (1.2) | 8 | 7.0 | 2 | 7.1 | 6 | 6.9 | 1 | 6.3 | 7 | 7.1 |
| Coffee/tea store (1.3) | 4 | 3.5 | 0 | 0.0 | 1 | 1.1 | 0 | 0.0 | 4 | 4.1 |
| Asian Supermarket (1.5) | 1 | 0.9 | 0 | 0.0 | 1 | 1.1 | 0 | 0.0 | 1 | 1.0 |
| Supermarket (1.8) | 8 | 7.0 | 3 | 10.7 | 5 | 5.7 | 2 | 12.5 | 6 | 6.1 |
| Fish shop(2.8) | 2 | 1.7 | 0 | 0.0 | 2 | 2.3 | 1 | 6.3 | 1 | 1.0 |
| Green grocer (4.8) | 3 | 2.6 | 2 | 7.1 | 1 | 1.1 | 1 | 6.3 | 2 | 2.0 |
| Total | 114 | 100 | 28 | 100 | 87 | 100 | 17 | 100 | 97 | 100 |
Appendix C. Food Assortment, In-Store Food Promotions and Food Advertisements in Public Space, Differentiated by Neighborhood Socioeconomic Status and Commercialization.
| Ready-to-eat assortment | In-Store Promotion | Advertisements Public Space | ||||||||||
|---|---|---|---|---|---|---|---|---|---|---|---|---|
| Commercialization | Neighborhood Socioeconomic Status | Commercialization | Neighborhood Socioeconomic Status | Commercialization | Neighborhood Socioeconomic Status | |||||||
| Lower | Higher | Lower | Higher | Lower | Higher | Lower | Higher | Lower | Higher | Lower | Higher | |
| # of Shops | (N = 16) | (N = 98) | (N = 27) | (N = 87) | (N = 16) | (N = 98) | (N = 27) | (N = 87) | (N = 51) | (N = 88) | (N = 41) | (N = 96) |
| Unhealthy (% shops for sale) | ||||||||||||
| Savory Pastries | 56.3 | 53.6 | 37.0 | 59.8 | 50.0 | 26.8 | 21.4 | 32.2 | 18.8 | 14.5 | 25.0 | 12.1 |
| Fried Snacks and fries | 31.3 | 21.6 | 37.0 | 19.5 | 12.5 | 13.4 | 25.0 | 9.2 | 8.3 | 4.8 | 7.5 | 5.5 |
| Sweet and savory snacks (Candy, crisps and Chocolate) | 43.8 | 51.5 | 40.7 | 54.0 | 18.8 | 26.8 | 35.7 | 21.8 | 6.3 | 10.8 | 15.0 | 6.6 |
| Hamburgers/kebab | 31.1 | 29.9 | 33.3 | 29.9 | 25.0 | 14.4 | 7.1 | 18.4 | 18.8 | 8.4 | 22.5 | 7.7 |
| Pizza | 0.0 | 7.2 | 11.1 | 4.6 | 0.0 | 5.2 | 10.7 | 3.4 | 6.3 | 3.6 | 5.0 | 4.4 |
| Sugar sweetened beverages | 87.5 | 83.5 | 96.3 | 80.5 | 56.3 | 23.7 | 32.2 | 26.4 | 16.7 | 8.4 | 22.5 | 6.0 |
| Sport and Energy drinks | 50.0 | 52.3 | 66.7 | 35.6 | 6.3 | 6.2 | 14.3 | 3.4 | 0.0 | 1.2 | 2.5 | 0.0 |
| Healthy | ||||||||||||
| Fruit | 37.5 | 20.6 | 18.5 | 25.3 | 31.3 | 11.3 | 17.9 | 12.6 | 0.0 | 4.8 | 2.5 | 3.3 |
| Lite (soft) drinks | 87.5 | 75.3 | 88.9 | 73.6 | 50.0 | 23.7 | 28.6 | 26.4 | 2.1 | 3.6 | 7.5 | 1.1 |
| Water | 62.5 | 67.0 | 81.4 | 62.1 | 0.0 | 4.1 | 0.0 | 4.6 | 0.0 | 1.2 | 2.5 | 0.0 |
| Vegetable snacks | 18.8 | 11.3 | 11.1 | 12.6 | 6.3 | 6.2 | 3.6 | 6.9 | 4.2 | 4.8 | 10.0 | 2.2 |
| Dairy | 31.3 | 21.4 | 17.9 | 25.3 | 6.3 | 5.1 | 10.7 | 3.4 | 0.0 | 4.8 | 7.5 | 1.1 |
References
- World Health Organization Obesity and Overweight. Available online: http://www.who.int/mediacentre/factsheets/fs311/en/ (accessed on 15 November 2017).
- Hoeymans, N.; Melse, J.M.; Schoemaker, C.G. Gezondheid en Determinanten; Rijksinstituut voor Volksgezondheid en Milieu: Bilthoven, The Netherlands, 2010. [Google Scholar]
- Statistics Netherlands Lengte en Gewicht van Personen, Ondergewicht en Overgewicht; Vanaf 1981. Available online: http://statline.cbs.nl/StatWeb/publication/?DM=SLNL&PA=81565NED (accessed on 22 January 2018).
- Greves Grow, H.M.; Cook, A.J.; Arterburn, D.E.; Saelens, B.E.; Drewnowski, A.; Lozano, P. Child obesity associated with social disadvantage of children’s neighborhoods. Soc. Sci. Med. 2010, 71, 584–591. [Google Scholar] [CrossRef]
- Singh, G.K.; Siahpush, M.; Kogan, M.D. Rising Social Inequalities in US Childhood Obesity, 2003–2007. Ann. Epidemiol. 2010, 20, 40–52. [Google Scholar] [CrossRef] [PubMed]
- Ellaway, A.; Anderson, A.; Macintyre, S. Does area of residence affect body size and shape? Int. J. Obes. 1997, 21, 304–308. [Google Scholar] [CrossRef]
- Evans, J.M.; Newton, R.W.; Ruta, D.A.; MacDonald, T.M.; Morris, A.D. Socio-economic status, obesity and prevalence of Type 1 and Type 2 diabetes mellitus. Diabet. Med. 2000, 17, 478–480. [Google Scholar] [CrossRef] [PubMed]
- Gemeente Utrecht Overgewicht Bij Utrechtse Jeugd in Het Basisonderwijs. Available online: https://www.utrecht.nl/fileadmin/uploads/documenten/zorg-en-onderwijs/informatie-voor-zorgprofessionals/Factsheet_overgewicht_Utrechtse_jeugd_01.pdf (accessed on 20 September 2016).
- Vandevijvere, S.; Sushil, Z.; Exeter, D.J.; Swinburn, B. Obesogenic Retail Food Environments Around New Zealand Schools: A National Study. Am. J. Prev. Med. 2016, 51, e57–e66. [Google Scholar] [CrossRef] [PubMed]
- Glanz, K.; Sallis, J.F.; Saelens, B.E.; Frank, L.D. Healthy nutrition environments: Concepts and measures. Am. J. Health Promot. 2005, 19, 330–333. [Google Scholar] [CrossRef] [PubMed]
- Mensink, F.; Schwinghammer, S.A.; Smeets, A. The Healthy School Canteen programme: A promising intervention to make the school food environment healthier. J. Environ. Public Health 2012, 2012. [Google Scholar] [CrossRef] [PubMed]
- Huitink, M.; Poelman, M.P.; Seidell, J.C.; Dijkstra, C. The healthy supermarket coach: Effects of a nutrition peer education intervention in Dutch supermarkets in 12–14 year olds from lower vocational schools. BMC Public Health 2017. Submitted. [Google Scholar]
- Smith, D.; Cummins, S.; Clark, C.; Stansfeld, S. Does the local food environment around schools affect diet? Longitudinal associations in adolescents attending secondary schools in East London. BMC Public Health 2013, 13, 70. [Google Scholar] [CrossRef] [PubMed]
- Davis, B.; Carpenter, C. Proximity of fast-food restaurants to schools and adolescent obesity. Am. J. Public Health 2009, 99, 505–510. [Google Scholar] [CrossRef] [PubMed]
- Rossen, L.M.; Curriero, F.C.; Cooley-Strickland, M.; Pollack, K.M. Food availability en route to school and anthropometric change in urban children. J. Urban Health 2013, 90, 653–666. [Google Scholar] [CrossRef] [PubMed]
- Chiang, P.H.; Wahlqvist, M.L.; Lee, M.S.; Huang, L.Y.; Chen, H.H.; Huang, S.T.Y. Fast-food outlets and walkability in school neighbourhoods predict fatness in boys and height in girls: A Taiwanese population study. Public Health Nutr. 2011, 14, 1601–1609. [Google Scholar] [CrossRef] [PubMed]
- Swinburn, B.; Egger, G.; Raza, F. Dissecting Obesogenic Environments: The Development and Application of a Framework for Identifying and Prioritizing Environmental Interventions for Obesity. Prev. Med. (Baltim) 1999, 29, 563–570. [Google Scholar] [CrossRef] [PubMed]
- Kestens, Y.; Daniel, M. Social Inequalities in Food Exposure Around Schools in an Urban Area. Am. J. Prev. Med. 2010, 39, 33–40. [Google Scholar] [CrossRef] [PubMed]
- Thornton, L.E.; Lamb, K.E.; Ball, K. Fast food restaurant locations according to socioeconomic disadvantage, urban-regional locality, and schools within Victoria, Australia. SSM Popul. Health 2016, 2, 1–9. [Google Scholar] [CrossRef] [PubMed]
- Day, P.L.; Pearce, J. Obesity-promoting food environments and the spatial clustering of food outlets around schools. Am. J. Prev. Med. 2011, 40, 113–121. [Google Scholar] [CrossRef] [PubMed]
- Simon, P.A.; Kwan, D.; Angelescu, A.; Shih, M.; Fielding, J.E. Proximity of fast food restaurants to schools: Do neighborhood income and type of school matter? Prev. Med. (Baltim) 2008, 47, 284–288. [Google Scholar] [CrossRef] [PubMed]
- Zenk, S.N.; Powell, L.M. US secondary schools and food outlets. Health Place 2008, 14, 336–346. [Google Scholar] [CrossRef] [PubMed]
- Kelly, B.; Cretikos, M.; Rogers, K.; King, L. The commercial food landscape: Outdoor food advertising around primary schools in Australia. Aust. N. Z. J. Public Health 2008, 32, 522–528. [Google Scholar] [CrossRef] [PubMed]
- Walton, M.; Pearce, J.; Day, P. Examining the interaction between food outlets and outdoor food advertisements with primary school food environments. Health Place 2009, 15, 811–818. [Google Scholar] [CrossRef] [PubMed]
- Maher, A.; Wilson, N.; Signal, L. Advertising and availability of “obesogenic” foods around New Zealand secondary schools: A pilot study. N. Z. Med. J. 2005, 118, 10–20. [Google Scholar]
- Gebauer, H.; Laska, M.N. Convenience Stores Surrounding Urban Schools: An Assessment of Healthy Food Availability, Advertising, and Product Placement. J. Urban Health 2011, 88, 616–622. [Google Scholar] [CrossRef] [PubMed]
- Kelly, B.; King, L.; Jamiyan, B.; Chimedtseren, N.; Bold, B.; Medina, V.M.; De los Reyes, S.J.; Marquez, N.V.; Rome, A.C.P.; Cabanes, A.M.O.; Go, J.J.; Bayandorj, T.; Carlos, M.C.B.; Varghese, C. Density of outdoor food and beverage advertising around schools in Ulaanbaatar (Mongolia) and Manila (The Philippines) and implications for policy. Crit. Public Health 2015, 25, 280–290. [Google Scholar] [CrossRef]
- Hawkes, C. Sales promotions and food consumption. Nutr. Rev. 2009, 67, 333–342. [Google Scholar] [CrossRef] [PubMed]
- Gemeente Utrecht Kijkoponderwijs. Available online: http://www.kijkoponderwijs.nl/ (accessed on 29 September 2017).
- Huisman, O.; de By, R.A. Principles of Geographic Information Systems; The Internation Institue for Geo-Information Science and Earth Observation (ITC): Enschede, The Netherlands, 2009; ISBN 978-90-6164-269-5.
- Locatus Locatus Retail Outlet Explorer. Available online: http://locatus.com/en/application/retail-outlet-explorer/ (accessed on 1 November 2016).
- Glanz, K.; Sallis, J.F.; Saelens, B.E.; Frank, L.D. Nutrition Environment Measures Survey in Stores (NEMS-S). Development and Evaluation. Am. J. Prev. Med. 2007, 32, 282–289. [Google Scholar] [CrossRef] [PubMed]
- Frank, L.; Glanz, K.; McCarron, M.; Sallis, J.; Saelens, B.; Chapman, J. The spatial distribution of food outlet type and quality around schools in differing built environment and demographic contexts. Berkeley Plan. J. 2006, 19, 79–95. [Google Scholar]
- Vogel, C.; Lewis, D.; Ntani, G.; Cummins, S.; Cooper, C.; Moon, G.; Baird, J. The relationship between dietary quality and the local food environment differs according to level of educational attainment: A cross-sectional study. PLoS ONE 2017, 12, e0183700. [Google Scholar] [CrossRef] [PubMed]
- Thornton, L.E.; Kavanagh, A.M. Association between fast food purchasing and the local food environment. Nutr. Diabetes 2012, 2, e53. [Google Scholar] [CrossRef] [PubMed]
- Poelman, M.P. White Paper: Food Environment ‘Healthiness Scores’ for The Netherlands 2018. Unpublished work. 2018. [Google Scholar]
- Macdiarmid, J.I.; Wills, W.J.; Masson, L.F.; Craig, L.C.A.; Bromley, C.; McNeill, G. Food and drink purchasing habits out of school at lunchtime: A national survey of secondary school pupils in Scotland. Int. J. Behav. Nutr. Phys. Act. 2015, 12, 98. [Google Scholar] [CrossRef] [PubMed]
- Wheel of Five. Netherlands Nutrition Centre Netherlands Nutrition Centre. Available online: http://www.voedingscentrum.nl/nl/gezond-eten-met-de-schijf-van-vijf/wat-staat-er-in-de-vakken-van-de-schijf-van-vijf.aspx (accessed on 1 October 2016).
- Statistics Netherlands Neighborhood Statistics 2016. Available online: https://www.cbs.nl/ (accessed on 1 October 2017).
- Helbich, M.; Schadenberg, B.; Hagenauer, J.; Poelman, M. Food deserts? Healthy food access in Amsterdam. Appl. Geogr. 2017, 83, 1–12. [Google Scholar] [CrossRef]
- Leite, F.H.M.; De Carvalho Cremm, E.; De Abreu, D.S.C.; Oliveira, M.A.; Budd, N.; Martins, P.A. Association of neighbourhood food availability with the consumption of processed and ultra-processed food products by children in a city of Brazil: A multilevel analysis. Public Health Nutr. 2018, 21, 189–200. [Google Scholar] [CrossRef] [PubMed]
- Harris, J.L.; Schwartz, M.B.; Brownell, K.D. Marketing foods to children and adolescents: Licensed characters and other promotions on packaged foods in the supermarket. Public Health Nutr. 2010, 13, 409–417. [Google Scholar] [CrossRef] [PubMed]
- Ravensbergen, E.A.H.; Waterlander, W.E.; Kroeze, W.; Steenhuis, I.H.M. Healthy or Unhealthy on Sale? A cross-sectional study on the proportion of healthy and unhealthy foods promoted through flyer advertising by supermarkets in The Netherlands. BMC Public Health 2015, 15, 1–10. [Google Scholar] [CrossRef] [PubMed]
- Statistics Netherlands. The Netherlands Nutriotion Centre Prijsontwikkeling Voedingsmiddelen 2007. Available online: https://www.cbs.nl/nl-nl/maatwerk/2018/03/prijsontwikkeling-voedingsmiddelen (accessed on 22 January 2018).

| Type (Healthiness Score) | Total | Neighborhood Socioeconomic Status | ||||
|---|---|---|---|---|---|---|
| Low | High | |||||
| N | % | N | % | N | % | |
| Fast-food (−4.9) | 18 | 15.7 | 8 | 28.6 | 10 | 11.5 |
| Grillroom (−4.8) | 4 | 3.5 | 2 | 7.1 | 2 | 2.3 |
| Liquor store (−4.6) | 7 | 5.2 | 2 | 7.1 | 4 | 4.5 |
| Petrol station (−4.5) | 1 | 0.9 | 0 | 0.0 | 1 | 1.1 |
| Chocolate store (−4.3) | 3 | 2.6 | 0 | 0.0 | 3 | 3.4 |
| Drugstore (−4.0) | 9 | 7.8 | 4 | 14.3 | 5 | 5.7 |
| Ice-cream store (−3.9) | 2 | 1.7 | 1 | 3.6 | 1 | 1.1 |
| Take away (−3.7) | 8 | 7.0 | 1 | 3.6 | 7 | 8.0 |
| Café-restaurant (−1.9) | 6 | 5.2 | 0 | 0 | 6 | 6.8 |
| Lunchroom (−1.5) | 20 | 17.4 | 1 | 3.6 | 19 | 21.8 |
| Butcher (−0.4) | 2 | 1.7 | 0 | 0.0 | 2 | 2.3 |
| Delicacies (0.2) | 3 | 2.6 | 0 | 0.0 | 3 | 3.4 |
| Mini super (0.3) | 4 | 3.5 | 1 | 3.6 | 3 | 3.4 |
| Reform shop (1) | 2 | 1.7 | 0 | 0.0 | 2 | 2.3 |
| Bakery (1.2) | 8 | 7.0 | 2 | 7.1 | 6 | 6.9 |
| Coffee/tea store (1.3) | 4 | 3.5 | 0 | 0.0 | 1 | 1.1 |
| Asian supermarket (1.5) | 1 | 0.9 | 0 | 0,0 | 1 | 1.1 |
| Supermarket (1.8) | 8 | 7.0 | 3 | 10.7 | 5 | 5.7 |
| Fish shop (2.8) | 2 | 1.7 | 0 | 0.0 | 2 | 2.3 |
| Green grocer (4.8) | 3 | 2.6 | 2 | 7.1 | 1 | 1.1 |
| Total | 115 | 100 | 28 | 100 | 87 | 100 |
| Food Category | Assortment a | Discounted Assortment a | Public Advertisements b | |||
|---|---|---|---|---|---|---|
| n | % | n | % | n | % of Total Advertisements | |
| Unhealthy food products | - | - | - | - | 83 | 58.0% |
| Savory pastries | 62 | 53.9% | 34 | 29.6% | 21 | 13.0% |
| Fried snacks and fries | 27 | 23.5% | 15 | 13.0% | 8 | 5.0% |
| Sweet and savory snacks (candy, crisps and chocolate) | 58 | 50.4% | 29 | 25.2% | 12 | 7.5% |
| Hamburger/kebab | 36 | 31.3% | 18 | 15.7% | 16 | 9.94% |
| Pizza | 8 | 7.0% | 6 | 5.2% | 7 | 4.35% |
| Sugar-sweetened beverages | 97 | 84.3% | 32 | 27.8% | 18 | 11.20% |
| Sport and energy drinks | 50 | 43.5% | 7 | 6.1% | 1 | 0.62% |
| Healthy food products | - | - | - | - | 22 | 13.66% |
| Fruit | 27 | 23.5% | 16 | 13.9% | 4 | 2.48% |
| Light (soft) drinks | 89 | 77.4% | 31 | 27.0% | 5 | 3.11% |
| Water | 77 | 67.0% | 4 | 3.5% | 1 | 0.62% |
| Vegetable snacks | 14 | 12.2% | 7 | 6.1% | 6 | 3.73% |
| Dairy (without added sugar) | 22 | 19.1% | 1 | 0.9% | 6 | 3.73% |
| Other (not ready to eat) | - | - | - | - | 38 | 26.6% |
| Assortment | In-Store Promotion | Advertisements in Public Space | ||||
|---|---|---|---|---|---|---|
| Neighborhood Socioeconomic Status | ||||||
| Lower | Higher | Lower | Higher | Lower | Higher | |
| Unhealthy (in % shops for sale) | ||||||
| Savory pastries | 37.0 | 59.8 | 21.4 | 32.2 | 25.0 | 12.1 |
| Fried snacks and fries | 37.0 | 19.5 | 25.0 | 9.2 | 7.5 | 5.5 |
| Sweet and savory snacks (candy, crisps and chocolate) | 40.7 | 54.0 | 35.7 | 21.8 | 15.0 | 6.6 |
| Hamburgers/kebab | 33.3 | 29.9 | 7.1 | 18.4 | 22.5 | 7.7 |
| Pizza | 11.1 | 4.6 | 10.7 | 3.4 | 5.0 | 4.4 |
| Sugar-sweetened beverages | 96.3 | 80.5 | 32.2 | 26.4 | 22.5 | 6.0 |
| Sport and energy drinks | 66.7 | 35.6 | 14.3 | 3.4 | 2.5 | 0.0 |
| Healthy | ||||||
| Fruit | 18.5 | 25.3 | 17.9 | 12.6 | 2.5 | 3.3 |
| Lite (soft) drinks | 88.9 | 73.6 | 28.6 | 26.4 | 7.5 | 1.1 |
| Water | 81.4 | 62.1 | 0.0 | 4.6 | 2.5 | 0.0 |
| Vegetable snacks | 11.1 | 12.6 | 3.6 | 6.9 | 10.0 | 2.2 |
| Dairy (without added sugar) | 17.9 | 25.3 | 10.7 | 3.4 | 7.5 | 1.1 |
© 2018 by the authors. Licensee MDPI, Basel, Switzerland. This article is an open access article distributed under the terms and conditions of the Creative Commons Attribution (CC BY) license (http://creativecommons.org/licenses/by/4.0/).
Share and Cite
Timmermans, J.; Dijkstra, C.; Kamphuis, C.; Huitink, M.; Van der Zee, E.; Poelman, M. ‘Obesogenic’ School Food Environments? An Urban Case Study in The Netherlands. Int. J. Environ. Res. Public Health 2018, 15, 619. https://doi.org/10.3390/ijerph15040619
Timmermans J, Dijkstra C, Kamphuis C, Huitink M, Van der Zee E, Poelman M. ‘Obesogenic’ School Food Environments? An Urban Case Study in The Netherlands. International Journal of Environmental Research and Public Health. 2018; 15(4):619. https://doi.org/10.3390/ijerph15040619
Chicago/Turabian StyleTimmermans, Joris, Coosje Dijkstra, Carlijn Kamphuis, Marlijn Huitink, Egbert Van der Zee, and Maartje Poelman. 2018. "‘Obesogenic’ School Food Environments? An Urban Case Study in The Netherlands" International Journal of Environmental Research and Public Health 15, no. 4: 619. https://doi.org/10.3390/ijerph15040619
APA StyleTimmermans, J., Dijkstra, C., Kamphuis, C., Huitink, M., Van der Zee, E., & Poelman, M. (2018). ‘Obesogenic’ School Food Environments? An Urban Case Study in The Netherlands. International Journal of Environmental Research and Public Health, 15(4), 619. https://doi.org/10.3390/ijerph15040619