Abstract
Life cycle assessment (LCA) is a powerful methodology for the study of health impacts and public policies. We performed this study to quantitatively explain the potential health impacts on disability-adjusted life years (DALYs) of corn produced in Mexico and imported from the United States of America (U.S.) from 1984 until 2014. The processes are hybrid and organic corn production. The functional unit was defined as 1 ton of corn production. Results indicate a total value of 178,431, 244,175, and 283,426 DALYs of three decades: 1984–1993, 1994–2003, and 2004–2013, of Mexican production; the U.S. production and transport were also calculated, showing values of 29,815, 65,837, and 107,729 for the same three decades. Additionally, DALYs were obtained for the category of human health and climate change by functional unit: 802.31 (1984–1993), 802.67 (1994–2003), and 803.92 (2004–2013), and for imported corn transported to Mexico from the U.S., 859.12 (1984–2013). DALYs on human toxicity were obtained: 99.05 (1984–1993), 99.05 (1994–2003), and 99.04 (2004–2013), and for the corn imported and transported to Mexico from the U.S., 116.25 (1984–2013). Conclusions: Environmental and health impacts in terms of DALYs are higher when corn is imported versus the corn produced in Mexico. Environmental health and nominal corn cultivation and transport impacts have increased as a result of the North American Free Trade Agreement (NAFTA). Mexico needs to redefine its public policies to suffer less of an environmental burden from corn to ensure global environmental health and food security.
1. Introduction
Corn is the second most cultivated crop with the highest production worldwide with 615,533,645 Mton (millions of tons) [1]. The U.S. is the largest producer with 273,820,066 Mton, while Mexico produces 22,069,254 Mton. Corn is also the main crop and food base of Mexico, with 27% of agricultural land, comprised of 2.8 million Hectares of corn farmlands [2]. During the period of 1996–2006, the cultivation of corn occupied 51% of all cultivated and harvested lands, generating 7.4% of the total agricultural production, and representing 30% of the total value of production [3].
In recent years, there has been a growing concern about the sustainability of agricultural and food systems and the unforeseen effects on environment and human health [4]. Little has been done about the subject of NAFTA in relationship with the health and environmental impacts between both countries. For example, studies show that, for the U.S., the increase of exports to Mexico due to NAFTA represents 1% of its total corn production, with its associated environmental impacts, like the use of chemicals, water contamination due to runoff, unsustainable use of water for irrigation, the expansion of genetically modified corn, soil erosion and biodiversity loss. The main environmental impact for Mexico is the threat to agro biodiversity; the low prices of imported corn is causing a decrease in native corn production, which adds to the negative environmental effects from both sides of the border. This could have deeper impacts if the loss of agro diversity in Mexico is significant [5].
Since the implementation of NAFTA, the corn imports to Mexico from the U.S. have tripled, the price of the grain has lowered almost 50%, and between 2.5 and 3 million Mexican farm workers are facing increasing economic pressure [6]. Even though there is evidence about the negative effects between both nations regarding the growing corn importation, what is unknown are the global effects of NAFTA between both countries. The U.S. is the main exporter of corn to Mexico with 99.98%, followed by small quantities from Argentina, Brazil, Chile and Guatemala [7]. The corn studies in Mexico have been focused on a small scale, especially to small farmers—“those who lose with NAFTA”—that were excluded from support for production and market. Recently, most of the attention has been directed to those on a larger scale who have become the internal and principal providers of corn [8].
There is background information about life cycle assessment (LCA) and corn production in the U.S. In those studies, the environmental performance of the grain and stubble was evaluated by the location of the corn due to crop management, soil properties, and climatic conditions [9]; however, the global environmental impacts were not quantified. Until this day, the global effects that corn production entails, before and after the NAFTA agreement, are unknown.
In this article, we calculate, nominally, the effects on health, damages to the ecosystem, and the entailed resources, with a functional unit of 1 × 10¹⁶ tons of corn produced in Mexico and imported from the U.S. during the last three decades (1984–2013). The LCA allows us to quantify and identify the variables that are affecting the environment. Calculating corn production by a functional unit allows us to identify the normalized environmental impacts for this crop and to have a baseline for further LCA studies and better practices.
Our results underscore the particular attributes of corn production with its environmental impact in Mexico. Analyzing several types of corn; hybrid with chemicals and organic produced in Mexico, and hybrid corn that enters Mexico from the U.S. Our expectation is that this type of knowledge will contribute not only to new research about agricultural impacts that will benefit food safety in Mexico, but also for a better policy agenda that will be able to respond to future challenges in the world.
2. Materials and Methods
2.1. Impact Evaluation
This research followed the guidelines of the life cycle evaluation developed by the International Organization for Standardization (ISO) in the series ISO 14040 to 14044 [10,11]. The environmental, health and biodiversity impacts are calculated by the ReCiPe methodology [12], Endpoint H, and the World H/H by the software SIMA PRO S version 8 (PRé Consultants bv, Amesfoort, The Netherlands). The categories considered for the impact evaluation were the general categories of human health, ecosystems, and resources. Additionally, the particular categories for functional unit analysis were also obtained, which includes climate change, human health, ozone depletion, human toxicity, photochemical oxidant formation, particulate matter formation, ionizing radiation, climate change ecosystems, terrestrial acidification, freshwater eutrophication, terrestrial ecotoxicity, freshwater ecotoxicity, marine ecotoxicity, agricultural land occupation, urban land occupation, natural land transformation, metal depletion, and fossil depletion.
2.2. Description of the Analyzed Processes
An environmental profile of the three decades of corn production in Mexico was calculated: 1984–1993 (pre NAFTA), 1994–2003 (post NAFTA), and 2004–2013 (current situation). The proportions of hybrid corn, cultivated with chemicals, and organic corn were estimated with values proportioned for the Commission for Environmental Cooperation [13]. Estimations were taken from the VII Mexican Agricultural Census of 1991 to propose the distribution of the use of hybrid seeds by state. This distribution per state was then multiplied by the percentage using chemical fertilizers to obtain this data. This percentage was obtained for each Mexican state from statistics of the Agro-food and Fishing Information Service (SIAP for its acronym in Spanish) of the years 2011 and 2013 in the section: “Planted surface and harvest by Mexican federal entity, according to the use of chemical fertilizers”. An estimate of organic production by each Mexican state during all of the periods of national study was calculated by obtaining the difference between the entire hybrid corn production and the one that uses chemicals in crops (Appendix A); the difference being 26.94% of the organic corn produced in Mexico. A table by functional unit was then elaborated (see Appendix B). For this, we obtained the data of corn production in Mexico from the Ministry of Agriculture, Ranching, Rural Development, Fisheries, and Food Supply of Mexico [7].
The effects of U.S. production and its transport to Mexico were also evaluated. To obtain this, three states from the U.S. were selected to estimate all corn produced and transported to Mexico: Iowa, Illinois, and Indiana, which are located in the middle of the “corn golden belt of the U.S.” (see Table 1). To estimate the quantities that are imported to Mexico, percentages were taken and calculated by quantities and locations [14], assuming the following distribution for Mexican entries: Nuevo Laredo (73%), Matamoros (7%), and Veracruz (20%). Distances were considered on Table 1 for the analysis of imported corn from the U.S. to the center of Mexico and 1133 kilometers by train for hybrid corn produced in Mexico to be processed in Mexico. For this, the mean distance between the states with higher production and industrialization were considered (Sinaloa and Nuevo Leon, respectively) to the center of the country and 100 kilometers by truck for the non-hybrid, chemical-free corn. We consider the organic corn as a self-consumption item; thus, no transportation was considered for organic corn. Table 2 shows corn data, in tons, that were considered in the evaluation.
Table 1.
Routes and transportation means of the corn from the U.S. to Mexico.
Table 2.
Considered data for the impact evaluation.
For the water route, the kilometers by rail to the port of St. Louis, Missouri, and 2300 km by water to the port of Veracruz are considered. For the terrestrial route, the kilometers from the geographic center of each American state in a straight line to the corresponding entry point were considered: Nuevo Laredo or Matamoros, and from those points to the center of Mexico, at Mexico City. The total quantities of corn, in millions of tons, are denominated Absolute Data, and their impacts in health are called Total Values.
2.3. Analysis per Functional Unit
A product system is a set of energy connections, material, and unitary processes performing one or many defined functions [10]. For this study, the impact data from the last three decades of corn produced in Mexico and imported from the U.S., from 1984 until 2014 is grouped and normalized by functional unit (FU), which is defined as: “1 ton of corn grain produced”, and is analyzed by Endpoint (H), worldwide normalization (H/H).
2.4. Limitations of the System
We have excluded in the analysis, due to the lack of reliable data, the requirements of the corn production infrastructure. The normalization of the results is performed by the total absolute quantification (without normalization) of the three decades considered in this study.
3. Results
3.1. Inventory of the Life Cycle: Results from Absolute Data
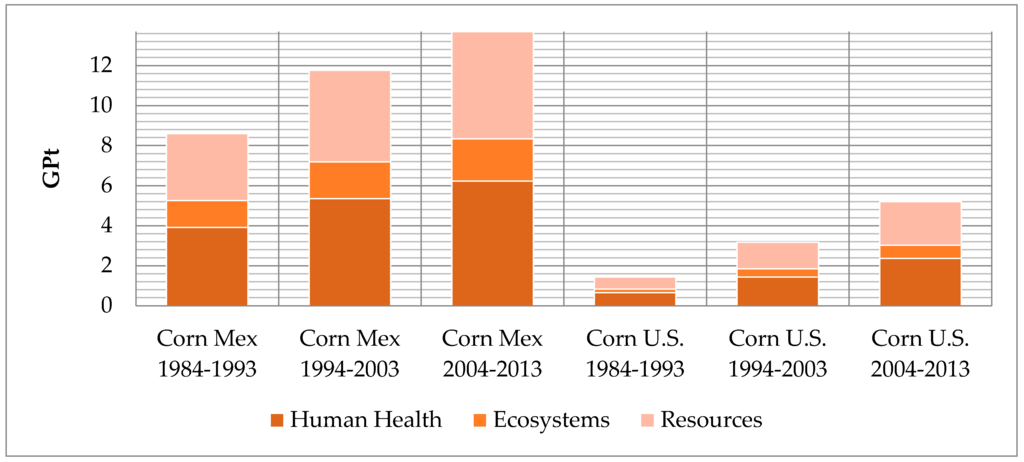
In our analysis presented in Figure 1 (in GPt), are the three impact categories described on Table 3: Human Health, Ecosystems, and Resources. The production in Mexico and the last three decades of imports are observed and found in the same graphic.
Figure 1.
Comparison of product station by the ReCiPe Endpoint (H) V1.10/World ReCiPe H/H/single-score method.
Table 3.
Impact results derived from total quantities of Mexican and imported corn for the last three decades of study derived from total values.
3.2. Results by Functional Unit
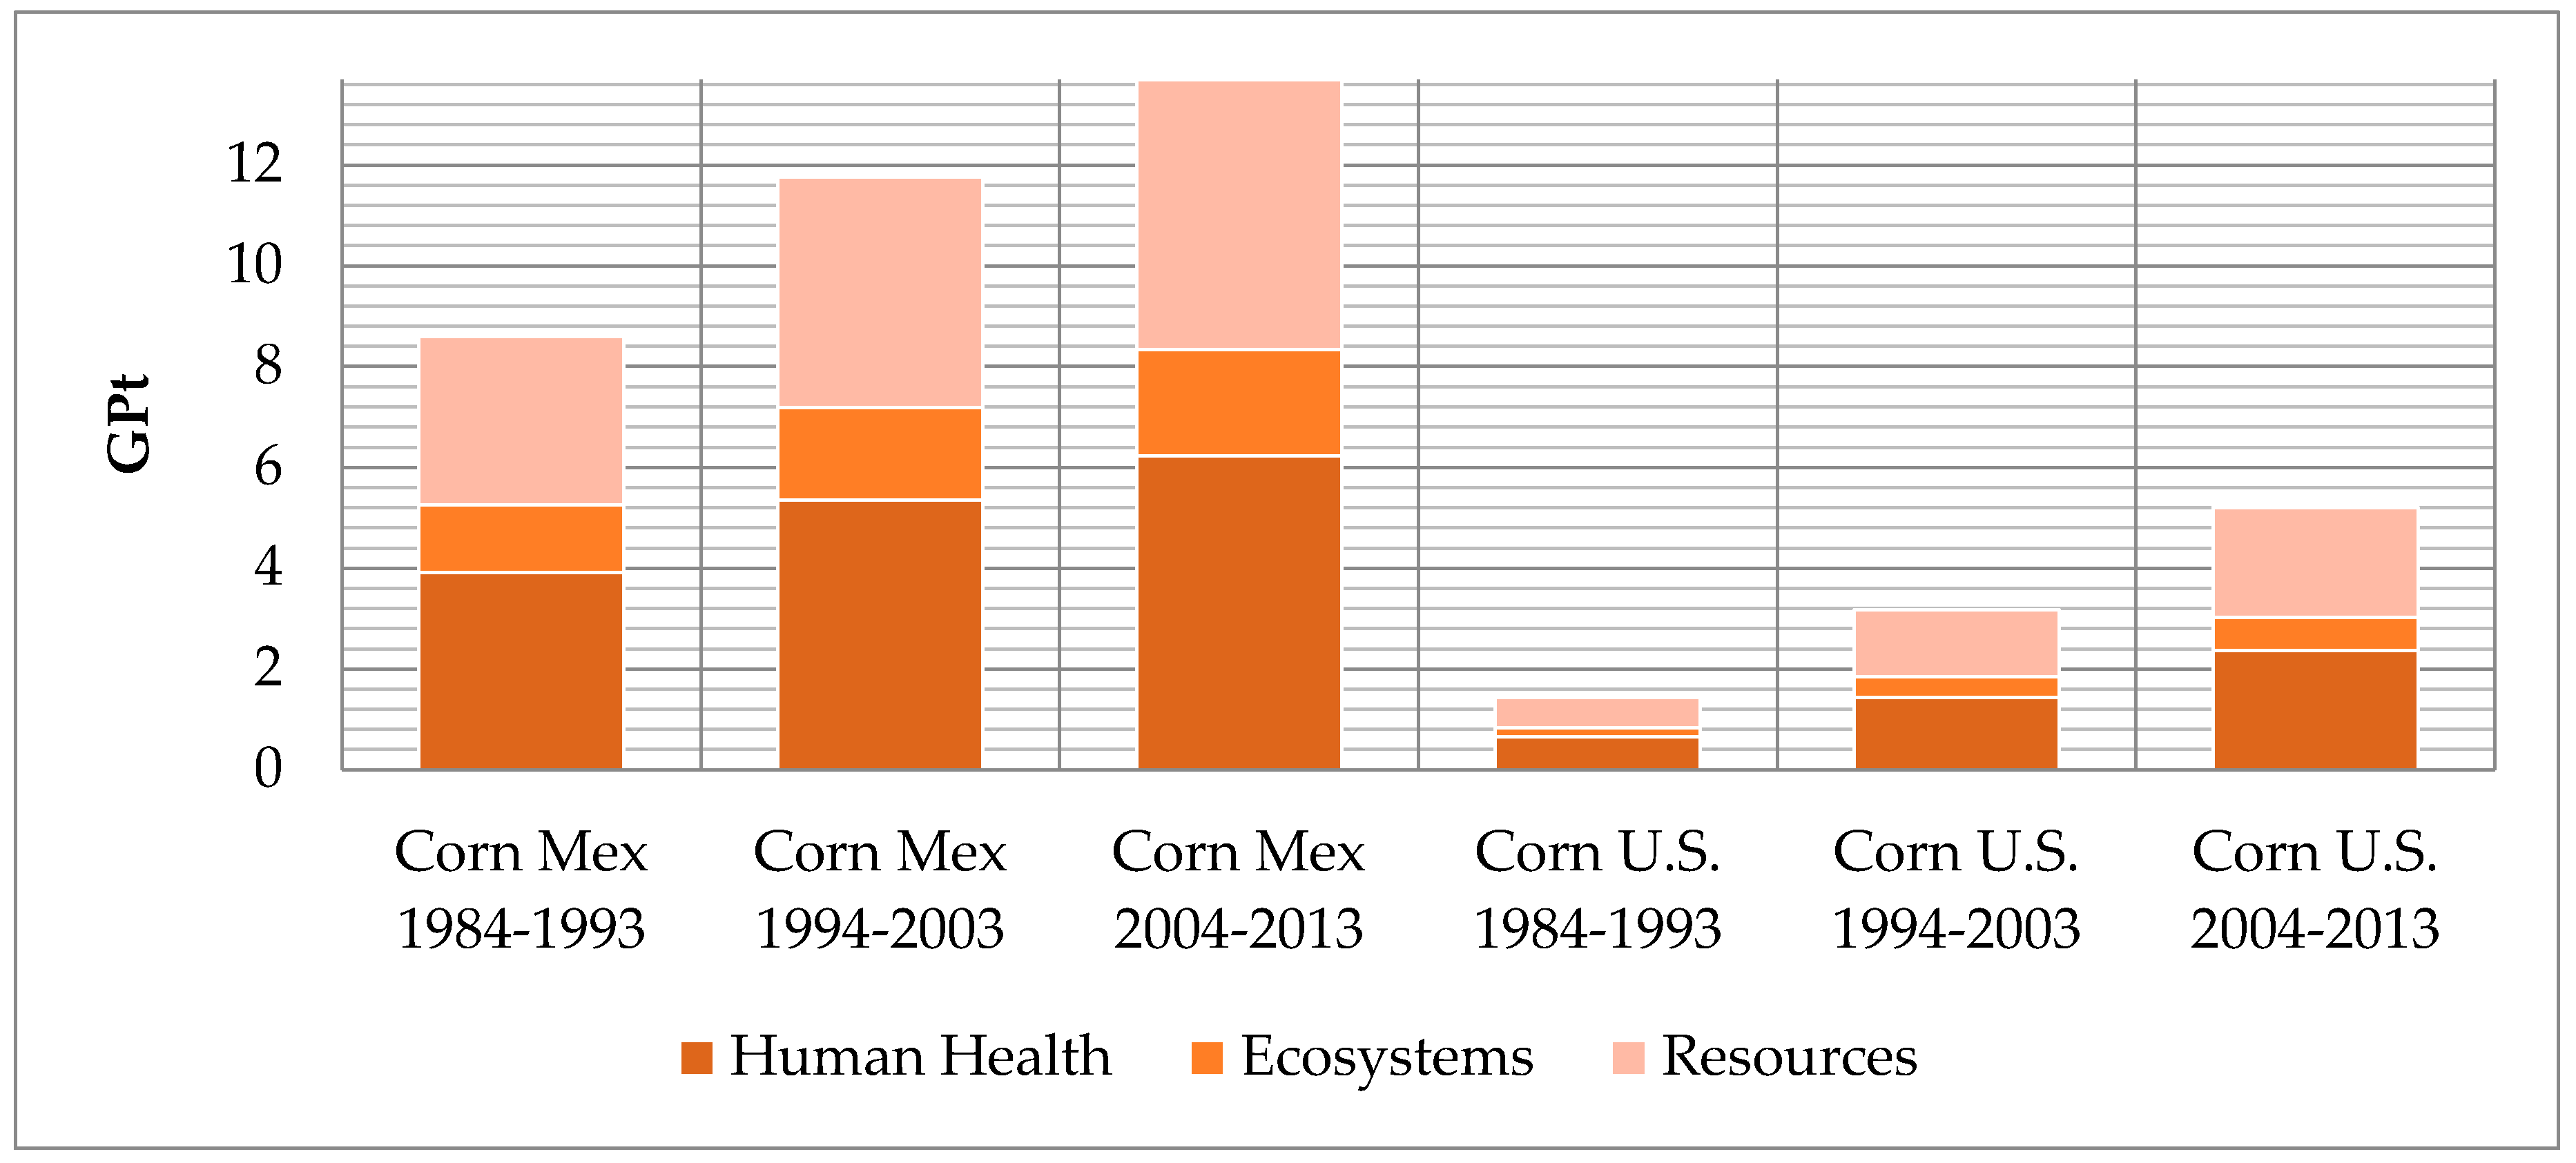
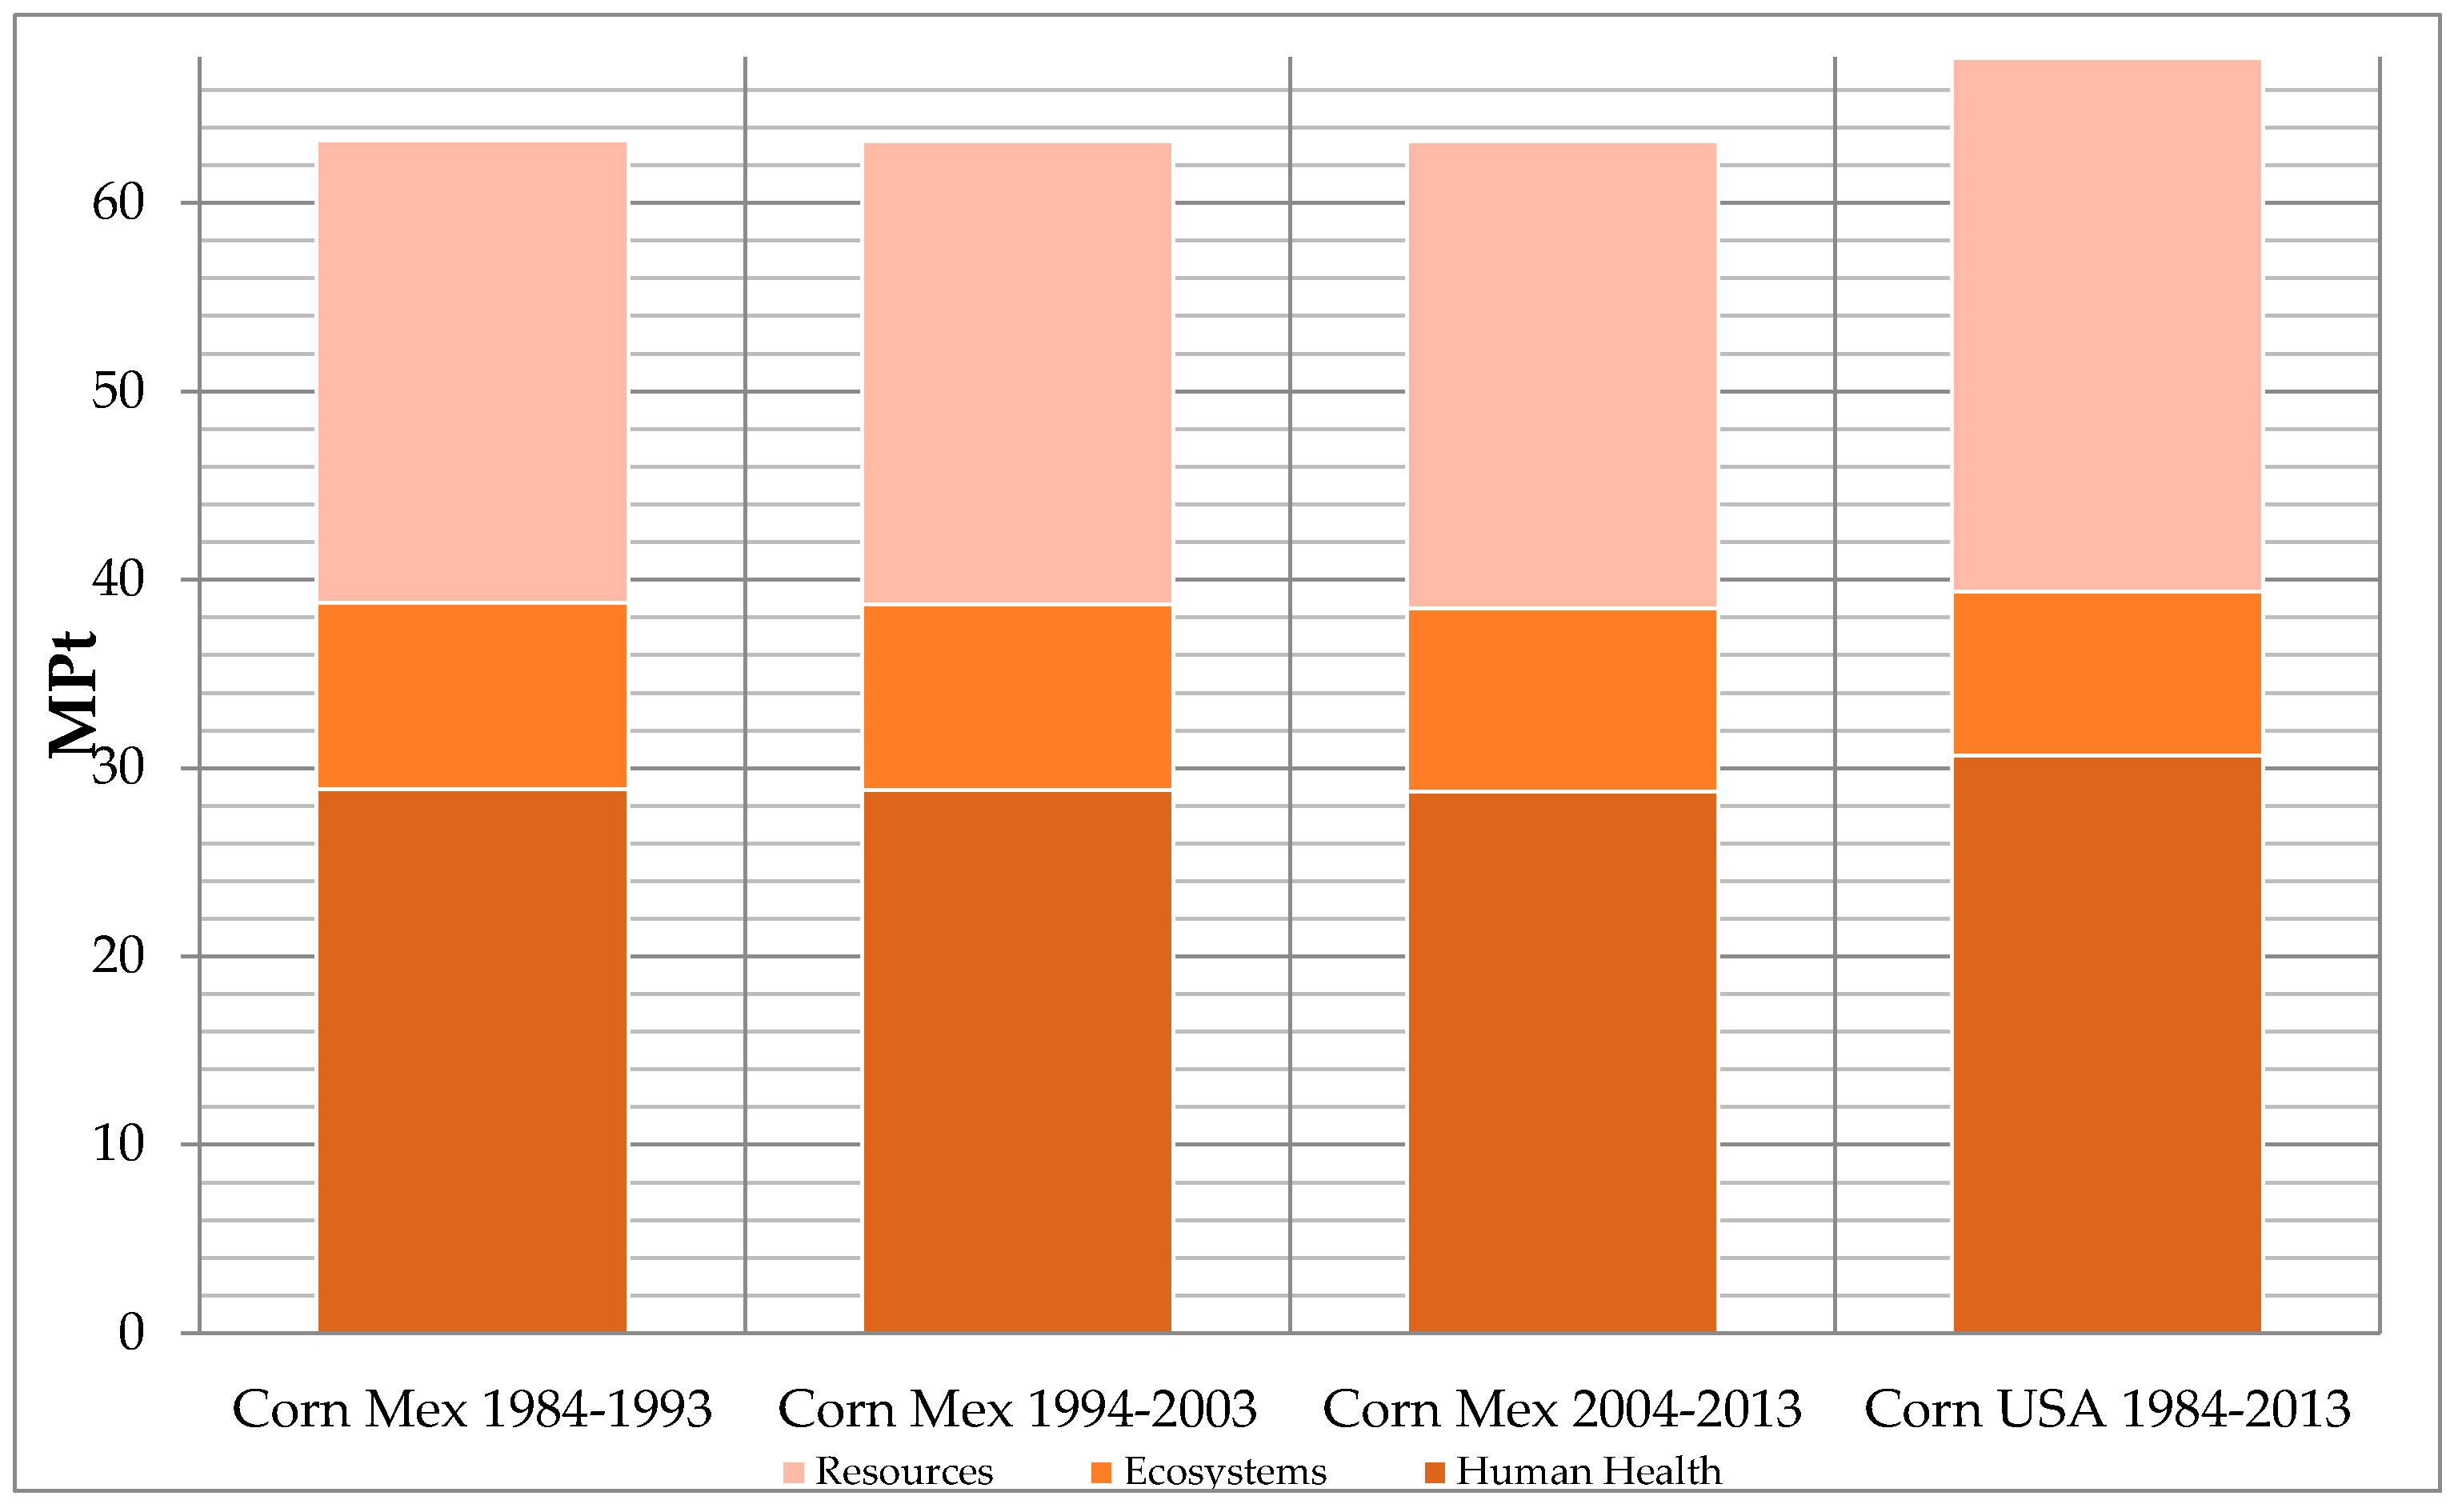
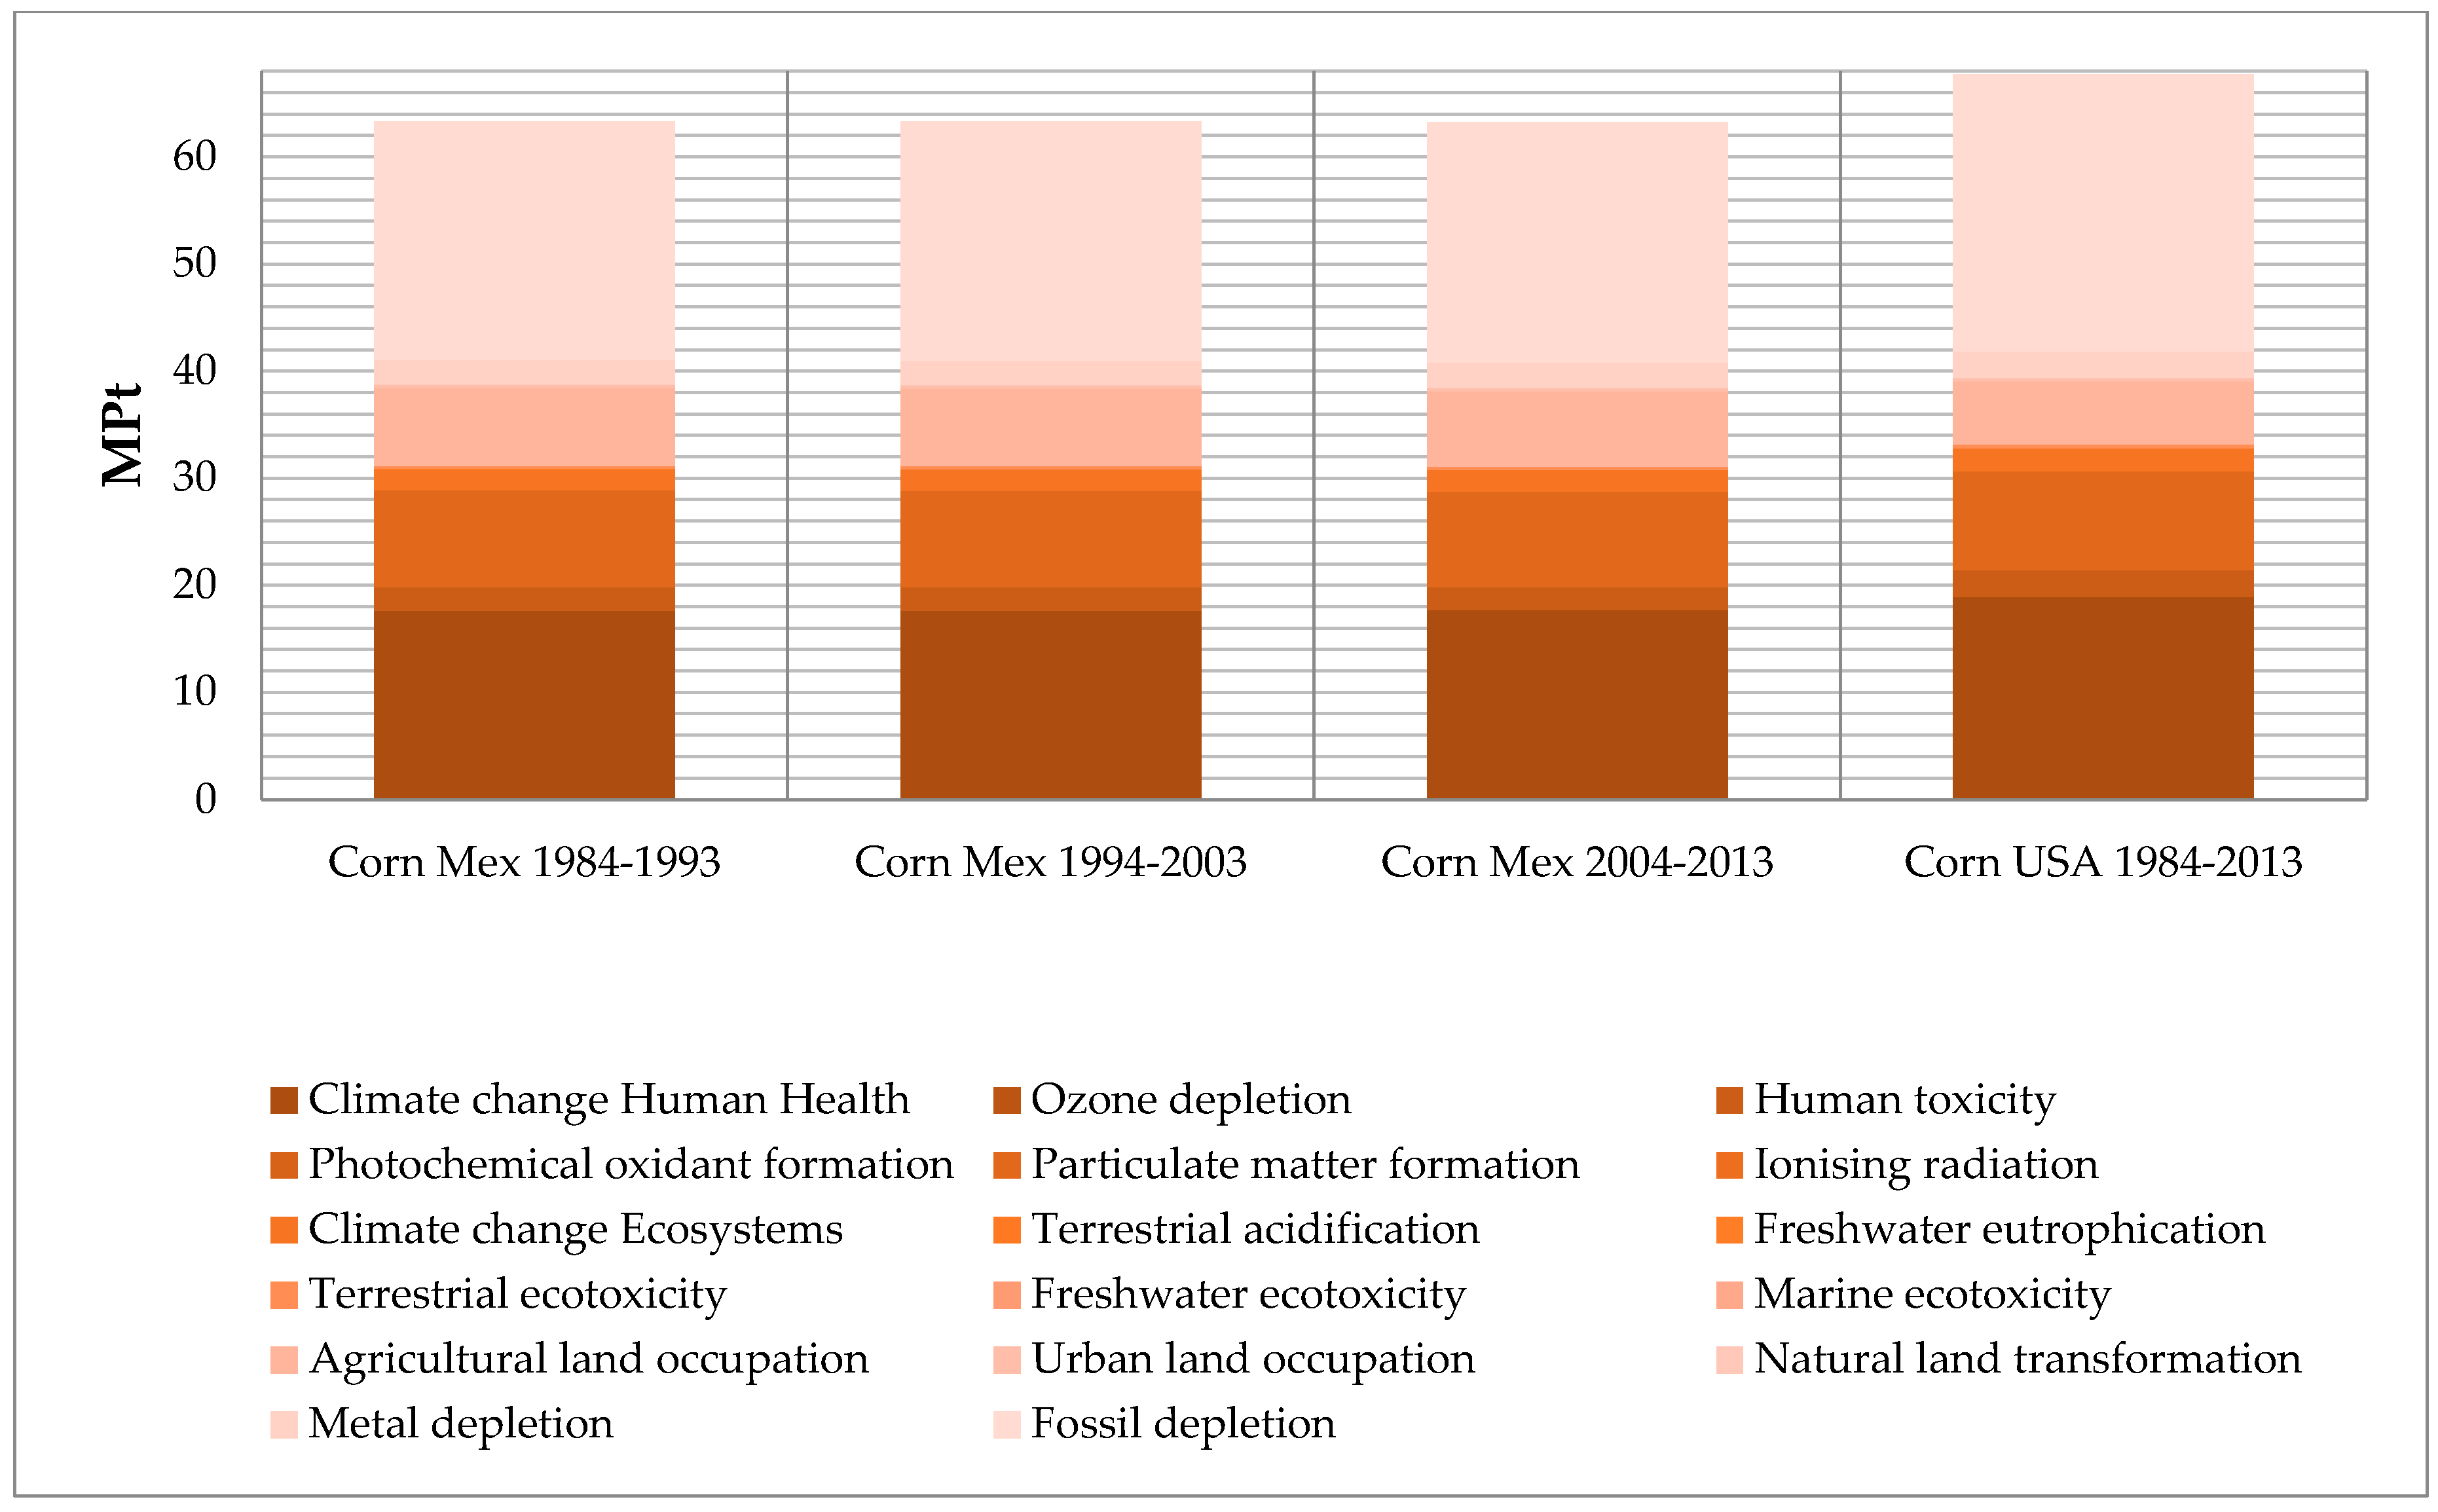
The total impact values by functional unit of Mexican-produced corn, and that imported from the U.S., are presented on Table 4. The data of results by functional unit and the data-by-impact category is shown in Figure 2 and Figure 3 respectively. For the data-by-impact category there is a total value of (63.30, 63.29, and 63.26) milipoints (MP) for each of the last three decades of Mexican production, while the U.S. production and its transportation is 67.71 MP.
Table 4.
Results by functional unit.
Figure 2.
Life cycle analysis normalized by functional unit by the ReCiPe Endpoint (H) V1.10/World ReCiPe H/H/single-score method.
Figure 3.
MP Graph by impact category normalized by functional unit by the ReCiPe Endpoint (H) V1.10/World ReCiPe H/H/single-score method.
The impacts per functional unit of the production in Mexico remained the same for all three decades due to the assumption, according to the authors, that for 1 ton of corn produced in Mexico, the proportion of production remains the same for the following: hybrid corn, non-hybrid corn using chemicals, and organic corn. On the other hand, according to the results on hybrid corn exported from the U.S. to Mexico, the impacts remain the same for the three decades, since the corn that was imported was hybrid only (plus its transport to Mexico), and the functional unit also being 1 ton of hybrid corn.
4. Discussion
The results show two main findings:
- The total values of corn production were quantified for each impact; corn is the base of Mexican food and provides food security to this country. The maximum in the last decade of corn cultivation in Mexico was found to be 13.6 GPt. This data and analysis is a baseline and reference to quantify the impacts of other established crops in Mexico. We did not find any other documented analysis in Mexico of crop life cycle to date. Sugar cane is still the highest cultivated crop worldwide and is followed closely by corn, then by other crops, such as sorghum, oranges, wheat, banana, tomato, and others. Therefore, corn studies are significant for places like Latin America where corn is the main food supply.
- The analysis regarding functional units shows that the environmental impact representing the imports is 5 MP over the maximum values of corn that can be produced in Mexico (see Figure 2). This indicates that imported corn causes more damage to health, environment, and resources than national production and its internal transportation would entail. Most cultivated corn in Mexico is “white” and it is utilized to produce tortillas and other food products for direct human consumption. This contrasts with the “yellow” hybrid corn that is produced in the US and imported to Mexico, being the only source of imported yellow corn [15,16]. The yellow corn is commonly used as a feed grain in beef cattle diets throughout the US [17,18]. According to [19], 90 to 95 percent of cornstarch is produced using corn imported from the U.S. Tortillas are made with this cornstarch. There is no evidence of increased digestibility or nutritional value of white or yellow corn, but consumers may have resistance to accept yellow corn due to quality problems. This is also due to the knowledge that, over the years, cumulative investment in corn improvement research has been far greater for yellow corn because it is the dominant germplasm adapted to temperate environments in the developed world [20]. The ReCiPe endpoint impact through 1984–2013 in Mexico have remained on the same level because the functional unit is 1 ton of production. However, for hybrid corn exported from the U.S. to Mexico in the three decades, an increase of impacts due to transportation is observed. Transport has a very significant global impact.
One limitation of this study is the missing quantification of the yield. Regarding the strength of the findings, there is data that indicates that white corn is still dominating the production of corn grain in Mexico (national is 91% white, 8.5% yellow, and 0.5% in the other two categories) [21]. This is significant given the health implications that the importation of yellow corn had since 1984 and by the nature of imported yellow corn, which is conceived for another market not specifically for human consumption. Since NAFTA was introduced, we found that, by functional unit, the impacts are lessened by producing corn in Mexico than to produce and transport the imported corn from the U.S.; additionally, it was found that the production, by functional unit, in Mexico is more sustainable than importing the corn from the U.S. It is clear that transporting corn from large distances has a substantial impact. The key political questions are now focused on how to reduce these impacts utilizing a variety of taxes, incentives, and mechanisms for corn in Mexico. It will be necessary to make sure that new political reforms are promoted that push for healthy food production, while externalities in agriculture and food push to be lessened every day. This also implies that the impacts of different food products that are commonly used in Mexico and Latin America can be performed in future studies. Furthermore, different cultivation process/transportation methods can be proposed to improve better practices in agriculture.
There are also some social and public policy implications that should be considered due to the findings in this study. These findings are supported by the interest of the Mexican country to reduce corn importations, and to cater its own consumption with national production in the years to come. For this, it is necessary to increase corn production, giving the producers access to appropriate technologies, including better seeds [22]. There is great aptitude to cultivate corn for human consumption in Mexico. For example, 63.1% of the national surface presents some grade of suitability for corn production [23]. The majority of corn production units in Mexico are at the small and medium scale, and they operate in less than 50% of their full potential. Meanwhile, there is evidence that suggests that Mexico could increase its annual production from 23 to 33 million tons in a period of 10–15 years, which would eliminate the annual deficit of 10 million tons annually [24].
The changes in agricultural policies impact directly on dietary patterns and health-related conditions. Corn production in the U.S. is subsidized in order to produce, among others, high-fructose syrup and hydrogenated fats that are widely used in the making of processed food products [25]. A positive correlation between agricultural subsidies and the prevalence of obesity has also been observed [26]. In Latin America, changes in the production of corn have been associated negatively with cardiovascular health [27] and other diet-related chronic diseases [28].
Regarding the sustainable background of NAFTA in agriculture, we have to understand that the agricultural liberalization is strategic and important from an environmental perspective: no other sector exhibits as close a relationship with the environment as terrestrial farming. Part of the results in this paper show that categories like climate change and human health, particulate matter formation, agricultural land occupation, and fossil depletion have the largest impact by functional unit analysis. NAFTA has contributed directly to a 1–2 percent increase in annual gross emissions of carbon monoxide and sulfur dioxide due to changes in the petroleum, base metals, and transportation equipment sectors [29].
Increased corn exports from the U.S. resulted in an increase of 77,000 tons of nitrogen, phosphorus, and potassium-based loadings to U.S. waterways, with concentrated emissions in the already heavily-polluted Mississippi River Delta [30,31].
With the argument of the need for food security, NAFTA was permitted by the Mexican government. Fees were forgone and corn was imported practically without protection. Fees were not reinstated until the year 2000 [32,33]. To constrain the cost of corn, during the past two decades, the government created free trade programs and restricted imports to maintain the high domestic market price [34]. In this situation, if done rapidly, the liberalization of the agricultural trade could disrupt Mexico’s rural labor market [35,36]. If Mexico eliminates farm supports and allows import competition, Mexico’s corn sector would collapse, which will make the low-income communities and the small farmers who cultivate corn for self-consumption the most vulnerable.
5. Conclusions
The most probable scenario for the immediate future is that nothing will change because NAFTA is still active and it will not represent any risk for the food sovereignty of the US by exporting 1% of its production to Mexico. However, some changes could be proposed, such as those caused by an energy or petroleum crisis, including the mindfulness of the severity of climate change, lack of food, or the high costs of the actual systems.
Mexico relinquished its sovereignty over food policy and has shown limited capability or willingness to deal with the challenges of the food crisis in recent years. It will be necessary to adopt a more inclusive agricultural policy; the present context of uncertainty in the international grain market and negative climate effects underline the vulnerability of the food supply after these two decades of the neoliberal corn regime.
Another strategy for the Mexican State should be to rethink the businesses throughout the supply chain, which need different patterns of land use to supply consumers in local markets.
Acknowledgments
To the Center for Health and the Global Environment. Harvard TH Chan School of Public Health, to his Director John D. Spengler and to the University of Colima in Mexico for the support for the materialization of this research.
Author Contributions
Oliver Mendoza-Cano and Ramon Alberto Sánchez-Piña conceived and designed the experiments; Alvaro Jesús González-Ibarra performed the experiments; Efren Murillo-Zamora analyzed the data; Ramon Alberto Sánchez-Piña contributed reagents/materials/analysis LCA tools; Oliver Mendoza-Cano and Cynthia Monique Nava-Garibaldi wrote the paper.
Conflicts of Interest
The authors declare no conflict of interest. The founding sponsors had no role in the design of the study; in the collection, analyses, or interpretation of data; in the writing of the manuscript, and in the decision to publish the results.
Appendix A
Table A1.
Produced Corn Grain by Federal Entity in Mexico 1984–2013.
Appendix B
Table B1.
Analysis by Functional Unit.
References
- FAO (Food and Agriculture Organization of the United Nations). Statistics 2014. Available online: http://faostat.fao.org/site/339/default.aspx (accessed on 22 July 2015).
- INEGI (Instituto Nacional de Estadística y Geografía). Censo Agrícola, Ganadero y Forestal 2007. Available online: http://www.inegi.org.mx/est/contenidos/proyectos/Agro/ca2007/Resultados_Agricola/default.aspx (accessed on 3 July 2015).
- SAGARPA (Secretaría de Agricultura, Ganadería y Pesca). Situación Actual y Perspectivas del Maíz en México 1996–2012; SAGARPA: Mexico City, Mexico, 2015. [Google Scholar]
- Pretty, J.; Ball, A.; Lang, T.; Morison, J. Farm costs and food miles: An assessment of the full cost of the UK weekly food basket. Food Policy 2005, 30, 1–19. [Google Scholar] [CrossRef]
- Ackerman, F.; Wise, T.; Ney, L.; Flores, R. Free Trade, Corn, and the Environment: Environmental Impacts of U.S.—Mexico Corn Trade under NAFTA. Available online: http://www.ase.tufts.edu/gdae/pubs/wp/03-06-naftacorn.pdf (accessed on 27 July 2015).
- Nadal, A.; Wise, T. The Environmental Costs of Agricultural Trade Liberalization: Mexico-US Maize Trade under NAFTA; Working Group on Development and Environment in the Americas: Medford, MA, USA, 2004. [Google Scholar]
- SIAP (Servicio de Información Agroalimentaria y Pesquera). Producción Agropecuaria y Pesquera 2015. Available online: http://www.siap.gob.mx/produccion-agropecuaria/ (accessed on 27 July 2015).
- Appendini, K. Reconstructing the maize market in rural Mexico. J. Agrar. Chang. 2014, 14, 1–25. [Google Scholar] [CrossRef]
- Kim, S.; Dale, B.; Jenkins, R. Life cycle assessment of corn grain and corn stover in the United States. Int. J. Life Cycle Assess. 2009, 14, 160–174. [Google Scholar] [CrossRef]
- ISO (International Organization for Standardization). Environmental Management: Life Cycle Assessment, Principles and Framework ISO 14040; ISO: Geneva, Switzerland, 2006. [Google Scholar]
- ISO (International Organization for Standardization). Quality Management Systems: Requirements ISO 9001; ISO: Geneva, Switzerland, 2008. [Google Scholar]
- Goedkoop, M.; Heijungs, R.; Huijbregts, M.; De Schryver, A.; Struijs, J.; Van Zelm, R. ReCiPe 2008, A life Cycle Impact Assessment Method Which Comprises Harmonised Category Indicators at the Midpoint and the Endpoint Level. Available online: http://www.lcia-recipe.net/ (accessed on 24 June 2015).
- Comisión de Cooperación Ambiental. Evaluación de los Efectos Ambientales del Tratado de Libre Comercio de América del Norte Marco de Trabajo Analítico (Fase II) y Estudios Temáticos. Estudio Temático 1: El Maíz en México: Algunas Implicaciones Ambientales del Tratado de Libre Comercio de América del Norte; Comisión de Cooperación Ambiental: Montréal, QU, Canada, 1999; pp. 85–182. [Google Scholar]
- Adcock, F.; Rosson, C.; Varela, A. Tracking US Grain and Soybean Exports in Mexico 2007. Cooperative Agreement #12-25-A-4501 between Agricultural Marketing Service/USDA and Texas Agricultural Experiment Station. 2015. Available online: http://cnas.tamu.edu/AMS%20Final%20Export%20Report.pdf (accessed on 26 June 2015).
- Polanco-Jaime, A.; Flores-Méndez, T. Bases Para una Política de I& D e Innovación de la Cadena de Valor del Maíz; Foro Consultivo y Científico, A.C.: Mexico DF, Mexico, 2008. [Google Scholar]
- Mejia, M.; Peel, D. White corn and yellow corn production in Mexico: Food versus feed? In Analysis & Comments; Livestock Marketing Information Center State Extension Services in Cooperation with USDA: Lakewood, CO, USA, 2009. [Google Scholar]
- Lardy, G. Feeding Corn to Beef Cattle. North Dakota State University. Animal Sciences Department. (AS1238 (Revised). Available online: https://www.ag.ndsu.edu/publications/livestock/feeding-corn-to-beef-cattle (accessed on 15 May 2015).
- Lehman, K. Agriculture. In NAFTA’s First Year: Lessons for the Hemisphere; Institute for Policy Studies: Washington, DC, USA, 1995. [Google Scholar]
- Yuñez-Naude, A.; Juarez-Torres, M.; Bárcenas-Paredes, F. Productive efficiency in agricultural corn production in Mexico. In Proceedings of the International Association of Agricultural Economic Conference, Gold Coast, Australia, 12–28 August 2006.
- Food and Agricultural Organization of the United Nations (FAO). White Maize: A Traditional Food Grain in Developing Countries; FAO: Rome, Italy, 1997. [Google Scholar]
- Sweeney, S.; Steigerwald, D.; Davenport, F.; Eakin, H. Mexican maize production: Evolving organizational and spatial structures since 1980. Appl. Geogr. 2013, 39, 78–92. [Google Scholar] [CrossRef]
- Donnet, M.; Lopez, D.; Arista, J.; Carrion, F.; Hernandez, V.; Gonzalez, A. El Potencial de Mercado de Semillas Mejoradas de Máiz en México; International Maize and Wheat Improvement Center (CIMMYT): Mexico City, Mexico, 2012. [Google Scholar]
- Monterroso-Rivas, A.; Conde-Álvarez, C.; Rosales-Dorantes, G.; Gómez-Díaz, J.; Gay-García, C. Assessing current and potential rainfed maize suitability under climate change scenarios in México. Atmósfera 2011, 24, 53–67. [Google Scholar]
- Turrent-Fernández, A.; Wise, T.; Garvey, E. Factibilidad de Alcanzar el Potencial Productivo de Maíz de México (Mexican Rural Development Research Report No. 24). Available online: http://www.ase.tufts.edu/gdae/Pubs/wp/12-03TurrentMexMaizeSpan.pdf (accessed on 13 July 2015).
- Fields, S. The fat of the land: Do agricultural subsidies foster poor health? Environ. Health Perspect. 2004, 112, A820–A823. [Google Scholar] [CrossRef] [PubMed]
- Franck, C.; Grandi, S.M.; Eisenberg, M.J. Agricultural subsidies and the American obesity epidemic. Am. J. Prev. Med. 2013, 45, 327–333. [Google Scholar] [CrossRef] [PubMed]
- Hawkes, C. Agricultural and food policy for cardiovascular health in Latin America. Prev. Control 2006, 2, 137–147. [Google Scholar] [CrossRef]
- Hawkes, C. Promoting healthy diets and tackling obesity and diet-related chronic diseases: What are the agricultural policy levers? Food Nutr. Bull. 2007, 28, S312–S322. [Google Scholar] [CrossRef] [PubMed]
- Reinert, K.; Roland-Holst, D. The industrial Pollution Impacts of NAFTA: Some preliminary results. In The Environmental Effects of Free Trade; Vaughan, S., Ed.; North American Commission for Environmental Cooperation (NACEC): Montreal, QC, Canada, 2002. [Google Scholar]
- Ackerman, F.; Wise, T.; Gallagher, K.; Ney, L.; Flores, K. Free Trade Corn and the Environment: Environmental Impacts of US-Mexico Corn Trade under NAFTA; Working Paper No. 03-06; Global Development and Environmental Institute: Medford, MA, USA, 2003. [Google Scholar]
- Carpenter, C.L. Trade Liberalization Impacts on Agriculture: Predicted vs. Realized; North American Commission for Environmental Cooperation (NACEC): Montreal, QC, Canada, 2001. [Google Scholar]
- Nadal, A. Evaluación de los Efectos Ambientales del Tratado de Libre Comercio de América del Norte; Comisión para la Cooperación Ambiental: Montreal, QC, Canada, 1999. [Google Scholar]
- De Ita, A. Los Impactos Socioeconómicos y Ambientales de la Liberalización Comercial de los Granos Básicos en el Contexto del TLCAN: El Caso de Sinaloa; Unpublished Document; Centro de Estudios para el Cambio en el Campo Mexicano, Centro Mexicano de Derecho Ambiental: Mexico DF, Mexico, 2003. [Google Scholar]
- Burfisher, M.; Robinson, S.; Thinderfelder, K. The impact of NAFTA in the United States. J. Econ. Perspect. 2001, 15, 125–144. [Google Scholar] [CrossRef]
- Levy, S.; Wijnbergen, S. Agriculture in a US-Mexican free trade agreement. In Modeling Trade Policy; Francois, J., Shiells, C., Eds.; Cambridge University Press: Cambridge, UK, 1994. [Google Scholar]
- Burfisher, M.; Robinson, S.; Thier-Felder, K. Farm policy reforms and harmonization in the NAFTA. In Regional Trade Agreements and US Agriculture; Burfisher, M., Jones, E., Eds.; AER No. 771; Economic Research Service/USDA: Washington, DC, USA, 1998. [Google Scholar]


© 2016 by the authors; licensee MDPI, Basel, Switzerland. This article is an open access article distributed under the terms and conditions of the Creative Commons Attribution (CC-BY) license (http://creativecommons.org/licenses/by/4.0/).