Abstract
The interest in equestrian sports has increased substantially during the last decades, resulting in increased number of horse facilities around urban areas. In Sweden, new guidelines for safe distance have been decided based on the size of the horse facility (e.g., number of horses) and local conditions, such as topography and meteorology. There is therefore an increasing need to estimate dispersion of horse allergens to be used, for example, in the planning processes for new residential areas in the vicinity of horse facilities. The aim of this study was to develop a method for calculating short- and long-term emissions and dispersion of horse allergen and odor around horse facilities. First, a method was developed to estimate horse allergen and odor emissions at hourly resolution based on field measurements. Secondly, these emission factors were used to calculate concentrations of horse allergen and odor by using 3-D dispersion modeling. Results from these calculations showed that horse allergens spread up to about 200 m, after which concentration levels were very low (<2 U/m3). Approximately 10% of a study-group detected the smell of manure at 60m, while the majority—80%–90%—detected smell at 60 m or shorter distance from the manure heap. Modeling enabled horse allergen exposure concentrations to be determined with good time resolution.
1. Introduction
Equestrian sports are, after football, the second largest sport in Sweden, engaging about 6% of the population [1,2]. Subsequently, riding stables, horse farms and horse racing facilities, which were earlier situated mainly in the countryside, are now often located in peri-urban areas. According to the latest figures from 2010, there are approximately 363,000 horses in Sweden of which 75% of horses and 2/3 of horse establishments are in densely built-up areas [3]. In Europe, Germany and UK have the highest total number of horses, Belgium and the Netherlands have the highest population of horses per unit area, and Sweden has the highest number of horses per capita (39/1,000 inhabitants) [4].
There is a large variability in the prevalence of allergy caused by exposure to allergens, provoking hypersensitivity reactions in genetically predisposed individuals [5]. Inhalation of allergens in sensitized individuals leads to the production of inflammatory mediators and type 1 allergic symptom, such as hay fever, eczema and asthma [5]. The most common airborne allergens come from plants, including pollens from grasses, weeds and trees, and these account for approximately 20% of allergic diseases. The second largest group of allergens comes from pets, originating from dander, epithelium, fur, urine and saliva and account for approximately 15% of allergies [1]. Pollen grains vary in size and among wind-borne pollens the size range is 17–58 µm. Cat and dog allergens are smaller particles, with a range of 5–20 µm, with a sub-fraction of particles <5µm, and remain airborne for several days [6]. Allergic sensitization to horse allergens seems to be more frequent than expected in subjects living in urban areas, and without direct exposure to horses [7]. Possible modes of exposure include by horse allergen particles spreading through airborne dispersion during various horse activities, by indirect exposure from clothing, or by allergen cross-reactivity mechanisms [8].
In Sweden, the recommended safe distance between new schools, day-care centers, residential and recreational houses and horse facilities has been 500 m, as set by the Swedish board of housing in 1995. Research performed during the 2000s has shown that horse allergen does not travel as far as earlier assumed. Based on measurements, horse allergen was shown to spread in the air about 50–100 m from horse stables and pastures and very low levels could be detected up to 400–500 m away, depending on wind speed and direction [9,10,11]. The Swedish National Board of Housing, Building and Planning [12] chose not to specify any specific safety distance in their new 2013 guidelines. Local governments have to decide on a safe distance in each case, taking into account the size of the horse facility, topography, vegetation and meteorology. Subsequently, there is a great need for tools to be able to calculate the dispersion of horse allergens and odor. The rapid development of the equine sector in peri-urban areas has given rise to several questions, especially regarding spatial planning, which in Sweden is the responsibility mainly of local government [13].There is also the Environmental Code, which is the legislation for protecting the environment regardless of land use or land ownership. Horses give rise to nuisance (the technical legal term), in the form of spread of odor, dust particles, horse allergen and flies. This should be taken into account when the municipalities engage in comprehensive planning and grant building permissions.
A first approach to estimate the spread of horse allergen around stables was performed by Elfman and coworkers [11] who did numerous field-measurements around a stable. However, to evaluate the disturbance on a long-term basis and for an area, rather than for specific points, the topography and daily and seasonal variations have to be considered. In addition to the spread of horse allergen, odor is also a concern in areas around horse facilities. It is not easy to measure odor from horses or manure in a quantitative manner, since there are many substances contributing to smell, such as amines and mercaptans.
Since dispersion calculations have not been commonly applied to these issues, there is no general basis for the calculation of emissions. Before, only very basic emission calculations have been performed for particle-bound allergens, based on a mixture of different animals (including pigs and cattle), developed in Germany [14].
The aim of this study was to develop a method to determine and evaluate both short- and long-term dispersion of horse allergen and odor from equine facilities. To do this, emissions had to be estimated for allergen and odor, respectively. These emissions were then used to calculate concentrations of horse allergen and odor using 3-D dispersion modeling. To our knowledge, this is the first study using advanced dispersion modeling for calculations of horse allergen and odor dispersion.
2. Methods and Calculations
2.1. Choice of Stables
Sampling of particles, horse allergen and odor was performed at a riding school stable at Gunnebo House and Gardens, outside Gothenburg in Sweden, on three occasions, both as campaigns and continuous measurements. A stable with constant forced ventilation was chosen, which was important since emission of allergen and ammonia were to be estimated from the indoor concentration multiplied by ventilation rate. It was assumed that there were no emissions through doors and windows based on the fact that there was a low pressure in the stable that forced outdoor air into the stable rather than the opposite.
The riding school stable housed 22 horses (17 horses in the main stable and five horses in two smaller stables 10–15 m away). The stable was situated in a somewhat complicated terrain. Horse fields and stables were well separated from each other, which was one more important criterion: this made it easier to obtain distinct measurements for the emissions from pastures and stable, respectively. Measurements of odor were performed at two stables, both the above mentioned and at a riding stable with 44 horses, also outside Gothenburg.
2.2. Sampling of Particles and Horse Allergen
Sampling was performed in the stable and outdoors. First, continuous measurements over one month were performed in May and August 2009, and in August 2010. Additional field measurements were performed as campaigns, where a large number of samples were collected around the pastures and in the stables during two consecutive days. During the continuous measurements outdoors, the total airborne particles (Total Suspended Particles—TSP), PM10 and PM2.5 were collected on filters at a flow of 18 L/min using membrane pumps and low volume impactors used for TSP, PM10 and PM2.5 and are expressed as daily means [15]. In the stable, TSP and PM10 were sampled simultaneously as the outdoor measurements. IVL Swedish Environmental Research Institute is accredited for this method and the measurement uncertainty is ±11%. Finally, day/night samplings were performed in the stable to determine the diurnal variation of horse allergen and the relationship between the concentration and number of horses in the stable.
In the stable, particles were collected on Mitex Membrane Teflon filters (LSWP04700) from Millipore/Merck Chemicals Life Sciences (Solna, Sweden) with the EU reference method for PM10 [16], using two so called “Kleinfiltergerät”, modified to collect TSP and PM10. The measurements in the stable were made about 1.5 m above the floor. The duct leading from the ceiling to the roof was centered in the stable. The stable emissions were calculated based on the ventilation flow, results from the continuous measurements in the stable and were proportional to the number of horses. Sampling was performed simultaneously in the stable and the ventilation duct to enable comparison of the levels of horse allergen at these points.
An optical particle counter (Portable Aerosol Spectrometer, Grimm Model 1.108 from GRIMM Aerosol Technik, (Ainring, Germany) was used to study the diurnal variation of the particle concentration and the particle-size distribution. The instrument measures the numeric concentration of particles in 15 size intervals from 0.3 to 20 µm. The PM10 fraction was calculated using the standardized cut-off curve for PM10. Particle mass was calculated using a density of 1 g/cm3 and assuming that the particles were spherical. The density of the particles is crucial to determining the particle concentration. However, the measurements here were only used to get relative concentrations.
During the campaigns, allergen particles were collected with an IOM sample holder with a Fluoropore membrane filter (pore size 1.0 µm, Type FA, Millipore) connected to a membrane pump operating at approximately 3 L/min (SKC, Eighty Four, PA, USA). Sampling time was about 7–8 h, equal to the time horses spent in the pastures. Sampling filters from both types of samplers were analyzed firstly for particle mass at IVL (Swedish Environmental Research Institute, Gothenburg, Sweden) and secondly for levels of horse allergen at Occupational and Environmental Medicine (Uppsala University Hospital, Uppsala, Sweden).
2.3. Analysis of Horse Allergen Concentration
Horse allergen levels were determined using a two-site sandwich ELISA assay, with reagents from Mabtech (Nacka, Sweden). The method was essentially performed according to earlier published protocols [9,11]. Horse allergen levels were expressed as U/m3 air, where 1 unit is equal to 1 ng protein of the horse standard (Allergon, Valinge, Sweden). The detection level for ordinary ELISA is 2 U/mL, corresponding to approximately 2 U/m3. For air samples collected outdoors an amplified ELISA assay was used, which is about 10 times more sensitive, with a detection level of 0.2 U/mL, corresponding to 0.2 U/m3 [17].
2.4. Sampling of Odor and Calculation of Ammonia Emission
Amines are produced and emitted to the ambient air in a similar fashion to ammonia, which is why ammonia was chosen as a tracer for the gaseous part of odor and could be measured using well-developed methods. The emission and odor threshold for ammonia is significantly higher than for many amines and sulfur compounds that contribute to the smell from horse manure. O’Neill and Phillips [18] have listed 168 odor compounds identified from livestock, of which 30 have odor detection thresholds lower than or equal to 1 µg/m3 in the gas phase.
During the time of the campaign in August 2010, outdoor levels of ammonia together with horse allergen were measured at several places around the equine facility using battery-driven pumps and denuders [19]. Ammonia and odor were measured on sunny dry days with wind speeds in the range 1–3 m/s and temperature around 20 °C.
To estimate the daily variation of ammonia emissions from the stable sampling was performed during one day and one night. Since the ammonia level in a horse stable is high, the relatively simple sampling technique–diffusive sampling—could be used [20]. The accuracy of the ammonia air concentration measurement in the stable is ±10% and the accuracy in the measurement of the ventilation rate is ±15% giving an uncertainty of emission from the stable of ±25%.
The emission of ammonia from the manure heap was measured using passive flux-samplers. This method integrates ammonia concentration, wind-speed and cosine for wind direction and enabled the amount of ammonia passing through a vertical area to be calculated. The sampler consists of a probe and two acid-coated glass tubes (denuders) in series. If the wind first passes the probe that faces the ammonia source, the ammonia will be trapped in the first coated tube. If the wind comes from the opposite direction (background) the ammonia will be collected in the last tube. The tubes were analyzed separately [21,22]. Since the manure-heaps at both stables were situated close to the stable-wall, only three collection masts could be erected and the flux-samplers were mounted at three heights. The masts were raised 15–20 m from the manure heap.
The emission was calculated using the following equation:
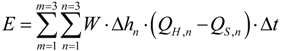
E = NH3 emission in g
m = 1, 2, 3—three different masts
n = 1, 2, 3—three different heights over ground level
W = distance between masts in meters
Δhn = height interval which the flux-sampler is representing in meters
QH = NH3 flux from the manure heap in g NH3 m−2·h−1
QS = NH3 flux from the surrounding in g NH3 m−2·h−1
Δt = sampling time, in hours
2.5. Evaluation of Odor
During two days of field-measurements in August 2010, we randomly selected 102 persons on the way to the restaurant next door. Each person was asked to walk from a point approximately 150 m from the horse stable and the manure heap. The distance to the manure heap from which the person first noticed stable/manure smell was recorded. Due to variable wind speed, direction and turbulence the smell often came in puffs. It was assumed that this method captured a mean dispersion since the test included a fairly large number of persons (102), consisting of both elderly and young people. The manure heap at the Gunnebo stable contained both horse manure and a large proportion of cow dung, which is why a similar investigation was conducted at an additional stable, Nääs House.
2.6. Calculations Using 3-D Dispersion Model
Dispersion modeling was performed using the ADMS-model [23]. This is an advanced dispersion model using land-use, topography etc. to describe the “real world” and uses (measured) meteorological parameters, such as wind speed and wind direction, precipitation, air temperature and humidity and the stratification of the air. This model is used to simulate dispersion of emissions from point- or area sources to the atmosphere, such as industrial emissions and for monitoring air quality in, for example, urban areas. Besides ordinary dispersion modeling, the model can also be used to calculate odor dispersion. Apart from emission data, the model requires in-data such as number and height of buildings, topography and meteorological information over the year, to calculate dispersion. The required meteorological input parameters–such as wind speed, wind direction, temperature, humidity and precipitation—were measured at the site during the campaigns. People with horse allergy who are being exposed to horses usually react within hours. Therefore, it is important to determine the concentration levels of horse allergen around the stables at a resolution of an hour. To simulate this, the emissions and the meteorology are therefore described with hourly resolution.
The emission of allergen particles outdoors is influenced by several meteorological factors, including the vertical structure of the air, the wind speed and direction, precipitation and humidity. This means that the actual meteorological situation determines the emissions. The method used for this application was inversed dispersion modeling. The method is based on using the dispersion model with an assumed area emission of particles from horses outdoors on a daily basis. The results are compared to the measured levels of allergen and the emissions are correlated until the measured and calculated levels are as similar as possible, meaning that the calculation has to be repeated numerous times until the best-fit for each occasion is obtained.
In this case, particle deposition speed was also included. However, the vertical stability is difficult to measure (here as Monin–Obukhov Length) and has therefore been calculated using the meteorological prognostic model TAPM [24], which has been validated for Swedish conditions [25,26].
3. Results
3.1. Allergen on Different Particle Fractions
The particle concentration monitored at the test site was not primarily determined by the stable activity, while the allergen concentration was. This is shown in Figure 1, where the relationship between the outdoor continuous measurements of particle mass- and allergen concentrations in each particle fraction has been investigated. Since the sampled fractions PM2.5 and PM10 are both parts of TSP, three independent fractions are presented in Figure 1. The smallest fraction is PM2.5, the middle fraction is PM2.5–10 (PM10 − PM2.5) and the largest is PM10-TSP (TSP − PM10).
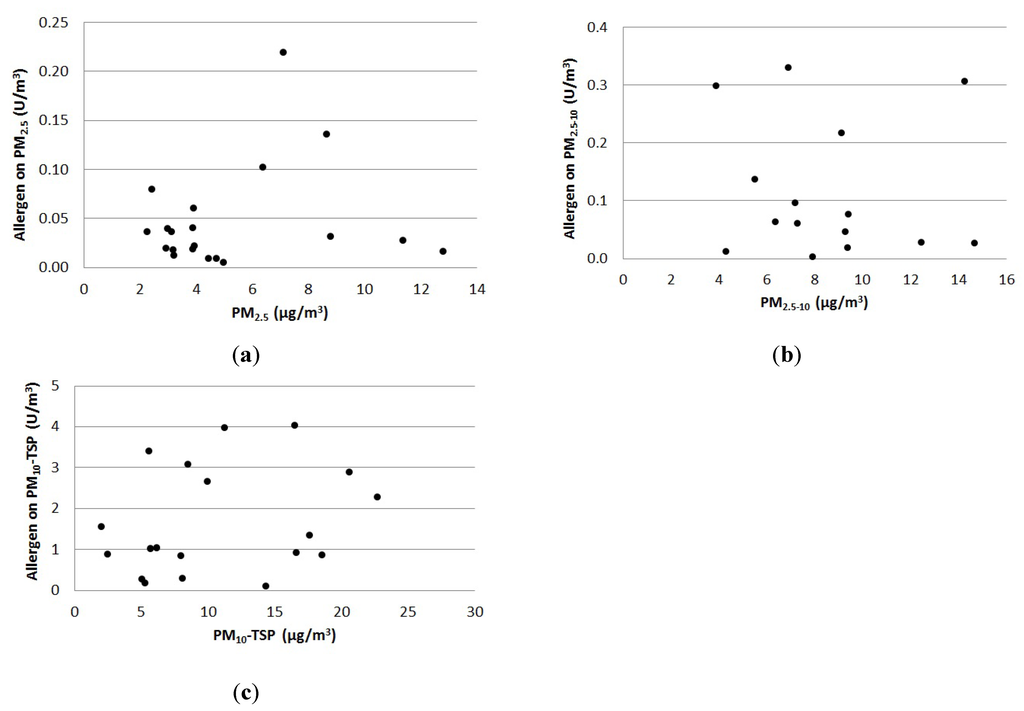
Figure 1.
The relationship between outdoor particle concentration of (a) PM2.5, (b) PM2.5–10 and (c) PM10-TSP, and the concentration of allergen is shown for each particle fraction.
From Figure 1 it can be seen that the largest fraction contained almost one magnitude more allergen per particle mass than the other two fractions. However, no linear or other relationship between the concentrations of horse allergen and any of the particle fractions was found. Therefore, it is not possible to calculate the allergen concentration based on the particle concentration around stables alone.
3.2. Emission Calculation—Stable
The activities in the stable, such as sweeping and grooming, were assumed to develop particles of variable sizes. The optical particle counter was used for real-time measurements and to estimate TSP/PM10 ratios. However, the estimation of particle mass is not so crucial since only relative values were used. In Figure 2, the particle mass concentration in different aerodynamic size ranges are shown. The particle mass in each interval is calculated from the measured number of particles per cubic meter multiplied with the volume of the particles in that size range assuming a spherical shape with a diameter centered in the interval and finally multiplied with a density of 1 g/cm3.
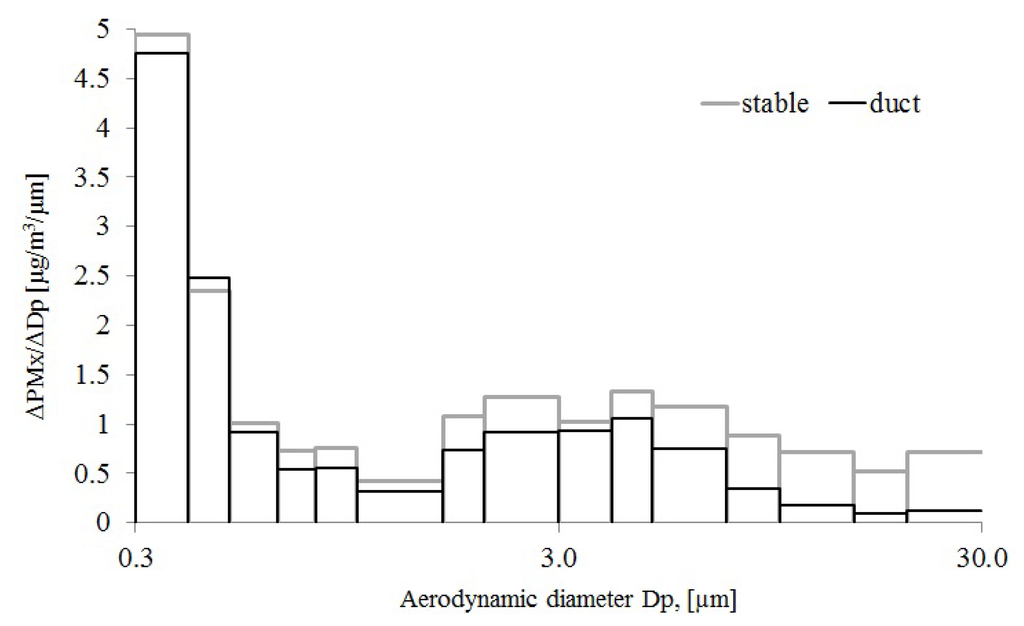
Figure 2.
Particle fraction distribution in the stable and the ventilation duct.
According to the results shown in Figure 2, there is a big difference between both the concentration level and the particle size distribution in the stable and the ventilation duct. The result from the stable show that the particle size larger than about 3 µm to 30 µm, contained between 2–4 times higher concentrations than the sample from the ventilation duct. Thus the stable air contains a much larger share of large particles but these do not reach the outside air through the ventilation duct. The duct/stable particle mass ratio decreases continuously above 4 µm, possibly due to the generation of large particles near the floor that are partly deposited in the stable.
The concentration of horse allergen in the PM10 fraction was on average 5.9 U/µg in the duct. The parallel measurements at the sampling point in the stable gave 7.6 U/µg PM10 particles. Thus, 77% of the horse allergen in the PM10 fraction in the stable went out with the ventilation air. The TSP sampler was too large for the duct, but the probe to the particle counter could easily be used, giving a TSP/PM10 ratio of 1.3 in the duct and 1.7 in the stable (measurements presented in Figure 2). Thus, to estimate the emission of horse allergens it was assumed that particles larger than PM10 also contained 77% less allergens in the duct compared to the stable. The concentration of horse allergen on the TSP fraction in the stable air was then multiplied by 1.3/1.7 × 77% = 59% in order to obtain the concentration of horse allergen emitted through the duct.
The emission from the stable is assumed to vary with the number of horses and stable activity, both summed up in the measured particle concentration in the stable. TSP was measured with a time resolution of less than 1 h (with the Grimm-instrument, see Section 2.2) during 11 days. The measurements of allergen in the stable were not at the required time resolution to be able to calculate an hourly resolution of the emissions. The hourly distribution of horse allergen was established by use of particle measurements of TSP, number of horses and type of activity (Figure 3).
To show the contribution from the stable alone, the outdoor TSP concentration was subtracted from the measured TSP concentration in the stable. During the measurements, the activity level (grooming, saddling, feeding etc.) and number of horses in the stable were noted to have the greatest influence on the particle concentration during the short time measurements of particles (Grimm). It was assumed that the allergen concentration followed this activity. Consequently, the activities in the stable have been used to derive an hourly distribution of the allergen emissions, but generalized into five groups (1. no activity + no horses, 2. no activity + full stable, 3. activity + full stable, 4. activity + half full stable, 5. much activity + half full stable) shown in Figure 3, representing a “normal day distribution” (Figure 3). Grooming, saddling, feeding clearing the dung etc. is referred as “much activity” while “activity” is solely clearing the dung in the figure.
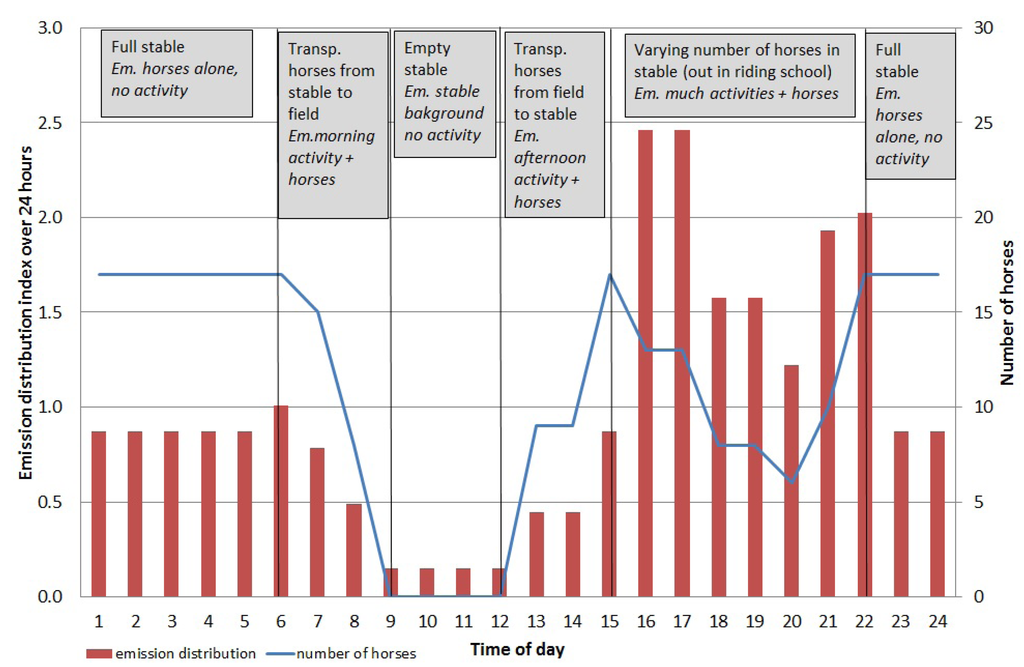
Figure 3.
Diurnal distribution index of horse allergen emissions (blue line) from the stable including number of horses (bars) and type of activity (Em = emission).
From Figure 3 it can be seen that grooming and saddling in the afternoon to early evening gave the highest emissions, while at night the emissions were lower even though all 17 horses were in the stable. This type of calculation can be applied on other horse stables where no field measurements have been performed, provided the number of stabled horses is known.
3.3. Calculations of Emissions from Pastures and Manure Heap
The emission of allergen particles was calculated using inversed dispersion modeling. To obtain hourly resolution of the outdoor emissions a general hourly distribution index for a typical day (24 h) was calculated, based on the number of horses in the pastures and for days with and without precipitation (Figure 4). These two factors were the main contributors to outdoor allergen concentrations.
As mentioned, the outdoor emissions are influenced by the meteorology, where the continuous measurements of the allergen concentrations during rainy days were about 18% of the concentrations during dry days. A pasture without horses emits horse allergen. Based on two 24 h samples the allergen concentration was about 10% of the concentration of a pasture with horses. Thus, the hourly distribution indexes of the outdoor emissions (pasture with horses) were calculated for situations with dry and wet weather respectively, and for the dry situation for a pasture with horses (there is no emissions on days with precipitation and no horses). There is a large variability in emissions throughout the seasons, with winter having the lowest emissions, and summer the highest [11,27]. In this study, we focused mainly on the summer season. The annual distribution of the emissions was calculated based on the number of horses, meteorology and season (Figure 5).
3.4. Dispersion of Horse Allergen
Based on the calculated emissions and the hourly distribution indices (Figure 3 and Figure 4) the dispersion of horse allergen and ammonia from stable and pastures was calculated using a dispersion model. The results from these calculations show that the greatest contribution to the concentration of horse allergen emerged from the pastures. The proportion of allergen that originates from the stable varied from 0.1 to 2% of the total allergen concentration, depending on sampling point and weather conditions. The dispersion of the particle bound allergen emissions were carried out for both May and June (Figure 6).
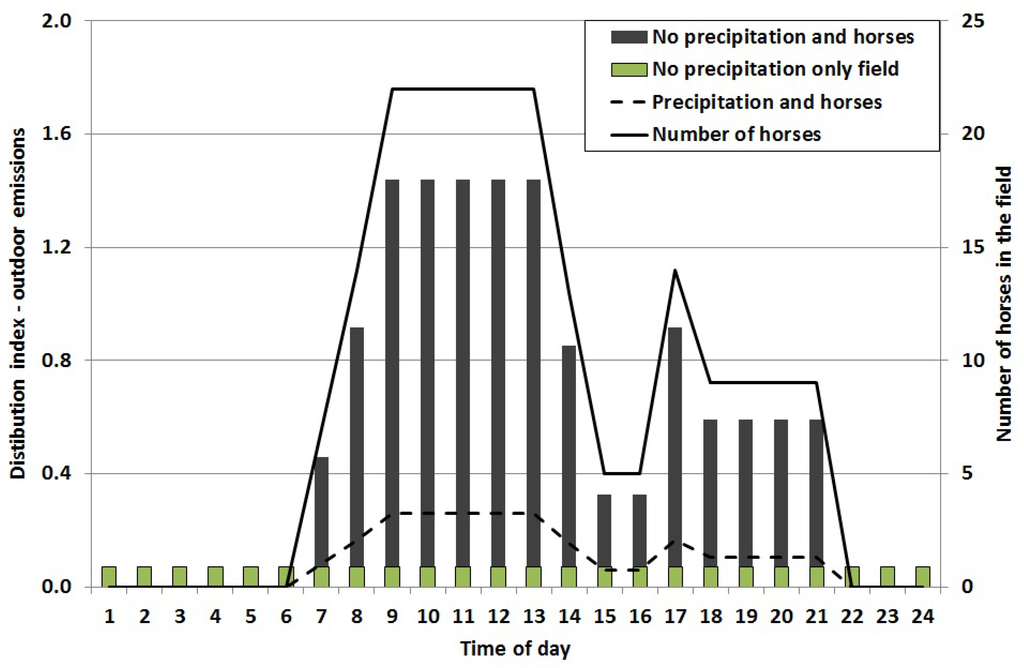
Figure 4.
General hourly distribution index of horse allergen emissions from the pastures. Days with precipitation = dashed line. Days with no precipitation, but with horses = black bars. The indexes are based on number of horses (solid line). Days without precipitation and without horses = hatched bars.
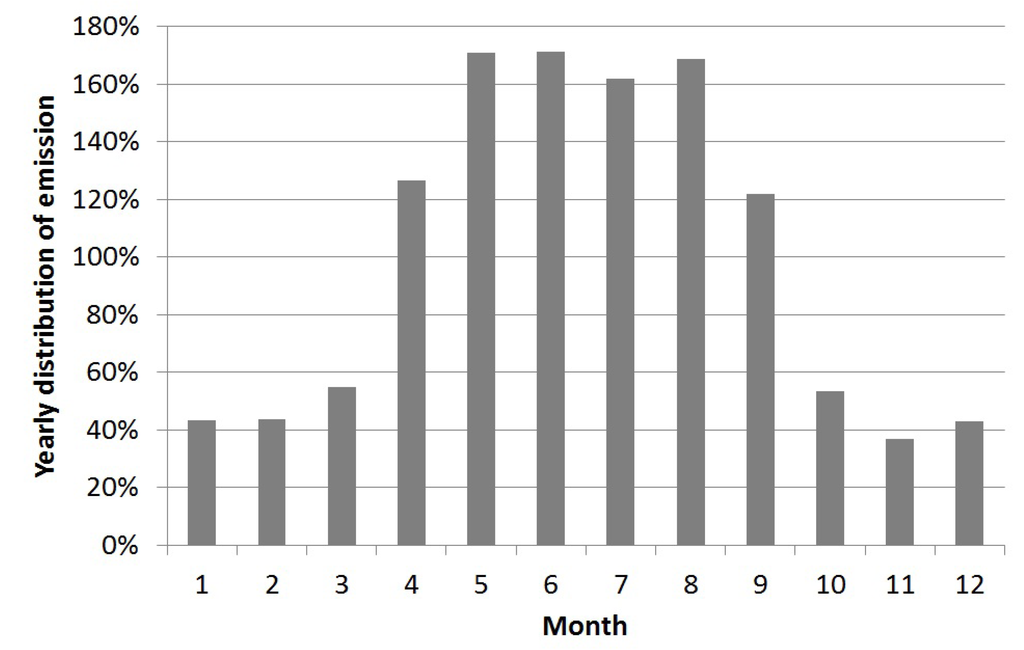
Figure 5.
Seasonal variation of average monthly emission.
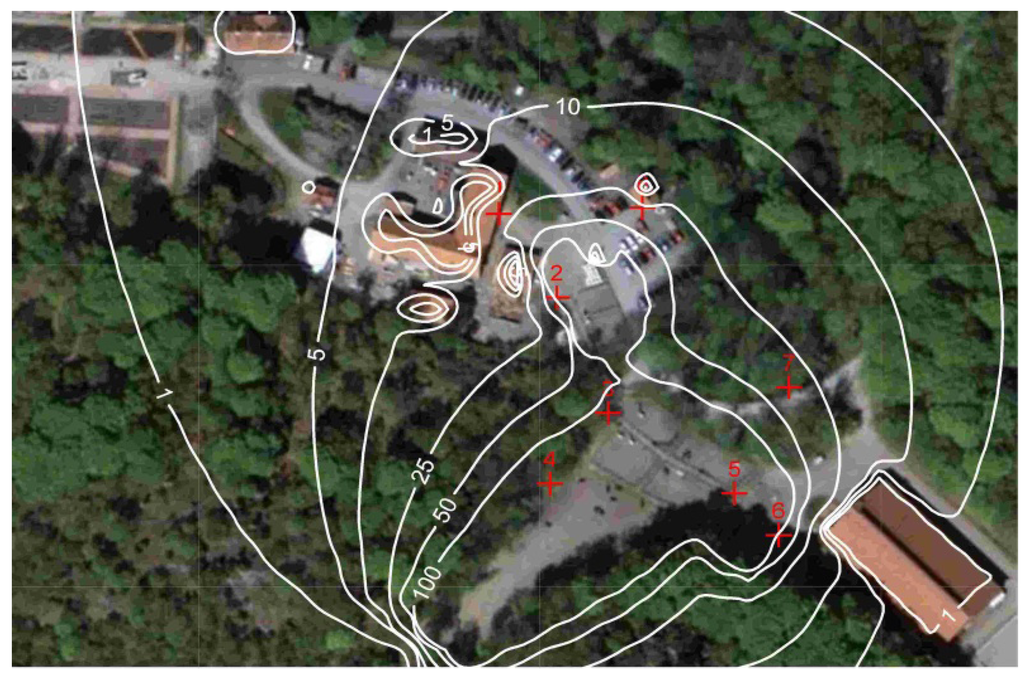
Figure 6.
Modeled horse allergen concentration (U/m3) for May and June 2009.
3.5. Validation of Calculated Concentration of Horse Allergen
Figure 7 shows a comparison between modeled and measured allergen concentrations for all days of measurements (May and June 2009 at site 6, see Figure 6). This is based on the hourly resolution of the emissions described earlier. This was therefore a quality test for the dispersion calculation of allergen concentration as well as the estimated emissions, distribution indexes and also to some extent the time resolution.
The results presented in Figure 7 show a good agreement between actual field measurements and calculated horse allergen levels, with a compliance of ±20%. Depending on occasion and wind direction, the horse allergen levels were <1 U/m3 at about 100 m from the pastures, which is in good agreement with earlier results [11]. The whole method was considered to be tested and sufficiently accurate for use in evaluating the spread of horse allergens.
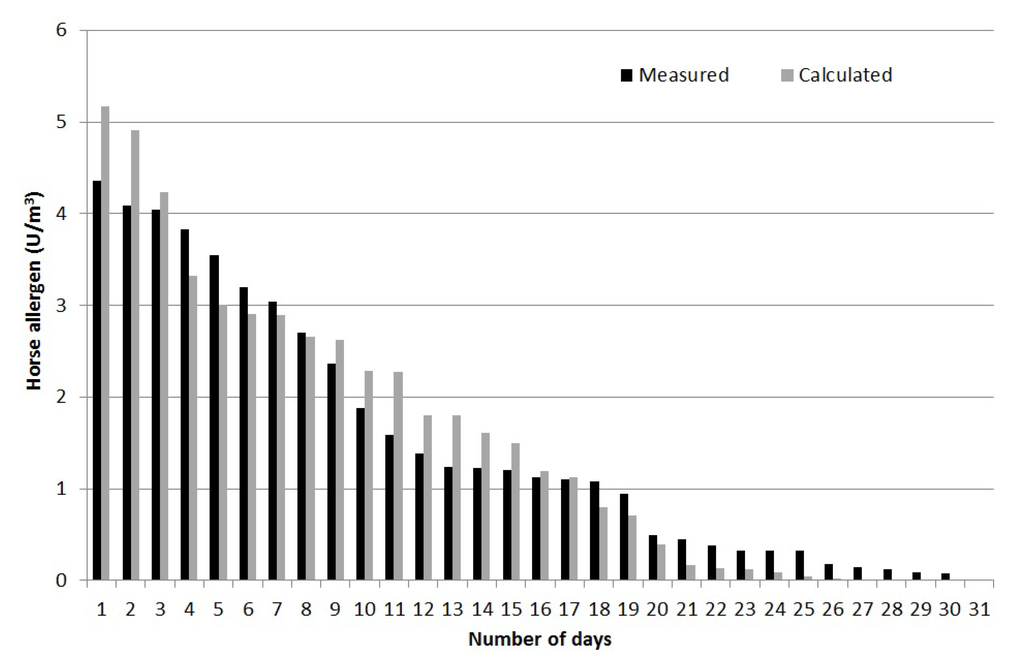
Figure 7.
Comparison between measured and modeled allergen concentration at the site of the continuous measurements.
3.6. Dispersion of Ammonia
As for the horse allergens, the calculation of ammonia emission from the stable was also based on measurement at the ventilation duct multiplied with the airflow. The dispersion was simulated for the odor measurements during the campaign in August 2010 based on the calculated emissions from the stable and the manure-heap (Figure 8).
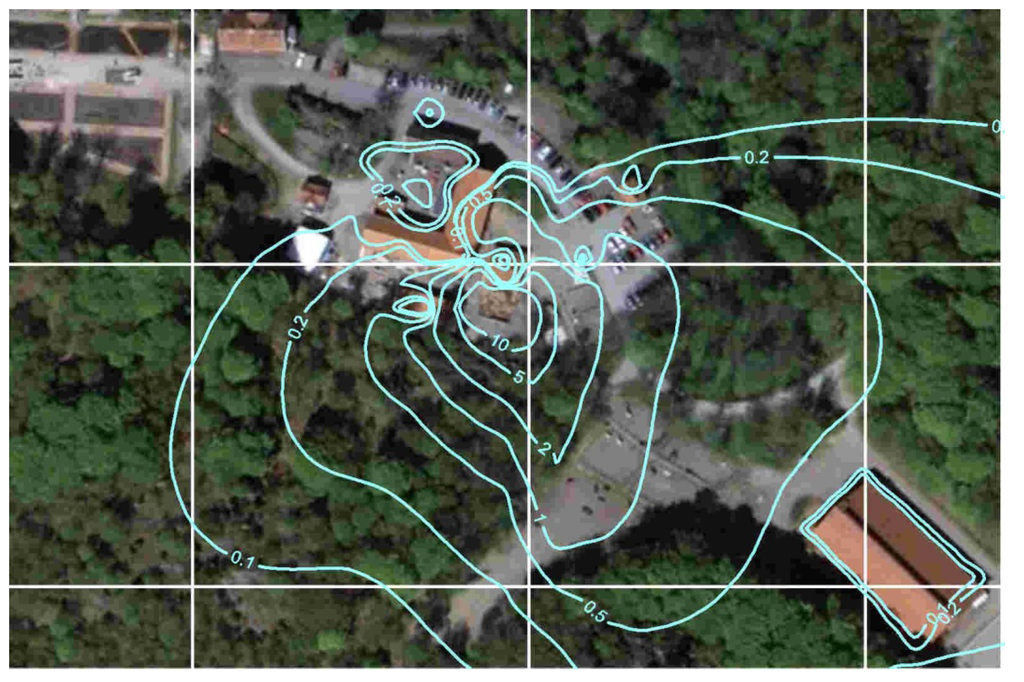
Figure 8.
Modeled dispersion of ammonia (µg/m3).
In Figure 9, the measured ammonia and allergen concentrations are shown together with the percentage of people that could detect odor at different distances from the stable and manure heap. It becomes clear that allergen and ammonia dilutes in a similar way, and also that ammonia is below the detection threshold of odor at the distance where people say they can detect the stable smell. This indicates that the source of smell is possibly not ammonia, but a mixture of ammonia and other chemicals such as amines and mercaptans.
The manure heap at Gunnebo stable contained a mixture of horse and cattle manure, which was why a complementary measurement at another stable, Nääs with only horse manure, was performed. Figure 10 shows the percentage of people who detected odor at this stable. Both manure heaps were located next to the stables, suggesting that the ammonia and allergen emissions were from the same source.
In summary, from the three days when we performed the study of dispersion of odor and people’s sense of odor, approximately 10% of people detected the smell of manure already at 60 m, while the majority—80%–90%—detected smell from the manure heap at 60 m or a shorter distance. The smell of stable or horse spread slightly further, such that 30% of the people participating in this study sensed horse smell at 90–60 m, and 65% at 65 m or a shorter distance from the stable and manure heap. The field investigators did not experience that people had very different sense of smell, but rather that wind speed and direction determined when a gust of odor came. During all three study days, the weather was fine and dry, with low to medium wind speeds (1–3 m/s). At the Gunnebo site, odor was detected at an average ammonia concentration in the range of 0.2–1 µg/m3 and an average allergen concentration in the range of 0.1–0.5 U/m3. The odor and the horse allergen concentrations fluctuated with time.
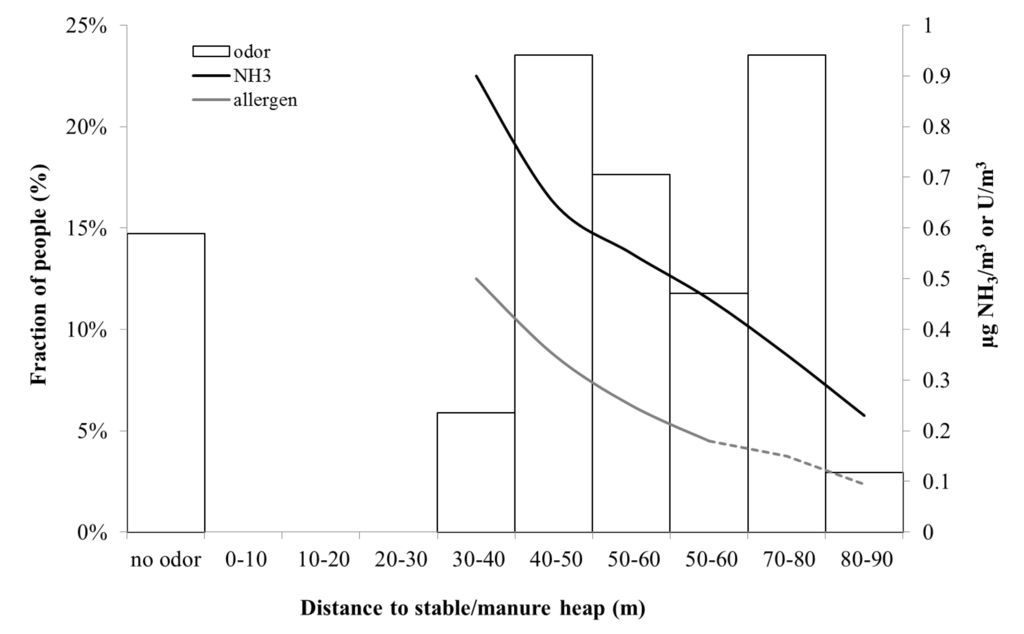
Figure 9.
Percentage of people (Gunnebo) who sensed horse smell as a function of distance from the stable/manure heap (left axis). (n = 34) and modeled NH3 concentration and allergen concentration (right axis). The dashed green line represents measurements below the detection limit.
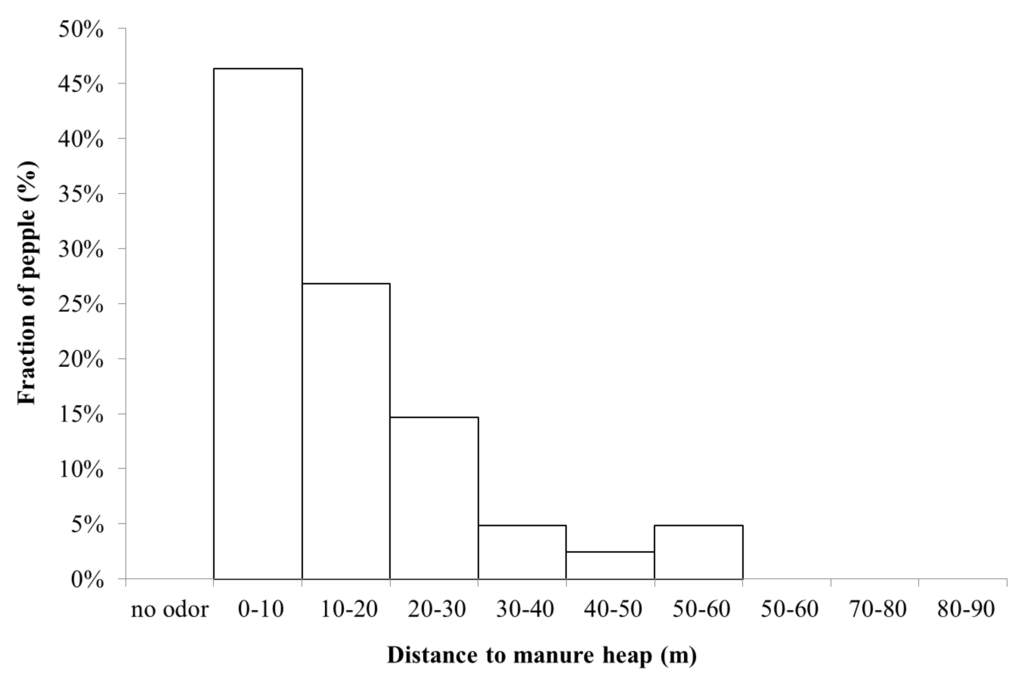
Figure 10.
Percentage of people (Nääs), who detected the smell of manure as a function of distance from the manure heap (n = 41).
4. Discussion and Conclusions
The increasing interest in horses and riding and the proximity of stables to urban areas has resulted in higher exposure of the population to horse allergens and odor that may cause allergy and discomfort. As a result, there is a great need for data and tools to aid in effective urban planning close to equine facilities.
In this study we have developed a method to calculate the dispersion of horse allergen and odor from horse facilities. Due to lack of relevant emission data, the first step was to estimate the emissions of horse allergens. The emissions were calculated based on measurements using an active filter technique. Traditionally, when measuring allergen on filters, only TSP has been sampled using small portable pumps with an open face filter. The transportation time, and thus the transport path of particles in air differ depending on the size fraction–large particles are deposited closer to the source. One important parameter when calculating the particle concentration in air is the deposition velocity, where larger particles have higher velocities. Since allergens are transported as particles, it is important to determine which particle fraction carries the most allergen. The fraction of particles in ambient air in southern Sweden comprises a large proportion–usually around 60%—of fine particles transported over a long-distance while the rest being of local origin. Continuous sampling of TSP, PM10 and PM2.5 outdoors, and TSP and PM10 indoors was performed to study which particle fraction horse allergen was linked to. According to Figure 1, the major proportion of horse allergen was associated with the particle fraction TSP (<20 µm). As TSP includes all particle fractions one may argue that it would be enough to only measure TSP. However, the fraction is also important when developing a method to estimate horse allergen emissions and calculate dispersion correctly. If a large proportion of the allergen is transported on PM2.5 then the dispersion would be wider than if most of the allergen is attached to larger particles.
The reliability of the emission calculations was investigated using dispersion modeling by validating the calculated allergen concentrations against independent measurements of horse allergen at several points around the stable and pastures. The biggest reason for uncertainty in the results is probably the calculations of emissions for horses outdoors in the pastures. This depends on both spatial and time resolution, since the herd often moves together over the pasture. In certain cases, this could result in very high local levels of horse allergen if the herd stays close by for an extended time with a prevailing wind direction towards the measuring point. Such a scenario is therefore very difficult to recreate in the input emissions data and therefore the dispersion model. However, in general, uncertainties in dispersion modeling are usually the largest closest to the source, and in this case the validation point 6 (Figure 6) is located rather close to the pasture. The uncertainty will therefore most likely decrease further away from the source. The accuracy of the calculations using the dispersion model was ±35%, calculated as daily mean concentration. Despite these uncertainties, the validation was better than what is required for “normal” air pollution calculations—±50% [27] in similar time scale—which is why the compliance was considered good and the method can thus be recommended for application at other horse facilities.
According to the results presented in Figure 8 there is good agreement between calculated and measured allergen concentrations. However, some of the highest and lowest concentrations are overestimated and underestimated, respectively. The major source of error is possibly the outdoor emissions from the horses in the field. It has been assumed that each field has a mean area emission (depending on the number of horses) but the horses may not move in the same pattern every day or they may prefer one part of the field which, in that case, should have given rise to a larger proportion of the emissions than other parts.
This study shows that the contribution of horse allergen concentration in the air from horses outdoors in the pastures was 10–100 times greater than from the stable. In this case, the main horse allergen outlet from the stable was through a forced ventilation outlet on the roof, resulting in a dispersion pattern with the highest concentration at some distance from the stable where the “allergen plume” reaches the ground. This is the reason why the contribution of allergens from the stable becomes very small at ground level close to the stable, compared to the contribution from the pastures. However, for stables with natural ventilation, the dispersion pattern would possibly look different if the main outlets were at ground level, through open doors and windows. This scenario may therefore give a different dispersion pattern, with the highest concentrations closer to the stable due to lower wind speed and thus less dispersion close to the ground. Thus, to reproduce the complicated wind fields that usually exists an advanced dispersion model, in this case the ADMS-model [23], was required to generate relevant dispersion patterns including, for example, topography and land-use.
In this study, we also attempted to evaluate the nuisance from smell. Odorous compounds from livestock are present in both gas and particle phases. Even if the concentration of odorous compounds is larger in the gas phase, the odor can disappear if the particle phase is removed [28], possibly because odorous compounds are concentrated in the particle phase that constitutes a very small volume of the air. Particles larger than about 3 µm are efficiently trapped in the nasal region [29]. Odor is often quantified using olfactometry. To avoid fouling of the apparatus by dust, the air is usually filtered before the odor is detected by humans [30]. To avoid this, the odor investigation was here made in the ambient air outside the stable, starting from odorless air far from the source and walking towards the source until odor was detected.
At all distances where people sensed odor (thus not specifically ammonia or “stable odor”) the ammonia concentration was three orders of magnitude below the detection threshold of odor. This indicates that the source of smell is possibly not ammonia, or at least not only ammonia, but a combination with perhaps particulate matter. Furthermore, at the Nääs stable (Figure 10) the pattern was somewhat different, with a more consistent decline in perceived odor with distance compared to the stable at Gunnebo site (Figure 9).One possible reason is that Nääs is located in more open terrain, resulting in a less complicated dispersion pattern. Thus, this study indicates that the spread of odor possibly causes rather little nuisance at a distance further than about 100 m.
At the same distance, the allergen concentration was diluted from 100 to around 10 U/m3. However, a distance of at least 200 m was required to reach levels below 3 U/m3, a level that does not give rise to allergic reactions among horse allergen sensitive people [11]. Thus, the odor did not disperse as far as horse allergen, making the latter the controlling factor for risk assessment. There are, however, no limit values for airborne horse allergens, or any other allergen concentrations either. The reason being that it is very difficult to perform such clinical studies and the levels are dependent on the individual’s genetic predisposition for becoming allergic, allergen load, and the number of allergens the individual is allergic to, of which many are seasonal.
The results from this investigation show that it is possible to determine the emissions of horse allergen from horse facilities and also perform dispersion calculations. It therefore becomes possible to determine the allergen concentrations for larger areas, for longer periods and with better time resolution than would be possible if only using measured information (due to both the costs and for practical reasons). Thus, it would be possible to use this methodology in a number of situations such as: (1) to calculate dispersion at other sites, (2) future changes in horse activities, (3) effects of mitigation measures as well as identifying which sources cause the highest emissions of horse allergen, and (4) new buildings close to the stable, or new planning around stables that may alter and/or redirect the wind and therefore the dispersion patterns. However, as in all types of dispersion modeling of air borne pollutants, it is recommended that measurements should be made to validate the calculated data. This methodology can be used to advise local government when planning new residential areas in the vicinity of horse facilities in relation to topography and meteorology. To our knowledge, this is the first study to estimate detailed horse allergen emissions and using 3-D dispersion modeling for calculation of distribution of horse allergen and odor around horse facilities.
Acknowledgments
Funding was received from the Swedish-Norwegian Foundation for Equine Research and the Foundation for the Swedish Environmental Research Institute (IVL). We are thankful to the owners of Gunnebo House and Gardens and Nääs House for letting us perform these studies at their horse stables. We would also like to thank Kjell Peterson, William Eugensson, Henrik Fallgren and Helena Danielsson for assistance with the measurements. Finally, we would also like to thank Eva Regnell and the staff at Gunnebo stable who helped with our measurements.
Author Contributions
Marie Haeger-Eugensson, Martin Ferm and Lena Elfman worked together in the production of the paper. Marie Haeger-Eugensson brings the idea of the methodology for development of the emission factors and conducted the emission calculations of horse allergens as well as all dispersion modeling. The main contribution of Martin Ferm was measurement methods of both particles and NH3 as well as emission calculation of NH3, knowledge of odor and evaluating the results. The main contribution of Lena Elfman was measurements and analyses of horse allergen. Further, her long experience in allergen and epidemiological studies was the precondition for analysis of the plausibility of the results of the horse allergen concentrations.
Conflicts of Interest
The authors declare no conflict of interest.
References
- Public Health Agency of Sweden. Miljöhälsorapport. 2009. Checked 2014-02-14. Available online: http://www.folkhalsomyndigheten.se/pagefiles/12933/miljohalsorapport-2009.pdf (accessed on 17 March 2014).
- The Swedish Horse Council Foundation. Available online: http://www.nshorse.se (accessed on 13 February 2014).
- Swedish Board of Agriculture. Available online: http://www.jordbruksverket.se/formedier/%20nyheter/nyheter2011/antalethastarisverigeuppskattastill362700.5.510b667f12d3729f91d80007251.html (accessed on 27 August 2013).
- Liljestolpe, C. Horse Industry in Europe of Today. The Future Horse Industry in Rural Areas and Society. In Proceedings of EU Equus Conference, Uppsala, Sweden, 29–30 October 2013.
- Allergy; Holgate, S.T.; Church, M.K.; Broide, D.H.; Martinez, F.D. (Eds.) Elsevier Saunders Ltd.: London, UK, 2011.
- O’Meara, T.; Tovey, E. Monitoring personal allergen exposure. Clin. Rev. Allergy Immunol. 2000, 18, 341–395. [Google Scholar] [CrossRef]
- Liccardi, G.; Salzillo, A.; Dente, B.; Piccolo, A.; Lobefalo, G.; Noschese, P.; Russo, M.; Gilder, J.A.; D’Amato, G. Horse allergens: An underestimated risk for allergic sensitization in an urban atopic population without occupational exposure. Respir. Med. 2009, 103, 414–420. [Google Scholar] [CrossRef]
- Liccardi, G.; Emenius, G.; Merritt, A.-S.; Salzillo, A.; D’Amato, M.; D’Amato, G. Direct and indirect exposure to horse—Risk for sensitization and asthma. Curr. Allergy Asthma Rep. 2012, 2, 429–437. [Google Scholar]
- Emenius, G.; Larsson, P.H.; Wickman, M.; Harfast, B. Dispersion of horse allergen in the ambient air, detected with sandwich ELISA. Allergy 2001, 56, 771–774. [Google Scholar] [CrossRef]
- Emenius, G.; Merritt, A.-S.; Harfast, B. Dispersion of horse allergen from stables and areas with horses into homes. Int. Arch. Allergy Immunol. 2009, 150, 335–342. [Google Scholar] [CrossRef]
- Elfman, L.; Brännström, J.; Smedje, G. Detection of horse allergen around a stable. Int. Arch. Allergy Immunol. 2008, 145, 269–276. [Google Scholar] [CrossRef]
- Swedish National Board of Housing, Building and Planning. Available online: http://www.boverket.se/Planera/planeringsfragor/Planering-for-djurhallning/ (accessed on 27 August 2013).
- Elgåker, H.; Pinzke, S.; Lindholm, G.; Nilsson, C. Horse keeping in urban and peri-urban areas: New conditions for physical planning in Sweden. Dan. J. Geogr. 2010, 110, 81–98. [Google Scholar] [CrossRef]
- Seedorf, J. An emission inventory of livestock-related bioaerosols for Lower Saxony, Germany. Atmos. Environ. 2004, 38, 6565–6581. [Google Scholar] [CrossRef]
- Ferm, M.; Gudmundsson, A.; Persson, K. Measurements of PM10 and PM2.5 within the Swedish Urban Network. In Proceedings of NOSA Aerosol Symposium, Lund, Sweden, 8–9 Novemer 2001.
- CEN Air-quality-determination of the PM10 Fraction of Suspended Particulate Matter—Reference Method and Field Test Procedure to Demonstrate Reference Equivalence of Measurement Methods; European Committee for Standardization: Brussels, Belgium, 1998.
- Merritt, A.-S.; Emenius, E.; Elfman, L.; Smedje, G. Measurement of horse allergen (Equ. cx) in schools. ISRN Allergy 2011, 2011. [Google Scholar] [CrossRef]
- O’Neill, D.H.; Phillips, V.R. A review of the control of odor nuisance from livestock buildings: Part 3, properties of the odorous substances which have been identified in live-stock wastes or in the air around them. J. Agr. Eng. Res. 1992, 53, 23–50. [Google Scholar] [CrossRef]
- Ferm, M. Method for determination of atmospheric ammonia. Atmos. Environ. 1979, 13, 1385–1393. [Google Scholar] [CrossRef]
- Kirchner, M.; Braeutigam, S.; Ferm, M.; Haas, M.; Hangartner, M.; Hofschreuder, P.; Kasper-Giebl, A.; Römmelt, H.; Striedner, J.; Terzer, W.; Thöni, L.; Werner, H.; Zimmerling, R. Field inter-comparison of diffusive samplers for measuring ammonia. J. Environ. Monit. 1999, 1, 259–265. [Google Scholar] [CrossRef]
- Schjoerring, J.K.; Sommer, S.G.; Ferm, M. A simple passive sampler for measuring ammonia emission in the field. Water Air Soil Pollut. 1992, 62, 13–24. [Google Scholar] [CrossRef]
- Ferm, M.; Marcinkowski, T.; Kieronczyk, M.; Pietrzak, S. Measurements of ammonia emissions from manure storing and spreading stages in Polish commercial farms. Atmos. Environ. 2005, 39, 7106–7113. [Google Scholar] [CrossRef]
- ADMS User Guide Version 4.0; Cambridge Environmental Research Consultants: Cambridge, UK, 2007.
- Hurley, P. TAPM Version 4 User Manual 2008. CSIRO Marine and Atmospheric Research International Report No 5. Available online: http://www.csiro.au/~/media/CSIROau/Outcomes/Environment/Population-Sustainability/TAPM_v4_UserManual.pdf (accessed on 22 March 2014).
- Chen, D.; Wang, T.; Haeger-Eugensson, M.; Ashberger, C.; Borne, K. Application of TAPM in Swedish: Validation during 1999–2000. Available online: http://www.ivl.se (accessed on 25 March 2014).
- Tang, L.; Junfeng, M.; Chen, D. Performance of TAPM against MM5 at urban scale during GÖTE2001 campaign. Boreal Env. Res. 2009, 14, 338–350. [Google Scholar]
- NFS Swedish Environmental Protection Agency. Regulations on the Control of Air Quality. Available online: http://www.naturvardsverket.se/Documents/foreskrifter/nfs2013/nfs-2013-11.pdf (accessed on 20 March 2014).
- Hammond, E.G.; Fedler, C.; Smith, R.J. Analysis of particle-borne swine house odors. Agr. Environ. 1981, 6, 395–401. [Google Scholar] [CrossRef]
- Keck, T.; Leiacker, R.; Klotz, M.; Lindemann, J.; Riechelmann, H.; Rettinger, G. Detection of particles within the nasal airways during respiration. Eur. Arch. Oto-Rhino-Laryngol. 2000, 257, 493–497. [Google Scholar] [CrossRef]
- Bottcher, R.W. Environmental nuisance: Odor concentrated and transported by dust. Chem. Senses 2001, 26, 327–331. [Google Scholar] [CrossRef]
© 2014 by the authors; licensee MDPI, Basel, Switzerland. This article is an open access article distributed under the terms and conditions of the Creative Commons Attribution license (http://creativecommons.org/licenses/by/3.0/).