
The Study of Clinical and Biochemical Parameters in Assessing the Response to the Antiviral Therapy in the Chronic Viral Hepatitis B

 ,
,  ,
, 
 ,
, 
 ,
,  , ,
, ,
Abstract
:1. Introduction
- Evaluation of the biological response rates and sustained virological response in patients with chronic hepatitis B treated with PegIFN α-2a/b.
- Identify metabolic changes and insulin resistance.
2. Materials and Methods
2.1. Treatment Protocol
- Clinical evaluation; including demographic data, present history of smoking, alcohol consumption, presence of chronic diseases, and past history of dental intervention, surgery or blood transfusion.
- Coinfection with HIV, HCV or HDV;
- Previous antiviral treatment for any length of time;
- Other chronic liver diseases (chronic alcoholism, Wilson disease, NASH, NAFLD) liver cirrhosis, history of ascites, variceal bleeding, hepatic encephalopathy, and other conditions suggesting decompensated liver disease, fasting plasma glucose > 120 mg/dL; neoplasia diagnosed or treated in the last 5 years, patients treated with corticosteroids or immunosuppressants in the last 30 days, or if they are expected to also administer medications during the study, known allergies to antiviral medications
- Anthropometric data: weight, height, body mass index (BMI), calculated by the formula BMI = W/H2, where W (weight) was expressed in kilograms and H (height) in meters. Subjects according to BMI classification were as follows: normal weight-BMI < 25 kg/m2, overweight-BMI = 25–29.9 kg/m2, obese-BMI ≥ 30 kg/m2.
- Laboratory investigations;
- Biochemical tests: alanine aminotransferase (ALT), aspartate aminotransferase (AST) by spectrophotometric method, fasting glucose by spectrophotometric method, fasting insulin by hexokinase method, total cholesterol (TC) and triglycerides (TG) by spectrophotometric method. We determined serum iron (Fe/kg) by spectrophotometric method and also serum ferritin by electrochemiluminescence method (ECLIA).
- Assessment of insulin sensitivity: We determined insulin sensitivity using HOMA-IR (homeostasis model of insulin resistance) using the following formula: fasting plasma glucose (mg/dL) × fasting insulinemia (μU/mL)/405.
- Diagnostic tests for the detection of HBV infection:
- ○
- Serological assays for HBV serological markers (HBsAg, anti-HBsAc/Ab, anti-HBcAc/Ab, HBeAg, anti HBeAc/Ab) by Enzyme-linked immunosorbent Assay (ELISA)
- ○
- Molecular tests to detect viral particles. Testing for HBV DNA (PCR) to confirm the diagnosis and quantify the number of viral copies in the blood (viremia).
- Liver ultrasound, performed through epigastric and intercostal approach (transversal and longitudinal sections), was recorded through the dimensions of the left and right liver lobe, its echogenicity and structure, also diaphragm visibility, posterior attenuation, blood vessels’ appearance, the portal vein system and the spleen.
2.2. Patients
- Responders: patients whose PCR results showed early viral response (EVR).
- Non-responders: patients whose PCR results did not show EVR. The viral load result of respective patients was collected from patients.
- ALT serum levels
- HBV-DNA. If it has not decreased by more than 2log10, it is considered primary resistance and stops treatment.
- ALT;
- AgHBs;
- AgHBe;
- Anti-Hbe needle;
- HBV-DNA.
2.3. Statistical Analysis
3. Results
- Absent (score 0) when the echotexture of the liver is normal;
- Mild (score 1), diffusely increased hepatic echogenicity but periportal and diaphragmatic echogenicity is still appreciable;
- Moderate (score 2), diffusely increased hepatic echogenicity obscuring periportal echogenicity but diaphragmatic echogenicity is still appreciable;
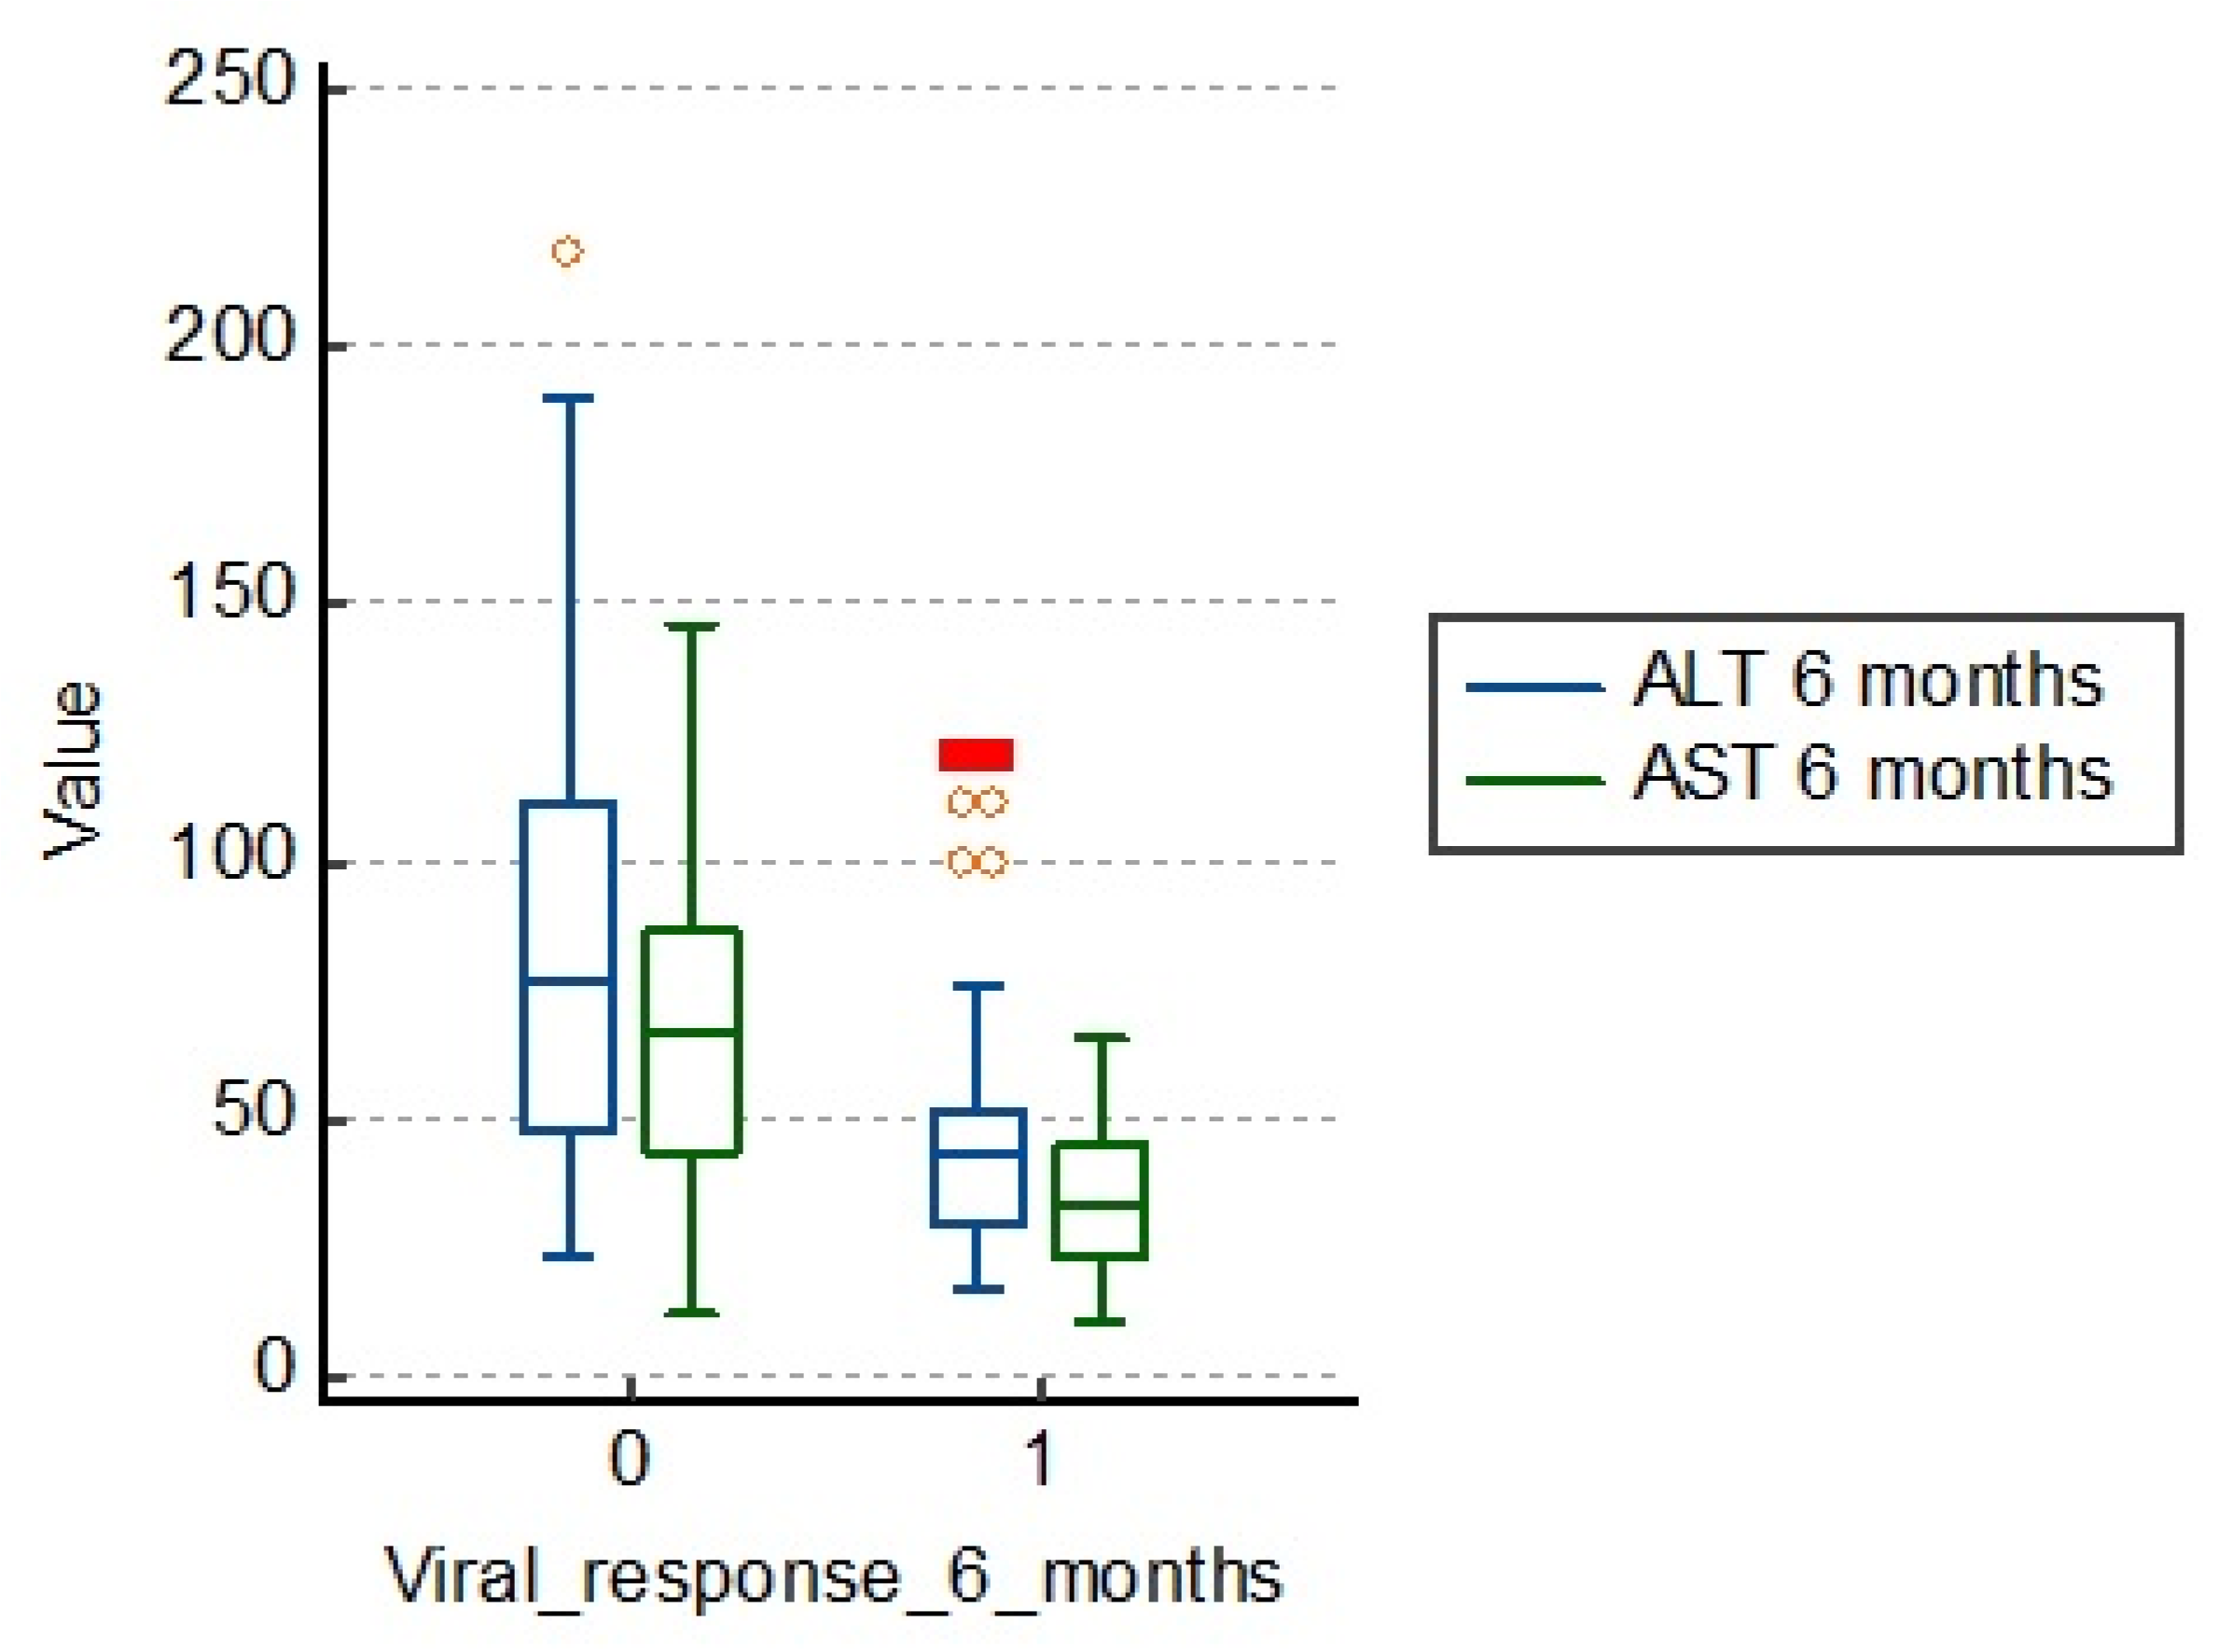
3.1. Influence of Cytolysis Enzyme Values
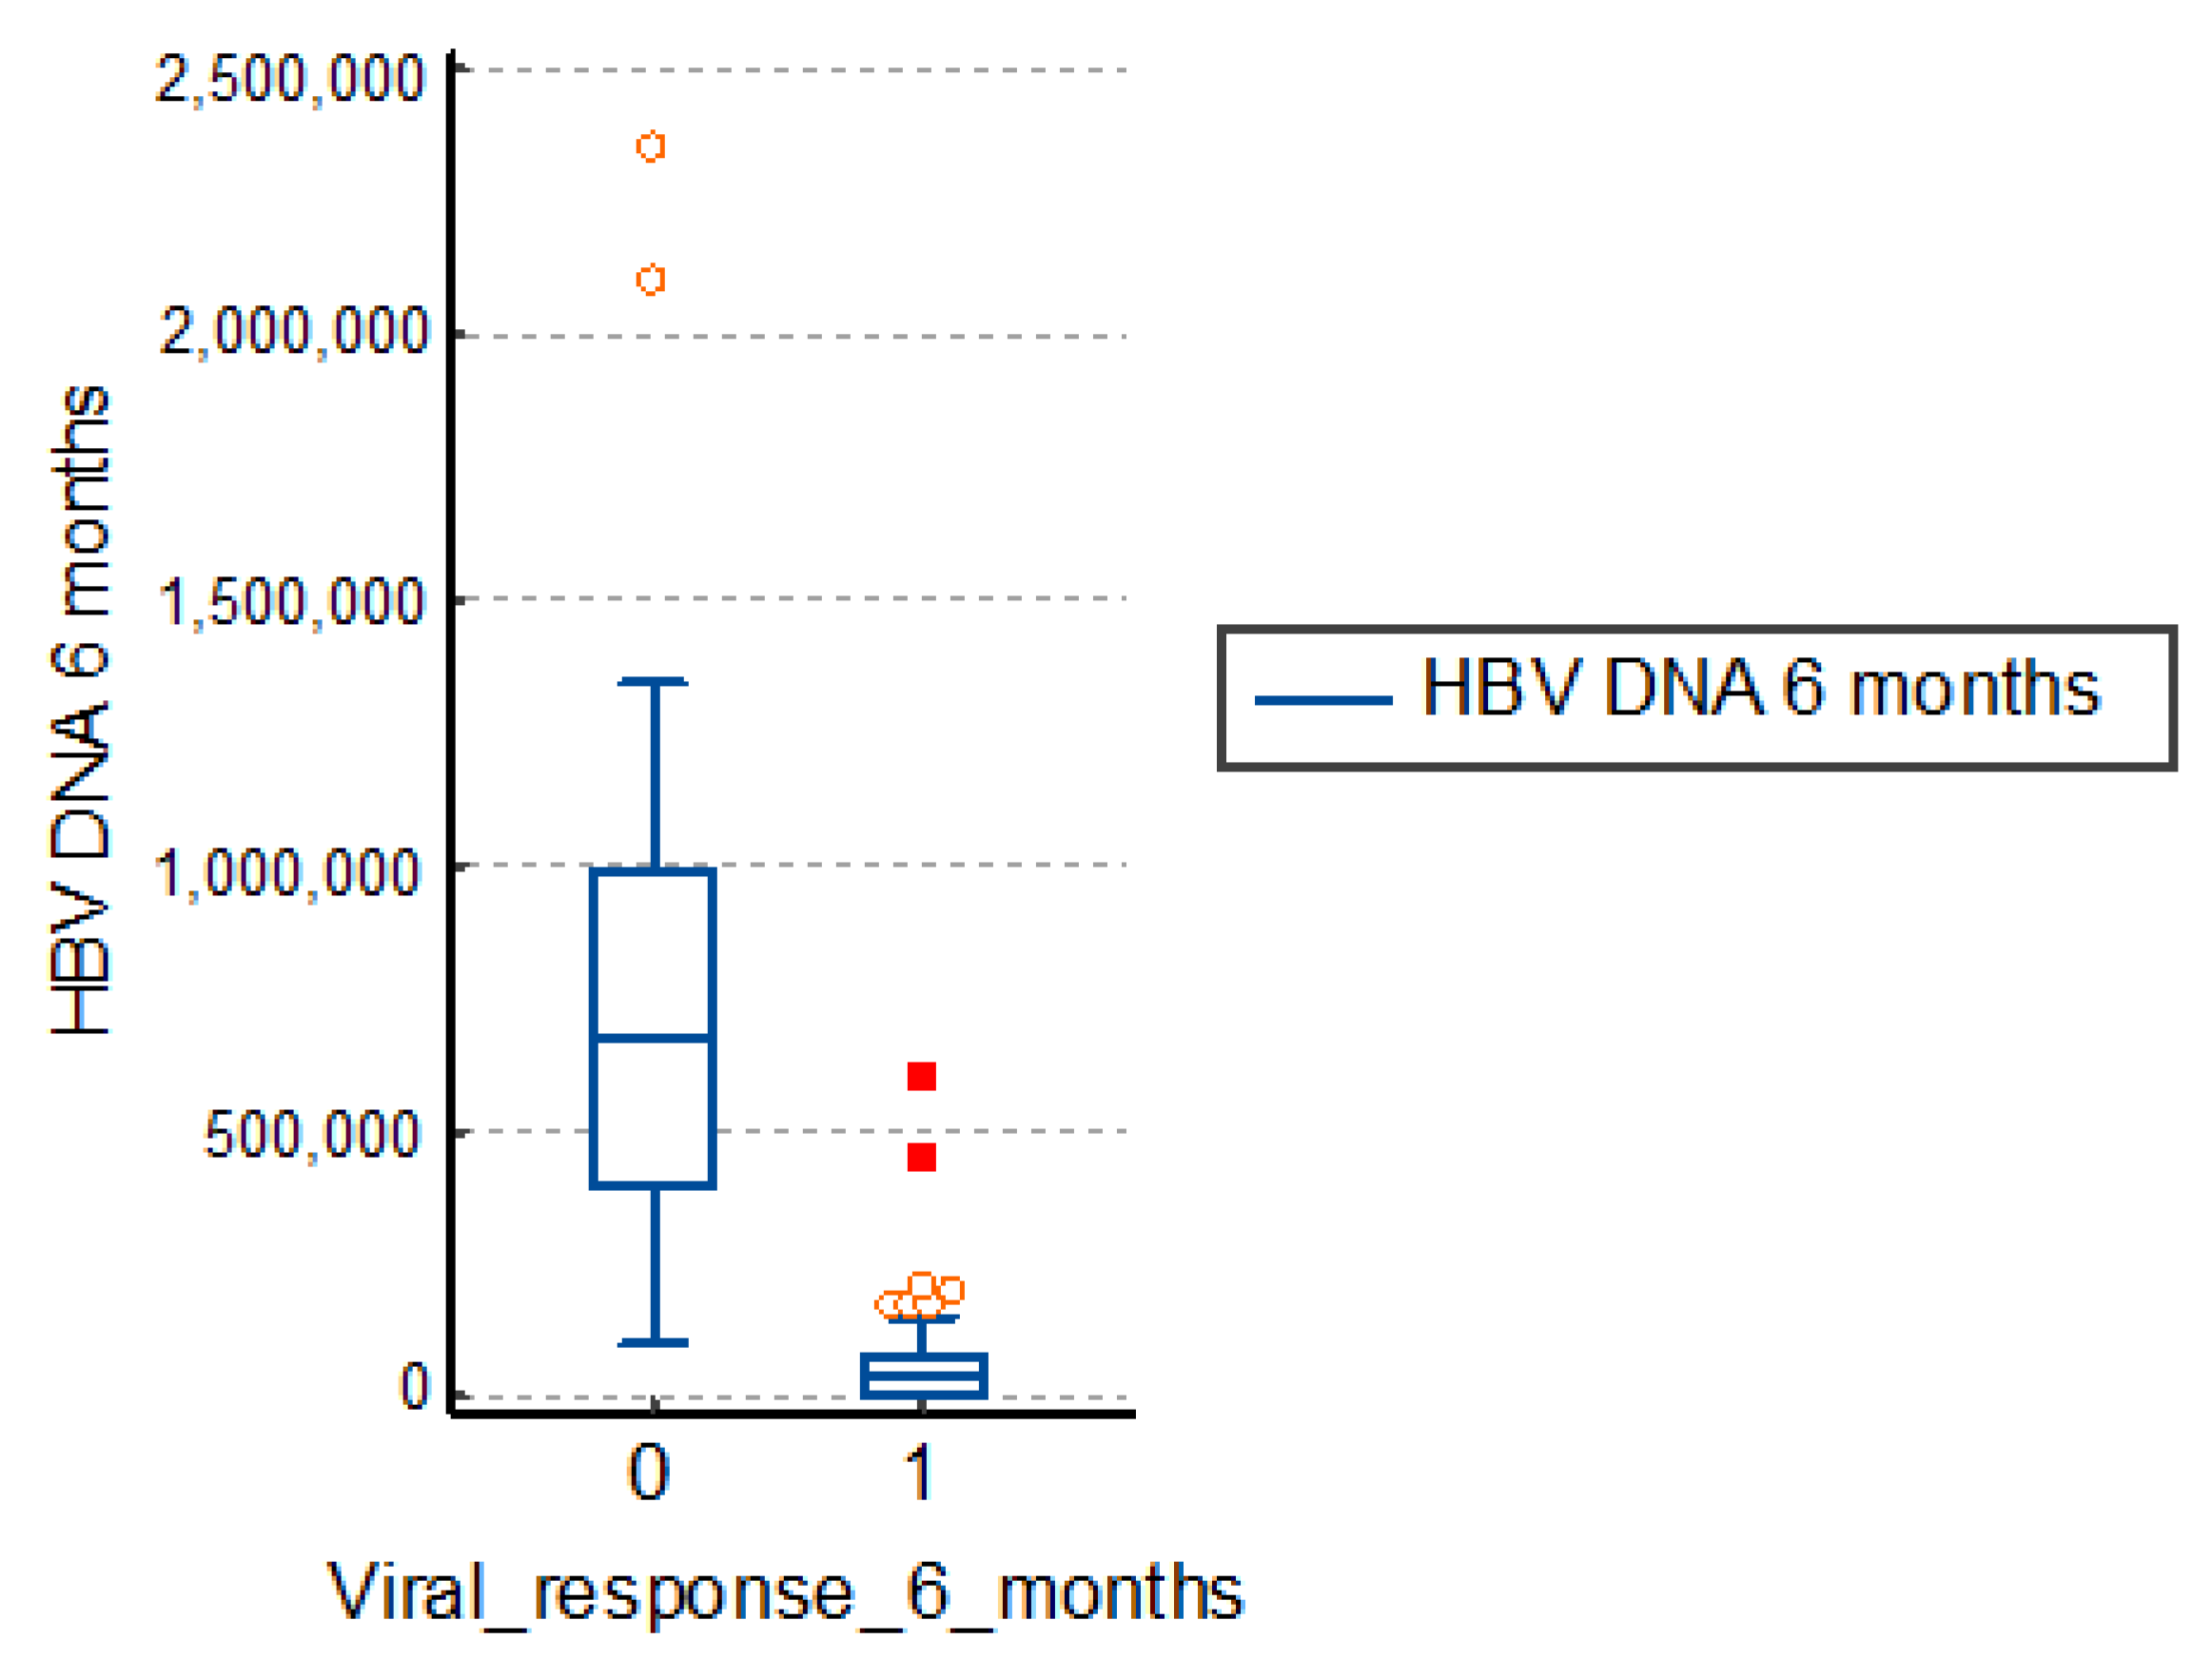
3.2. Influence of Viremia Values at 6 Months
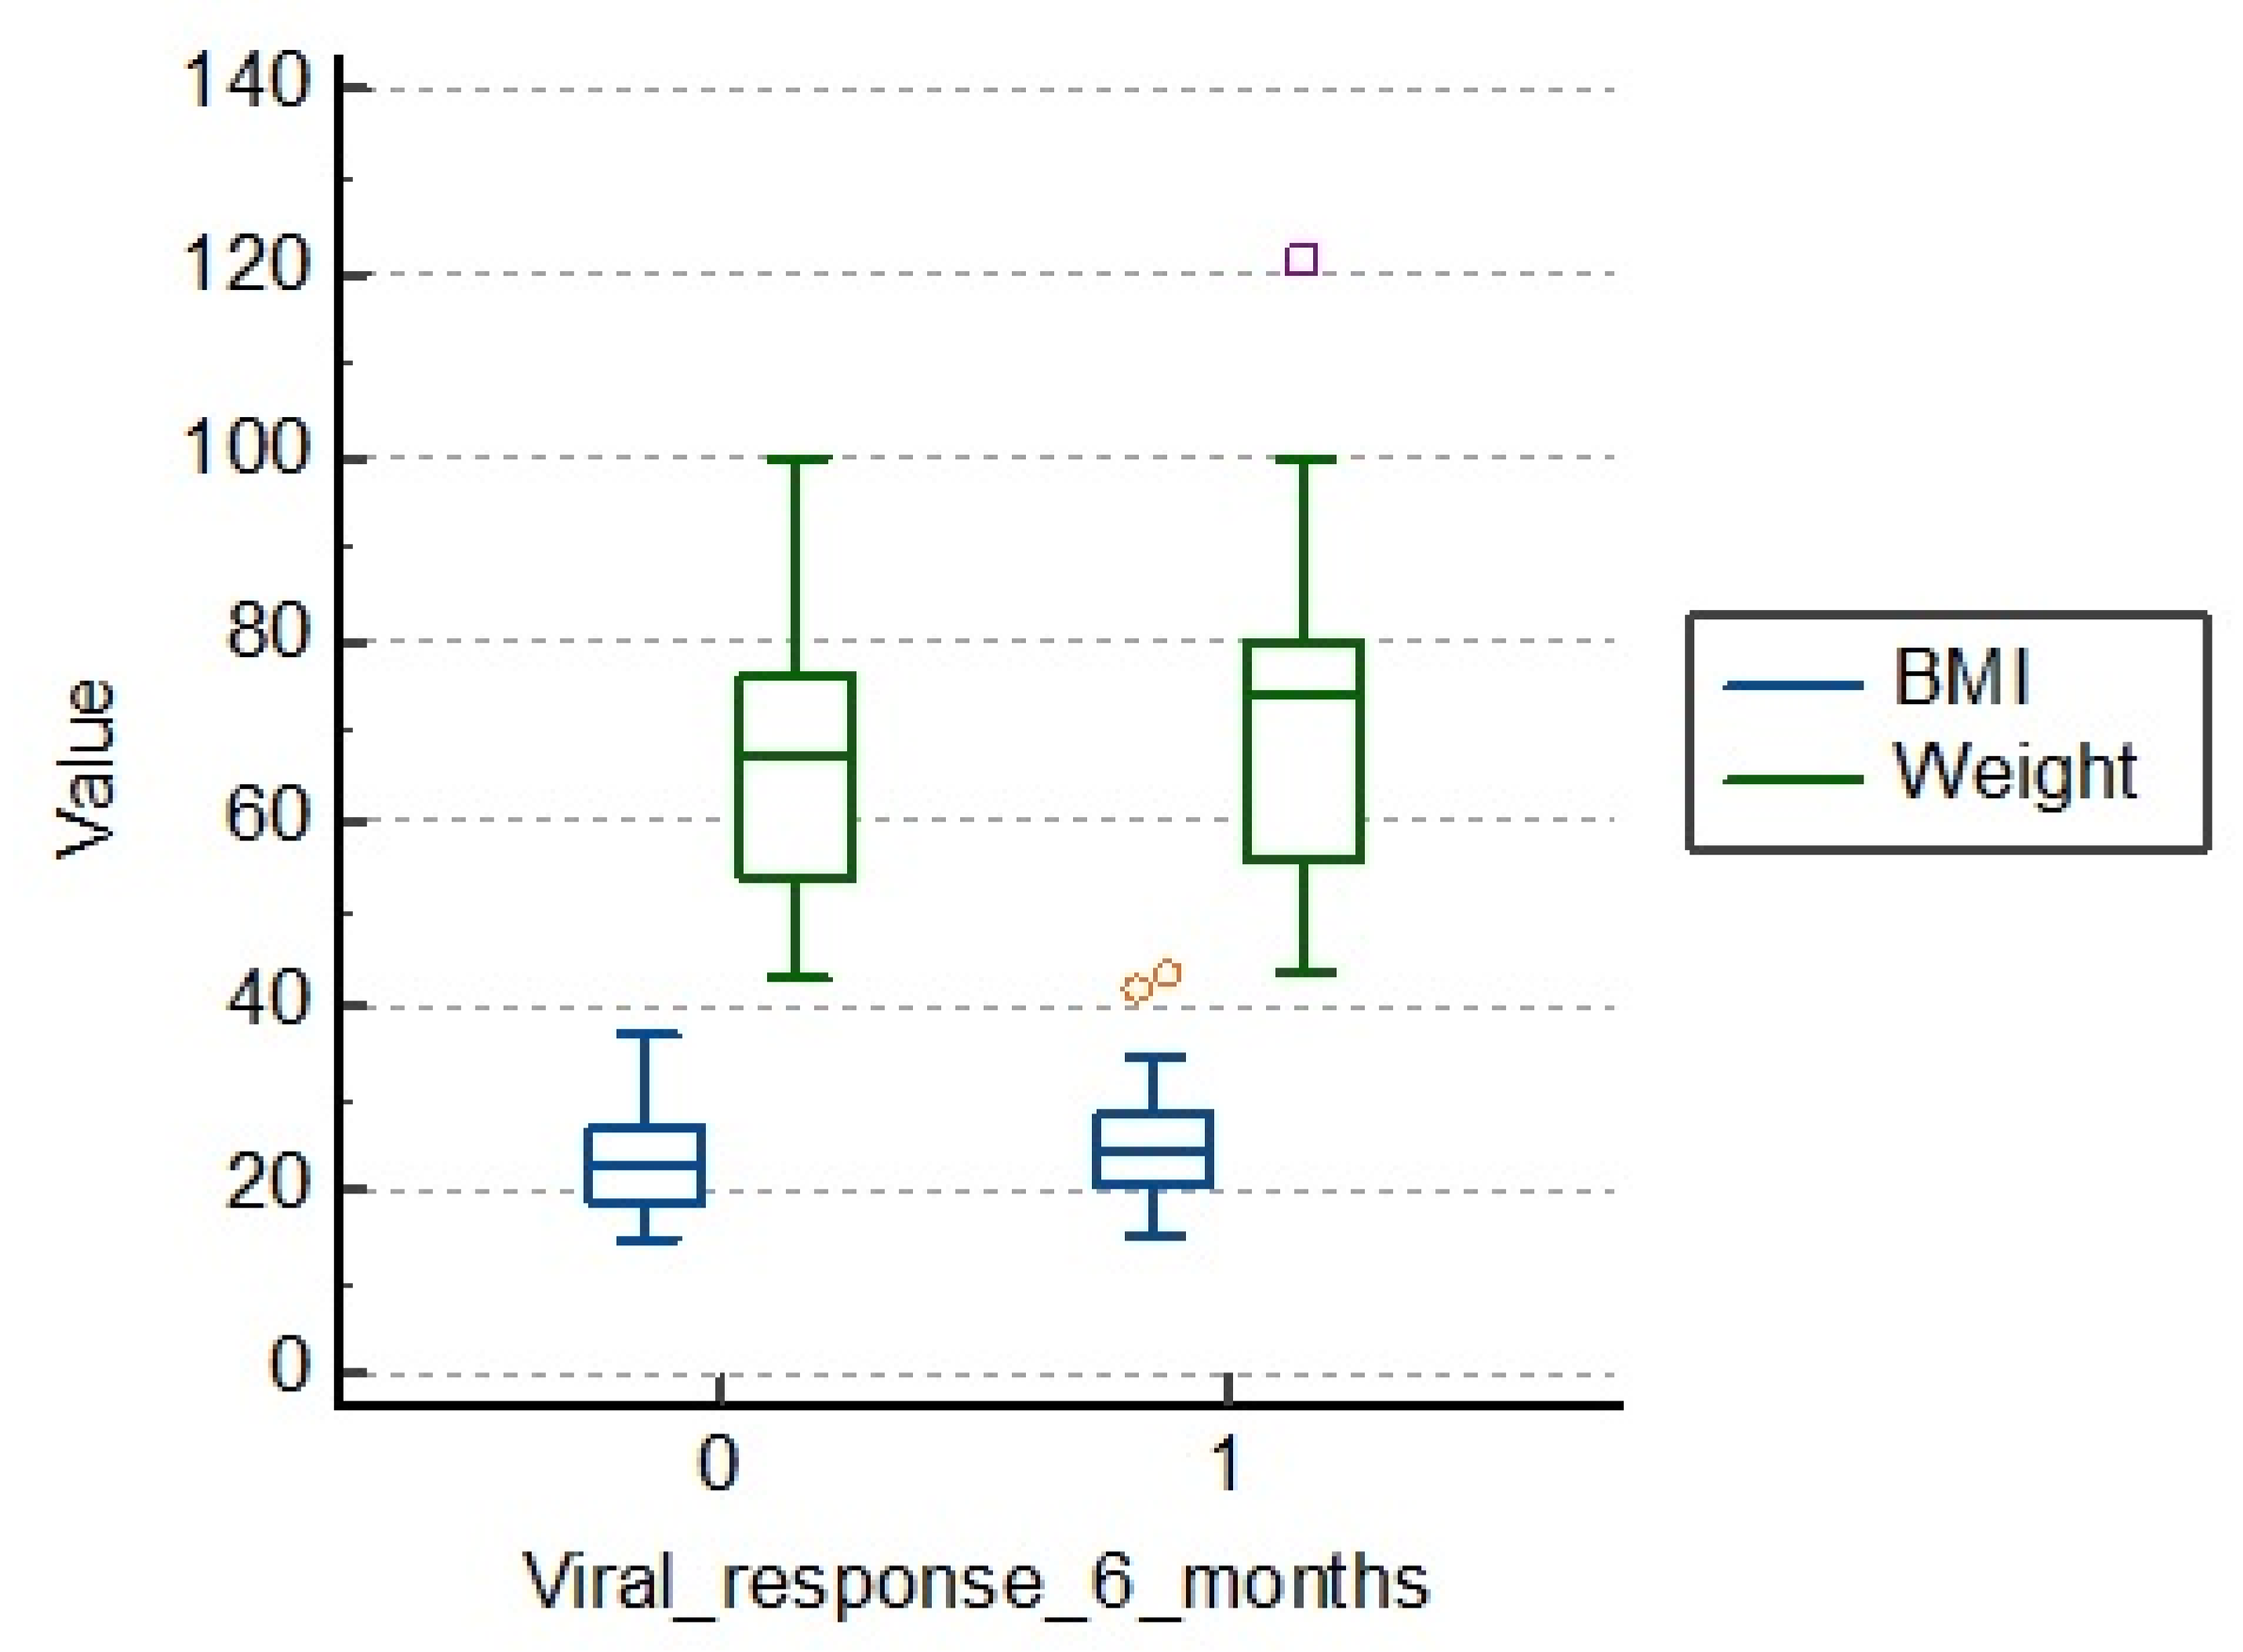
3.3. Influence of BMI and Weight Values
3.4. Influence of Factors Related to Carbohydrate Metabolism (Fasting Glucose, Fasting Insulin, HOMA-IR Index)
3.5. Influence of the Presence of Metabolic Syndrome on 6 Months’ Viral Response
4. Discussion
5. Conclusions
- The index HOMA, serum insulin levels alongside baseline HBV-DNA levels, baseline mean blood glucose, steatosis score and liver iron score may have a predictive value for obtaining an early viral response in chronic hepatitis B.
- The predictive factors of a favorable response in patients with chronic hepatitis B treated with α-IFN are represented by younger age, serum levels of ALT and HBV- DNA levels.
- Patients with high viral load and high degree of insulin resistance were less likely to acquire a virological response in chronic hepatitis B treated with Peg-IFN, regardless of age, BMI, hepatic cytolysis enzymes, cholesterol and triglycerides.
- There are a number of factors that can interfere with the viral response. Viral load, liver iron score and insulin resistance index seem to have a significant degree of predictability in regard of the viral response to the treatment in chronic hepatitis B. Thus, patients with high viral load and high degree of insulin resistance were less likely to acquire a virological response in chronic hepatitis B treated with Peg-IFN, regardless of age, BMI, hepatic cytolysis enzymes, cholesterol and triglycerides.
Author Contributions
Funding
Institutional Review Board Statement
Informed Consent Statement
Data Availability Statement
Conflicts of Interest
References
- Guvenir, M.; Arikan, A. Hepatitis B Virus: From Diagnosis to Treatment. Pol. J. Microbiol. 2020, 69, 391–399. [Google Scholar] [CrossRef] [PubMed]
- WHO. Hepatitis B Key Facts. Available online: https://www.who.int/news-room/fact-sheets/detail/hepatitis-b (accessed on 1 July 2020).
- Jefferies, M.; Rauff, B.; Rashid, H.; Lam, T.; Rafiq, S. Update on global epidemiology of viral hepatitis and preventive strategies. World J. Clin. Cases 2018, 6, 589–599. [Google Scholar] [CrossRef]
- Terrault, N.A.; Lok, A.S.; McMahon, B.J.; Chang, K.-M.; Hwang, J.; Jonas, M.M.; Brown, R.S., Jr.; Bzowej, N.H.; Wong, J.B. Update on prevention, diagnosis, and treatment of chronic hepatitis B: AASLD 2018 hepatitis B guidance. Hepatology 2018, 67, 1560–1599. [Google Scholar] [CrossRef]
- Kim, B.H.; Kim, W.R. Epidemiology of Hepatitis B Virus Infection in the United States. Clin. Liver Dis. 2018, 12, 1–4. [Google Scholar] [CrossRef]
- CDC. Interpretation of Hepatitis B Serological Tests Results. Available online: https://www.cdc.gov/hepatitis/hbv/index.htm (accessed on 5 March 2020).
- Zhang, J.; Lin, S.; Jiang, D.; Li, M.; Chen, Y.; Li, J.; Fan, J. Chronic hepatitis B and non-alcoholic fatty liver disease: Conspirators or competitors? Liver Int. 2019, 40, 496–508. [Google Scholar] [CrossRef] [Green Version]
- Colangelo, L.A.; Gapstur, S.M.; Gann, P.H.; Dyer, A.R.; Liu, K. Colorectal cancer mortality and factors related to the insulin resistance syndrome. Cancer Epidemiol. Biomark. Prev. 2002, 11, 385–391. [Google Scholar]
- Chen, C.; Yang, H.; Yang, W.-S.; Liu, C.-J.; Chen, P.-J.; You, S.; Wang, L.; Sun, C.; Lu, S.; Chen, D.-S.; et al. Metabolic Factors and Risk of Hepatocellular Carcinoma by Chronic Hepatitis B/C Infection: A Follow-up Study in Taiwan. Gastroenterology 2008, 135, 111–121. [Google Scholar] [CrossRef]
- Forţofoiu, M.; Forţofoiu, M.C.; Comănescu, V.; Dobrinescu, A.C.; Pădureanu, V.; Vere, C.C.; Streba, C.T.; Ciurea, P.L. Hepatocellular car-cinoma and metabolic diseases—histological perspectives from a series of 14 cases. Rom. J. Morphol. Embryol. 2015, 56, 1461–1465. [Google Scholar] [PubMed]
- Senoymak, M.C.; Ozkan, H. Evaluation of the Relationship between Insulin Resistance and HBV DNA Level in Patients with HBeAg-negative Chronic HBV Infection (Natural Course Phase 3). Euroas. J. Hepatogastroenterol. 2020, 10, 85–91. [Google Scholar]
- Niederau, C.; Heintges, T.; Lange, S.; Goldmann, G.; Niederau, C.M.; Mohr, L.; Häussinger, D. Long-Term Follow-up of HBeAg-Positive Patients Treated with Interferon Alfa for Chronic Hepatitis, B. N. Engl. J. Med. 1996, 334, 1422–1427. [Google Scholar] [CrossRef] [PubMed]
- Lok, A.S.F.; McMahon, B.J. Chronic hepatitis B: Update 2009. Hepatology 2009, 50, 661–662. [Google Scholar] [CrossRef] [PubMed]
- Popescu, M.; Popescu, I.A.; Stanciu, M.; Cazacu, S.M.; Ianoşi, N.G.; Comănescu, M.V.; Singer, C.E.; Neagoe, C.D. Non-alcoholic fatty liver disease—clinical and histopathological aspects. Rom. J. Morphol. Embryol. 2016, 57, 1295–1302. [Google Scholar]
- Kim, S.H.; Lee, J.M.; Kim, J.H.; Kim, K.G.; Han, J.K.; Lee, K.H.; Park, S.H.; Yi, N.-J.; Suh, K.-S.; An, S.K.; et al. Appropriateness of a Donor Liver with Respect to Macrosteatosis: Application of Artificial Neural Networks to US Images—Initial Experience. Radiology 2005, 234, 793–803. [Google Scholar] [CrossRef]
- Hernaez, R.; Lazo, M.; Bonekamp, S.; Kamel, I.; Brancati, F.L.; Guallar, E.; Clark, J.M. Diagnostic accuracy and reliability of ultrasonography for the detection of fatty liver: A meta-analysis. Hepatology 2011, 54, 1082–1090. [Google Scholar] [CrossRef] [Green Version]
- Dasarathy, S.; Dasarathy, J.; Khiyami, A.; Joseph, R.; Lopez, R.; McCullough, A.J. Validity of real time ultrasound in the diagnosis of hepatic steatosis: A prospective study. J. Hepatol. 2009, 51, 1061–1067. [Google Scholar] [CrossRef] [PubMed]
- Van Werven, J.R.; Marsman, H.A.; Nederveen, A.J.; Smits, N.J.; Kate, F.J.T.; Van Gulik, T.M.; Stoker, J. Assessment of Hepatic Steatosis in Patients Undergoing Liver Resection: Comparison of US, CT, T1-weighted Dual-Echo MR Imaging, and Point-resolved1H MR Spectroscopy. Radiology 2010, 256, 159–168. [Google Scholar] [CrossRef] [Green Version]
- Ferraioli, G.; Monteiro, L.B.S. Ultrasound-based techniques for the diagnosis of liver steatosis. World J. Gastroenterol. 2019, 25, 6053–6062. [Google Scholar] [CrossRef]
- Minakari, M.; Molaei, M.; Shalmani, H.M.; Alizadeh, A.H.M.; Jazi, A.H.D.; Naderi, N.; Shavakhi, A.; Mashayekhi, R.; Zali, M. Liver steatosis in patients with chronic hepatitis B infection: Host and viral risk factors. Eur. J. Gastroenterol. Hepatol. 2009, 21, 512–516. [Google Scholar] [CrossRef] [PubMed]
- Zheng, R.-D.; Chen, J.-N.; Zhuang, Q.-Y.; Lu, Y.-H.; Chen, J.; Chen, B.-F. Clinical and Virological Characteristics of Chronic Hepatitis B Patients with Hepatic Steatosis. Int. J. Med. Sci. 2013, 10, 641–646. [Google Scholar] [CrossRef] [Green Version]
- Shi, J.P.; Lu, L.; Qian, J.C.; Ang, J.; Xun, Y.H.; Guo, J.C.; Shi, W.L.; Wang, Y.F.; Fan, J.G. Impact of liver steatosis on antiviral effects of pegylated interferon-alpha in patients with chronic hepatitis B. Chin. J. Hepatol. 2012, 20, 285–288. [Google Scholar] [CrossRef] [PubMed]
- Lesmana, L.A.; Lesmana, C.R.; Pakasi, L.S.; Krisnuhoni, E. Prevalence of hepatic steatosis in chronic hepatitis B patients and its association with disease severity. Acta Med. Indon. 2012, 44, 35–39. [Google Scholar]


| Women (N = 72) | Men (N = 94) | ||||
|---|---|---|---|---|---|
| Mean | 95% CI | Mean | 95% CI | p | |
| Age (year) | 44.361 | 41.369–47.354 | 45.372 | 42.919–47.825 | 0.689 |
| Fasting glucose (mg/dL) | 101.653 | 98.108–105.197 | 98.074 | 94.427–101.722 | 0.09 |
| Fasting insulin (µU/mL) | 13.231 | 12.071–14.390 | 11.867 | 11.008–12.726 | 0.07 |
| Weight (kg) | 66.972 | 63.603–70.341 | 70.798 | 67.855–73.741 | 0.14 |
| BMI (kg/m2) | 23 | 22.502–25.161 | 24.515 | 23.96–25.635 | 0.5 |
| ALT T0 (U/L) | 154 | 136.654–172.512 | 143.138 | 129.039–157.238 | 0.26 |
| AST T0 (U/L) | 135 | 118.986–152.847 | 119.085 | 105.924–132.246 | 0.06 |
| HBV DNA T0 (UI/mL) | 3,425,458 | 2,692,369–4,158,547 | 3,681,361 | 2,984,874–4,377,848 | 0.80 |
| N | Median AST | Median ALT | p | |
|---|---|---|---|---|
| Viral response months = 0 | 50 | 66 | 83.5 | <0.001 |
| Viral response months = 1 | 116 | 36.2 | 43.5 |
| N | Median HBV-DNA 6 Months (UI/mL) | p | |
|---|---|---|---|
| Viral response 6 months = 0 | 50 | 731,818 | <0.001 |
| Viral response 6 months = 1 | 116 | 57,074.8 |
| N | Median BMI (kg/m2) | Median Weight (kg) | p | |
|---|---|---|---|---|
| Viral response 6 months = 0 | 50 | 23.2 | 65.7 | 0.7 |
| Viral response 6 months = 1 | 116 | 24.6 | 70.6 |
| N | Median Fasting Glucose (mg/dL) | Median Fasting Insulin | Median HOMA_IR | p | |
|---|---|---|---|---|---|
| Viral response 6 months = 0 | 50 | 105.0 | 14.3 | 3.7 | 0.001 |
| Viral response 6 months = 1 | 116 | 97.3 | 11.6 | 2.8 |
| Metabolic Syndrome Absent | Metabolic Syndrome Present | Total | |
|---|---|---|---|
| Viral response 6 months = 0 | 31 (24.03%) | 19 (51.35%) | 50 (30.1%) |
| Viral response 6 months = 1 | 98 (75.97%) | 18 (48.65%) | 116 (69.9%) |
| Total | 129 (77.7%) | 37 (22.3%) | 166 |
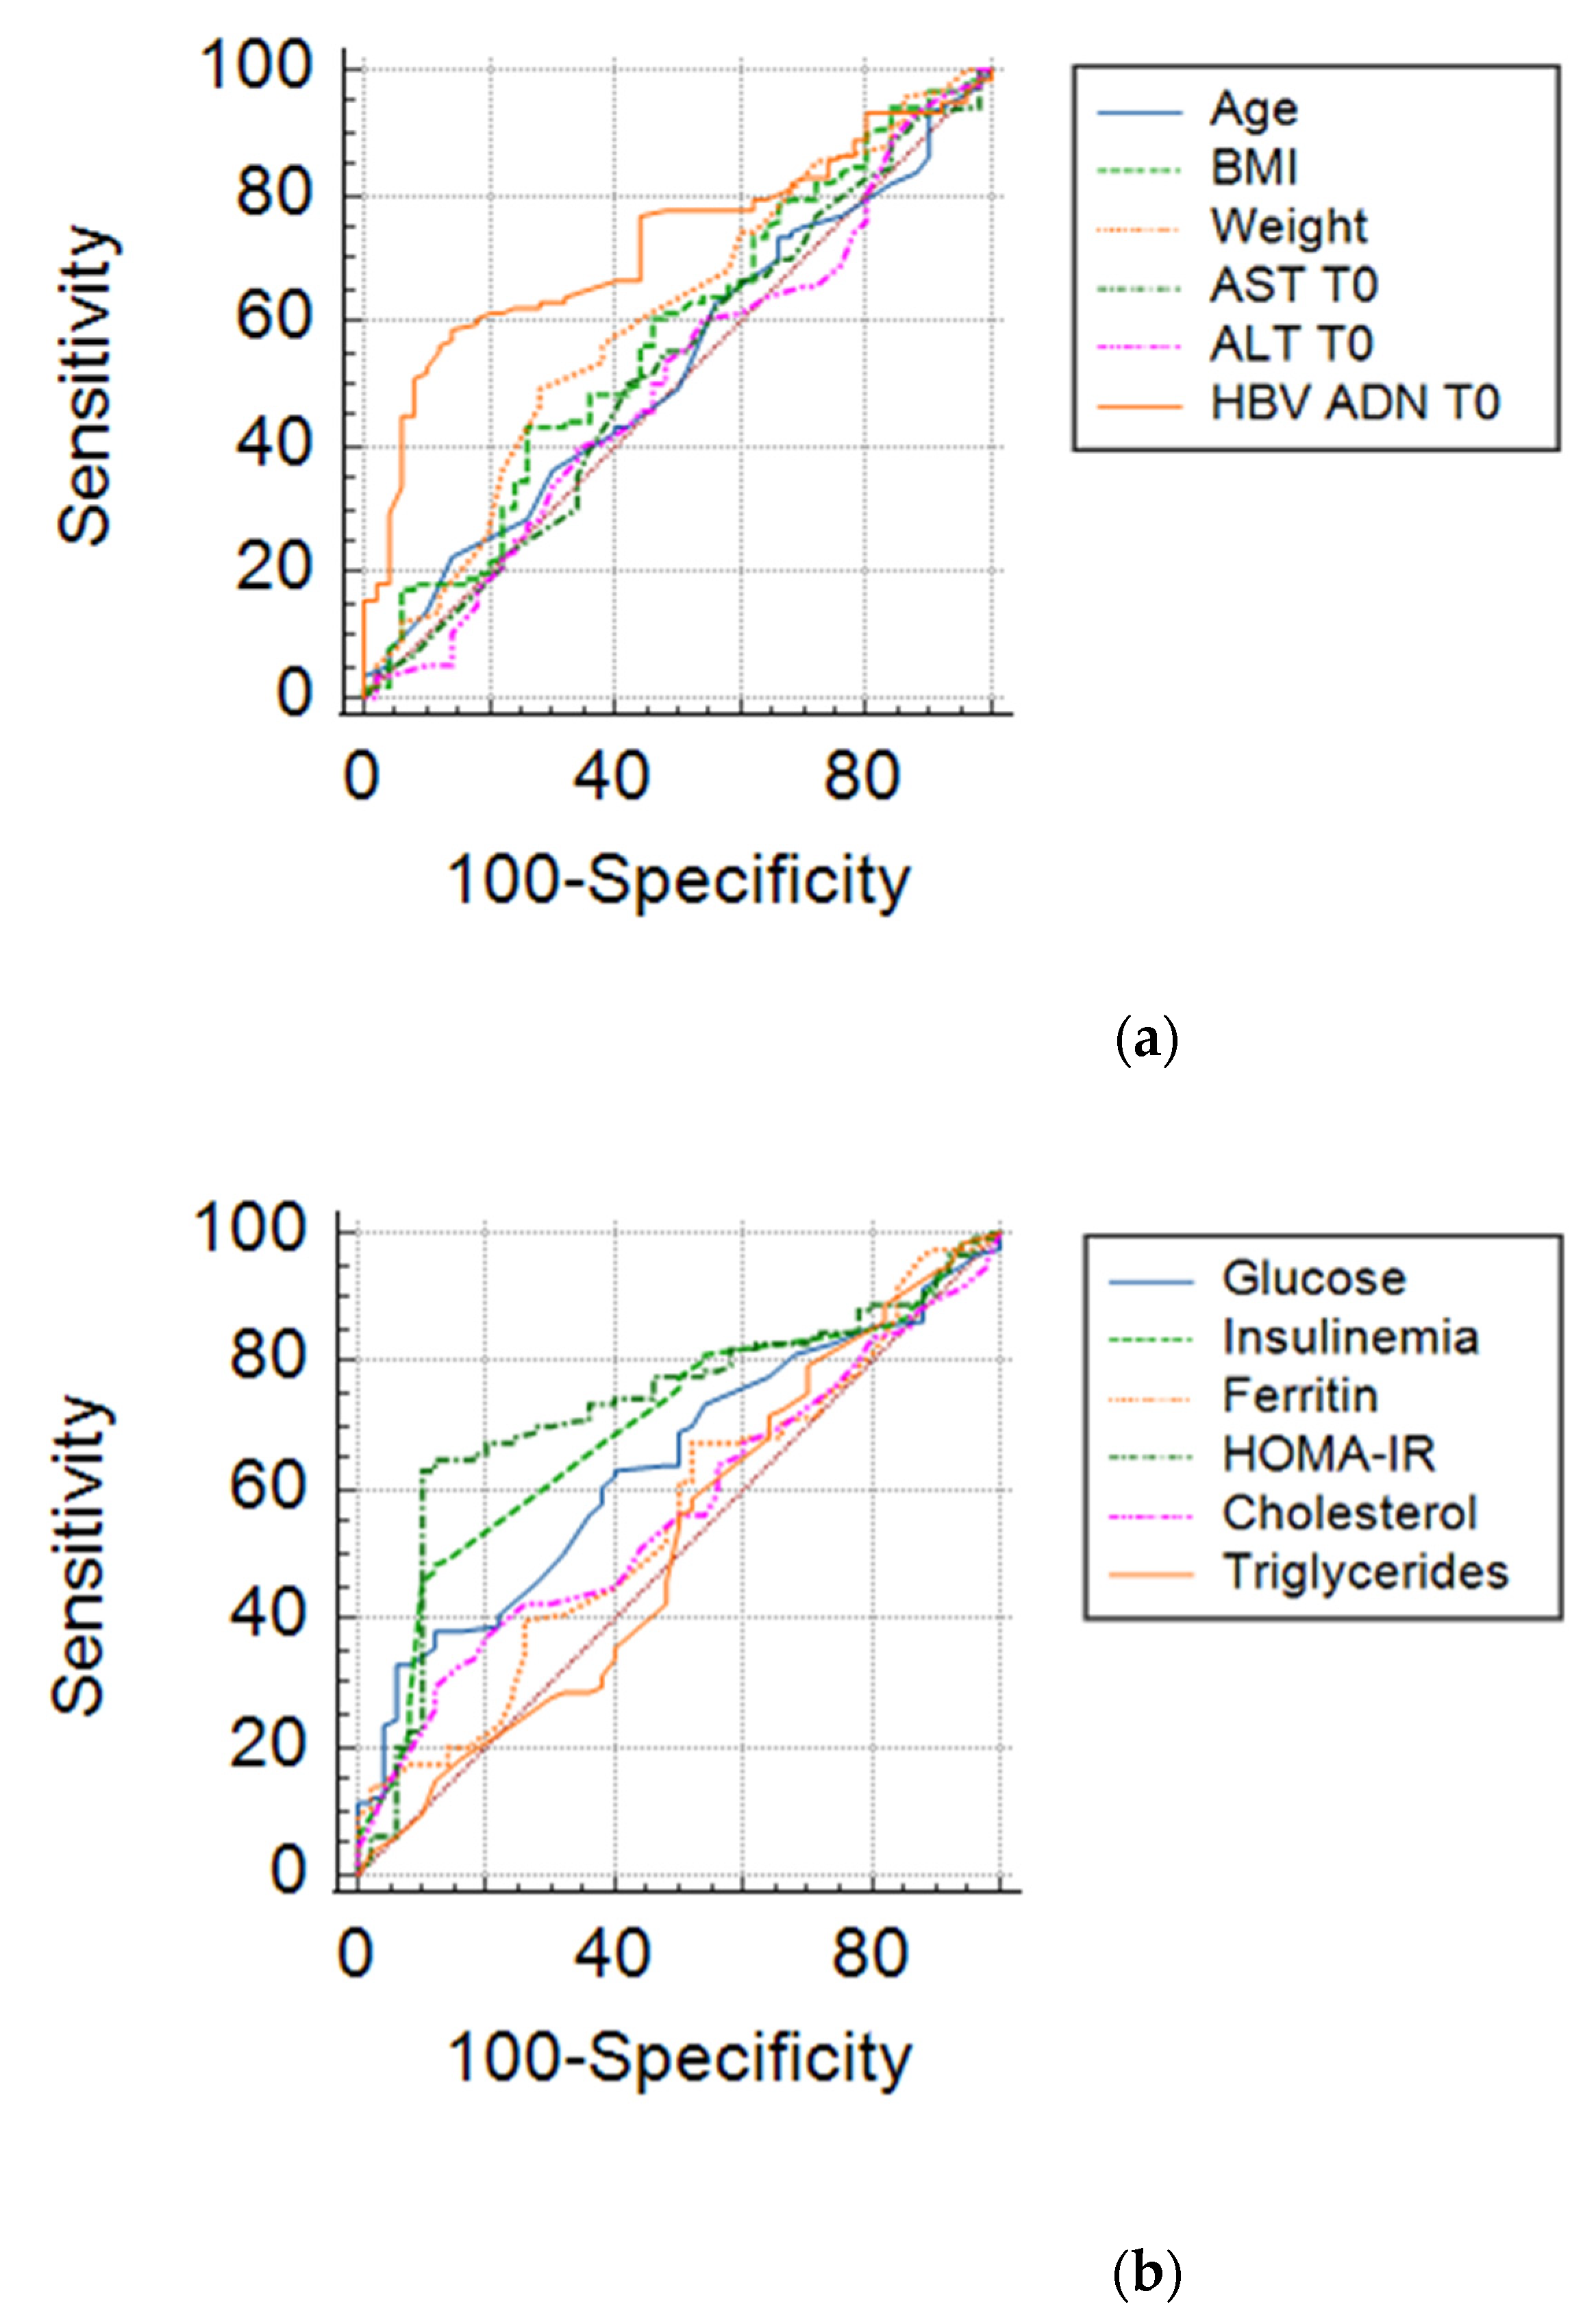
| AUC | St. Error | 95% CI | Predictive Value | |
|---|---|---|---|---|
| HOMA_IR | 0.724 | 0.0428 | 0.640–0.808 | YES |
| Initial value of HBV-DNA | 0.721 | 0.0397 | 0.643–0.799 | YES |
| Fasting insulin | 0.694 | 0.0426 | 0.610–0.777 | YES |
| Fasting glucose | 0.638 | 0.0440 | 0.552–0.725 | YES |
| Weight | 0.603 | 0.0484 | 0.508–0.697 | NO |
| Serum cholesterol | 0.597 | 0.0474 | 0.504–0.690 | NO |
| BMI | 0.574 | 0.0488 | 0.478–0.670 | NO |
| Serum ferritin | 0.557 | 0.0480 | 0.463–0.651 | NO |
| Age | 0.528 | 0.0480 | 0.434–0.622 | NO |
| AST | 0.521 | 0.0498 | 0.423–0.619 | NO |
| Serum Triglyceride | 0.514 | 0.0499 | 0.416–0.611 | NO |
| ALT | 0.504 | 0.0498 | 0.406–0.601 | NO |
| Parameter | Optimal Value | 95% CI | SE (%) | SP (%) | +LR (%) | −LR (%) | PPV (%) |
|---|---|---|---|---|---|---|---|
| HOMA_IR | ≤2.64 | 2.37–2.91 | 64.66 | 88.00 | 5.39 | 0.40 | 69.70 |
| Initial value of HBV-DNA | ≤170,000 | 79,000–170,000 | 96.55 | 94.00 | 16.09 | 0.037 | 87.33 |
| Level of serum insulin at the beginning of treatment | ≤15.8 | 11–21 | 81.03 | 46.00 | 1.5 | 0.41 | 39.13 |
| Level of serum glucose at the beginning of treatment | ≤178 | 110–178 | 100.00 | 0.00 | 1 | - | - |
Publisher’s Note: MDPI stays neutral with regard to jurisdictional claims in published maps and institutional affiliations. |
© 2021 by the authors. Licensee MDPI, Basel, Switzerland. This article is an open access article distributed under the terms and conditions of the Creative Commons Attribution (CC BY) license (https://creativecommons.org/licenses/by/4.0/).
Share and Cite
Ghenea, A.E.; Pădureanu, V.; Cioboată, R.; Udriștoiu, A.-L.; Drocaş, A.I.; Țieranu, E.; Carsote, M.; Vasile, C.M.; Moroşanu, A.; Biciușcă, V.; et al. The Study of Clinical and Biochemical Parameters in Assessing the Response to the Antiviral Therapy in the Chronic Viral Hepatitis B. Medicina 2021, 57, 757. https://doi.org/10.3390/medicina57080757
Ghenea AE, Pădureanu V, Cioboată R, Udriștoiu A-L, Drocaş AI, Țieranu E, Carsote M, Vasile CM, Moroşanu A, Biciușcă V, et al. The Study of Clinical and Biochemical Parameters in Assessing the Response to the Antiviral Therapy in the Chronic Viral Hepatitis B. Medicina. 2021; 57(8):757. https://doi.org/10.3390/medicina57080757
Chicago/Turabian StyleGhenea, Alice Elena, Vlad Pădureanu, Ramona Cioboată, Anca-Loredana Udriștoiu, Andrei Ioan Drocaş, Eugen Țieranu, Mara Carsote, Corina Maria Vasile, Aritina Moroşanu, Viorel Biciușcă, and et al. 2021. "The Study of Clinical and Biochemical Parameters in Assessing the Response to the Antiviral Therapy in the Chronic Viral Hepatitis B" Medicina 57, no. 8: 757. https://doi.org/10.3390/medicina57080757
APA StyleGhenea, A. E., Pădureanu, V., Cioboată, R., Udriștoiu, A.-L., Drocaş, A. I., Țieranu, E., Carsote, M., Vasile, C. M., Moroşanu, A., Biciușcă, V., Salan, A.-I., Turculeanu, A., & Ungureanu, A. (2021). The Study of Clinical and Biochemical Parameters in Assessing the Response to the Antiviral Therapy in the Chronic Viral Hepatitis B. Medicina, 57(8), 757. https://doi.org/10.3390/medicina57080757