Abstract
Background: Coal production and marketing enterprises can significantly reduce transportation costs and improve their competitiveness by choosing appropriate road transportation companies. Methods: Based on this, a trapezoidal fuzzy SWARA-COPRAS method is proposed to select coal transportation companies. The trapezoidal fuzzy SWARA method is used to determine the index weight of coal transportation companies. The ranking of coal transportation companies is determined using the trapezoidal fuzzy COPRAS method. Results: Taking a coal production and marketing enterprise in Hubei, China as an example, the application of the trapezoidal fuzzy SWARA-COPRAS method is illustrated, and the coal transportation companies are sorted and analyzed for sensitivity. Conclusions: Compared with the results of other methods, the effectiveness and practicability of the trapezoidal fuzzy SWARA-COPRAS method are verified.
1. Introduction
The notice of China’s “13th Five-Year Plan for Energy Conservation and Emission Reduction” required the proportion of coal in total energy consumption to be reduced to less than 58% by 2020, and at the same time, vigorously promoted the “return to the railway.” The China Railway Corporation required the national railway coal transport volume to reach 2.81 billion tons by 2020, accounting for 75% of the national coal output. This has led to a reduction in coal consumption in society and a huge change in the transportation capacity structure of the coal transportation industry. Many road transportation companies are bound to be eliminated, and the competition between coal production and marketing companies will become more intense.
The “Fourteenth Five-Year Plan for Energy Conservation and Emission Reduction” has not yet been issued. The National Development and Reform Commission is studying and formulating a comprehensive plan for energy conservation and emission reduction during the Fourteenth Five-Year Plan to further refine the implementation of energy-saving goals and tasks. In the “Carbon Peaking Action Plan by 2030” issued by the State Council of China, it is mentioned that the growth of coal consumption should be strictly and rationally controlled during the 14th Five-Year Plan period, which will gradually decrease during the 15th Five-Year Plan period. During the “14th Five-Year Plan” period, significant progress has been made in the adjustment and optimization of the industrial structure and energy structure; the energy utilization efficiency of key industries has been greatly improved; the growth of coal consumption has been strictly controlled; the construction of new power systems has been accelerated, and the R&D, promotion and application of green and low-carbon technologies have made new progress; Green production and lifestyle have been widely promoted; and the policy system conducive to the development of green and low-carbon recycling has been further improved. By 2025, the proportion of non-fossil energy consumption will reach about 20%, energy consumption per unit of GDP will drop by 13.5% from 2020, and carbon dioxide emissions per unit of GDP will drop by 18% from 2020, laying a solid foundation for achieving carbon peaks. During the “15th Five-Year Plan” period, significant progress has been made in the adjustment of industrial structure, a clean, low-carbon, safe and efficient energy system has been initially established, a low-carbon development model in key areas has taken shape, and the energy utilization efficiency of key energy-consuming industries has reached the international advanced level. Non-fossil energy and the proportion of consumption has further increased, coal consumption has gradually decreased, key breakthroughs have been made in green and low-carbon technologies, green lifestyles have become the conscious choice of the public, and the green and low-carbon circular development policy systems are sound. By 2030, the proportion of non-fossil energy consumption will reach about 25%, and the carbon dioxide emissions per unit of GDP will be reduced by more than 65% compared with 2005, and the goal of peaking carbon before 2030 will be successfully achieved. As a basic energy source, coal has always occupied a dominant position in my country’s energy production and consumption structure. My country is the country with the largest coal producer in the world, accounting for 49% of the world’s share. The main methods of coal transportation include railway transportation, water transportation, and road transportation. The transportation ratio of the three is about 6:3:1. Railway transportation and waterway transportation have the characteristics of large volume and low cost and are the main methods of coal transportation. Road transportation has the characteristics of maneuverability and point-to-point transportation and is an important supplement to coal transportation. Affected by various factors, road vehicles carry a large number of coal gathering and short-distance transportation tasks, and play an indispensable role in regional coal transportation. Coal production and marketing enterprises change the previous extensive business model, and reduce costs as much as possible, which is the fastest choice. This involves how coal production and marketing companies choose road transportation companies to improve service levels and reduce transportation costs.
Many scholars have researched the evaluation and selection of road transport companies according to the dynamic characteristics of suppliers; Ware [] et al. evaluated this by establishing a mixed-integer nonlinear programming model. Burak E [] and others used the Fuzzy-AHP method to evaluate suppliers for the fuzzy attributes of some evaluation indicators. Alejo Reyes Avelina [] studied the decision-making problems of supplier selection and order quantity allocation and proposed particle swarm optimization (PSO) and the differential evolution algorithm (DE). Krichanchai [] studied the relevant indicators of selecting suppliers for enterprises to manage inventory. The results show that high-quality suppliers can bring greater benefits to enterprises. HIrmayanti [] proposed the Analytic Hierarchy Process (AHP) to deal with the actual situation where it is difficult to make decisions in the selection of raw material suppliers. Aiming at supplier selection under uncertain demand, Sadrian [] and Pan [] studied supplier selection under a single objective linear programming model. The literature [,,] proposes that criteria such as product design and improving product sustainability should be taken into account when constructing the evaluation index system. The literature [,,] proposes that when facing the problem of supplier selection, the flexibility criterion of flexibility for order changes and uncertain requirements should be adopted.
The research on traditional multi-criteria decision-making problems mainly focuses on the condition that the attribute value and weight value are accurate. In 1981, Hwang and Yoon22 published the book “Multiple Attribute Decision Making: Methods and Applications”, which was the first time a book used TOPSIS (Technique for order performance by similarity to ideal solution) method to solve this kind of multi-criteria decision-making problem with certain information. In 1982, Zelenyy made the same interpretation of the method in his book “Multiple Criteria Decision Making”. However, these scholars mainly applied the method to multi-criteria decision problems with certain attribute values. The main multi-criteria decision-making methods are as follows:
(1) Weighted weighting method []:
The weighted weighting method is the most commonly used, especially in a single index multi-criteria decision-making problem; the decision value of each plan is equal to the sum of all the attribute values and attribute weights. The greater the decision value of the plan is, the more optimal the plan is.
(2) Analytical Hierarchy Process (AHP) []: In 1980, Saaty proposed the concept of the Analytic Hierarchy Process. Its basic idea is to decompose a complex problem into a target layer, a criterion layer, and an indicator layer. Layer indicators establish pairwise comparison judgment matrices, obtain the weight value of each plan by solving these matrices, and then select the optimal plan or sort them in a certain order. The main advantage of the Analytic Hierarchy Process is that it calculates the degree of consistency between the indicators in the process of solving. If the indicators do not meet the consistency requirements, they must be adjusted accordingly, which makes the decision makers choose the evaluation index more accurately. In recent years, the analytic hierarchy process has also been widely used in various disciplines.
(3) TOPSIS method [,,]: Since Huang and Yoon proposed this method in 1981, it has been widely used. The basic idea is that the selected positive ideal scheme has the best attribute value, and the negative ideal scheme has applications. The basic idea is that the selected positive ideal solution has the best attribute value, while the negative ideal solution has the smallest difference, and the distance difference from the negative ideal solution is the largest. In the specific solution, we assume that all the schemes have the characteristics of a convex increase or decrease so that it is easier to find the positive and negative ideal scheme values.
(4) ELECTRE (Elimination and choice translating reality) method []: In 1996, Roy introduced this method from the financial field to management decision making. Its basic idea is to focus on analyzing the superiority relationship between the options. Therefore, this method is mainly used to study the status relationship and coordination relationship between programs. Thus far, many scholars have expanded this method from different directions. However, because the solution system of the ELECTRE method is not perfect, it is sometimes difficult to find the optimal solution during the solution process.
There may be a certain degree of conflict between them to sort all the evaluation schemes. This method is more practical for multi-criteria decision-making problems with a limited number of options and a certain conflict between the evaluation attributes.
(5) PROMETHEE (Preference ranking organization method for enrichment evaluation) method []: In 1986, Brans et al. proposed a PROMETHEE method that is relatively simple in principle and application. The basic principle of this method is also based on advantages. The sorting algorithm between the relational schemes, in the process of solving, establishes a pairwise comparison matrix between the indicators and sorts all the judgment schemes through a series of indicators (these indicators may have certain conflicts). This method is more practical for multi-criteria decision-making problems with a limited number of options and a certain conflict between the evaluation attributes.
(6) Grey Relation Analysis (GRA) [,,]: In 1990, Deng proposed the Grey System Theory, which is used to study decision-making problems with uncertain information. The grey relational analysis method can be used to evaluate the correlation between the schemes.
In practical economic management decision-making problems, a fuzzy set theory exists and is widely used. In 1965, Professor L.A. Zadeh proposed fuzzy set theory, which can deal with uncertainty. Decision makers’ judgments are expressed by trapezoidal fuzzy numbers. Based on this, this paper discusses the selection of coal transportation companies from the perspective of trapezoidal fuzzy sets and proposes a trapezoidal fuzzy multi-criteria decision-making method based on the SWARA-COPRAS method of trapezoidal fuzzy sets. Based on expert expertise, experience, judgment, and relevant knowledge is used to determine the weight of experts, and the trapezoidal fuzzy SWARA method is used to determine the index weights of coal transportation companies. The trapezoidal fuzzy COPRAS method is used to determine the rank of coal transportation formulas. In the decision-making process, the conflicting factors in the indicators are considered, which increases the rationality of the decision making. This method considers the following two aspects: one is to comprehensively consider various uncertainties; second, the utility index and cost index of alternative coal transportation companies are comprehensively evaluated. Finally, through comparison and sensitivity analysis, the effectiveness and stability of the method are proven.
The structure of this paper is as follows. Section 2 introduces the trapezoidal fuzzy multi-criteria decision-making approach. Section 3 introduces the structural framework for selecting coal transportation companies. Section 4 takes the transportation company selected by a coal production and marketing company in Hubei, China as an example. Section 5 makes a sensitive analysis of the results. Section 6 concludes the paper.
2. Trapezoidal Fuzzy SWARA-COPRAS Approach
This section introduces a trapezoidal SWARA-COPRAS approach, which is used in the selection of coal transportation companies. This method combines trapezoidal fuzzy sets with the SWARA approach and COPRAS approach. The trapezoidal SWARA method is used to obtain the relative weight of the coal transportation evaluation index by soliciting the opinions of coal transportation experts, and the trapezoidal COPRAS approach is used to evaluate the coal transportation company. The establishment of a coal transportation expert team is a prerequisite for establishing the problem structure, determining the weights of evaluation indicators, and establishing a decision matrix. Therefore, the first action is to form a coal transportation expert team with coal-related expertise. The coal transportation expert team obtains relevant data of the coal transportation company through field research. In the next stage, the SWARA method is used to determine the evaluation index weight of the coal transportation company based on the survey data of the coal transportation expert team. In the end, the trapezoidal COPRAS approach is used to evaluate coal transportation companies and obtain a ranking of pros and cons. This section introduces the concepts and properties of fuzzy set theory and trapezoidal fuzzy numbers. Then, the trapezoidal SWARA approach and the trapezoidal COPRAS approach are proposed.
2.1. Fuzzy Set Theory
Definition 1
([]). is a non-empty set. Given a mapping,, a fuzzy subset ofis determined.is called the membership function ofor the membership degree ofto.
In the application of fuzzy mathematics, the membership function of the fuzzy set must be established first, and the membership function can be expressed by trapezoidal distribution. The expression of the membership function is as follows:
The is shown in the following Figure 1.
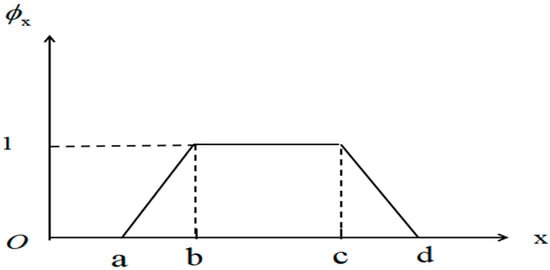
Figure 1.
Trapezoidal distribution image.
The fuzzy number of the trapezoidal distribution is represented by . In this paper, the graded mean integration representation is selected for defuzzification []. If the trapezoidal fuzzy number is , the defuzzification value can be calculated according to Equation (1):
where represents the degree of membership at any level, and its value range is .
Definition 2.
Let the trapezoidal fuzzy number ,,. The algorithms are as follows:
Fuzzy addition:
Fuzzy multiplication:
Fuzzy subtraction:
Fuzzy division:
Let , when ,
2.2. Trapezoidal Fuzzy SWARA Approach
The SWARA method is a new multi-criteria decision-making method for determining standard weight [,,,], which was first proposed by kersuliene. The combination of trapezoidal fuzzy set theory and the SWARA method is the trapezoidal fuzzy SWARA approach. The steps of determining the standard weight by the trapezoidal fuzzy SWARA approach are completely consistent with the SWARA approach. The specific steps are as follows:
Step 1: Sort the evaluation indicators. According to the corresponding trapezoidal fuzzy number, each decision maker gives the relative importance of each index. Then, the trapezoidal fuzzy number of each index is obtained by using the weight sum Equation (2) of the decision maker, and the defuzzification value of each index is obtained by using Equation (1). According to the defuzzification value of each index, sort from large to small.
Step 2: Determine the relative importance-related parameters of two adjacent indicators . From the second index to the last index, the association parameter is determined according to certain rules . In this paper, the difference between the ambiguity resolution values of two adjacent indexes is taken as the correlation parameter.
Step 3: According to Equation (7), the comparison coefficient is calculated.
Step 4: According to Equation (8), the relative weight is calculated.
Step 5: According to Equation (9), the final weight is calculated.
2.3. Trapezoidal Fuzzy COPRAS Approach
The COPRAS method is a multi-criteria decision-making method proposed by Zavadskas [] to evaluate and rank alternatives. In this method, the evaluation indexes and their corresponding weights are weighed, and the alternatives are ranked and evaluated according to the relative importance and utility of each evaluation index, to obtain the best scheme [,,,,,]. The combination of the trapezoidal fuzzy set and COPRAS method is the trapezoidal fuzzy COPRAS method. The specific steps are as follows:
Step 1: Establish trapezoidal fuzzy decision matrix according to Equation (10)
, where ,. When the alternative corresponds to the index , the trapezoidal fuzzy number evaluated by the expert, represents the number of alternatives and is the number of evaluation indexes. is the weight of expert. Additionally, .
Step 2: According to Equation (11), obtain the weighted trapezoidal fuzzy decision matrix :
where , …, , , is calculated using the fuzzy SWARA method.
Step 3: Calculate the sum of the benefit index and the cost index according to Equations (12) and (13). The number of indicators is . Let represents a collection of benefit indicators, represents a collection of cost indicators; therefore,
where indicates the benefit index, and indicates the cost index.
Step 4: According to Equation (14), calculate the relative importance value of each alternative:
where , is the trapezoidal defuzzification value of , and is the trapezoidal defuzzification value of .
Step 5: According to Equation (15), calculate the utility degree value of each alternative; the calculation Equation is as follows:
where , the alternatives are ranked in descending order according to the value of , and a higher the value of is better.
3. Method Framework
In the process of selecting a coal transportation company, due to the vagueness and imprecision of the data, the decision making based on certainty is imperfect. Therefore, to overcome this problem, the trapezoidal fuzzy SWARA-COPRAS method is used to select coal transportation companies. The reasons for using SWARA and COPRAS are as follows:
- (1)
- Implement and understand.
- (2)
- Low transaction costs.
- (3)
- Decision makers have more opportunities to set criteria priorities.
Stage 1: Determine decision makers and corresponding weights and select coal transportation companies and evaluation indicators.
The set of alternative coal transportation companies is . The set of evaluation indexes is , and the corresponding weight vector is . The set of experts invited to evaluate the alternative coal transportation company is . The relative importance of experts is expressed according to the corresponding trapezoidal fuzzy number .
Stage 2: Use the trapezoidal fuzzy SWARA method to determine the weight of the evaluation index.
In many MCDM problems, an important issue is to determine the weight of evaluation indicators. Coal production companies will select three experienced decision makers, all with more than 10 years of experience. The three decision makers will evaluate and calculate the standard weights of the method based on their expertise and experience. In the trapezoidal fuzzy COPRAS method, the index weights are further used to rank the alternative coal transportation companies.
Stage 3: Using the trapezoidal fuzzy COPRAS method, determine the rank of the alternative coal transportation companies and select the best coal transportation company.
The trapezoidal fuzzy COPRAS method is a new multi-criteria comprehensive evaluation method, which is used to determine the advantages and disadvantages of alternative coal transportation companies. This method overcomes the impact of conflicting evaluation indicators and increases the accuracy of the evaluation.
4. Case Analysis
The case analysis of this paper is a coal production company located in Hubei province of China, which cooperates with 10 coal transportation companies. The coal company has two production mines with an annual approved total production capacity of 1.2 million tons, and an annual approved total production capacity of 820,000 tons of coal mines and resource integration under construction. The coal company adheres to the development concept of “coal-based, transformation, and upgrading”, strives to enhance the advantages of the main coal business, actively develops new coal chemical materials, and promotes the transformation and upgrading of the company’s business development from black to green, low-end to high-end, and strives to build a master A modern enterprise group with strong business operations, high development quality, and good economic benefits.
The coal production companies selected three coal transportation experienced decision makers, all with more than 10 years of experience. After the pre-evaluation of the three decision makers, there are still five coal transportation companies as candidates. Through the investigation of coal transportation companies, four indicators have been determined, the set indicators are . C1 indicates the qualification of the coal transportation company, C2 indicates the quality of the coal transportation company, C3 indicates the service level of the coal transportation company, and C4 indicates the cost of the coal transportation company. Among them, C1, C2, and C3 are benefit indicators. The larger the indicator value is, the better; C4 is the cost indicator, and the smaller the indicator value is, the better. A management questionnaire on the types of benefits and costs is established and sent to this independently three experienced decision makers, in order not to be disturbed by other experts when scoring, to ensure the scientific and independent management of the questionnaire. According to their own experience, judgment, and relevant professional knowledge, each decision maker makes opinions on the selection of coal transportation companies. The management questionnaire is designed based on the language variables in Table 1 and Table 2.

Table 1.
Linguistic terms for rating the importance of criteria and the decision makers.
Table 2.
Linguistic terms for rating the alternatives.
The first stage: Determine the set of decision makers and the corresponding weights and select the set of coal transportation companies and the set of evaluation indicators.
The set of alternative coal transportation companies is . The evaluation index set is and the decision-maker set is . Each expert is objectively determined according to their expertise, work experience, judgment, and other relevant knowledge, and the results are shown in Table 3. The weight of the three decision makers can be obtained according to Table 3.
Table 3.
The importance and weight of decision makers.
The second stage: Determine the weight of the evaluation index.
The three decision makers expressed their preference for indicators according to the trapezoidal fuzzy number in Table 2. According to the weight of the decision makers, the aggregation trapezoidal fuzzy number was obtained using Equation (16). Calculate the defuzzification value according to Equation (1), and the results are shown in Table 4. According to Table 4, the defuzzification value is sorted from large to small. Let , and then obtain Table 5 according to Equations (7)–(9). According to Table 5, the weight of the evaluation index can be obtained as follows:
Table 4.
The importance of evaluation indicators.
Table 5.
Weight values obtained using the SWARA method.
The third stage: Determine the priority of coal transportation companies.
The three decision makers obtained Table 6 according to Table 2. According to Table 6 and Equation (10), the trapezoidal fuzzy decision matrix was obtained, and the results are shown in Table 7. According to Table 7 and Equation (11), the weighted trapezoidal fuzzy decision matrix was obtained, and the result sees Table 8. According to Equations (12)–(15), , , and can be obtained, and the results are shown in Table 9. According to Table 9, the relative importance value and effect degree value of the coal transportation company have been obtained. The importance of the coal transportation company is ranked as ; therefore, A3 is the best coal transportation company.
Table 6.
Linguistic assessments of company provided by the three experts.
Table 7.
Aggregate decision matrix for selecting coal transportation companies.
Table 8.
Weighted aggregate decision matrix for selecting coal transportation companies.
Table 9.
Final results and ranking orders.
Other MCDM methods (CoCoSo, TOPSIS, MOORA, and MABAC) are applied to the decision matrix (as shown in Table 8), and the results of these methods are compared with those of the proposed method. Table 10 shows this comparison. The ranking result of the MOORA method is , while that of other methods is , which shows the effectiveness of the method.
Table 10.
Comparison of results calculated using different methods.
5. Sensitivity Analysis
To verify the effectiveness and stability of the method, this section conducts a sensitivity analysis. The weight of each indicator is exchanged with the weight of another indicator, and the weights of other indicators remain unchanged to test stability. Let the weights of indicators C1 and C2 be replaced by S1:C(1,2), and other indicators remain unchanged. There are six scenarios in total, namely S1: C(1,2), S2: C(1,3), S3: C(1,4), S4: C(2,3), S5: C(2,4), S6: C(3,4). In every scenario, the relative importance value and utility value of each coal transportation company is calculated. The relative importance values of the six scenarios are shown in Table 11 and Figure 2, and the utility degree values are shown in Table 12 and Figure 3. In the six scenarios, the coal transportation company A1 ranks first in all the scenarios, and the rankings are , which are consistent with the results calculated in this paper. As a result, it can be concluded that the trapezoidal fuzzy set is a reliable choice for the selection of coal transportation companies. These tools have good operability and reference value in actual work.
Table 11.
Sensitivity rankings of .
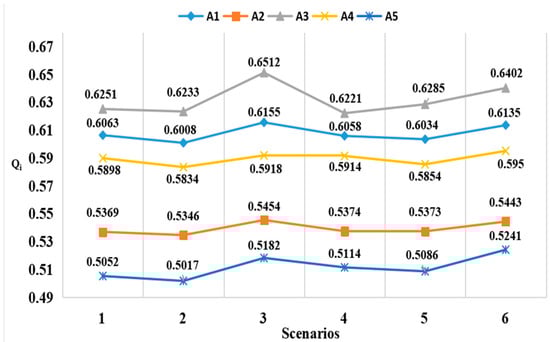
Figure 2.
Sensitivity analysis of rankings by .
Table 12.
Sensitivity rankings of .
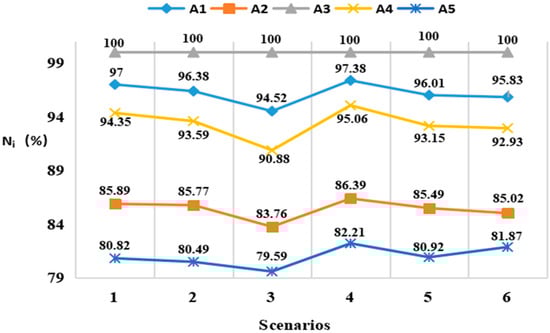
Figure 3.
Sensitivity analysis of rankings by .
According to Table 11 and Table 12, as well as Figure 2 and Figure 3, the following conclusions can be drawn: it can be concluded that the trapezoidal fuzzy set is a reliable choice for the selection of coal transportation companies. These tools have good operability and reference value in actual work.
6. Discussions and Conclusions
Coal resources are an important part of China’s energy structure. The status quo of my country’s “rich coal, less gas and poor oil” determines the indispensable position of coal companies in the energy industry. With the promulgation of my country’s total control of coal policy, the former scene of prosperous coal enterprises has been difficult to reproduce, which poses new challenges to the survival of coal enterprises. Controlling coal is not about controlling development. On the contrary, controlling coal is a high-quality, sustainable long-term development strategy. Under the new economic development situation, coal enterprises should resolve outdated production capacity and take the initiative to carry out low-carbon transformation in combination with the macroeconomic situation, policies, and their characteristics on time. This is also the only way for coal enterprises to maintain sustainable development. Coal companies need to maintain sustainable development capabilities and respond to rapid changes. One of the key factors is to choose the right transportation company and maintain close contact with it. This can significantly improve the service level of coal companies and reduce transportation costs.
Since there is usually no definite data to focus on when evaluating and selecting coal transportation companies, there are many uncertainties and fuzziness in the qualification, quality, service level, and cost of coal transportation companies. In addition, the selected evaluation indexes are often interrelated, and the idea of simple weighting cannot be used to synthesize different expert evaluation decision matrices. Therefore, this paper proposes the multi-criteria decision-making method of the trapezoidal fuzzy SWARA-COPRAS method, which can more accurately solve this kind of decision-making problem. The main content of this study is to obtain empirical data through questionnaires, understand five coal transportation companies, and investigate their qualifications, quality, service level, and cost. Then, according to the actual data investigated by coal transportation experts, coal transportation experts are selected to make group decision evaluation on these coal transportation companies and obtain the decision matrix, then use the model established in this paper to solve the problem, and finally achieve the objective evaluation results.
Aiming at the conflict of multi-finger standards and the increase in uncertain information regarding coal transportation companies, a multi-criteria decision-making method based on the trapezoidal fuzzy SWARA-COPRAS method is proposed. Trapezoidal fuzzy numbers are used to represent uncertainty and fuzziness, which improves the scientific and feasibility of decision making. In the actual selection process of coal transportation companies, for most of the index problems that need to be handled, it is difficult for us to obtain accurate and complete information. Generally, we can only obtain some fuzzy or even contradictory information to solve this kind of multi-criteria decision-making problem with fuzzy information. In this paper, trapezoidal fuzzy numbers are used to transform expert evaluation language values, and the trapezoidal fuzzy SWARA-COPRAS method is established by using the constraint properties of trapezoidal fuzzy numbers. To be closer to the actual decision-making situation, the weight of experts is objectively determined according to their expertise, experience, judgment, and relevant knowledge. The weight of each index is determined using the fuzzy SWARA method. The trapezoidal fuzzy COPRAS method determines the ranking of transportation companies. The trapezoidal fuzzy COPRAS method fully considers the trade-off between cost index and benefits index, which is very scientific and practical.
The results show that when a coal production enterprise in Hubei, China selects five coal transportation companies, the advantages and disadvantages are A3 > A1 > A4 > A2 > A5. The cost index value of coal transportation company A3 is 0.1371, which is higher than that of coal transportation companies A1, A2, and A4, but its benefit index is the highest and ranks first in the comprehensive ranking. The cost index value of the A4 coal transportation company is 0.0882, the lowest, but its benefit index value is not the best, ranking third and comprehensively ranking third. It shows that cost is not the only factor in the selection process and highlights the advantages and characteristics of the trapezoidal fuzzy SWARA-COPRAS method. At the same time, the sensitivity analysis of the calculation results is carried out, and the results are compared with those of other methods to verify the effectiveness and practicability of the method.
In future research, the following aspects can be studied. One is to consider the extension of the trapezoidal fuzzy set and use a triangular intuitionistic fuzzy set, a trapezoidal intuitionistic fuzzy set, and an interval intuitionistic fuzzy set to represent uncertainty and fuzziness, which is more in line with the objective reality. Second, other methods can be used to calculate the evaluation index weight of coal transportation companies. When calculating the weight of the evaluation index, it is highly dependent on subjective data. It can be considered to add the objective weight method of the evaluation index, and comprehensively weigh the subjective weight and objective weight method to obtain the comprehensive weight of the evaluation index. Third, coal production enterprises need to regularly evaluate coal transportation companies. The ranking of coal transportation companies is a dynamic process, not always unchanged. Therefore, coal production enterprises need to regularly organize experts to evaluate coal transportation companies to improve their competitiveness.
Author Contributions
Conceptualization, M.H.N. and Z.X.; methodology, M.H.N., Z.X.; software, Z.X.; validation, Z.X., M.H.N.; formal analysis, Z.X.; investigation, M.H.N.; resources, J.Y.; data curation, J.Y, Z.X.; writing—original draft preparation, M.H.N., Z.X.; writing—review and editing, M.H.N., J.Y.; visualization, Z.X.; supervision, J.Y.; project administration, J.Y.; funding acquisition, J.Y. All authors have read and agreed to the published version of the manuscript.
Funding
This research received no external funding.
Institutional Review Board Statement
Not applicable.
Informed Consent Statement
Not applicable.
Data Availability Statement
Not applicable.
Conflicts of Interest
The authors declare no conflict of interest.
References
- Ware, N.R.; Singh, S.P.; Banwet, D.K. A mixed-integer non-linear program to model dynamic nsupplier selection problem. Expert Syst. Appl. 2014, 41, 671–678. [Google Scholar] [CrossRef]
- Burak, E.; Emin, G.; Aysegul, Y. An integrated fuzzy approachfor strategic alliance partner selection in third-party logistics. Sci. World J. 2013, 6, 81–92. [Google Scholar]
- Avelina, A.R.; Abraham, M.; Elias, O.B. A heuristic method for the supplier selection and order quantity allocation problem. Appl. Math. Model. 2021, 90, 1130–1142. [Google Scholar]
- Krichanchai, S.; MacCarthy, B.L. The adoption of vendor managed inventory for hospital pharmaceutical supply. Int. J. Logist. Manag. 2017, 28, 755–780. [Google Scholar] [CrossRef]
- Irmayanti, H. Raw material supplier selection with analytics hierarchy process (ahp) method. In IOP Conference Series: Materials Science and Engineering; IOP Publishing: Bandung, Indonesia, 2020; p. 879. [Google Scholar]
- Sadrian, A.A.; Yoon, Y.S. A procurement decision support system in business volume discount environments. Oper. Res. 1994, 42, 14–23. [Google Scholar] [CrossRef]
- Pan, A.C. Allocation of order quantities among suppliers. J. Purch. Mater. Manag. 1989, 25, 36–39. [Google Scholar] [CrossRef]
- Bhutta, K.S.; Hu, Q.F. Supplier selection problem: A comparison of total cost of ownership and analytical hierarchy process approach. Supply Chain. Manag. Int. J. 2002, 7, 126–135. [Google Scholar] [CrossRef]
- Ting, S.C.; Cho, D.I. An Integrated Approach for Supplier selection and Purchasing decisions. Supply Chain. Manag. Int. J. 2007, 13, 116–127. [Google Scholar] [CrossRef]
- Chan, F.T.S.; Kumar, N. Global supplier development considering risk factor using Fuzzy extended AHP-based approach. Omega 2007, 35, 417–431. [Google Scholar] [CrossRef]
- Chopra, S.; Meindle, P. Supply Chain Management: Strategy, Planning, and Operation; Prentice Hall, Inc.: Upper Saddle River, NJ, USA, 2001; pp. 1–24. [Google Scholar]
- Kumar, M.; Vrat, P.; Shankar, R. A fuzzy goal programming approach for vendor selection problem in a supply chain. Comput. Ind. Eng. 2003, 5, 123–129. [Google Scholar] [CrossRef]
- Verma, R.; Pullman, M.E. An analysis of the supplier selection process. Omega 1998, 26, 739–750. [Google Scholar] [CrossRef]
- Zhu, Y.; Tian, D.; Yan, F. Effectiveness of Entropy Weight Method in Decision-Making. Math. Probl. Eng. 2020, 2020. [Google Scholar] [CrossRef]
- Juliza, M.A.; Faizal, A.R.M.; Ratibah, T.M.S.; Suryanti, A.; Nadiah, I.N.S.; Ahmad, F. Android mobile malware detection using fuzzy AHP. J. Inf. Secur. Appl. 2021, 61, 102929. [Google Scholar]
- Xiang, Z.; Yang, J.; Muhammad, H.N.; Xiang, Z. Occupational Health and Safety Risk Assessment of Cruise Ship Construction Based on Improved Intuitionistic Fuzzy TOPSIS Decision Model. Math. Probl. Eng. 2021, 2021, 5966711. [Google Scholar]
- Nurşah, A.; Cengiz, K. Evaluation of government strategies against COVID-19 pandemic using q-rung orthopair fuzzy TOPSIS method. Appl. Soft Comput. J. 2021, 110, 107653. [Google Scholar]
- Liu, H.; Qian, Z.; Shao, J. Analysis of music influence on order preference based on TOPSIS algorithm. J. Phys. Conf. Ser. 2021, 1941, 012009. [Google Scholar] [CrossRef]
- Kilic, H.S.; Demirci, A.E.; Delen, D. An integrated decision analysis methodology based on IF-DEMATEL and IF-ELECTRE for personnel selection. Decis. Support Syst. 2020, 137, 113360. [Google Scholar] [CrossRef]
- Ronal, W.; Azhar, R.W.; Aysyah, R.; Anjar, W.; Isa Indrawan, M. Implementation of PROMETHEE-GAIA Method for Lecturer Performance Evaluation. J. Phys. Conf. Ser. 2021, 1933, 012067. [Google Scholar]
- Li, H.; Zhao, Q. Granary Temperature Prediction Based on BP Neural Network Based on Grey Relational Analysis. Int. J. Comput. Eng. 2018, 13, 542. [Google Scholar]
- Peng, C. The Influence of Guangdong Province Basic Education on Residents’ Consumption Structure—Based on Grey Correlation Analysis Method. Open J. Soc. Sci. 2015, 3, 288. [Google Scholar] [CrossRef][Green Version]
- Fu, J.; Fu, J.; Yu, G. Neural Network Production Split Model Based on Kriging Interpolation Method and Grey Correlation Analysis Method. In IOP Conference Series: Earth and Environmental Science; IOP Publishing: Dalian, China, 2020; p. 558. [Google Scholar]
- Zadeh, L.A. Fuzzy Sets. Inf. Control 1965, 8, 338–353. [Google Scholar] [CrossRef]
- Liu, C. Supplier Selection Evaluation of Shipbuilding Enterprises Based on Entropy Weight and Multi-attribute Decision Making. In Proceedings of the Fifth International Forum on Decision Sciences, San Diego, CA, USA, 15–19 December 2016; Springer: Singapore, 2018. [Google Scholar]
- Qin, J.; Liu, X. Witold Pedrycz.An extended TODIM multi-criteria group decision making method for green supplier selection in interval type-2 fuzzy environment. Eur. J. Oper. Res. 2017, 258, 626–638. [Google Scholar] [CrossRef]
- Zarbakhshnia, N.; Soleimani, H.; Ghaderi, H. Sustainable third-party reverse logistics provider evaluation and selection using fuzzy SWARA and developed fuzzy COPRAS in the presence of risk criteria. Appl. Soft Comput. 2018, 65, 307–319. [Google Scholar] [CrossRef]
- Keršuliene, V.; Zavadskas, E.K.; Turskis, Z. Selection of rational dispute resolution methodby applying new step-wise weight assessment ratio analysis (SWARA). J. Bus. Econ. Manag. 2010, 11, 243–258. [Google Scholar] [CrossRef]
- Zavadskas, E.K.; Turskis, Z.; Tamosaitiene, J. Multicriteria selection of project managers by applying grey criteria. Technol. Econ. Dev. Econ. 2008, 14, 462–477. [Google Scholar] [CrossRef]
- Roozbahani, A.; Ghased, H.; Shahedany, M.H. Inter-basin water transfer planning with grey COPRAS and fuzzy COPRAS techniques: A case study in Iranian Central Plateau. Sci. Total Environ. 2020, 726, 138499. [Google Scholar] [CrossRef] [PubMed]
- Dhiman, H.S.; Deb, D. Fuzzy TOPSIS and fuzzy COPRAS based multi-criteria decision making for hybrid wind farms. Energy 2020, 202, 117755. [Google Scholar] [CrossRef]
- Ziquan, X.; Jiaqi, Y.; Naseem, M.H.; Zuquan, X.; Xueheng, L. Supplier selection of shipbuilding enterprises based on intuitionistic fuzzy multicriteria decision. Math. Probl. Eng. 2021, 2021. [Google Scholar] [CrossRef]
- Darko, A.P.; Liang, D. An extended COPRAS method for multiattribute group decision making based on dual hesitant fuzzy Maclaurin symmetric mean. Int. J. Intell. Syst. 2020, 35, 1021–1068. [Google Scholar] [CrossRef]
- Mishra, A.R.; Rani, P.; Pandey, K.; Mardani, A.; Streimikis, J.; Streimikiene, D.; Alrasheedi, M. Novel Multi-Criteria Intuitionistic Fuzzy SWARA–COPRAS Approach for Sustainability Evaluation of the Bioenergy Production Process. Sustainability 2020, 12, 4155. [Google Scholar] [CrossRef]
- Garg, H.; Arora, R. Algorithms based on COPRAS and aggregation operators with new information measures for possibility intuitionistic fuzzy soft decision-making. Math. Probl. Eng. 2020, 2020. [Google Scholar] [CrossRef]
Publisher’s Note: MDPI stays neutral with regard to jurisdictional claims in published maps and institutional affiliations. |
© 2022 by the authors. Licensee MDPI, Basel, Switzerland. This article is an open access article distributed under the terms and conditions of the Creative Commons Attribution (CC BY) license (https://creativecommons.org/licenses/by/4.0/).