Abstract
Four commercial viscosity index improvers (VII) have been used to investigate the behavioral differences of these compounds in three types of universally applicable base oils. The used VIIs are structurally three types of co-polymer: ethylene-propylene, star isoprene, and two di-block styrene-isoprene. After dissolving of different amounts of VIIs in different base oils, the kinematic viscosities at two standard temperatures were determined and the intrinsic viscosities were calculated according to Huggins method, then the effects of changes in base oil and polymer type were investigated. Intrinsic viscosities as criteria for polymer molecules sizes were found to be higher at lower temperature than at higher temperature. Dependence of intrinsic viscosity on the polymer molecular weight was observed. In the previous works, one or two types of VIIs were studied in only one type of base oil and/or solvent, not different base oils. Furthermore, different ranges of temperatures and concentrations not necessarily applied ranges were selected, but in this work, common base oils and most commercial VIIs were used and the viscometric properties were compared at two temperatures. Viscosities at these temperatures are used for determining VI and definition of lubricant’s viscosity grades. VI improvement is the main cause of VII usage.
1. Introduction
Two key initial properties of each lubricant are viscosity and viscosity index. Actually, viscosity is the intrinsic resistance of a fluid to flow that is defined and measured in different ways. Amount of viscosity of a fluid depends on three parameters including temperature, pressure and shear stress [1]. There are two types of viscosity measurements or reports: kinematic and dynamic. Kinematic viscosity is the fluid viscosity in non-shear/stress conditions, which is depended on temperature and pressure for a given fluid. In the following introduction, only the behavior of the viscosity with temperature is discussed and no further explanation is given about the effect of pressure and shear stress on the viscosity. A well-known method for expressing the viscosity-temperature relation is based on viscosity index, which is calculated from kinematic viscosities at 40 and 100 °C. It is a theoretical method that compares the fluid’s kinematic viscosities at 40 and 100 °C to that of two reference fluids with presupposed VIs [2]. A higher viscosity index means less variation in viscosity with temperature which is more desirable for lubricant consumers. There are also issues with calculating the VI of oils with very low viscosities for which there are no available reference fluids to calculate the parameters in equation of VI. To address these limitations, alternative methods have been proposed, including the dynamic viscosity index (DVI) and the proportional viscosity index (PVI) [3], but they have not been widely adopted and applied. Another parameter used to quantify the viscosity–temperature relationship is the Q factor. This factor is used primarily to differentiate between thickeners and VI improvers. Specifically, 0 < Q ≤ 1 indicates the thickening power of the polymer is less significant at high temperature, so the polymer is a thickener, while Q > 1 indicates the thickening power of the polymer is more dominant at higher temperatures, as expected for a VII. Although both larger Q factor and larger VI indicate a better viscosity-temperature relationship, it has been found that there is no direct correlation between Q and VI in most cases [4,5,6].
There are some other models for studying viscosity–temperature relationship. Andrade and Eyring [7,8] proposed Arrhenius equation for studying viscosity response to temperature. Angell [9] used Vogel-Tamman-Fulcher model to study this relation especially for base oils.
1.1. Why We Should Study the Viscosity-Temperature Behavior of Lubricants?
Every 15–20 °C variation in operation temperature necessitates roughly one ISO grade up or down in a mono-grade VI 100 oil.
For spur/helical/bevel gears operating at 65 °C with a pitch line velocity of 10 m/s specify a VI 90 ISO 220, VI 120–160 ISO 150, or VI 240 ISO 100 oil [10].
Viscosity should be as low as possible, so that the engine/equipment can be easily switched on at the cold start condition and the oil can reach all required locations. On the other hand, the viscosity must be so large that its reduction due to the heating up the engine/equipment does not destroy the lubrication layer and the load-bearing capability in the desired sections. These are a few reasons for study of the viscosity change with temperature and controlling this change by formulation tuning like VII selection and usage.
Any lubricating oil is produced from the combination of one or more base oils and a variety of additives. Base oil(s) and viscosity index improver (VII) additive are the main ingredients for providing required viscosity and viscosity index. Viscosity index improvers (VII) are low to high molecular weight (1000–250,000 g/mol) [10]. VIIs are different types of polymeric materials.
The most common types of VII polymer are polyisobutenes (PIB), poly (alkyl methacrylates), poly (styrene-dienes), polyisoperenes, and olefin copolymers (OCPs). Some typical structures for them are shown in Figure 1 and Figure 2.
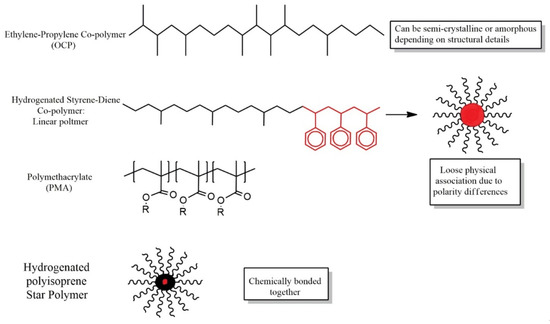
Figure 1.
Schematic structures of some VII polymers.
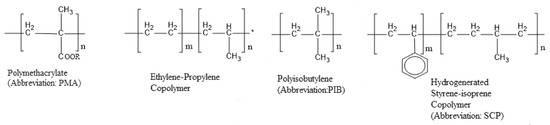
Figure 2.
Some VIIs chemical structures.
Polymethacrylates (PMA) were the first VI improver polymers in the early 1900s. Polyisobutylene (PIB) gained favor due to greater cost effectiveness which in turn was later replaced by polyolefin copolymers (OCP).
The advantage of PIB is excellent shear stability and low cost. The disadvantage is that the high dosage required to improve viscosity and VI can often lead to worse low temperature properties and lowering of base oil solvency.
PIB is unique among the four VII improver chemistries due to its very small molecular weight and high shear stability.
Low MW polymers like PIB approach the size of the base oil and the size of the expanded (KV100) and contracted (KV40) coil are not sufficiently to overcompensate for the thinning of base oil with temperature. In this case, it acted more as a thickener or high viscosity base oil than a VII. Actually, this type is not good VII.
Polymethacrylates (PMA) are highly branched copolymers of methacrylate esters.
The advantage is very high VI enhancement and excellent improvement of low temperature properties. The disadvantage is cost and moderate thickening efficiency.
Olefin copolymer (OCP) is a copolymer of ethylene and other olefins including propylene, butylene. OCP polymers are very long molecules with high molecular weight. The advantages are high thickening efficiency and low cost. The disadvantages are poor shear stability and some side effects on cold properties. If ethylene content is too high (>50%), OCPs can behave like wax and have poor cold properties.
Bell-shaped or parabolic responses of performance versus wt.% of an additive is common when formulating lubricants and this effect is often called “reversion” [1,10,11]. Coils cannot expand through another coils. The loss of expansion reduces the VI improvement in the thinning solvent and lowers VI with high treat. Reversion occurs most often for higher MW polymers, PMA, and OCP, which have MW on the order of 10,000 and 100,000 g/mol respectively [10].
Polymer solution theory, the understanding of how polymers behave in solution, is divided into three regimes: dilute, semi-dilute, and concentrated.
Very small, low MW polymers require higher concentrations to reach the semi-dilute range while very large, ultra-high MW polymers can exhibit semi-dilute behavior at fractions of a percent by weight. However, the wt% at which this transition occurs can be identified for a given VII by plotting the log of specific viscosity (KV of oil + VII/KV of oil-1) against log of wt% VII. A change of slope in the log-log plot indicates a transition from dilute to semi-dilute. High MW OCP (~100,000 g/mol) creates a semi-dilute condition at 4–5 wt% in oil [12,13].
Developments in VII polymer chemistry have continued optimization of their performance, i.e., thickening efficiency, viscosity–temperature relationship, and shear stability. Two general ways of VII properties improvement are to make a blend of VIIs [10,11,12,13] and to modify the architecture of the molecules.
Polymer blends mean usage of more than one of the chemistries in a formulation. Due to limitations in cost or demanding specifications such as shear stability it is often attractive to blend multiple types of VI improver to achieve the desired properties in a lubricant. Blending multiple polymers in solution can produce unexpected viscosity or VI changes since polymer molecules in solution interact.
PMAs and OCPs are incompatible as mixtures; however, PMA-OCP blends can be created by adding a small amount of grafted PMA on OCP as a compatibilizer. The PMA-OCP blend imparts properties of both PMA and OCP molecules. The PMA section provides good VI and low-temperature rheology and the OCP provides thickening and cost efficiency. Modifications to a VIIs blend have also been investigated [11,14,15,16].
The influence of polymer architecture on its properties is also widely studied [11,17,18,19,20,21,22]. Advancements in polymer architecture have gone from linear structures to branched [23,24], comb [25,26], and star-shaped [27,28,29,30] polymers and through cross-linking [31]. Overall, the comb polymer showed improved temperature–viscosity relationship, low-temperature viscosity properties, and reduced fuel consumption. Star-shaped architectures are also widely used since they are high molecular weight polymers with both good thickening efficiency and shear stability. A comparison between linear and star-branched PMA revealed that the latter provides superior thickening efficiency than the former and that, at a given shear stability index, star-branched PMA solutions had higher VI than solutions with linear PMA. GPC measurements suggested the improved shear stability of star polymers is attributable to the breaking of chemical bonds near the core of the star, as opposed to in the middle of a linear chain. Such architectures are most commonly found in PMAs, but have been applied to other chemistries as well; for example, compared to linear random and block HSD, star-branched structures exhibited improved thickening efficiency and shear stability.
1.2. How VII Molecules Behave?
A number of mechanisms have been proposed to explain how VII polymers improve the viscosity of a solution at high temperature and enhance VI. The oldest and simplest mechanism is coil expansion by Selby [32]. According to this mechanism, the size of polymer molecules at higher temperatures (100 °C) is larger than at low temperatures (40 °C) as shown in Figure 3 and therefore this phenomenon compensates for part of the decrease in base oil viscosity due to increasing temperature and thus VI increases.

Figure 3.
Selby model for VI improvement in picture.
Although this is the simplest mechanism for explaining the behavior of VIIs, it is not in fact the most common mechanism, and it will be further explained that several studies suggest that this mechanism is consistent only with the behavior of PMA type polymers. however, it should be noted that all polymer molecules in the oil formulation expand due to heating and contract due to cooling although, this phenomenon may occur only in a certain temperature and concentration range, and in other conditions the molecule sizes may be constant or even go a bit smaller.
For determination of polymer coil size in the solvent, there are some experimental and theoretical techniques according to a review by Martini A. [11]. The experimental or direct methods include dynamic light scattering (DLS) and small-angle neutron scattering (SANS) and measurement of viscosity is a theoretical or indirect method. We have used the latter in our work.
Then, coil size could be obtained indirectly from measurements of viscosity [4,6,33] specifically, the viscosity of a solution is measured as a function of polymer concentration. The intercept of a linear fit to this data is the intrinsic viscosity which can be used to calculate molecule coil radius.
Flory’s pointed out that the radius of gyration (Rg) of polymer molecule depends on the interactions between polymer chains and solvent molecules [34].
Molar volume defines the molecular weight of a component divided by its density (MW/ρ) and is a rough estimation of the size of a molecule in solution. Ideally, a suitable solvent for a polymer is only 50–200 cm3/mol. or no bigger than the molar volume of the polymer’s monomer. This requirement occurs because oil and solvent must diffuse into the polymer coil to dissolve it or expand with temperature. As concentrated VII like PIB or PMA is added to oil, the molar volume of the oil increased and solvency is reduced [35,36,37].
Muller reported that the reduced viscosities (calculated from dividing specific viscosity by polymer concentration) for OCP and HSD types at lower temperatures are not smaller than the higher temperatures. It shows that these two types of polymers do not match to the Selby model [6]. However, considering the powerful enough solvents, polymer coils open and enlarge, the total volume fraction occupied by polymer molecules increases and this results in increased viscosity. Therefore, the proposed VI improvement mechanism is highly probable but, this theory is only approved if the temperature of the coil to globule transition or the theta temperature for the polymer, matches the operating temperature range of the related lubricant [38]. Furthermore, if the base oil used has a sufficient (not necessarily very good) solvency for polymer in the working temperature range, it is quite probable that the Rg constant as a measure of the polymer molecule size will not change significantly with an increase in temperature (or even decrease) but VI still enhances anyway. Results similar to Muller were reported by other researchers. Gao et al. studied dilute solutions of OCP, HSD, and PMAs in API group II base oil, at temperatures between 10 and 150 °C, and based on intrinsic viscosity, data showed similar results for OCP and HSD, but the molecular dimensions for PMA type increased with temperature [33]. Rubine et al. investigated the behavior of five different OCP at −10 to 50 °C in aliphatic and aromatic solvents (not base oils) [39]. Michael J. Covitch studied the change in polymer coil size at different temperatures and concentrations by two methods: SANS and intrinsic viscosities determination. He also showed that polymer coil expansion is not necessarily a requirement for VI improvement [40].
Ramasami U.S. and Martini A. [41] studied the size change of PMA and OCP with temperature in dodecane solvent by molecular dynamic(MD) method and concluded that only the size of PMA increases with temperature and attributed this difference to the presence of oxygen atoms in PMA. Recently MD simulations have also been used to quantify the coil size of VII polymers by other researchers [41,42,43,44].
Such works have also proven that not all polymers expand with temperature and a comparison between the coil sizes of PMA and OCP as functions of temperature was obtained from direct and indirect measurements. In both cases, only the PMA expands with temperature. The absence of coil expansion has been shown for OCP and other hydrocarbon-based polymers [6,33,40,43].
Another means by which VIIs may increase the viscosity of a solution is through the interaction of multiple polymer chains, as illustrated schematically in Figure 4. This mechanism can be referred to as association, aggregation, or entanglement.
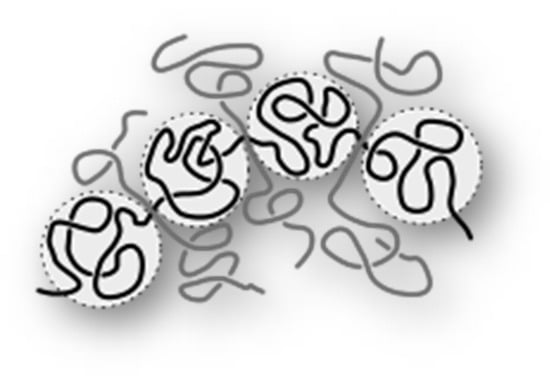
Figure 4.
Association or entanglement schematic view of polymer molecules.
For example, two distinct peaks in the molecular weight distribution of HSD in heptane measured by DLS indicated the presence of multi-molecule aggregates as well as isolated ones [45].
Polymers, such as HSB, are believed to increase viscosity through association/aggregation, or in other words micelle formation [11,44,46].
In addition, polymers may affect the viscosity of a solution through secondary mechanisms, including their effect on adjacent solvent molecules.
Then VIIs have been extensively used to reduce the dependency of the lubricant’s viscosity on temperature, to maintain an acceptable hydrodynamic lubrication in extreme conditions. VIIs in engine lubricants has the role to bridge their tribological response with their rheological behavior. Polymers of different chemistries, molecular weights, and conformations have effect on film thickness measured in pure rolling and isothermal conditions then have effect on the lubricants behavior in the elastohydrodynamic (EHD) and very thin film (VTF) regimes [47].
In the last and comprehensive review of VII Additives, Martini A. [11] discusses the chemical structure, the three main properties, including thickening effect, viscosity change with temperature, and shear stability, as well as coil expansion of main VII additives and methods of their studies. This article also reminds about behavioral difference of OCP and PMA and finally points out that coil expansion is not the only reason to increase viscosity or VI, but other reasons such as association, entanglement, and solvent-polymer interaction can also increase the viscosity and VI. After that, no study on similar subjects is found.
Since we have used the indirect method i.e., viscosity measurement to determine molecular size in our work, it is necessary to provide more explanation about this method.
A polymer’s contribution to the viscosity of a solution is quantified by intrinsic viscosity ([η]). This parameter is related to molecular weight by the Mark-Houwink equation [34,48], Equation (1) and related to hydrodynamic volume and molecular weight by Einstein equation model, Equation (2) [40]. Then if we determine intrinsic viscosity, we could estimate the size of polymer in solution.
where the two parameters (K) and (a) are empirical and related to the stiffness of the chain and depend on the type of polymer, solvent, and temperature [49,50].
where Ve = hydrodynamic volume, Mw = weight-average molecular weight, N = Avogadro’s number, and [η] = intrinsic viscosity.
The hydrodynamic volume represents the volume occupied by the polymer in the solution. Based on these equations, the intrinsic viscosity is one of the parameters that are suitable for showing the change in the size of polymer coils in the solution. Then, we need to predict intrinsic viscosity. There are some models to predict intrinsic viscosity:
Commonly employed equations are Huggins, Kraemer, Martin, and Schulz-Blaschke; Equations (3)–(6), respectively. In order to apply these relations, we should measure viscosities of solutions with different concentrations for each specified triple (polymer-solvent-temperature) [50,51,52,53].
The constants in the equations depend on the chemistry of the polymer and solvent and have been reported for many VIIs.
where: = = relative viscosity or viscosity ratio (ratio of viscosity of the solution, in a determined concentration, to viscosity of the solvent); = specific viscosity (); = intrinsic viscosity or limiting viscosity number, respective to Huggins equation; = intrinsic viscosity, respective to Kraemer equation; = intrinsic viscosity, respective to Martin equation; = intrinsic viscosity or limiting viscosity number, respective to Schulz-Blaschke equation; c = polymer concentration; = Huggins, Kraemer, Martin and Schulz-Blaschke coefficients, respectively. For many polymer systems, = 0.28 has been found.
Some relations have been proposed for determining the intrinsic viscosity from a single point viscosity measurement of a dilute solution. These methods have the advantage of being more rapid and adequate when a large number of samples have to be analyzed in short periods of time. Moreover, they have the advantage of being independent of a constant value, in contrast to graphical extrapolation determinations.
Solomon and Ciuta derived their intrinsic viscosity relationship (Equation (7)) by combining Equations (3) and (4).
Equation (8) was proposed by Deb and Chanterjee as an expression for single point determination method of intrinsic viscosity.
One noteworthy method in above-mentioned models is Huggins’s equation then we use this model in our work. The units of intrinsic viscosity and polymer concentration are dL/g and g/dL respectively, and specific viscosity is dimension-less.
Lubricant is made from base oil(s) plus additives. Viscosity and VI are the most important criteria for any lubrication purpose. Adjustment of these two parameters is done by choosing the best types of base oils and their combination, and type of VII additive and its amount in the formula. The goal of these choices is optimized quality and price. Olefin copolymers (OCP), hydrogenated poly (styrene-diene), and stellar polyisoprene are the three most widely used VII substances in lubricant formulations, respectively [4,44,46]. These three types account for more than 90% of VII consumption in the lubrication industry.
1.3. Four Novelties in This Work Are as Follows
- We have selected and compared olefin copolymers (OCP), two hydrogenated poly (styrene-diene) and stellar polyisoprene as the four most common and dominant VIIs in lubricants formulations.
- We have selected the three most commonly used base oils, API Group I, II, and III. But in the previous works only one type of base oil or one base oil plus a solvent has been used.
- Temperatures of 40 and 100 degrees Celsius are standard temperatures to determine VI, which is the most useful parameter to describe the viscosity-temperature behavior of lubricants. We have selected, measured, and compared viscosities and other parameters related to them at the above two temperatures, but in the previous studies various and different temperature ranges have been selected.
- We have chosen a concentration range 0.2 to 1.0 g/dL that covers the most common practical concentration range in lubricant formulations, 0.8 to 1.0 wt., but some previous works did not cover this actual range.
Therefore, studying and comparing the behavior of the most common types of VII polymers, at two standard temperatures, in the most popular base oils, in the most actual range of concentration, in a whole work can be very interesting and theoretically and practically valuable.
2. Experimental
The base oils used in the study were API groups I, II, III of 150 neutral base stock with 13%, 5%, and 1% aromatics/polar species, respectively. N 150 I (Behran Oil Co., Tehran, Iran), N 150 II (Formosa Petrochemical Corporation, Yunlin County, Taiwan), and N 150 III (S-OIL Refinery, Ulsan, South Korea) are respectively from Iran, Taiwan, and South Korea. The required properties of the base oils used are given in Table 1.

Table 1.
The properties of the base oils.
The OCP (Lubrizol Co., Wickliffe, Ohio 44092, USA), IP (Infineum Co., Linden, NJ 07036, USA), and SIPs (Infineum Co., Linden, NJ 07036, USA) were obtained in solid forms from Lubrizol and Infineum companies in USA. These VIIs represent the major families of polymers in lubricants that are used today. The Anton-Paar stabinger viscometer (Anton Paar GmbH, Graz, Austria), SVM 3000 model made in Anton Paar Company in Austria was used to measure the viscosities, VIs, and densities. Weight-average molecular weights (Mw) and polydispersity indexes were both obtained by gel permeation chromatography (GPC) instrument (Agilent, Santa Clara, CA 95051, USA) made by Agilent, USA. Key properties of the polymers used in this work are shown in Table 2.
Table 2.
The properties of the polymers.
First of all, the 5% (w/w) concentrations of solid polymers OCP, IP, and SIPs were dissolved in the base oils by chopping and heating them in the oils at 100–120 °C and continuous mechanical stirring for about 5 to 8 h. Then, solutions with weight percentages of 1, 0.8, 0.6, 0.4, 0.2 were prepared from the 5% concentrates by dilution with the same type of base oil. The viscosities at 40 °C, 100 °C and VI of diluted solutions were determined two times and the average results were considered. Then, reduced viscosities were calculated by the Equations (9)–(11). The reduced viscosities were plotted against concentrations for each triple of VII-base oil-temperature. From extrapolation of each curve to zero concentration, the intrinsic viscosities can be achieved by the Huggins model.
where: = viscosity of solution, = viscosity of solvent, = relative viscosity, = specific viscosity, = reduced viscosity and c = concentration.
3. Results and Discussion
The measured results for viscosities were applied to calculate reduced viscosities for each triple of polymer-base oil-temperature. These results are given in Table 3, Table 4 and Table 5.
Table 3.
The measured results for each polymer in N 150I.
Table 4.
The measured results for each polymer in N 150II.
Table 5.
The measured results for each polymer in N 150III.
The reduced viscosities were plotted against concentration. To summarize, only the charts for the experiment at 100 °C are shown in Figure 5, Figure 6, Figure 7 and Figure 8 and the charts for the experiment at 40 °C are not presented here.

Figure 5.
The chart of ηred (100 °C) for SIP 1 in base oils.
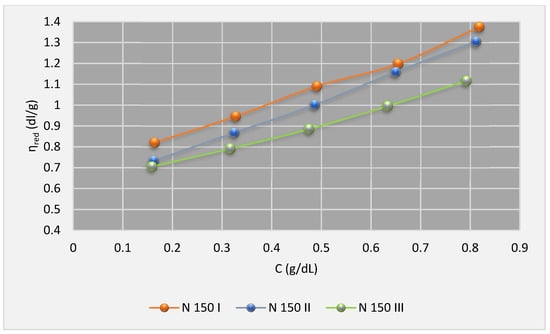
Figure 6.
The chart of ηred (100 °C) for SIP 2 in base oils.
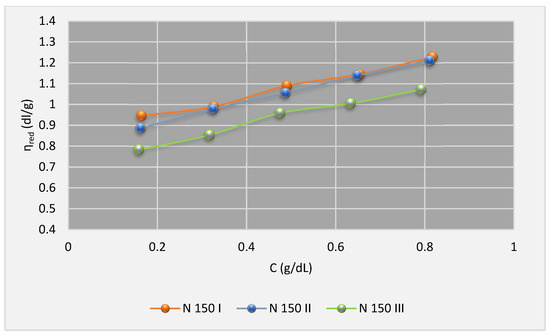
Figure 7.
The chart of ηred (100 °C) for IP in base oils1.

Figure 8.
The chart of ηred (100 °C) for OCP in base oils.
Based on Huggins model, from extrapolation of the charts to zero limits of concentrations, the intrinsic viscosities data have been determined and given in Table 6, Table 7 and Table 8.
Table 6.
Intrinsic viscosity results, dL/g. Polymers dissolved in N 150 I.
Table 7.
Intrinsic viscosity results, dL/g. Polymers dissolved in N 150 II.
Table 8.
Intrinsic viscosity results, dL/g. Polymers dissolved in N 150 III.
According to the information in Table 6, Table 7 and Table 8, the primary finding of this study is that the intrinsic viscosities for all used VIIs in all given base oils decrease with the increase in temperature. This is in agreement with other works like Abdul Fattah and et al. [33], Michael J. Covitch [40], and so on. The reason for the different behavior of polymers in each solvent can be attributed to the molecular weight, the structure of the polymer, and carbon type composition of the solvent. However, the percentage of polymer crystallinity is also effective, but according to Ashish Sen [39], its effect at higher temperatures could be ignored.
According to the previous studies (e.g., the above-mentioned studies) it could be concluded that the data of Table 6, Table 7 and Table 8, which show the intrinsic viscosities of polymer-oil solutions at 100 °C and 40 °C, and their changes, are quite reasonable.
Moreover, it was found that the intrinsic viscosities are positively correlated to polymer molecular weights. In other words, in the given solvent and temperature, the higher the molecular wt., the higher the intrinsic viscosity. However, there is an exception only in group III base oil, in which the intrinsic viscosities for SIP 2 are slightly higher than SIP 1. Although, the SIP 1 molecules are a slightly heavier. This is due to considerable difference between solubility of these two polymers in API group III base oils. Both SIP 1 and 2 are di-block polystyrene-isoprene, but SIP 2 has a smaller polystyrenic segment (aromatic segment). It enhances its solubility in API group III base oils that have very low (almost zero) amounts of aromatic and naphthenic hydrocarbons.
The third important finding is that the rate of intrinsic viscosity change of used polymers from API group I to API group III base oils follows a trend that is illustrated in Figure 9. The reason for this could be attributed to changing the solubility of each polymer by base oil types. SIP 1 has the highest solubility difference between API group I and API group III. In the same vein, a similar trend with a lower slope for IP was observed, but OCP showed the least difference. In other words, OCP solubilized more readily in all types of the base oils.
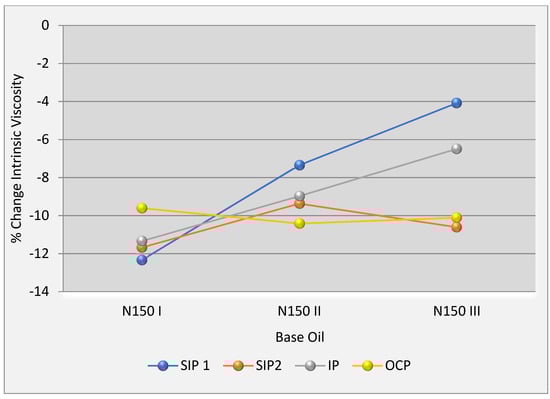
Figure 9.
The chart of change% intrinsic viscosity in base oils.
4. Conclusions
In the present study, the properties of four types of the most important viscosity index improvers (VII), namely, olefin, styrene-isoprene, and isoprene copolymers, were investigated in API groups I, II, and III base oils at two temperatures of 40 °C and 100 °C. According to the results and discussion sections, following conclusions are provided:
All of the above well-known polymers increase the VI of lubricants, while the molecular size of all of them decreases with increasing temperature. Then improvement of VI by VII is not necessarily due to the expansion of the polymer molecule with temperature.
Generally, at a certain temperature, the size of polymer by going from API group I, API group II to III base oils shows a considerable decrease. The reason is less solubility of polymer in the base oil with lower amounts of aromatic and/or naphthenic hydrocarbons.
The size decreases from 40 to 100 °C for a given polymer in different base oils, depending on the polymer solubility in the base oil. In fact, more solubility means higher reduction and vice versa.
Author Contributions
S.A.K., M.A.P. and E.F. conceived and designed the experiments; S.A.K., M.A.P. and E.F. performed the experiments; S.A.K., M.A.P. and E.F. analyzed the data; S.A.K., M.A.P. and E.F. contributed reagents/materials/analysis tools; S.A.K., M.A.P. and E.F. wrote the paper. All authors have read and agreed to the published version of the manuscript.
Funding
This research received no external funding.
Institutional Review Board Statement
Not applicable.
Informed Consent Statement
Not applicable.
Data Availability Statement
Not applicable.
Conflicts of Interest
All the steps of inspection, materials used and laboratory equipment have been done at the refinery of Behran Oil Company.
References
- Mang, T.; Dresel, W. Lubricants and Lubrication, 2nd ed.; Wiley-VCH: Weinheim, Germany, 2007; pp. 25–28. [Google Scholar]
- ASTM D2270-10; Standard Practice for Calculating Viscosity Index from Kinematic Viscosity at 40 °C and 100 °C. ASTM International: West Conshohocken, PA, USA, 2016.
- Zakarian, J. The limitations of the viscosity index and proposals for other methods to rate viscosity–temperature behavior of lubricating oils. SAE Int. J. Fuels Lubr. 2012, 5, 1123–1131. [Google Scholar] [CrossRef]
- Stambaugh, R.L.; Kinker, B.G. Chemistry and Technology of Lubricants; Mortier, R.M., Fox, M.F., Orszulik, S.T., Eds.; Springer: Dordrecht, The Netherlands, 2010; pp. 153–187. [Google Scholar]
- Cusseau, P.; Bouscharain, N.; Martinie, L.; Philippon, D.; Vergne, P.; Briand, F. Rheological considerations on polymer-based engine lubricants: Viscosity index improvers versus thickeners—generalized Newtonian models. Tribol. Trans. 2018, 61, 437–447. [Google Scholar] [CrossRef]
- Müller, H.G. Mechanism of action of viscosity index improvers. Tribol. Int. 1978, 11, 189–192. [Google Scholar] [CrossRef]
- Andrade, E.D.C. The Viscosity of Liquids. Nature 1930, 125, 309–310. [Google Scholar] [CrossRef]
- Eyring, H. Viscosity, Plasticity, and Diffusion as Examples of Absolute Reaction Rates. J. Chem. Phys. 1936, 4, 283–291. [Google Scholar] [CrossRef]
- Angell, C.A. Formation of Glasses from Liquids and Biopolymers. Science 1995, 267, 1924–1935. [Google Scholar] [CrossRef] [Green Version]
- Willett, E.; DeVore, A.; Vargo, D. Viscometric and Low Temperature Behavior of Lubricants with Blended VI Improvers. In Proceedings of the 85th Annual NLGI Meeting, Coeur d’Alene, ID, USA, 9–12 June 2018. [Google Scholar]
- Martini, A.; Ramasamy, U.S.; Len, M. Review of Viscosity Modifier Lubricant Additives. Tribol. Lett. 2018, 66, 58. [Google Scholar]
- Cheng, G.; Graessley, W.W.; Melnichenko, Y.B. Polymer Dimensions in Good Solvents: Crossover from Semi dilute to Concentrated Solutions. Phys. Rev. Lett. 2009, 102, 157801. [Google Scholar] [CrossRef]
- Rubinstein, M.; Colby, R.H. Polymer Physics; Oxford University Press: Oxford, UK, 2003. [Google Scholar]
- Jukić, A.; Tomašek, L.J.; Janović, Z. Polyolefin and poly (alkyl methacrylate) mixed additives as mineral lubricating oil rheology modifiers. Lubr. Sci. 2006, 17, 431–449. [Google Scholar] [CrossRef]
- Gabillet, P.; Willemin, C.; Chauvel, B. Viscosity Additive for Lubricating Oils. Patent U.S. 5108635A, 28 March 1992. [Google Scholar]
- Galluccio, R.A.; Lai, C.-Y.; Neveu, C.D. Preparation of a Graft-Copolymeric Compatibilizer Useful as an Oil Additive. Patent EP0193272A2, 31 August 1994. [Google Scholar]
- Callais, P.; Schmidt, S.; Macy, N. The Effect of Controlled Polymer Architecture on VI and Other Rheological Properties. SAE Tech. Pap. 2004, 113, 2070–2079. [Google Scholar]
- Müller, M.; Fan, J.; Spikes, H. Design of Functionalized PAMA Viscosity Modifiers to Reduce Friction and Wear in Lubricating Oils. In Automotive Lubricant Testing and Advanced Additive Development; Tung, S., Kinker, B., Woydt, M., Eds.; ASTM International: West Conshohocken, PA, USA, 2008; pp. 116–125. [Google Scholar] [CrossRef]
- Barton, J.S.; Richard, J.V.; Lee, O.-D.; William, J.D.; Ananda, G. Controlled Architecture Viscosity Modifiers for Driveline Fluids: Enhanced Fuel Efficiency and Wear Protection. In Proceedings of the 14th Annual Fuels & Lubes Asia Conference, Seoul, Korea, 5–7 March 2008; F&L Asia, INC: Muntinlupa, Philippines. [Google Scholar]
- Fan, J.; Müller, M.; Stöhr, T.; Spikes, H.A. Reduction of Friction by Functionalized Viscosity Index Improvers. Tribol. Lett. 2007, 28, 287–298. [Google Scholar] [CrossRef]
- Covitch, M.J. How Polymer Architecture Affects Permanent Viscosity Loss of Multigrade Lubricants. SAE Technical. 1998. [Google Scholar] [CrossRef]
- Jabbarzadeh, A.; Atkinson, J.D.; Tanner, R.I. Effect of Molecular Shape on Rheological Properties in Molecular Dynamics Simulation of Star, H, Comb, and Linear Polymer Melts. Macromolecules 2003, 36, 5020–5031. [Google Scholar] [CrossRef]
- Robinson, J.W.; Zhou, Y.; Priyanka, B.; Robert, E.; Jun, Q.; Timothy, B.J.; Lelia, C. Probing the molecular design of hyper-branched aryl polyesters towards lubricant applications Joshua. Sci. Rep. 2016, 6, 18624. [Google Scholar] [CrossRef] [PubMed] [Green Version]
- Jianli, W.; Zhibin, Y.; Shiping, Z. Topology-Engineered Hyper branched High-Molecular-Weight Polyethylenes as Lubricant Viscosity-Index Improvers of High Shear Stability. Ind. Eng. Chem. Res. 2007, 46, 1174–1178. [Google Scholar]
- Lelia, C.; Deepika, M.; Kristen, B.C.; Marie, S.S.; Zachary, C.K. Molecular Design and Shear Stability Correlations of Dendritic Polymethacrylates. Mol. Syst. Des. Eng. 2019, 4, 1114–1124. [Google Scholar]
- Torsten, S.; Boris, E.; Michael, M. A New Generation of High Performance Viscosity Modifiers Based on Comb Polymers. SAE Int. J. Fuels Lubr. 2009, 1, 1511–1516. [Google Scholar]
- Lubrizol. Available online: https://www.lubrizol.com (accessed on 1 August 2018).
- Lelia, C.; Joshua, W.R.; Yan, Z.; Jun, Q. Dual functional star polymers for lubricants. RSC Adv. 2016, 6, 86259–86268. [Google Scholar]
- Joshua, W.R.; Yan, Z.; Jun, Q.; Robert, E.; Lelia, C. Effects of star-shaped poly(alkyl methacrylate) arm uniformity on lubricant properties. J. Appl. Polym. Sci. 2016, 133, 43611. [Google Scholar]
- Hadjichristidis, N.; Pispas, S.; Pitsikalis, M.; Iatrou, H.; Vlahos, C. Asymmetric Star Polymers: Synthesis and Properties. Adv. Polym. Sci. 1999, 142, 71–127. [Google Scholar]
- Shawn, M.; Zhibin, Y.; Ramesh, S.; Shiping, Z. Higher-molecular-weight hyper branched polyethylene containing crosslinking structures as lubricant viscosity-index improvers. Polym. Eng. Sci. 2009, 50, 911–918. [Google Scholar]
- Selby, T.W. The Non-Newtonian Characteristics of Lubricating Oils. ASLE Trans. 1958, 1, 68–81. [Google Scholar] [CrossRef]
- LaRiviere, D.; Asfour, A.F.A.; Hage, A.; Gao, J.Z. Viscometric Properties of Viscosity Index Improvers in Lubricant Base Oil over a Temperature Range. Part I: Group II Base Oil. Lubr. Sci. 2000, 12, 133–143. [Google Scholar] [CrossRef]
- Flory, P.J. Principle of Polymer Chemistry; Cornell University Press: Ithaca, NY, USA, 1953. [Google Scholar]
- Hiemenz, P.C.; Lodge, T.P. Polymer Chemistry, 2nd ed.; CRC Press: Boca Raton, FL, USA, 2007; pp. 327–379. [Google Scholar]
- Hansen, C.M. Hansen Solubility Parameters: A User’s Handbook, 2nd ed.; CRC Press: Boca Raton, FL, USA, 2007. [Google Scholar]
- Weijun, W.; Long, J.; He, Y.; Sun, H.; Songbai, T. Influence of Different Hydrocarbon Molecules on Physical Properties of Mineral Base Oils. China Pet. Process. Petrochemical. Technol. 2017, 19, 33–45. [Google Scholar]
- Ming, X.; Chi, W. A Method to Determine Θ Condition of a Polymer Solution. Macromolecules 2018, 51, 4608–4614. [Google Scholar] [CrossRef]
- Sen, A.; Rubin, I.D. Molecular Structures and Solution Viscosities of Ethylene-Propylene Copolymers. Macromolecules 1990, 23, 2519–2524. [Google Scholar] [CrossRef]
- Covitch, M.J.; Trickett, K.J. How Polymers Behave as Viscosity Index Improvers in Lubricating Oils. Adv. Chem. Eng. Sci. 2015, 5, 134–151. [Google Scholar] [CrossRef] [Green Version]
- Ramasamy, U.S.; Lichter, S.; Martini, A. Effect of molecular-scale features on the polymer coil size of model viscosity index improvers. Tribol. Lett. 2016, 62, 23. [Google Scholar] [CrossRef]
- Ramasamy, U.S.; Len, M.; Martini, A. Correlating molecular structure to the behavior of linear styrene–butadiene viscosity modifiers. Tribol. Lett. 2017, 65, 147. [Google Scholar] [CrossRef]
- Len, M.; Ramasamy, U.S.; Lichter, S.; Martini, A. Thickening mechanisms of polyisobutylene in polyalphaolefin. Tribol. Lett. 2017, 66, 5. [Google Scholar] [CrossRef]
- Goldmints, I.; Oberoi, S. Lubricant Additives: Chemistry and Applications; Rudnick, L.R., Ed.; CRC Press: Boca Raton, FL, USA, 2017; pp. 225–274. [Google Scholar]
- Bezot, P.; Hesse-Bezot, C.; Elmakoudi, B.; Constants, B.; Faure, D.; Hoornaert, P. Comparison of hydrodynamic and rheological properties of dilute solutions of a styrene-hydrogenated butadiene copolymer in aliphatic solvents by light scattering and viscometric techniques. J. Appl. Polym. Sci. 1994, 51, 1715–1725. [Google Scholar] [CrossRef]
- Petrukhina, N.N.; Tsvetkov, O.N.; Maksimov, A.L. Hydrogenated Styrene–Diene Copolymers as Thickening Additives to Lubricating Oils. Russ. J. Appl. Chem. 2019, 92, 1179–1189. [Google Scholar] [CrossRef]
- Pauline, C.; Philippe, V.; Laetitia, M.; David, P.; Nicolas, D.; Fanny, B. Film Forming Capability of Polymer-Base Oil Lubricants in Elastohydrodynamic and Very Thin Film Regimes. Tribol. Lett. 2019, 67, 45. [Google Scholar]
- Tanford, C. Physical Chemistry of Macromolecules; John Wiley: New York, NY, USA, 1961; pp. 390–412. [Google Scholar]
- Delpech, M.C.; Oliveira, C.M.F. Viscometric study of poly (methyl methacrylate-g-propylene oxide) and respective homopolymers. Polym. Test. 2005, 24, 381–386. [Google Scholar] [CrossRef]
- Simionescu, C.I.; Ioan, S.; Simionescu, B.C. Solution properties of ultra-high molecular weight polymers—13. Viscosity-molecular weight relationships and unperturbed dimensions of poly (butyl methacrylate) in various solvents. Eur. Polym. J. 1987, 23, 69–72. [Google Scholar] [CrossRef]
- Delpech, M.C.; Coutinho, F.M.B.; Habibe, M.E.S. Viscometry study of ethylene–cyclic olefin copolymers. Polym. Test. 2002, 21, 411–415. [Google Scholar] [CrossRef]
- Abdel-Azim, A.A.; Atta, A.M.; Farahat, M.S.; Boutros, W.Y. Determination of intrinsic viscosity of polymeric compounds through a single specific viscosity measurement. Polymer 1998, 39, 6827–6833. [Google Scholar] [CrossRef]
- Delpech, M.C.; Coutinho, F.M.B.; Habibe, M.E.S. Bisphenol A-based polycarbonates: Characterization of commercial samples. Polym. Test. 2002, 21, 155–161. [Google Scholar] [CrossRef]
Publisher’s Note: MDPI stays neutral with regard to jurisdictional claims in published maps and institutional affiliations. |
© 2022 by the authors. Licensee MDPI, Basel, Switzerland. This article is an open access article distributed under the terms and conditions of the Creative Commons Attribution (CC BY) license (https://creativecommons.org/licenses/by/4.0/).