Article

Synthesis, Characterization and DNA-Binding Affinity of a New Zinc(II) Bis(5-methoxy-indol-3-yl)propane-1,3-dione Complex

Department of Science and High Technology, Università degli Studi dell’Insubria, Via Valleggio 9, 22100 Como, Italy
*
Author to whom correspondence should be addressed.
Pharmaceuticals 2021, 14(8), 760; https://doi.org/10.3390/ph14080760
Submission received: 6 July 2021 / Revised: 21 July 2021 / Accepted: 28 July 2021 / Published: 3 August 2021

Abstract

:
The novel zinc(II) µ-oxo-bridged-dimeric complex [Zn2(µ-O)2(BMIP)2] (BMIP = 1,3-bis(5-methoxy-1-methyl-1H-indol-3-yl)propane-1,3-dione), 1, was synthetized and fully characterized. The spectral data indicate a zincoxane molecular structure, with the BMIP ligand coordinating in its neutral form via its oxygen atoms. Structural changes in 1 in dimethylsulfoxide (DMSO) were evidenced by means of spectroscopic techniques including infrared absorption and nuclear magnetic resonance, showing DMSO entrance in the coordination sphere of the metal ion. The resulting complex [Zn2(µ-O)2(BMIP)2(DMSO)], 2, readily reacts in the presence of N-methyl-imidazole (NMI), a liquid-phase nucleoside mimic, to form [Zn2(µ-O)2(BMIP)2(NMI)], 3, through DMSO displacement. The three complexes show high thermal stability, demonstrating that 1 has high affinity for hard nucleophiles. Finally, with the aim of probing the suitability of this system as model scaffold for new potential anticancer metallodrugs, the interactions of 1 with calf thymus DNA were investigated in vitro in pseudo-physiological environment through UV-Vis absorption and fluorescence emission spectroscopy, as well as time-resolved fluorescence studies. The latter analyses revealed that [Zn2(µ-O)2(BMIP)2(DMSO)] binds to DNA with high affinity upon DMSO displacement, opening new perspectives for the development of optimized drug substances.

1. Introduction

Since the anticancer properties of cisplatin were first discovered by Rosenberg in 1965 [1], many efforts have been focused on both finding more effective metallodrugs and reducing the severe side effects typical of the parent compound [2,3,4,5]. In particular, β-diketone-based metal complexes are constantly catching interest [6,7] due to β-dicarbonyls’ structural simplicity and, in case of, e.g., curcuminoid compounds, intrinsic biological properties and natural availability [8]. For instance, Lippard reported benzoylacetonate platinum(II) complexes to preserve antitumor activity, in some cases even at lower doses than uncomplexed cisplatin [9]. Among non-platinum based compounds, in 1995, Hanauske and coworkers introduced budotitane as the first titanium(IV) drug for cancer treatment [10]. Other cytotoxic β-dicarbonyls exploit the presence of RuII [11], CoII [12], CuII [13,14], NiII [15,16] and oxovanadium(IV) [17].
Among cheap and low-toxicity metal ions of the d-block, zinc(II) is one of the most abundant ones naturally present in the human body [18,19] and plays key roles in cell metabolism [20,21]. Recently, many ZnII complexes with good DNA-binding properties were synthetized, exploiting different types of bidentate ligands such as bis(thiosemicarbazone) [22], isoeuxanthone [23], 5,7-dihalo-8-substituted quinolones [24], oxolinic acid [25] and Hpyramol [26]. However, only few examples of cytotoxic ZnII β-diketone-based metallodrugs are reported in the literature, containing either acetylacetone [27], 2-thenoyltrifluoroacetone [28] or curcuminoid fragments [29,30,31].
Indole derivatives have tremendous relevance for their biological importance [32,33,34] and they are subjected to extensive research for their anticancer properties [35,36,37]. In 2010, Cirrincione and coworkers provided new bis(indol-3-yl)propane-1,3-dione molecules as intermediates to achieve nortopsentin analogues with antitumor potential [38]. Given our general interest in indole chemistry [39,40,41] and inspired by Cirrincione’s work, we present in this paper the synthesis and characterization of a novel ZnII complex, [Zn2(µ-O)2(BMIP)2], 1, (Scheme 1). A deep analysis of the molecular structure of 1 has been carried out, revealing a zincoxane core which binds the BMIP ligand in neutral form. Compound 1 shows good affinity for hard nucleophiles, as it can readily expand its coordination sphere when dissolved in DMSO, forming the [Zn2(µ-O)2(BMIP)2(DMSO)] species, 2. Moreover, the DMSO ligand can be easily displaced by N-methyl-imidazole (NMI), a common nucleoside mimic, leading to the formation of [Zn2(µ-O)2(BMIP)2(NMI)], 3. The three compounds show high thermal stability. Finally, successful DNA coordination tests in pseudo-physiological buffer solution suggest that 1 can be regarded as a scaffold compound for a new family of potential anticancer drugs.

2. Results and Discussion

2.1. Synthesis

Synthesis of the BMIP ligand was accomplished by acylation of the electron-rich 5-methoxy-N-methyl-indole with malonyl dichloride [38]. Compound 1 was afforded by reaction of BMIP with zinc(II) perchlorate in basic conditions (Scheme 1). Further details are given in the Supplementary Materials section.

2.2. Spectroscopic and Structural Studies

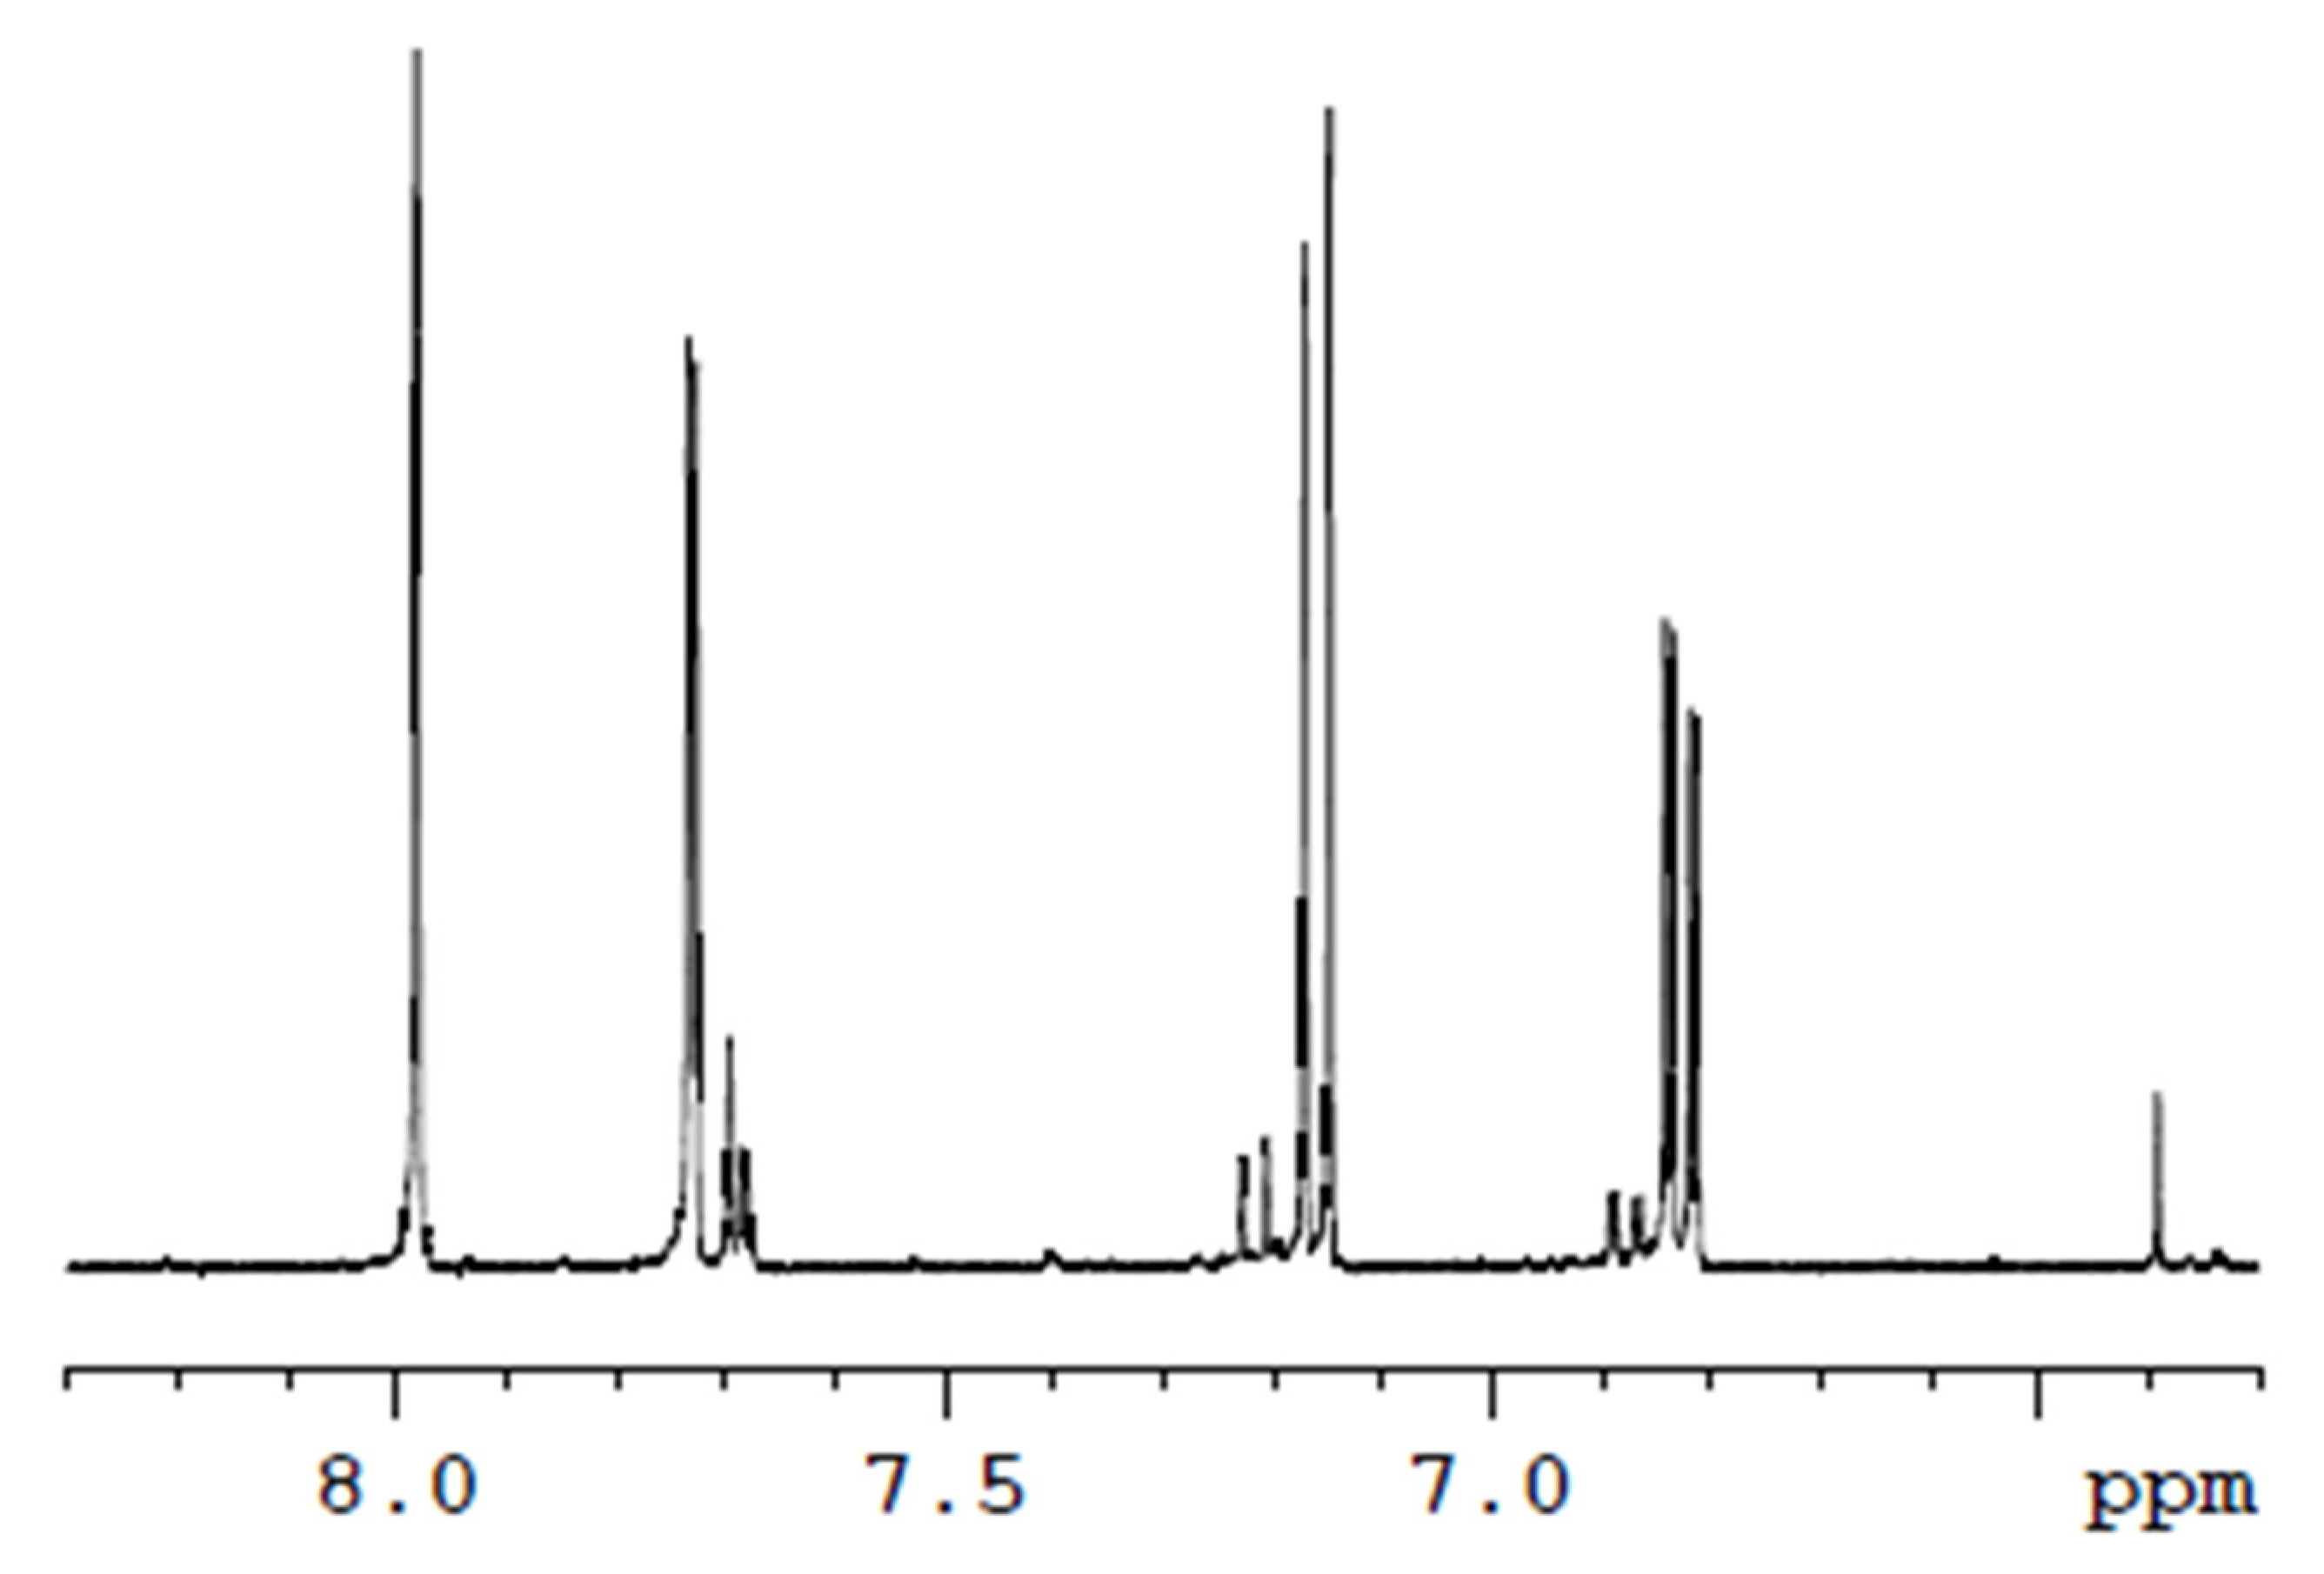
2.2.1. NMR Spectroscopy

As the 1H-NMR spectrum of 1 in CD2Cl2 shows a symmetrical aromatic pattern (see Supplementary Materials Figure S1), BMIP metal chelation via the carbonyl oxygens can be assumed. Concerning the upfield region, the signals for the indole N-Me and the 5-methoxy groups were found overlapped at 3.76 ppm, whilst in free BMIP they are observed as distinct singlets at 3.75 and 3.77 ppm, respectively. More interestingly, the 1H-NMR spectrum of 1 shows a signal at 4.32 ppm, similar to that found for the β-dicarbonyl CH2 in the free ligand, the associated integral being compatible with two protons. This suggests that BMIP mainly coordinates via its neutral keto form, rather than its enolate (Scheme 2). This is supported also by the 13C-NMR spectrum (Supplementary Materials Figure S2), clearly evidencing not only the β-dicarbonyl CH2 at 55 ppm, but even the ketone carbon signal at 188 ppm. Many examples of chelating neutral diketone complexes are already documented in the literature, mainly containing acetylacetone [42,43,44]. However, if BMIP is present as neutral ligand, an anionic charge compensator for ZnII must be present. Lewinski recently reported that a characteristic zincoxane Zn-O-Zn bridged structure is quite common in zinc(II) coordination chemistry [45]. In particular, treatment of zinc(II) acetylacetonate in refluxing polar solvents leads to formation of Zn-O clusters [46].
The stoichiometry of complex 1, determined by assessing its molecular weight with high-resolution mass spectrometry (HRMS) and elemental analysis, points to the formation of a ZnII dinuclear complex, formally viewed as two [Zn(BMIP)]2+ units with the zinc(II) centers bridged by two µ2-O2− anions (Scheme 1). The presence of µ2-O2− is required to neutralize the positive charge of the [Zn(BMIP)]2+ unit. The molecular structure of 1 may then be formally considered as a dimeric zincoxane stabilized by the organic ligand. In addition, the presence in the 1H-NMR spectrum of 1 of side peaks in the aromatic region at 7.70 ppm, 7.68 ppm, 7.22 ppm and 6.88 ppm, and of the characteristic olefin proton at 6.50 ppm (see Figure 1) reveals the coexistence of the enolic neutral form (Scheme 2) together with the prevalent diketo one. The presence of the enol tautomer in neutral coordinated β-dicarbonyls is already documented in the literature [42,43].

2.2.2. IR Spectroscopy

The FT-IR analysis of compound 1 (Table 1 and Supplementary Materials Figure S3) reveals that the C=O stretching band is located at 1520 cm−1, strongly red-shifted compared to the homologous vibration at 1618 cm−1 detected for the BMIP free ligand. This marked difference is a good evidence of strong coordination of the metal ion through the β-diketone oxygen atoms [47]. Furthermore, two additional bands lacking in the ligand spectrum appear in the low frequency region at 507 cm−1, which may be attributed to Zn-OBMIP vibrations [48].

2.2.3. Electronic-State Transition Spectroscopy

UV-Vis Absorption in Organic Solvents

In order to further investigate the keto-enol tautomerism of 1 in different environments, UV-Vis absorption spectroscopy experiments were undertaken. Namely, the UV-Vis absorption spectra of 1 were recorded in a panel of organic solvents and in water. Unfortunately, due to the low solubility of 1 in most environments, only a limited number of solvents could be probed, namely: dichloromethane (DCM), as a benchmark of slightly polar poorly hydrogen-bonding solvent; DMSO and dimethylformamide (DMF), as benchmarks of highly polar, H-bond accepting solvent; and ethanol (EtOH), as a paradigm of protic solvent. In EtOH, 1 is only slightly soluble (saturation is reached in the micromolar concentration range). Thus, filtration of the solution over paper was necessary to obtain clear (i.e.,: non-scattering) samples. The absorption spectra are plotted in Figure 2. Due to the high absorption of DMSO and DMF in the UVB spectral region, our analysis has focused on the 270–650 nm range. The spectra acquired in any of the tested solvents exhibit two distinct absorption peaks, one around λabs,1 ≈ 310 nm and another at λabs,2 ≈ 395 nm. The exact positions of the absorption peaks are reported in Table 2.
The peaks positions and bands’ line-shapes are only slightly affected by the solvent properties. Conversely, the relative intensity of the two bands dramatically changes, as seen in Table 2, fourth column, where the values of f1 = Abs(310 nm)/[Abs(310 nm) + Abs(395 nm)] are reported.
Relying on previous experiences [49,50] as well as literature data [51] on other β-diketones, we attributed the 310 nm peaked band to the absorption of the BMIP ligands in the diketo tautomer, and the 395 nm peaked one to the absorption of those in the enol form. According to this interpretation, the coexistence of two peaks in all the solvents would support the picture offered by NMR, suggesting that both the diketo and the enol tautomers are able to chelate zinc(II) ions with comparable efficacy, and that the keto-enolic equilibrium is primarily dictated by solute–solvent interactions, rather than complexation.
The bands’ attribution is corroborated by comparison of the relative peak absorbance f1, retrieved from the UV-Vis spectra, with the relative integral of the signals at 7.16 ppm and 7.22 ppm, characteristic of the diketo and enol tautomers, respectively, in the 1H-NMR spectra in deuterated DCM and DMSO (see fifth column of Table 2). Unfortunately, the acquisition of NMR spectra in EtOH was prevented by the scarce solubility of 1 in this solvent, while we did not investigate the equilibrium in deuterated DMF due to shortage of this solvent. However, the almost perfect matching of the relative absorbance with the fractional concentration values in both the solvents used for double-blind analysis by means of UV-Vis and NMR spectroscopy (Table 2, columns 4 and 5) implies that, at least in DCM and DMSO, the molar extinction coefficient is very similar at the diketo and keto-enol absorption peak. Indeed, estimation of this spectroscopic parameter is feasible on solutions in which the total concentration of 1 is predetermined by weight (see Materials and Methods for details). In such specimens, the fractional concentrations of diketo and enol tautomers established by NMR can be adopted to calculate the absolute diketo and enol concentration values. The resulting molar extinction coefficients (reported in parenthesis beneath the peak wavelengths of the pertaining absorption peaks in the second and third column of Table 2) differ by few percent. Under the assumption that this similarity holds true also in the other solvents, the relative absorbance values reported in the fourth column of Table 2 constitute good estimates of the fractional concentration of diketo tautomer also in DMF, and the average molar extinction coefficient can be calculated (see last column in Table 2). Due to the necessity of preliminarily filtering the EtOH solution, it was impossible to derive the molar extinction coefficient value in this solvent, instead.

Steady-State Fluorescence in Organic Solvents

The fluorescence emission spectra of 1 in the above-investigated solvents were recorded upon excitation at both the enol and the diketo absorption peak. They are plotted in Figure 3, panels (a) and (b), respectively. Excitation at the ≈395 nm (enol) peak results in an emission peaked at around 425 nm, with the exception of the notably red-shifted spectrum measured in EtOH (λmax ≈ 450 nm). The exact values of the maximum emission wavelength in the different solvents are listed in Table 3.
A similar behavior (red-shifted fluorescence in alcohols) was observed for several curcuminoids, and ascribed to tautomerism between the open cis- and trans-enol species [49,50,52,53,54,55,56,57]. The quantum yield of 1 is generally low (see the values reported in Table 3). In spite of this, excitation at the ≈310 nm (diketo) peak results in spectra dominated by out-of-peak excited emission of the enol tautomers, while the emission of the diketo ones builds up a secondary band peaked at ≈350 nm, suggesting an even lower quantum yield for the latter tautomers.
This attribution is corroborated by the fluorescence excitation spectra recorded with λobs = 425 nm and 350 nm, which peak at ≈395 nm and around 300 nm, respectively (see Supplementary Materials Figure S4). The only exceptions to this rule are the excitation spectrum recorded with λobs = 425 nm in DCM, which has a maximum at 326 nm due to the high prevalence of the diketo tautomers in this solvent, and the excitation spectrum with λobs = 350 nm in DMF, which peaks at 280 nm, with a marked shoulder above 300 nm. Again by analogy with previously reported studies on curcumin analogues [49,50], this might indicate a non-trivial cis-/trans-tautomerism between the diketo tautomers in this solvent. Subtraction of out-of-peak excited fluorescence by the enolic species allowed to reconstruct the spectral features of the diketo emission (see Supplementary Materials Figure S5).

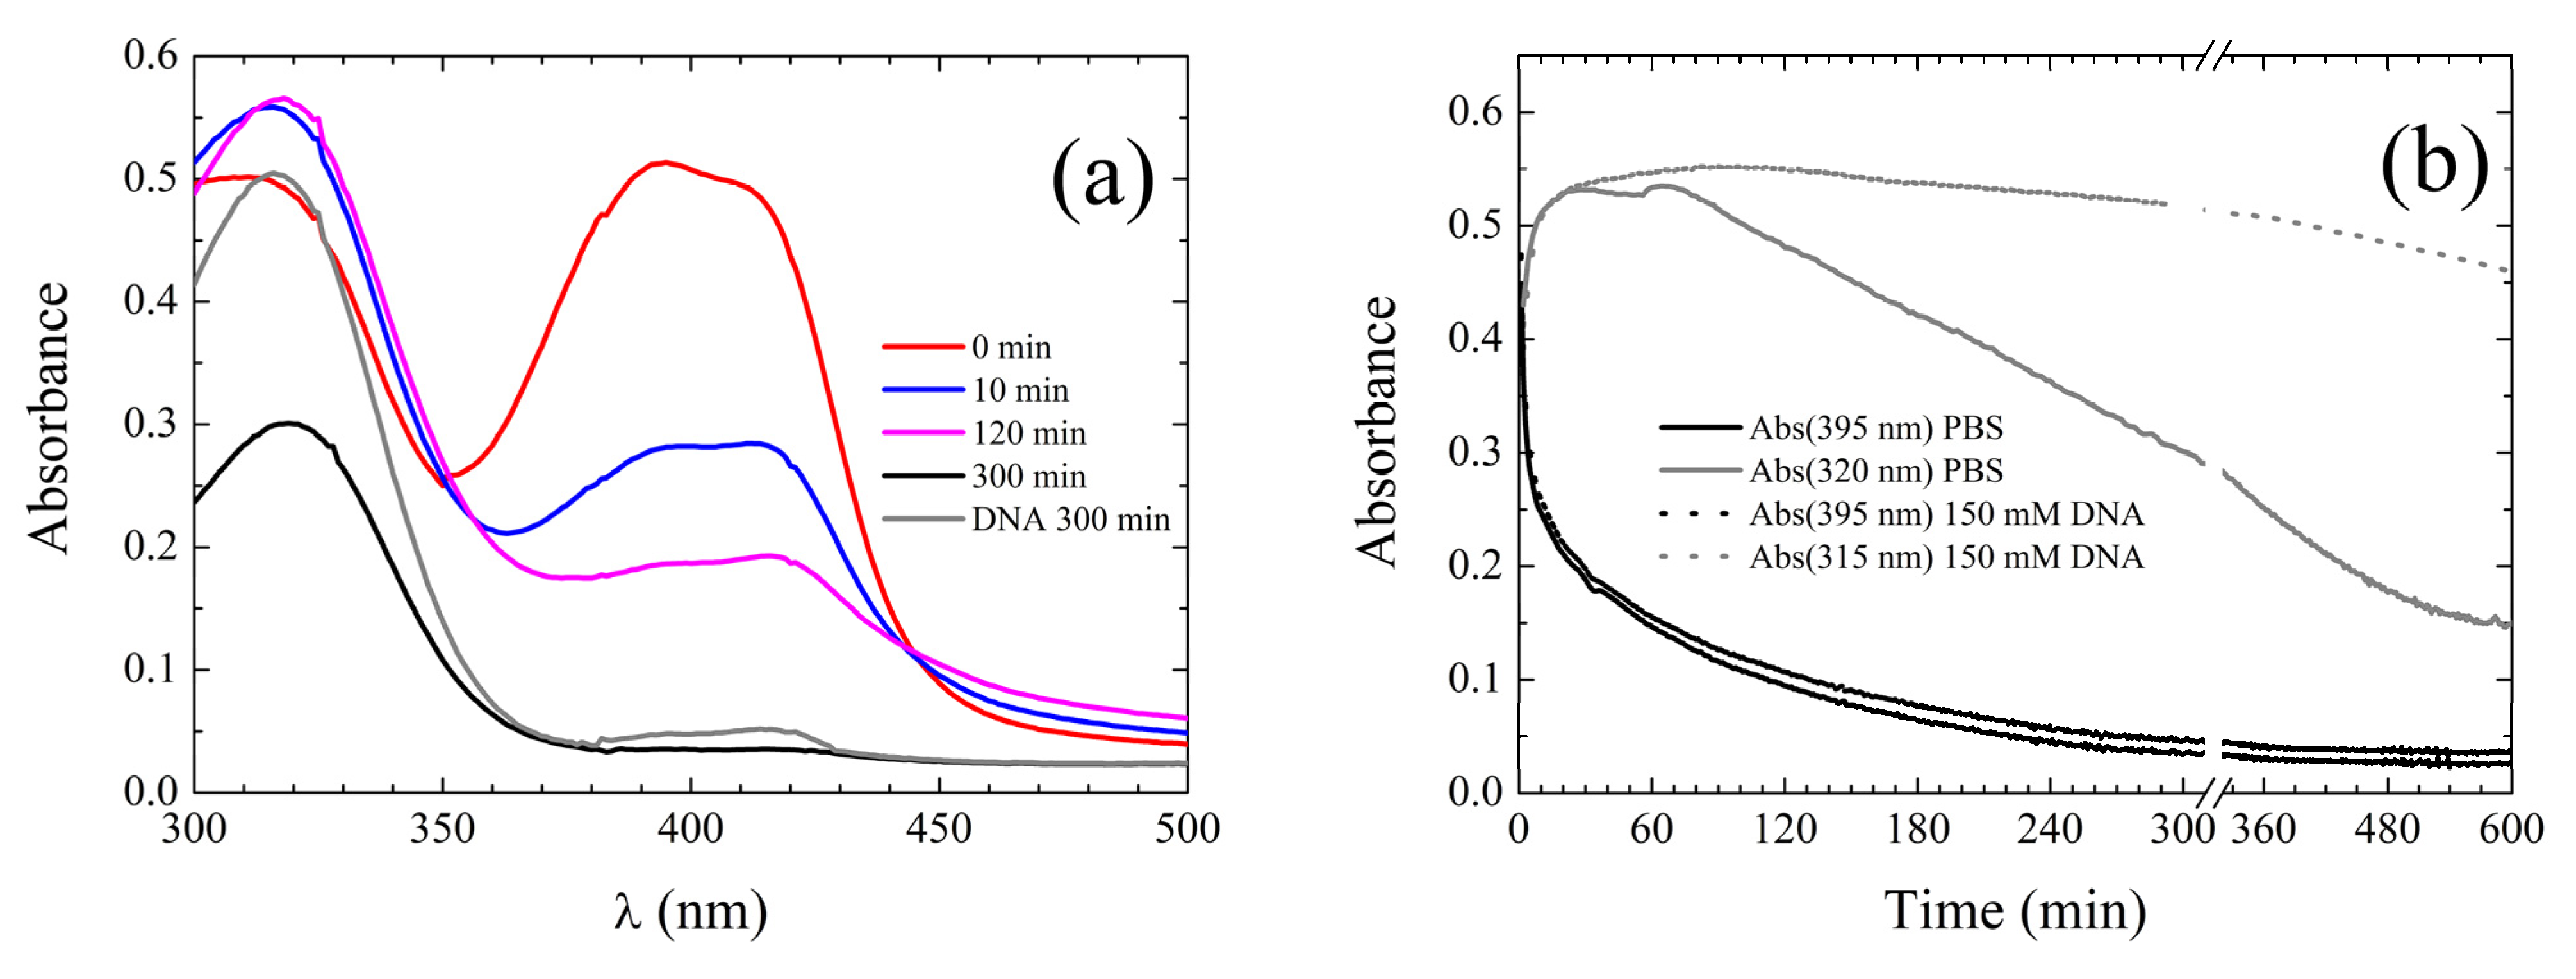
Spectroscopic Properties in Aqueous Environment

With the final goal to characterize the binding affinity of 1 for DNA in pseudo-physiological environment, a spectroscopic characterization of 1 in aqueous solution (namely phosphate buffer at pH 7.4 and 10 mM ionic strength) was undertaken. These investigations were hampered by the very low solubility of 1 in water. The low ionic strength adopted was indeed necessary in order to prevent ready precipitation of the compound. Nonetheless, in order to attain a clear solution, preliminary solubilization in DMSO followed by re-equilibration in buffer was necessary. In Figure 4a, selected spectra are plotted of a time-lapse experiment in which 50 μL of a 880 μM concentrated stock of 1 in DMSO are added to 2.95 mL of buffer. Readily after addition, the absorption spectrum (red curve) is very similar to that detected for a solution of 1 in pure DMSO (see Figure 2 for comparison). However, as solvent rearrangement takes place, DMSO is removed from the microenvironment of the compound and the latter is hydrated, the absorption peak at 390 nm characteristic of the enol tautomers progressively decreases in intensity at the advantage of a peak at 320 nm, which we ascribe to the absorption of hydrated diketo tautomers. Concomitantly, the peak at 310 nm typical of the diketo tautomers in DMSO also reduces its intensity. As shown in Figure 4, panel (b), where the absorbance values at 320 nm and 393 nm are plotted as a function of time, within 5 h after addition of the stock, the spectrum, plotted in black in Figure 4a, appears constituted by a single band peaked at 320 nm. This observation agrees with previous reports on the superior water solubility of the diketo with respect to the enol tautomers of synthetic curcuminoids [51]. Nonetheless, at length even the diketo tautomer tends to aggregate and precipitate, as denounced by progressive reduction in the absorbance at 320 nm.
For this reason, during the measurements in aqueous environment reported hereafter, where not otherwise stated, the samples were kept under stirring. Upon excitation in correspondence to the 320 nm peak of solutions kept under stirring overnight to achieve completion of solvent rearrangement, a fluorescence peak at 460 nm was detected (see Figure 5 for the emission spectrum). The quantum yield was measured to be 0.02.

Binding to DNA

The same measurements performed in aqueous environment were repeated upon addition of 50 μL of the same stock of 1 in DMSO to 2.95 mL of buffer in which 150 μM calf thymus DNA had been preliminarily dissolved. The solvent rearrangement dynamics resulted to be minimally affected by the presence of DNA. However, after complete hydration, the aggregation/precipitation dynamics take place with significantly slower kinetics (see Figure 4b, dotted lines). We interpret this phenomenon as due to binding of 1 to DNA and consequent slower precipitation of the complex.
The absorption spectral line-shape is slightly blue shifted to ≈315 nm. However, a sizeable hyperchromicity is observed, as shown in Figure 4a (gray line). Moreover, a very faint band appears peaking around 400 nm, i.e., in the absorption region typical of the enol tautomers. A similar behavior also pertains to aqueous solutions with and without DNA in which 1 is added upon preliminary solubilization in DMF, as shown in Supplementary Materials Figure S6a. In the latter case, absorption in the enol band is not detected.
The most striking effect of DNA addition concerns fluorescence emission. Namely, the fluorescence intensity is reduced to a barely detectable signal, see Figure 5, gray line, and Figure S6b, for the spectrum detected on the samples added with 1 dissolved in DMSO and DMF, respectively.
Accordingly, fluorescence quenching was assumed as a binding indicator and titration was attempted with the aim of estimating the apparent binding constant of the reaction. The details on samples preparation are provided in the Materials and Methods section. The binding isotherms (i.e., graphs of fluorescence at 460 nm plotted as a function of DNA concentration) obtained starting from 1 dissolved in DMSO and DMF are shown in Figure 6, together with the pertaining best-fitting curves according to the independent binding site model [58,59], i.e., using the following equation:
F ( C DNA ) = F ( 0 ) + δ F 2 [ nK diss + D + C DNA ( nK diss + D + C DNA ) 2 4 DC DNA ]
In Equation (1) F(CDNA) is the fluorescence measured for a solution at D concentration of 1 and CDNA concentration of DNA base pairs. D was kept constant to the values of 20 μM and 15 μM for the titrations starting from the DMSO and DMF stocks, respectively, and fixed accordingly during the fit. F0 represents the fluorescence of the free dye, δFxD the difference in fluorescence of the dye when totally bound to DNA with respect to F0. The parameters descriptive of the binding affinity are the dissociation constant, Kdiss, and the number of molecules of 1 reacting per DNA base pair in conditions of full binding sites saturation, n (i.e., the inverse of the number of bases involved in the binding of a single ligand molecule, the so-called binding length). The detailed fitting parameters are reported in Table 4. The apparent affinity constant for the binding reaction, defined as n/Kdiss, resulted to be on the order of 106 M−1 for both titrations. This value is comparable to those tabulated for several well established DNA stains and DNA-binding drugs [58]. The fairly low value retrieved for n, corresponding to a binding length of four base pairs, reasonably reflects the bulkiness of 1.

2.2.4. Powder X-ray Diffraction Studies

Powder X-ray diffraction qualitative analysis revealed the reproducibility of the synthetic path proposed for 1, not only at the molecular level, but also in the solid state: indeed, the precipitate, recovered from the reaction medium in the form of microcrystalline powders, does show the same PXRD pattern (Figure S7). Unfortunately, attempts to retrieve the unit cell parameters as the first step to undertake a crystal structure determination from PXRD invariably failed, irrespective of the software used. Incidentally, due to the already mentioned low solubility of 1 in different organic solvents, all the efforts carried out to recrystallize it in the form of single crystals suitable for single-crystal X-ray diffraction were not successful.

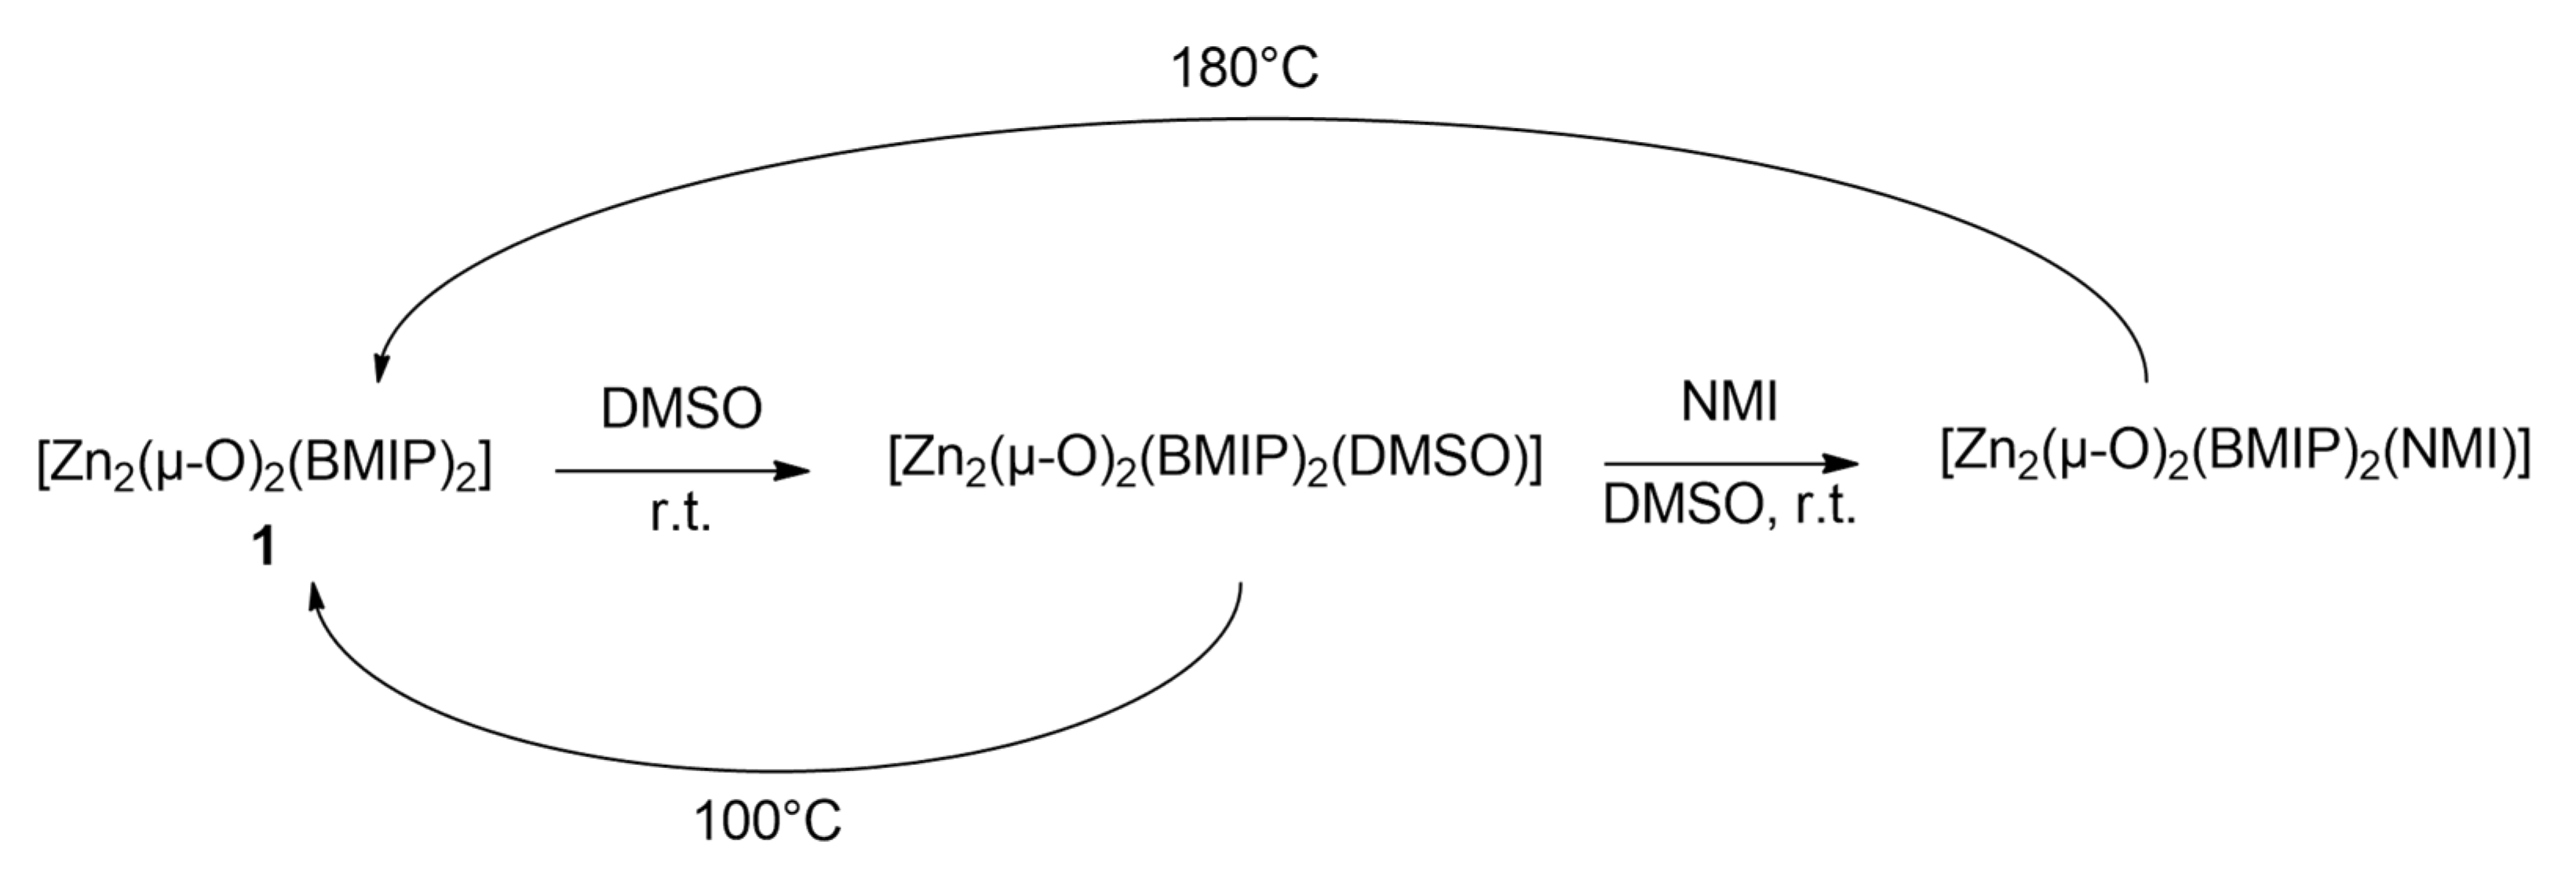
2.3. Coordination with DMSO and NMI

Although many zinc(II) coordination compounds are stable in a tetrahedral geometry, some five-coordinated complexes have been reported in recent years [60,61,62]. One notable example is provided by DMSO coordination [63]. As 1 is optimally soluble in this organic solvent, we investigated the proneness of DMSO to act as extra ligand in the coordination sphere of 1. Detailed synthetic procedures are given in the Supplementary Materials section.
DMSO coordination to form [Zn2(µ-O)2(BMIP)2(DMSO)], 2, was indeed observed by solid state IR spectroscopy. The band positions are listed in Table 1. The DMSO diagnostic bands at 1031 (methyl rocking) and 961 cm−1 (S=O vibration) were identified, as shown in Figure 7a. The red-shifted position of the latter band (the S=O vibration for free DMSO falls at 1054 cm−1) suggests that DMSO binds to the metal center through the oxygen atom. This is further confirmed by the presence of a band at 435 cm−1, attributed to Zn-ODMSO stretching [64], as shown in Figure 7b. BMIP coordination is minimally affected by DMSO binding. Indeed, its characteristic carbonyl band is observed at 1520 cm−1, not shifted with respect to the tetra-coordinated complex, while the low frequency peak at 507 cm−1 ascribable to Zn-OBMIP stretching is only slightly blue-shifted to 510 cm−1.
DMSO coordination is also unravelled by solution NMR. The DMSO-characteristic methyl signal at 2.58 ppm is identified in the 1H-NMR spectrum, along with an unmodified BMIP aromatic pattern and the tautomeric equilibrium, see Supplementary Materials Figure S8. The [Zn2(µ-O)2(BMIP)2(DMSO)] stoichiometry was confirmed by combined thermogravimetric analysis (TGA) and differential scanning calorimetry (DSC). The TGA profile shows that species 2 decomposes in two subsequent steps (see Supplementary Materials Figure S9). The first one, occurring at 184 °C, is compatible with the removal of the DMSO molecule (experimental mass loss: 7.92%, theoretical: 7.70%), and coincides with an endothermic event detected by means of DSC. The second step, which starts at 310 °C and ends up with a 37.78% mass loss, corresponds to decomposition of 1. The DSC/TGA of 1 is shown in Supplementary Materials Figure S10. Indeed, after DMSO loss, the DSC and TGA curves of 2 follow the same trend observed for compound 1. Although the high temperature required for DMSO ablation denotes the high stability of the DMSO complex, the similar trend of the DSC/TGA curves measured for 1 and 2 at high temperature suggests that DMSO ligation should be reversible. Accordingly, by heating 2 at 100 °C for 3 h under vacuum, 1 was reobtained in quantitative yield (Scheme 3), as testified by IR spectroscopy.
In conclusion, the above analyses demonstrate the ability of 1 to tune the zinc(II) coordination geometry in the presence of electron donors. This ability might provide a means for zinc(II) coordination with DNA nucleosides, as witnessed by the results exposed in Section 2.2.3. The next step towards characterization of the binding mode of 1 to DNA was to attempt coordination with N-methyl-imidazole (NMI), a widely used DNA mimic. Namely, 1 was initially suspended overnight under stirring in NMI, filtered, washed thoroughly to remove NMI residuals, and dissolved in CD2Cl2. Formation of [Zn2(µ-O)2(BMIP)2(NMI)], 3, was evidenced by solution 1H-NMR, namely by the appearance of the diagnostic N-Me signal at 3.71 ppm, as shown in Supplementary Materials Figure S11. Coordinated NMI aromatic protons were spotted as broad signals at 7.56 ppm, 7.07 ppm and 6.95 ppm, notably downfielded compared to the free molecule. The experiment was repeated starting from 2. In this instance, displacement of DMSO by NMI was observed. Indeed, the 1H-NMR spectrum was characterized by the disappearance of the signal at 2.58 ppm diagnostic of DMSO with concomitant appearance of the above-described features signalling NMI complexation. Finally, NMI complexation was afforded in CH2Cl2, adding the DNA mimic only in low amount (10 % v/v).
The infrared spectra of 3, see Figure 7, show two intense absorption bands at 1285 cm−1 and 1421 cm−1, attributed to the C–N and C=N ring stretching vibrations of NMI, respectively. Furthermore, when 2 is used as the starting compound, the bands characteristic of DMSO complexation (1031 cm−1, 961 cm−1 and 435 cm−1, vide supra) disappear.
The thermal behaviour of 3 was investigated by simultaneous DSC/TGA. The TGA trace shows that 3 decomposes in two steps (Supplementary Materials Figure S12). The first one, occurring at ≈ 220 °C, corresponds to removal of one NMI mole per mole of complex (experimental mass loss: 8.14%, theoretical: 8.0%), in agreement with the endothermic broad peak located at 253 °C (DSC). The second step occurs in the >360 °C temperature range, with a mass loss of 43%, and corresponds to an endothermic decomposition process. After loss of NMI, the DSC/TGA curve of 3 is very similar to that of 1.
Full coordination reversibility was also observed in this case, leading to quantitative recovery of compound 1 after 3 h of vacuum heating at 180 °C (Scheme 3).

3. Materials and Methods

3.1. Chemicals and Samples Preparation

All the chemicals were purchased from commercial suppliers and used as received. All reactions involving air- and/or moisture-sensitive materials were carried out under inert atmosphere, using a standard Schlenk-line technique. Where specified, reactions were monitored by thin layer chromatography (TLC), using ready-made ALUGRAM Xtra SIL G/UV254 (0.2 mm thick layer, Macherey-Nagel). Spots were observed under a UV lamp (365 nm and/or 254 nm). Gravimetric column chromatography was performed using silica gel as stationary phase (0.63–2 μm particle size).
The samples in aqueous environment exploited in the electronic-state transition spectroscopy characterization and in the spectrophotometric titration experiments were derived by highly concentrated stocks of 1 preliminarily solubilized in water-miscible organic solvents, namely DMSO and DMF. Indeed, due to the very scarce water solubility of 1, attempts to obtain clear water solutions by directly pouring powdered 1 in buffer failed, in spite of heating, sonication or overnight stirring. First, the solvent rearrangement dynamics (i.e., progressive detachment of the organic solvent and hydration) were monitored over time by means of UV-Vis spectroscopy (see Figure 4 in the Results section). As these studies revealed rather slow re-equilibration (roughly 5 h were needed to complete the process) and progressive aggregation/precipitation of the hydrated compound, the samples used for the titration experiments were kept under continuous stirring for 72 h by means of a mechanic stirrer prior to acquisition of the fluorescence spectra. While preparing the solutions, the DNA concentration in each sample was measured by acquisition of the UV-spectrum prior to ligand addition. Namely, the tabulated molar extinction coefficient value ε(260 nm) = 13,200 M−1cm−1 was used to derive the molarity in base pairs [58]. After this measurement, a nominal volume of 20 μL of ligand stock in either DMSO or DMF was added to 3 mL of DNA solution in PBS by means of a micro-pipette (Brand). The absorption spectrum in the 300–500 nm spectral region was acquired readily after, when re-equilibration was still negligible. The absorption at 395 nm was then used to perform ex-post correction of the fluorescence data with respect to fluctuations in the ligand concentration owing to the pipette limited precision (≈2% according to the supplier).

3.2. Spectroscopy Experiments

IR spectra were acquired by the ATR method with a Nicolet iS10 instrument, over the range 4000–600 cm−1. FTIR measurements in external reflection mode (FTIR-ER) were carried out with an Alpha Bruker FTIR portable spectrophotometer, equipped with a DTGS detector. Spectra were collected between 800 cm−1 and 375 cm−1, with 4 cm−1 resolution and 200 scans. The background was periodically acquired using a flat gold mirror. In the following, intensities are denoted as: vs = very strong, s = strong, m = medium, w = weak and vw = very weak. 1H and 13C(APT) solution NMR spectra were recorded on a Bruker Avance I 400 MHz spectrometer. 1H and 13C data are reported as follows: chemical shifts (in ppm and referenced to internal TMS), integration, multiplicity (s = singlet, d = doublet, t = triplet, q = quartet, m = multiplet), and coupling constants (in Hz). Deuterated solvent for NMR measurements, CD2Cl2, was used as received from Eurisotope. Fluorescence spectra were acquired on a PTI Fluorescence Master System fluorimeter. The spectra were automatically corrected with respect to the lamp spectral radiance and detector quantum efficiency by exploiting a feature of the acquisition software, Felix 2000. The values of fluorescence quantum yield were assessed by comparison to a tabulated standard, namely dimethyl-POPOP dissolved in cyclohexane, Φfluo = 0.95 [65], and were corrected with respect to solvent refractive index. HRMS spectra were recorded on MALDI Tof-Tof Autoflex III instrument. Elemental composition analyses were performed with a Perkin Elmer CHN Analyser 2400 Series II instrument. TGA and DSC were performed simultaneously with a Netzsch STA 409 PC Luxx instrument (temp. range RT-600 °C, rate of 10 °C min−1, N2 atmosphere). Gas chromatography-mass spectrometry. UV-Vis absorption spectra were recorded by means of a Perkin Elmer Lambda 2 spectrophotometer.

3.3. Powder X-ray Diffraction

Powder X-ray diffraction qualitative measurements were carried out in the 3–35° 2θ range with steps of 0.02° and time per step of 1 s using a Bruker AXS D8 Advance vertical-scan θ:θ diffractometer, equipped with a sealed X-ray tube (Cu Kα, λ = 1.5418 Å), a Bruker Lynxeye linear position-sensitive detector, a Ni filter in the diffracted beam and the following optical components: primary beam Soller slits (2.5°), fixed divergence slit (0.5°), antiscatter slit (8 mm). The generator operated at 40 kV and 40 mA. Powdered samples (~50 mg) of 1 were deposited in the cavity of an aluminum sample-holder 0.2 mm deep. All the samples used for the spectroscopic characterization were preliminary checked by elemental analysis and PXRD.

3.4. Synthesis of 1-methyl-5-methoxyindole

This compound was synthetized according to the procedure reported in the literature [66].

3.5. Synthesis of BMIP

This compound was synthetized according to the procedure reported in the literature [38].

3.6. Synthesis of [Zn2(µ-O)2(BMIP)2]

In a Schlenk tube BMIP (100 mg, 0.257 mmol, 1.1 eq.) was mixed with 2-methoxyethanol (5 mL) and heated to 90 °C to allow complete dissolution while stirring. Zn(ClO4)2·6H2O (86.9 mg, 0.233 mmol, 1 eq.) was added and the solution turned to a transparent dark red color. Triethylamine (1 mL) was slowly added dropwise: modest precipitation of a dark yellow solid was noted. The reaction mixture was then vigorously stirred and refluxed for 6 h, then slowly allowed to cool to room temperature. The crude product was filtered on a glass filter funnel and subsequently washed with 2-methoxyethanol, distilled water and methanol. The isolated yellow solid was transferred into a vial and dried under vacuum at 120 °C for 3 h.
1H-NMR(CD2Cl2), δ(ppm): 7.98 (diketo, s, 4H); 7.73 (diketo, d, 4H, 4J = 2.35 Hz); 7.70 (enol, s, 4H); 7.68 (enol, d, 4H, 4J = 2.34 Hz); 7.22 (enol, d, 4H, 3J = 8.84 Hz); 7.16 (diketo, d, 4H, 3J = 8.85 Hz); 6.88 (enol, d, 4H, 4J = 2.34 Hz, 3J = 8.85 Hz); 6.82 (diketo, d, 4H, 4J = 2.34 Hz, 3J = 8.85 Hz); 6.40 (enol, s, 2H); 4.19 (diketo, s, 4H); 3.83 (enol, s, 12H), 3.76 (diketo, s, 12H); 3.75 (diketo, s, 12H). 13C-NMR(CD2Cl2), δ(ppm): 188.0 (CO); 156.6 (C); 138.1 (CH); 132.9 (C), 132.5 (C); 127.3 (C); 113.4 (CH); 110.6 (CH); 10.6 (CH); 55.6 (OCH3); 55.3 (CH2); 33.7 (NCH3). IR (ATR) ṽ(cm−1): 3010 (vw); 2927 (vw); 2832 (vw); 1580 (w); 1520 (vs); 1480 v(s); 1407, (s); 1379 (s); 1362 (s); 1290 (m); 1267 (m); 1212 (vs); 1142 (m); 1097 (vs);974 (m); 896 (m); 859(m); 801 (s); 773 (vs); 695 (vs); 507 (m). HMRS-(TOF-ESI): m/z calcd. for C46H44N4O10Zn2Na: 966.6696 [M + Na]+; found: 966.6675 [M + Na]+. Elem. Anal. Calcd. for C46H44N4O10Zn2 (FW = 943.68 g/mol): C = 58.55%, H = 4.70%, N = 5.94%; found: C = 59.18%, H = 4.95%, N = 6.24%.

3.7. Synthesis of [Zn2(µ-O)2(BMIP)2(DMSO)]—Direct Method

In a Schlenk tube, BMIP (101.5 mg, 0.26 mmol, 1.1 eq.) was mixed with DMSO (2 mL) and heated to 40 °C to allow complete dissolution while stirring. Zn(ClO4)2·6H2O (88.07 mg, 0.236 mmol, 1 eq.) was added and the solution turned to a transparent dark orange color. Triethylamine (1 mL) was slowly added dropwise: modest precipitation of a light-yellow solid was noted. The reaction mixture was then vigorously stirred and refluxed for 4 h, then slowly allowed to cool to room temperature. The crude product was filtered on a glass filter funnel and subsequently washed with DMSO, distilled water and methanol in the end. The isolated yellow solid was transferred into a vial and dried under vacuum at 90 °C for 3 h.

3.8. Synthesis of [Zn2(µ-O)2(BMIP)2(DMSO)]—Indirect Method

In a 10 mL vial [Zn2(µ-O)2(BMIP)2] (20 mg, 0.02 mmol) was dissolved in DMSO (1.0 mL) and stirred for 12 h at room temperature. A yellow precipitate formed: it was filtered on a small Hirsch filter funnel and washed with diethyl ether (5 × 5 mL). The isolated yellow solid was transferred into a vial and dried under vacuum at 90 °C for 3 h.
1H-NMR(CD2Cl2), δ(ppm): 8.00 (diketo, s, 4H); 7.85 (diketo, d, 4H, 5J = 2.35 Hz); 7.81 (enol, s, 4H); 7.80 (enol, d, 4H, 5J = 2.54 Hz); 7.33 (enol, d, 4H, 3J = 8.90 Hz); 7.27 (diketo, d, 4H, 3J = 8.85 Hz); 6.99 (enol, dd, 4H, 5J = 2.34 Hz, 3J = 8.85 Hz); 6.94 (diketo, dd, 4H, 5J = 2.34 Hz, 3J = 8.85 Hz); 6.69 (enol, s, 2H); 4.31 (diketo, s, 4H); 3.87 (enol, s, 12H), 3.85 (diketo, s, 12H); 2.58 (DMSO, s, 6H). IR (ATR) ṽ(cm−1): 3010 (vw); 2927 (vw); 2832 (vw); 1580 (w); 1520 (vs); 1475 v(s); 1408, (s); 1382 (s); 1365 (vs); 1293 (s); 1267 (s); 1208 (vs); 1126 (vs); 1108 (s); 1095 (vs); 1131 (m); 1008 (m); 970 (m); 963 (m); 894 (m); 860 (m); 808 (vs); 692 (vs); 510 (m); 434 (m). Elem. Anal. Calcd. for C48H50N4O11Zn2 (FW = 1021.81 g/mol): C =56.42%, H = 4.93%, N = 5.48%; found: C = 56.05%, H = 5.01%, N = 5.84%. The IR spectrum is reported in Supplementary Materials Figure S13.

3.9. Synthesis of [Zn2(µ-O)2(BMIP)2(NMI)]

In a 10 mL vial [Zn2(µ-O)2(BMIP)2] (20 mg, 0.02 mmol) was dissolved in 1-methylimidazole (1.0 mL) and stirred for 12 h at room temperature. A yellow precipitate formed: it was filtered on a small Hirsch filter funnel and washed with diethyl ether (5 × 5 mL). The isolated yellow solid was transferred into a vial and dried under vacuum at 100 °C for 4 h.

3.10. Synthesis of [Zn2(µ-O)2(BMIP)2(NMI)]—Ligand Exchange

In a 10 mL Schlenk tube [Zn2(µ-O)2(BMIP)2(DMSO)] (51.7 mg, 0.05 mmol) was dissolved in CH2Cl2 (4 mL) and then 1-methylimidazole (400 µL) was added. The solution was stirred for 12 hrs at room temperature. A yellow precipitate formed: it was filtered on a small Hirsch filter funnel and washed with diethyl ether (5 × 5 mL). The isolated yellow solid was transferred into a vial and dried under vacuum at 100 °C for 4 h.
1H-NMR(CD2Cl2), δ(ppm): 8.10 (diketo, s, 4H); 7.85 (diketo, d, 4H, 5J = 2.35 Hz); 7.81 (enol, s, 4H); 7.80 (enol, d, 4H, 5J = 2.54 Hz); 7.56 (NMI, sb, 1H); 7.34 (enol, d, 4H, 3J = 8.88 Hz); 7.28 (diketo, d, 4H, 3J = 8.89 Hz); 7.07 (NMI, sb, 1H); 6.99 (enol, dd, 4H, 5J = 2.50 Hz, 3J = 8.89 Hz); 6.95 (NMI, sb, 1H); 6.94 (diketo, dd, 4H, 5J = 2.35 Hz, 3J = 8.88 Hz); 6.51 (enol, s, 2H); 4.31 (diketo, s, 4H); 3.95 (enol, s, 12H); 3.88 (enol, s, 12H); 3.87 (enol, s, 24H), 3.71 (NMI, s, 3H). IR (ATR) ṽ(cm−1): 2992 (vw); 2932 (w); 2829 (w); 1580 (w); 1520 (vs); 1474 (vs); 1422, (m); 1418 (m); 1408 (s); 1385 (m); 1364 (s); 1211 (vs); 1095 (s); 1034 (m); 973 (m); 1131 (m); 948 (w); 842 (w); 771 (s); 694 (s); 860 (m); 518 (m). Elem. Anal. Calcd. for C50H50N6O10Zn2 (FW = 1025.78 g/mol): C = 58.54%, H = 4.91%, N = 8.19%; found: C = 59.01%, H = 4.95%, N = 8.30%. The IR spectrum is reported in Supplementary Materials Figure S14.

4. Conclusions

[Zn2(µ-O)2(BMIP)2] (BMIP = 1,3-bis(5-methoxy-1-methyl-1H-indol-3-yl)propane-1,3-dione), 1, a novel, highly stable zinc(II) µ-oxo-bridged dimeric complex, was synthesized in quantitative yield according to original procedures. Its complex keto-enolic tautomerism was elucidated by combining NMR, IR and UV-Vis spectroscopy. The ability of the zinc(II) ion to change coordination number in the presence of highly electrophilic moieties when caged within the ligand dimer was unravelled, and the coordination with the organic solvent DMSO and with the base scaffold NMI was studied in detail. Finally, high affinity of the compound for DNA in pseudo-physiologic environment was demonstrated by means of fluorescence spectroscopy. The chemico-physical parameters characterizing the binding were estimated by fitting the binding isotherms according to the independent binding site model. In conclusion, 1 exhibits the essential properties to be considered as a starting scaffold compound for the development of a novel family of Zn-based DNA-targeting metallodrugs. Further efforts should be devoted to improve water solubility of these drug substances, which is actually very poor, in order to increase their bioavailability. Presently, attempts in this sense are being undertaken in our laboratories. Namely, we are adopting the strategy of modifying the substitutions on the nitrogen atoms of the indole rings of the ligand inserting polar groups. Other modifications will be explored on the benzene rings.

Supplementary Materials

The following materials are available online at https://www.mdpi.com/article/10.3390/ph14080760/s1, Figure S1: 1H-NMR spectrum of 1, Figure S2: 13C-NMR spectrum of 1, Figure S3: IR spectrum of 1, Figure S4: Fluorescence excitation spectra of 1 in selected solvents, Figure S5: Reconstructed fluorescence emission spectra of the diketo tautomers of 1 in selected solvents, Figure S6: Absorption and fluorescence spectra of 1 in water and bound to DNA, Figure S7: PRXD pattern, Figure S8: 1H-NMR spectrum of 2, Figure S9: DSC/TGA trace of 2, Figure S10: DSC/TGA trace of 1, Figure S11: 1H-NMR spectrum of 3, Figure S12: DSC/TGA trace of 3, Figure S13: IR spectrum of 2, Figure S14: IR spectrum of 3.

Author Contributions

Conceptualization, A.M., L.N. and A.P.; methodology, A.M., L.N. and A.P.; formal analysis, A.M., S.G., L.N. and G.V.; investigation, all authors; resources, A.M. and A.P.; data curation, A.M., S.G., L.N. and A.P.; writing—original draft preparation, A.M., L.S., F.V. and L.N.; writing—review and editing, all authors; supervision, A.M., L.N. and A.P.; project administration, A.M. and A.P.; funding acquisition, A.M. and A.P. All authors have read and agreed to the published version of the manuscript.

Funding

This research received no external funding.

Institutional Review Board Statement

Not applicable.

Informed Consent Statement

Not applicable.

Data Availability Statement

Data is contained within the article and supplementary material.

Acknowledgments

Giovanni Palmisano and Stefano Tollari are gratefully acknowledged for fruitful discussions. We acknowledge Cristina Corti for low frequency IR acquisitions.

Conflicts of Interest

The authors declare no conflict of interest.

References

  1. Rosenberg, B.; Van Camp, L.; Krigas, T. Inhibition of cell division in Escherichia coli by electrolysis products from a platinum electrode. Nature 1965, 208, 698–699. [Google Scholar] [CrossRef]
  2. Anthony, E.J.; Bolitho, E.M.; Bridgewater, H.E.; Carter, O.W.; Donnelly, J.M.; Imberti, C.; Lant, E.C.; Lermyte, F.; Needham, R.J.; Palau, M.; et al. Metallodrugs are unique: Opportunities and challenges of discovery and development. Chem. Sci. 2020, 11, 12888–12917. [Google Scholar] [CrossRef]
  3. Hanif, M.; Hartinger, C.G. Anticancer metallodrugs: Where is the next cisplatin? Future Med. Chem. 2018, 10, 615–617. [Google Scholar] [CrossRef] [PubMed]
  4. Contel, M. Unconventional anticancer metallodrugs and strategies to improve their pharmacological profile. Inorganics 2019, 7, 88. [Google Scholar] [CrossRef] [Green Version]
  5. Komeda, S.; Casini, A. Next-generation anticancer metallodrugs. Curr. Top. Med. Chem. 2012, 12, 219–235. [Google Scholar] [CrossRef] [PubMed]
  6. Kljun, J.; Turel, I. β-Diketones as scaffolds for anticancer drug design-from organic building blocks to natural products and metallodrug components. Eur. J. Inorg. Chem. 2017, 2017, 1655–1666. [Google Scholar] [CrossRef] [Green Version]
  7. Pettinari, R.; Marchetti, F.; Di Nicola, C.; Pettinari, C. Half-sandwich metal complexes with β-Diketone-like ligands and their anticancer activity. Eur. J. Inorg. Chem. 2018, 2018, 3521–3536. [Google Scholar] [CrossRef] [Green Version]
  8. Shakeri, A.; Panahi, Y.; Johnston, T.P.; Sahebkar, A. Biological properties of metal complexes of curcumin. BioFactors 2019, 45, 304–317. [Google Scholar] [CrossRef]
  9. Wilson, J.J.; Lippard, S.J. In vitro anticancer activity of cis-diammineplatinum(II) complexes with β-Diketonate leaving group ligands. J. Med. Chem. 2012, 55, 5326–5336. [Google Scholar] [CrossRef] [PubMed] [Green Version]
  10. Schilling, T.; Keppler, K.B.; Heim, M.E.; Niebch, G.; Dietzfelbinger, H.; Rastetter, J.; Hanauske, A.R. Clinical phase I and pharmacokinetic trial of the new titanium complex budotitane. Investig. New Drugs 1995, 13, 327–332. [Google Scholar] [CrossRef]
  11. Seršen, S.; Kljun, J.; Kryeziu, K.; Panchuk, R.; Alte, B.; Körner, W.; Heffeter, P.; Berger, W.; Turel, I. Structure-related mode-of-action differences of anticancer organoruthenium complexes with β-Diketonates. J. Med. Chem. 2015, 58, 3984–3996. [Google Scholar] [CrossRef]
  12. Sheikh, J.; Juneja, H.; Ingle, V.; Ali, P.; Ben Hadda, T. Synthesis and in vitro biology of Co(II), Ni(II), Cu(II) and Zinc(II) complexes of functionalized beta-diketone bearing energy buried potential antibacterial and antiviral O,O pharmacophore sites. J. Saudi Chem. Soc. 2013, 17, 269–276. [Google Scholar] [CrossRef] [Green Version]
  13. dos Santos Portas, A.; Miguel, D.C.; Yokoyama-Yasunaka, J.K.; Uliana, S.R.B.; Espósito, B.P. Increasing the activity of copper(II) complexes against Leishmania through lipophilicity and pro-oxidant ability. J. Biol. Inorg. Chem. 2012, 17, 107–112. [Google Scholar] [CrossRef] [PubMed]
  14. Bravo-Gómez, M.E.; Campero-Peredo, C.; García-Conde, D.; Mosqueira-Santillán, M.J.; Serment-Guerrero, J.; Ruiz-Azuara, L. DNA-binding mode of antitumoral copper compounds (Casiopeinas®) and analysis of its biological meaning. Polyhedron 2015, 102, 530–538. [Google Scholar] [CrossRef]
  15. Deepthi, T.V.; Venugopalan, P. Synthesis, characterization and biological studies on NiII and CuII complexes of two novel α,β-unsaturated 1,3-diketones related to curcuminoids. Inorg. Chim. Acta 2016, 450, 243–250. [Google Scholar] [CrossRef]
  16. Sousa, L.M.; Souza, W.A.; Paixão, D.A.; Fazzi, R.B.; Tezuka, D.Y.; Lopes, C.D.; Carneiro, Z.A.; Moreira, M.B.; Pivatto, M.; Netto, A.V.G.; et al. DNA binding, cleavage, apoptosis and cytotoxicity studies of three heteroleptic nickel complexes bearing β-diketones. Inorg. Chim. Acta 2020, 511, 119824. [Google Scholar] [CrossRef]
  17. Inamdar, P.R.; Sheela, A. Exploration of DNA binding mode, chemical nuclease, cytotoxic and apoptotic potentials of diketone based oxovanadium(IV) complexes. Int. J. Biol. Macromol. 2015, 76, 269–278. [Google Scholar] [CrossRef]
  18. Kolenko, V.; Teper, E.; Kutikov, A.; Uzzo, R. Zinc and zinc transporters in prostate carcinogenesis. Nat. Rev. Urol. 2013, 10, 219–226. [Google Scholar] [CrossRef] [PubMed] [Green Version]
  19. Tapiero, H.; Tew, K.D. Trace elements in human physiology and pathology: Zinc and metallothioneins. Biomed. Pharmacother. 2003, 57, 399–411. [Google Scholar] [CrossRef]
  20. Cuajungco, M.P.; Lees, G.J. Zinc Metabolism in the Brain: Relevance to Human Neurodegenerative Disorders. J. Neurobiol. Dis. 1997, 4, 137–169. [Google Scholar] [CrossRef] [Green Version]
  21. Krebs, N.F.; Hambidge, K.M. Zinc metabolism and homeostasis: The application of tracer techniques to human zinc physiology. BioMetals 2001, 14, 397–412. [Google Scholar] [CrossRef]
  22. Anjum, R.; Palanimuthu, D.; Kalinowski, D.S.; Lewis, W.; Park, K.C.; Kovacevic, Z.; Khan, I.U.; Richardson, D.R. Synthesis, characterization, and in vitro anticancer activity of copper and zinc bis (thiosemicarbazone) complexes. Inorg. Chem. 2019, 58, 13709–13723. [Google Scholar] [CrossRef] [PubMed]
  23. Wang, H.; Shen, R.; Wu, J.; Tang, N. Antitumor activity and DNA-binding investigations of the Zn (II) and Cu (II) complexes with isoeuxanthone. Chem. Pharm. Bull. 2009, 57, 814–818. [Google Scholar] [CrossRef] [PubMed] [Green Version]
  24. Liu, Y.C.; Wei, J.H.; Chen, Z.F.; Liu, M.; Gu, Y.Q.; Bin Huang, K.; Li, Z.Q.; Liang, H. The Antitumor Activity of Zinc(II) and Copper(II) Complexes with 5,7-Dihalo-Substituted-8-Quinolinoline. Eur. J. Med. Chem. 2013, 69, 554–563. [Google Scholar] [CrossRef] [PubMed]
  25. Tarushi, A.; Psomas, G.; Raptopoulou, C.P.; Kessissoglou, D.P. Zinc complexes of the antibacterial drug oxolinic acid: Structure and DNA-binding properties. J. Inorg. Biochem. 2009, 103, 898–905. [Google Scholar] [CrossRef]
  26. Maheswari, P.; Barends, S.; Özalp-Yaman, S.; De Hoog, P.; Casellas, H.; Teat, S.; Massera, C.; Lutz, M.; Spek, A.; Van Wezel, G.P.; et al. Unique ligand-based oxidative DNA cleavage by zinc (II) complexes of Hpyramol and Hpyrimol. Chem. A Eur. J. 2007, 13, 5213–5222. [Google Scholar] [CrossRef] [Green Version]
  27. Dołega, A.; Farmas, A.; Baranowska, K.; Herman, A. Novel zinc complexes with acetyloacetonate, imidazole and thiolate ligands: Crystal structure of a zinc complex of relevance to farnesyl transferase. Inorg. Chem. Commun. 2009, 12, 823–827. [Google Scholar] [CrossRef]
  28. Malekshah, R.E.; Salehi, M.; Kubicki, M.; Khaleghian, A. Crystal structure, molecular docking, and biological activity of the zinc complexes with 2-thenoyltrifluoroacetone and N-donor heterocyclic ligands. J. Mol. Struct. 2017, 1150, 155–165. [Google Scholar] [CrossRef]
  29. Mendiguchia, B.S.; Aiello, I.; Crispini, A. Zn (II) and Cu (II) complexes containing bioactive O, O-chelated ligands: Homoleptic and heteroleptic metal-based biomolecules. Dalt. Trans. 2015, 44, 9321–9334. [Google Scholar] [CrossRef] [PubMed]
  30. Qin, L.-Q.; Liang, C.-J.; Zhou, Z.; Qin, P.Q.; Wei, Z.-Z.; Tan, M.-X.; Liang, H. Mitochondria-localizing curcumin-cryptolepine Zn (II) complexes and their antitumor activity. Bioorg. Med. Chem. 2021, 30, 115948. [Google Scholar] [CrossRef]
  31. Banerjee, S.; Chakravarty, A.R. Metal complexes of curcumin for cellular imaging, targeting, and photoinduced anticancer activity. Acc. Chem. Res. 2015, 48, 2075–2083. [Google Scholar] [CrossRef]
  32. Bosi, A.; Banfi, D.; Bistoletti, M.; Giaroni, C.; Baj, A. Tryptophan metabolites along the microbiota-gut-brain axis: An interkingdom communication system influencing the gut in health and disease. Int. J. Tryptophan Res. 2020, 13, 1–25. [Google Scholar] [CrossRef]
  33. Sharma, V.; Kumar, P.; Pathak, D. Biological importance of the indole nucleus in recent years: A comprehensive review. J. Heterocycl. Chem. 2010, 47, 491–502. [Google Scholar] [CrossRef]
  34. Kaushik, N.K.; Kaushik, N.; Attri, P.; Kumar, N.; Kim, C.H.; Verma, A.K.; Choi, E.H. Biomedical importance of indoles. Molecules 2013, 18, 6620–6662. [Google Scholar] [CrossRef]
  35. Han, Y.; Dong, W.; Guo, Q.; Li, X.; Huang, L. The importance of indole and azaindole scaffold in the development of antitumor agents. Eur. J. Med. Chem. 2020, 203, 112506. [Google Scholar] [CrossRef]
  36. Chen, F.Y.; Li, X.; Zhu, H.P.; Huang, W. Regulation of the Ras-Related Signaling Pathway by Small Molecules Containing an Indole Core Scaffold: A Potential Antitumor Therapy. Front. Pharmacol. 2020, 11, 280. [Google Scholar] [CrossRef] [PubMed] [Green Version]
  37. Ma, J.; Bao, G.; Wang, L.; Li, W.; Xu, B.; Du, B.; Lu, J.; Zhai, X.; Gong, P. Design, synthesis, biological evaluation and preliminary mechanism study of novel benzothiazole derivatives bearing indole-based moiety as potent antitumor agents. Eur. J. Med. Chem. 2015, 96, 173–186. [Google Scholar] [CrossRef] [Green Version]
  38. Diana, P.; Carbone, A.; Barraja, P.; Kelter, G.; Fiebig, H.H.; Cirrincione, G. Synthesis and antitumor activity of 2, 5-bis (3′-indolyl)-furans and 3, 5-bis (3′-indolyl)-isoxazoles, nortopsentin analogues. Bioorganic Med. Chem. 2010, 18, 4524–4529. [Google Scholar] [CrossRef] [PubMed]
  39. Ieronimo, G.; Palmisano, G.; Maspero, A.; Marzorati, A.; Scapinello, L.; Masciocchi, N.; Cravotto, G.; Barge, A.; Simonetti, M.; Ameta, K.L.; et al. A novel synthesis of N-hydroxy-3-aroylindoles and 3-aroylindoles. Org. Biomol. Chem. 2018, 16, 6853–6859. [Google Scholar] [CrossRef] [PubMed]
  40. Scapinello, L.; Maspero, A.; Tollari, S.; Palmisano, G.; Nicholas, K.M.; Penoni, A. A Direct, Regioselective and Atom-Economical Synthesis of 3-Aroyl-N-hydroxy-5-nitroindoles by Cycloaddition of 4-Nitronitrosobenzene with Alkynones. J. Vis. Exp. JoVE 2020, 155, e60201. [Google Scholar] [CrossRef] [PubMed]
  41. Palmisano, G.; Penoni, A.; Sisti, M.; Tibiletti, F.; Tollari, S.; Nicholas, K.M. Synthesis of indole derivatives with biological activity by reactions between unsaturated hydrocarbons and N-aromatic precursors. Curr. Org. Chem. 2010, 14, 2409–2441. [Google Scholar] [CrossRef]
  42. Cramer, R.E.; Chudyk, M.A. Acetylacetone complex of zinc perchlorate. Inorg. Chem. 1973, 12, 1193–1195. [Google Scholar] [CrossRef]
  43. Nakamura, Y.; Isobe, K.; Morita, H.; Yamazaki, S.; Kawaguchi, S. Metal complexes containing acetylacetone as a neutral ligand. Inorg. Chem. 1972, 11, 1573–1578. [Google Scholar] [CrossRef]
  44. Kawaguchi, S. Variety in the coordination modes of β-dicarbonyl compounds in metal complexes. Coord. Chem. Rev. 1986, 70, 51–84. [Google Scholar] [CrossRef]
  45. Prochowicz, D.; Sokołowski, K.; Lewiński, J. Zinc hydroxides and oxides supported by organic ligands: Synthesis and structural diversity. Coord. Chem. Rev. 2014, 270–271, 112–126. [Google Scholar] [CrossRef]
  46. Ruqia, B.; Nam, K.M.; Lee, H.; Lee, G.; Choi, S.I. Facile synthesis of highly crystalline ZnO nanorods with controlled aspect ratios and their optical properties. CrystEngComm 2017, 19, 1454–1458. [Google Scholar] [CrossRef]
  47. Adati, R.D.; Lima, S.A.M.; Davolos, M.R.; Jafelicci, M. A new β-diketone complex with high color purity. J. Alloy. Compd. 2006, 418, 222–225. [Google Scholar] [CrossRef]
  48. Nakamoto, K. Infrared and Raman Spectra of Inorganic and Coordination Compounds, 3rd ed.; Wiley Interscience: New York, NY, USA, 1969. [Google Scholar]
  49. Nardo, L.; Maspero, A.; Selva, M.; Bondani, M.; Palmisano, G.; Ferrari, E.; Saladini, M. Excited-state dynamics of bis-dehydroxycourcumin carboxylic acid, a water-soluble derivative of the photosensitizer curcumin. J. Phys. Chem. A 2012, 116, 9321–9330. [Google Scholar] [CrossRef] [PubMed]
  50. Nardo, L.; Maspero, A.; Penoni, A.; Palmisano, G.; Ferrari, E.; Saladini, M. Excited state dynamics of bis-dehydroxycurcumin tert-butyl ester, a diketo-shifted derivative of the photosensitizer curcumin. PLoS ONE 2017, 12, e0175225. [Google Scholar] [CrossRef] [Green Version]
  51. Ferrari, E.; Pignedoli, F.; Imbrano, C.; Marverti, G.; Basile, V.; Venturi, E.; Saladini, M. Newly synthesized curcumin derivatives: Crosstalk between chemico-physical properties and biological activity. J. Med. Chem. 2011, 54, 8066–8077. [Google Scholar] [CrossRef]
  52. Chignell, C.F.; Bilskj, P.; Reszka, K.J.; Motten, A.G.; Sik, R.H.; Dahl, T.A. Spectral and photochemical properties of curcumin. Photochem. Photobiol. 1994, 59, 295–302. [Google Scholar] [CrossRef]
  53. Nardo, L.; Paderno, R.; Andreoni, A.; Masson, M.; Haukvik, T.; Tonnesen, H.H. Role of H-bond formation in the photoreactivity of curcumin. Spectroscopy 2008, 22, 187–198. [Google Scholar] [CrossRef]
  54. Nardo, L.; Andreoni, A.; Bondani, M.; Masson, M.; Tonnesen, H.H. Studies on curcumin and curcuminoids. XXXIV. Photophysical properties of a symmetrical, non-substituted curcumin analogue. J. Photochem. Photobiol. B Biol. 2009, 97, 77–86. [Google Scholar] [CrossRef]
  55. Nardo, L.; Andreoni, A.; Masson, M.; Tonnesen, H.H. Photophysical properties of bis-demethoxy-curcumin. J. Fluoresc. 2011, 21, 627–635. [Google Scholar] [CrossRef] [PubMed] [Green Version]
  56. Nardo, L.; Andreoni, A.; Bondani, M.; Masson, M.; Haukvik, T.; Tonnesen, H.H. Photophysical properties of dimethoxycurcumin and bis-dehydroxycurcumin. J. Fluoresc. 2012, 22, 597–608. [Google Scholar] [CrossRef] [PubMed]
  57. Lamperti, M.; Maspero, A.; Tønnesen, H.H.; Bondani, M.; Nardo, L. Elucidation of the relationships between H-bonding patterns and excited state dynamics in Cyclovalone. Molecules 2014, 19, 13282–13304. [Google Scholar] [CrossRef] [Green Version]
  58. Nardo, L.; Bondani, M.; Andreoni, A. Discrimination of the binding-mode of DNA-ligands by single photon timing. Spectroscopy 2009, 23, 11–28. [Google Scholar] [CrossRef]
  59. Giani, A.M.; Lamperti, M.; Maspero, A.; Cimino, A.; Negri, R.; Giovenzana, G.B.; Palmisano, G.; Nardo, L. Fluorescence studies on 2-(het)aryl perimidine derivatives. J. Lumin. 2016, 179, 384–392. [Google Scholar] [CrossRef]
  60. Franks, M.; Gadzhieva, A.; Ghandhi, L.; Murrell, D.; Blake, A.J.; Davies, E.S.; Lewis, W.; Moro, F.; McMaster, J.; Schröder, M. Five coordinate M (II)-diphenolate [M= Zn (II), Ni (II), and Cu (II)] Schiff base complexes exhibiting metal-and ligand-based redox chemistry. Inorg. Chem. 2013, 52, 660–670. [Google Scholar] [CrossRef]
  61. Song, X.W.; Gao, X.J.; Liu, H.X.; Chen, H.; Chen, C.N. Synthesis and characterization of a supramolecular assembly based on a pyridyl-functionalized [FeFe]-hydrogenase mimic and zinc tetraphenylporphyrin. Inorg. Chem. Commun. 2016, 70, 1–3. [Google Scholar] [CrossRef]
  62. Che, W.; Yu, T.; Jin, D.; Ren, X.; Zhu, D.; Su, Z.; Bryce, M.R. A simple oxazoline as fluorescent sensor for Zn2+ in aqueous media. Inorg. Chem. Commun. 2016, 69, 89–93. [Google Scholar] [CrossRef]
  63. Liu, Z.-Q.; Ng, Y.M.; Tiong, P.J.; Abu Talip, R.A.; Jasin, N.; Jong, V.Y.M.; Tay, M.G. Five-Coordinate Zinc(II) Complex: Synthesis, Characterization, Molecular Structure, and Antibacterial Activities of Bis-[(E)-2-hydroxy-N’-{1-(4-methoxyphenyl)ethylidene}benzohydrazido]dimethylsulfoxidezinc(II) Complex. Int. J. Inorg. Chem. 2017, 2017, 7520640. [Google Scholar] [CrossRef] [Green Version]
  64. Evans, I.P.; Spencer, A.; Wilkinson, G. Dichlorotetrakis(dimethyl sulphoxide)ruthenium(II) and its use as a source material for some new ruthenium(II) complexes. J. Chem. Soc. Dalton Trans. 1973, 2, 204–209. [Google Scholar] [CrossRef]
  65. Berlman, I.B. Handbook of Fluorescence Spectra of Aromatic Molecules; Academic Press: New York, NY, USA, 1971. [Google Scholar]
  66. Rochette, E.; Desrosiers, V.; Soltani, Y.; Fontaine, F.G. Isodesmic C-H Borylation: Perspectives and Proof of Concept of Transfer Borylation Catalysis. J. Am. Chem. Soc. 2019, 141, 12305–12311. [Google Scholar] [CrossRef] [PubMed]
Scheme 1. Synthesis of BMIP and [Zn2(µ-O)2(BMIP)2], 1.
Pharmaceuticals 14 00760 sch001
Scheme 2. Keto-enol tautomerism in 1.
Pharmaceuticals 14 00760 sch002
Figure 1. Zoom of the 1H-NMR spectrum of 1 on the signals used to quantify the fraction of diketo tautomer.
Pharmaceuticals 14 00760 g001
Figure 2. Absorption spectra of 1 in selected solvents.
Pharmaceuticals 14 00760 g002
Figure 3. Fluorescence emission spectral line-shapes of 1 in different solvents upon excitation at: (a) the enol, and (b) the diketo absorption peak.
Pharmaceuticals 14 00760 g003
Figure 4. (a) Selected absorption spectra during a time-lapse experiment aimed at monitoring hydration dynamics of 1 preliminarily dissolved in DMSO; (b) absorbance at selected wavelengths versus time in the same experiment. See text for details.
Pharmaceuticals 14 00760 g004
Figure 5. Fluorescence emission spectra of 1 in aqueous environment in the absence (black line) and presence (gray line) of DNA. The compound was preliminarily solubilized in DMSO. The samples were excited at 320 nm.
Pharmaceuticals 14 00760 g005
Figure 6. Binding isotherms of the binding of 1 to calf thymus DNA in 10 mM phosphate buffer. In order to dissolve the ligand in water, equal aliquots of concentrated stocks in organic solvents miscible with water were added to aqueous solutions of DNA in different concentrations. In panel (a), the organic solvent was DMSO and the final ligand concentration was 20 μM; in panel (b), DMF was used and the ligand was added to a final concentration of 15 μM. In both the experiments, the volume-to-volume concentration of organic solvent in phosphate buffer was 1:150.
Pharmaceuticals 14 00760 g006
Figure 7. IR spectra of BMIP (black lines) 1 (red lines), 2 (blue lines), and 3 (magenta lines) in (a) the 600–1700 cm−1, and (b) 380–600 cm−1 spectral ranges.
Pharmaceuticals 14 00760 g007
Scheme 3. Reversible coordination of 1 with DMSO and NMI to yield 2 and 3, respectively.
Pharmaceuticals 14 00760 sch003
Table 1. IR frequencies (cm−1) of BMIP, 1, 2 and 3.
CompoundνC–HνC–HνC=OνC–O–CνC=N NMIνC–N NMIΝρ(Me) DMSOν(S=O) DMSOνZn–OνZn–O DMSO
ligand 293916201210
13020295015201260 507
23020295015201260 1031961510435
3302029501520126014211285 518
Table 2. UV-Vis absorption properties of 1 in different solvents: peak wavelength of the first absorption band, λabs,1, and of the second absorption band, λabs,2; relative intensity of the first absorption peak, f1; fraction of diketo tautomers according to NMR, fDiketo,NMR; average molar extinction coefficient, <ε> (see text for details).
Solventλabs,1 (nm)λabs,2 (nm)f1fDiketo,NMR<ε> (M−1cm−1)
DCM313 (35,000)392 (32,900)0.790.8534,600
DMF3023920.57 44,100
DMSO309 (41,500)393 (43,000)0.450.4642,400
EtOH3113970.76 --
Table 3. Fluorescence properties of 1 in selected solvents: peak fluorescence emission wavelengths upon excitation at the enol, λemi,enol, and diketo, λemi,diketo, absorption peak; peak fluorescence excitation wavelengths with fluorescence recording at the enol emission peak, λexc,enol, and at 350 nm, λexc,diketo; fluorescence quantum yield of the enol tautomers, Φfluo,enol.
Solventλemi,enol (nm)λemi,diketo (nm) λexc,enol (nm)λexc,diketo (nm)Φfluo,enol
DCM426403326 (398)3150.06
DMF424405400 (325)280 (309)0.08
DMSO428403400, 408 (322)293, 3040.12
EtOH447413401 (325)2920.20
reconstructed by subtraction of the out-of-peak excited fluorescence of the enol tautomers, see text for detailed procedure.
Table 4. Fitting parameters obtained by interpolation of the experimental binding isotherms of Figure 6 with the independent binding site model, Equation (1).
SolventKdiss (M)n (ligands/bp)F0 (a.u.)δF (μM−1)
DMSO0.69 ± 0.320.26 ± 0.052.07 ± 0.03−0.098 ± 0.004
DMF0.87 ± 0.390.29 ± 0.051.19 ± 0.02−0.057 ± 0.005
Publisher’s Note: MDPI stays neutral with regard to jurisdictional claims in published maps and institutional affiliations.

