Impact of Link Unreliability and Asymmetry on the Quality of Connectivity in Large-scale Sensor Networks


Abstract
:
1. Introduction and Motivation
2. Related Work
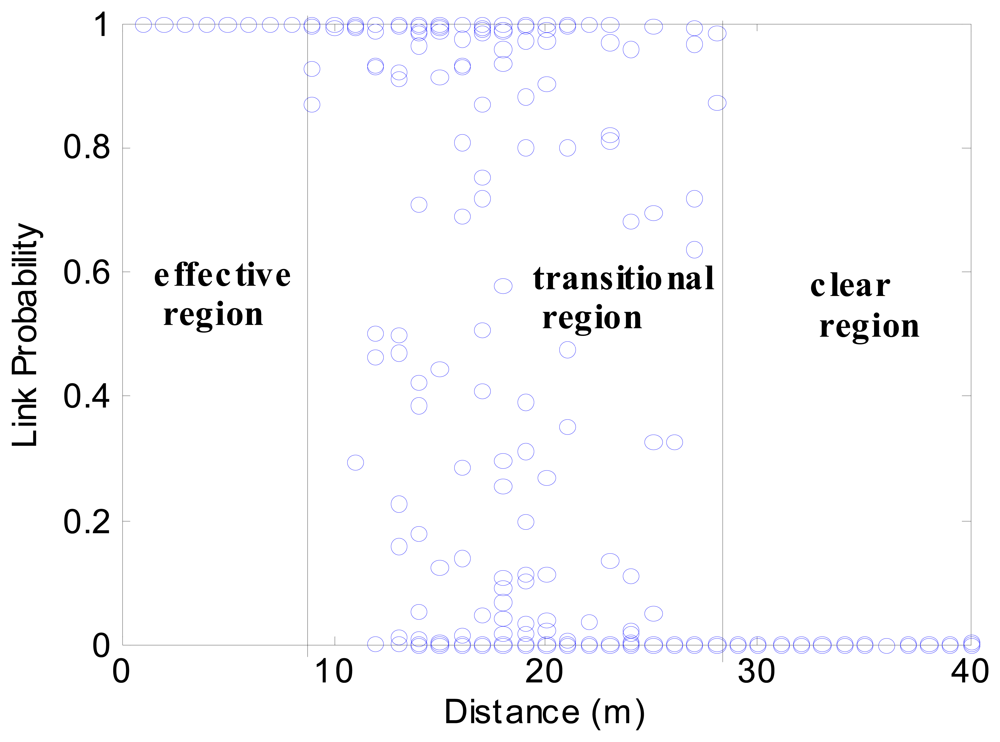
2.1. Overview of Wireless Radio Link Models
2.2. Connectivity of Wireless Networks: State of the Art
3. Network Connectivity Analysis
3.1. Node Spatial Distribution
Definition 1
- N(·, ω) is a counting measure on (X, Σ) for each ω ∈ Ω.
- N(A, ·) is the number of nodes in subarea A which follows Poisson distribution with mean λ(A):with an expected value E(N) = λ(A) = ρ(A) ‖A‖, ρ(A) and ‖A‖ are node density and size of subarea A respectively.
- If A1, A2, … are disjoint sets then N(A1), N(A2), … are independent random variables:
3.2. Node Non-Isolation Probability
Definition 2
3.3. Link Probability Analysis
Definition 3
Definition 4
4. Simulation Results and Discussion
Theorem 1
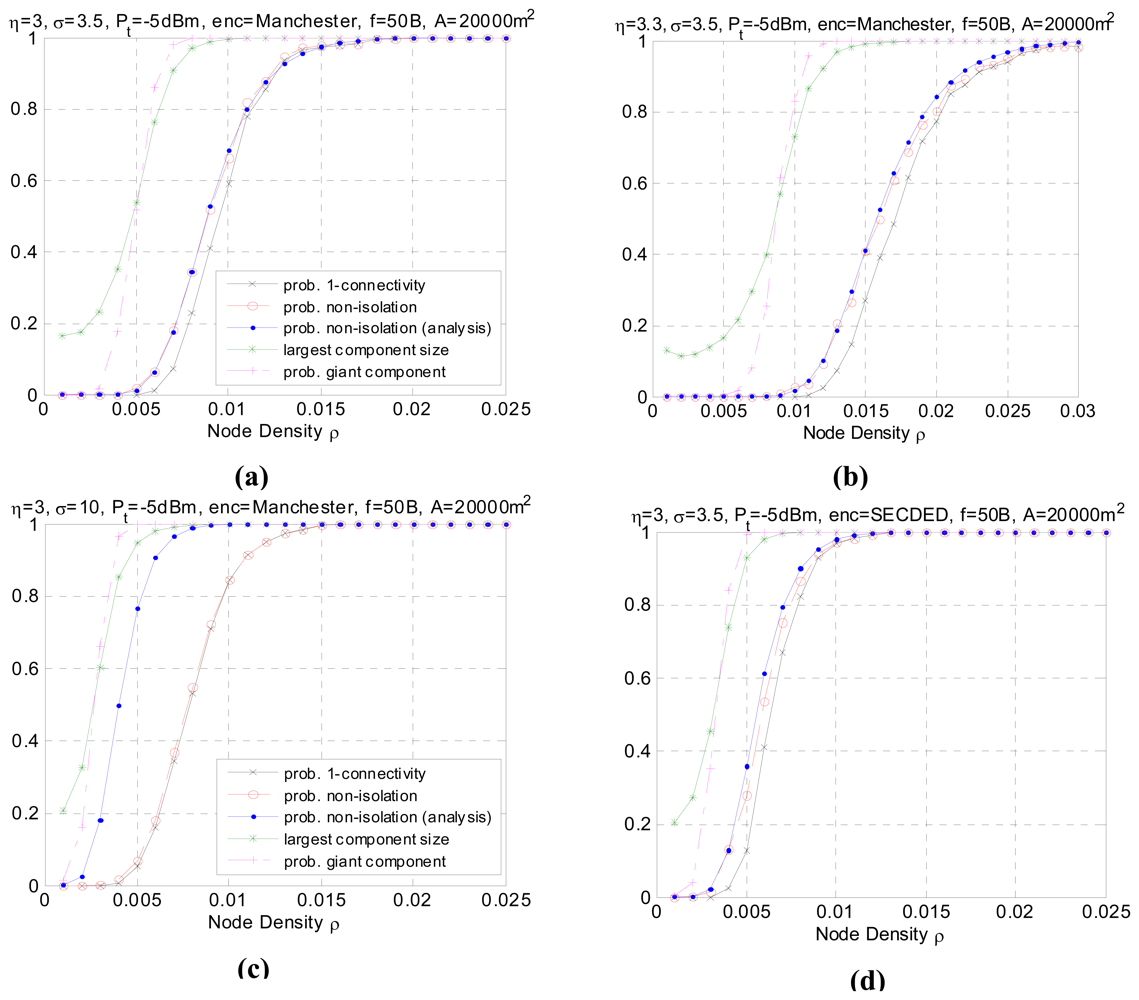
- In all simulation cases, as the node density increases, the network graph becomes denser and the transition from low connectivity to nearly full connected or appearance of giant component is quite sharp over a small range of ρ. The phenomenon consists with the results in [22] which uses the theory of continuum percolation. No matter what kind of radio link model adopted, either Boolean disk model or more realistic model with fading and shadowing, the phenomenon of phase transition exists, which gives us a tool for analyzing and determining resource efficient regime of operation for wireless sensor networks. For example, following the settings in Figure 5(a), it tells us that for the nodes with identical transmission power, distributed in an area of 20000 m2 according to homogeneous Poisson process, the node density must be higher than 0.007 to form giant component and higher than 0.0125 to reach one-connectivity. The density threshold is an energy- efficient point of operation, in that to the left of this threshold the network is disconnected with high probability, and to the right of this threshold, additional energy expenditure results in a negligible increase in the high probability of connectivity.
- In all simulation cases, the non-isolation probability serves as the upper bound for probability of one-connectivity. Generally, the difference between the two probabilities is non-negligible. However as node density increases, the two probabilities converge to 1. This result agrees with inequality (3). With respect to critical node density, this means thatFor p=90%, the critical node densities for each setting are listed in Table 1. It is observed that when the shadowing effect σ is of a large value (σ=10), the difference δ becomes very small over the whole node density range. This can be explained by the fact that as σ increases, the increase in long links and the decrease in short links have reduced the correlation between links. As a result, the geometric random graph behavior approaches generic random graph behavior and the probability of one-connectivity approaches the probability of non-isolation.
- It should be noted that, the analytical performance of non-isolation probability closely matches the real non-isolation probability in different settings except when σ is large (σ=10), as shown in Figure 5(c). This is also reflected in Table 1 with minor difference between the simulating and analytical critical density for P(Ī) except when σ=10. In some related papers [10-11], it is argued that a large value of σ helps the network to be connected because the number of added long links is larger than the number of removed short links. However, it should be note that the network also suffers severe link asymmetry as the shadowing variance increases. The analytical approach has underestimated the asymmetry problem, which leads to an overestimate of network connectivity. In practical, the analytical values have to be calibrated with certain asymmetry coefficient to match the simulated data. Besides, in practice, some realistic issue like antenna diversity, battery power difference etc. will also cause link asymmetry and is more complicated to simulate. We will leave it as future work.
- Comparing Figure 5(b) with Figure 5(a), we can see that the path loss decreases the connectivity of the network. The reason is obvious since the higher η, the faster the decay of the signal strength, resulting in a shortened transmission range. The simulated result agrees with the analytical one. Similar is Figure 5(e) and 5(g) compared with Figure 5(a). As the transmission power increases, the average transmission range also increases accordingly, thus a lower node density is sufficient to make the network connected with the same high probability, as shown in Table 1. The giant component probability shows consistent tendency.
- Figure 5(d) shows the impact of a different encoding scheme. The connectivity is better using SECDED encoding than Manchester encoding. This result is due to the error correction capabilities of SECDED, which comes at a cost of energy efficiency (encoding ratio 1:3) while Manchester does not provide error correction and the encoding ratio is 1:2. Simulated results for different encoding schemes agree with the expected analytical behavior.
- Figure 5(f) shows the connectivity performance as the packet size is doubled. It can be observed that the performance merges to 1 at a slightly higher node density. The impact of packet size on the global connectivity is not obvious compared to other parameters.
- The impact of area size ‖A‖ on the connectivity is straightforward. As the sub-area size gets larger, to reach the global connectivity requires higher node density. The quantity can be estimated via Equation (10). However, to form a giant component, the probability has not been affected by the area size ‖A‖.
5. Conclusions and Future Work
Acknowledgments
References
- Gupta, P.; Kumar, P.R. The capacity of wireless networks. IEEE Tran. Inf. Theo. 2000, 46, 388–404. [Google Scholar]
- Woo, A.; Tong, T.; Culler, D. Taming the underlying challenges of reliable multihop routing in sensor networks. Proceedings of the ACM Conference on Embedded Networked Sensor Systems(SenSys), Los Angeles, California, USA; 2003; pp. 14–27. [Google Scholar]
- Li, Y.; Chen, C.S.; Song, Y.Q.; Wang, Z.; Sun, Y. A two-hop based real-time routing protocol for wireless sensor networks. Proceedings of the IEEE International Workshop on Factory Communication Systems (WFCS), Dresden, Germany; 2008; pp. 1–10. [Google Scholar]
- Chen, C.S.; Li, Y.; Song, Y.Q. Exploring geographic routing in using k-hop information for wireless sensor networks. Proceedings of the International Conference on Communications and Networking in China (CHINACOM), Hangzhou, China; 2008; pp. 1–6. [Google Scholar]
- Gupta, P.; Kumar, P.R. Critical power for asymptotic connectivity in wireless networks. In Stochastic Analysis, Control, Optimization and Applications: A Volume in Honor of W.H. Fleming.; McEneaney, William M., Yin, G. George, Zhang, Qing., Eds.; Birkhäuser: Boston, 1998; pp. 547–566. [Google Scholar]
- Dousse, O.; Thiran, P.; Hasler, M. Connectivity in ad-hoc and hybrid networks. Proceedings of the IEEE Computer Communications (INFOCOM), Miami, USA; 2005; pp. 1079–1088. [Google Scholar]
- Bettstetter, C. On the connectivity of ad hoc networks. Comput. J. 2004, 47, 432–447. [Google Scholar]
- Xue, F.; Kumar, PR. The number of neighbors needed for connectivity of wireless networks. Wirel. Netw. 2004, 10, 169–181. [Google Scholar]
- Bettstetter, C.; Hartmann, C. Connectivity of wireless multihop networks in a shadow fading environment. Wirel. Netw. 2005, 11, 571–579. [Google Scholar]
- Hekmat, R.; Mieghem, V.P. Connectivity in wireless ad-hoc networks with a lognormal radio model. Mob. Netw. Appl. 2006, 11, 351–360. [Google Scholar]
- Miorandi, D.; Altman, E. Coverage and connectivity of ad hoc networks presence of channel randomness. Proceedings of the IEEE INFOCOM, Miami, USA; 2005; pp. 491–502. [Google Scholar]
- Mica2 datasheet. http://www.crossbow.com.
- Zuniga, M.; Krishnamachari, B. Analyzing the transitional region in low-power wireless links. the Proceedings of the IEEE Sensor and Ad Hoc Communications and Networks (SECON), Santa Clara, California, USA; 2004; pp. 517–526. [Google Scholar]
- Franceschetti, M.; Booth, L.; Bruck, J.; Cook, M.; Meester, R. Percolation in multi-hop wireless networks.; Technical Report UCB/ERL M03/18; EECS Department University of California: Berkeley, 2003. [Google Scholar]
- Cerpa, A.; Wong, JL.; Kuang, L.; Potkojak, M.; Estrin, D. Statistical Model of lossy links in wireless sensor networks. Proeedings of the IEEE /ACM Symposium on Information Processing in Sensor Networks (IPSN), Los Angeles, California, USA; 2005; pp. 81–88. [Google Scholar]
- Zhou, G.; He, T.; Krishnamurthy, S.; Stankovic, JA. Models and solutions for radio irregularity in wireless sensor networks. ACM Trans. Sens. Netw. 2003, 2, 221–262. [Google Scholar]
- Ganesan, D.; Krishnamachari, B.; Woo, A.; Culler, D.; Estrin, D.; Wicker, S. Complex behavior at scale: An experimental study of low-power wireless sensor networks. In Technical Report CSD- TR 02-0013; UCLA: Los Angeles, California, February 2002. [Google Scholar]
- Lal, D.; Manjeshwar, A.; Herrmann, F.; Uysal-Biyikoglu, E.; Keshavarzian, A. Measurement and characterization of link quality metrics in energy constrained wireless sensor networks. Proceedings of the IEEE Global Telecommunications Conference (GLOBECOM), San Francisco, USA; 2003; pp. 446–452. [Google Scholar]
- Leskovec, J.; Sarkar, P.; Guestrin, C. Modeling link qualities in a sensor network. Proceedings of the SIKDD at multi-conference IS, Ljubljana, Slovenia; 2005. [Google Scholar]
- Cheng, Y.C.; Robertazzi, T.G. Critical connectivity phenomena in multihop radio models. IEEE Trans. Commun. 1989, 37, 770–777. [Google Scholar]
- Ingmar, G.; Wolfram, K.; Rudolf, S.; Martin, G. Continuum percolation of wireless ad hoc communication networks. Stat. Mech. Appl. 2003, 325, 577–600. [Google Scholar]
- Krishnamachari, B.; Wicker, SB.; Béjar, R. Phase transition phenomena in wireless ad-hoc networks. Proceedings of IEEE GLOBECOM, San Antonio, Texas, USA; 2001; pp. 2921–2925. [Google Scholar]
- Dousse, O.; Baccelli, F.; Thiran, P. Impact of interferences on the connectivity in ad hoc networks. IEEE/ACM Trans. Netw. 2005, 13, 425–436. [Google Scholar]
- Miorandi, D.; Altman, E. Connectivity in one-dimensional ad hoc networks: a queueing theoretical approach. Wirel. Netw. 2006, 12, 573–587. [Google Scholar]
- Cavalcanti, D.; Agrawal, D.; Kelner, J.; Sadok, D. Exploiting the small-world effect to increase connectivity in wireless ad hoc networks. Proceedings of the International Conference on Telecommunications (ICT), Fortaleza, Brazil; 2004; pp. 388–393. [Google Scholar]
- Bollobás, B. Random graphs, 2nd Edition ed; Cambridge University Press: Cambridge, 2001. [Google Scholar]
- Gorce, J-M.; Zhang, R.; Parvery, H. Impact of radio links unreliability on the connectivity of wireless sensor networks. EURASIP J. Wirel. Commun. Netw. 2007. [Google Scholar] [CrossRef]
- Xia, F.; Tian, Y.-C.; Li, Y.; Sun, Y. Wireless sensor/actuator network design for mobile control applications. Sensors 2007, 7, 2157–2173. [Google Scholar]
- Dousse, O.; Tavoularis, C.; Tiran, P. Delay of intrusion detection in wireless sensor networks. Proceedings of the ACM Symposium on Mobile Ad hoc Networking and Computing (MobiHoc), Florence, Italy; 2006; pp. 155–165. [Google Scholar]
- Wang, X.; Wang, S.; Bi, D.; Ma, J. Distributed peer-to-peer target tracking in wireless sensor networks. Sensors 2007, 7, 1001–1027. [Google Scholar]
- Song, S.; Goeckel, D.; Towsley, D. Collaboration improves the connectivity of wireless networks. Proceedings of the IEEE INFOCOM, Barcelona, Spain; 2006; pp. 1–11. [Google Scholar]
- Bettstetter, C.; Gyarmati, M.; Schilcher, U. An inhomogeneous spatial node distribution and its stochastic properties. Proceedings of the ACM International Symposium on Modeling, Analysis and Simulation of Wireless and Mobile Systems (MSWiM), Chania, Greece; 2007; pp. 400–404. [Google Scholar]
- Lili, Z.; Boon-Hee, S. k-Connectivity in shadowing wireless multi-hop networks. Proceedings of the IEEE GLOBECOM, San Francisco, USA; 2006; pp. 1–4. [Google Scholar]


| Settings | ρ(P(G)=90±.05%) (m-2) simulation | ρ(P(C)=90±.05%) (m-2) simulation | ρ(P(Ī)=90±.05%) (m-2) simulation | ρ(P(Ī)=90±.05%) (m-2) analysis |
|---|---|---|---|---|
| (a) | 7.00 · 10-3 | 1.25 · 10-2 | 1.22 · 10-3 | 1.25 · 10-3 |
| (b) | 1.15 · 10-3 | 2.27 · 10-2 | 2.21 · 10-3 | 2.15 · 10-3 |
| (c) | 4.50 · 10-3 | 1.07 · 10-2 | 1.07 · 10-3 | 6.00 · 10-3 |
| (d) | 4.80 · 10-3 | 8.75 · 10-3 | 8.50 · 10-3 | 8.00 · 10-3 |
| (e) | 5.00 · 10-3 | 9.00 · 10-3 | 8.70 · 10-3 | 8.70 · 10-3 |
| (f) | 7.50 · 10-3 | 1.33 · 10-2 | 1.30 · 10-3 | 1.32 · 10-3 |
| (g) | 7.00 · 10-3 | 1.40 · 10-2 | 1.35 · 10-3 | 1.32 · 10-3 |
© 2008 by the authors; licensee Molecular Diversity Preservation International, Basel, Switzerland. This article is an open-access article distributed under the terms and conditions of the Creative Commons Attribution license (http://creativecommons.org/licenses/by/3.0/).
Share and Cite
Li, Y.; Song, Y.-Q.; Schott, R.; Wang, Z.; Sun, Y. Impact of Link Unreliability and Asymmetry on the Quality of Connectivity in Large-scale Sensor Networks. Sensors 2008, 8, 6674-6691. https://doi.org/10.3390/s8106674
Li Y, Song Y-Q, Schott R, Wang Z, Sun Y. Impact of Link Unreliability and Asymmetry on the Quality of Connectivity in Large-scale Sensor Networks. Sensors. 2008; 8(10):6674-6691. https://doi.org/10.3390/s8106674
Chicago/Turabian StyleLi, Yanjun, Ye-Qiong Song, René Schott, Zhi Wang, and Youxian Sun. 2008. "Impact of Link Unreliability and Asymmetry on the Quality of Connectivity in Large-scale Sensor Networks" Sensors 8, no. 10: 6674-6691. https://doi.org/10.3390/s8106674
APA StyleLi, Y., Song, Y.-Q., Schott, R., Wang, Z., & Sun, Y. (2008). Impact of Link Unreliability and Asymmetry on the Quality of Connectivity in Large-scale Sensor Networks. Sensors, 8(10), 6674-6691. https://doi.org/10.3390/s8106674