Abstract
Heart rate variability (HRV) is a non-invasive biomarker that reflects autonomic nervous system dynamics, providing valuable insights into physiological adaptation, stress, and recovery in athletes. Among the various HRV metrics, the root mean square of successive differences (RMSSD) has emerged as a robust and practical measure due to its strong association with parasympathetic activity, ease of calculation, and reliability in both short- and ultra-short-term recordings. This review examines the methodological considerations for using HRV to monitor training adaptations and recovery status in athletic populations. We highlight the superiority of routine, near-daily HRV measurements over isolated assessments, emphasizing the utility of weekly averages and the coefficient of variation (CV) to capture both chronic adaptations and acute homeostatic perturbations. Additionally, we discuss the selection of HRV devices, data recording procedures, and strategies to enhance athlete compliance. While RMSSD offers significant advantages for field-based monitoring, we also address its limitations, including its sole focus on parasympathetic activity and susceptibility to external confounders. Future directions include the integration of HRV data with other physiological markers and machine learning algorithms to optimize individualized training and recovery strategies. This review provides sport scientists and practitioners with evidence-based recommendations to enhance the application of HRV in both research and real-world athletic settings.
1. Introduction
Heart rate variability (HRV) refers to the fluctuation in the time intervals between consecutive heartbeats, reflecting the dynamic interplay between the sympathetic and parasympathetic branches of the autonomic nervous system [1,2]. These fluctuations provide a non-invasive view into autonomic regulation, offering insights into physiological recovery, stress, and overall health. Accordingly, HRV has emerged as a foundational biomarker of cardiac autonomic modulation in both clinical and athletic contexts [2,3].
From a practical perspective, HRV serves as an objective physiological indicator that relates to how well the body is coping with physical stress. When measured at rest, high HRV indicates a predominance of parasympathetic activity, suggesting a relaxed and recovered state [4]. Conversely, low HRV reflects greater sympathetic activation or reduced vagal tone, often associated with stress or fatigue [4]. However, HRV responses during prolonged or highly demanding activities can be more complex. While most work demonstrates a blunted HRV response under substantial physiological strain [5], other studies in military, tactical, and overreached athletic populations have reported paradoxical increases in HRV despite significant stress [6,7,8]. These findings emphasize that HRV should be interpreted within the broader training context and longitudinal trends, instead of isolated recordings.
In sports contexts, a common approach to using HRV is through HRV-guided training, which involves making adjustments to a training session’s intensity based on waking HRV values [9,10]. While this model offers a practical method for day-to-day exercise prescription, HRV can also be used to evaluate broader physiological processes related to training adaptation and recovery [11,12,13,14,15]. Adaptation refers to the long-term autonomic and physiological adjustments that occur in response to repeated training stimuli [11], which are often reflected in gradual shits in weekly HRV trends [3]. In contrast, recovery relates to the short-term physiological response following physical stress and the body’s ability to restore homeostasis [12,14], which can be monitored through acute changes in HRV relative to an athlete’s individual baseline [3]. Recovery and adaptation are interdependent processes, as adequate recovery supports favorable adaptation, whereas impaired recovery may signal or contribute to maladaptation [13]. Thus, tracking HRV trends, particularly through weekly mean values and the coefficient of variation (CV), provides insight into both adaptation and recovery [3]. Rather than guiding single-day adjustments, these longitudinal patterns help monitor overall training status across weeks or training blocks and support decisions related to load management, performance readiness, and recovery strategies [14,15].
Over the past few decades, a variety of HRV metrics and devices have emerged, enabling the monitoring of recovery and long-term adaptation in a variety of settings [16]. While this diversity may prove advantageous to consumers and researchers, it also highlights potential pitfalls, particularly if selected procedures do not align with specified goals. Given this methodological heterogeneity, clearer guidance is needed regarding the appropriate use of mobile HRV tools. However, existing reviews on this topic have generally focused on laboratory-based HRV methods or broad conceptual overviews, with limited attention to the unique methodological challenges associated with mobile platforms. Currently, there is no single resource that integrates device-specific considerations, ultra-short and weekly HRV metrics, and practical issues related to data interpretation and athlete compliance. Thus, a clear, integrated synthesis that consolidates device-specific considerations, ultra-short and weekly HRV metrics, and practical issues related to real-world data interpretation is still lacking. The aim of this narrative review is to address key methodological considerations for using mobile HRV devices in athlete monitoring and to provide practical recommendations for optimizing their application in assessing training adaptation and recovery. Topics discussed include the selection of HRV metrics and mobile devices, best practices for recording procedures, and strategies for interpreting HRV data in applied sport settings.
2. Methods
This review was conducted as a narrative synthesis of conceptually relevant evidence to provide practical guidance for applied athlete monitoring via wearable HRV sensors and mobile technologies. The aim was to contextualize emerging practices, highlight methodological considerations, and connect empirical findings to real-world application rather than exhaustively summarize all available studies. The authors’ intentions were to align the review with established recommendations outlining when narrative reviews are appropriate within scientific scholarship [17,18,19].
Literature searches were conducted between January and August 2024 using the databases and example search terms summarized in Table 1. Searches were further supplemented by manual screening of reference lists from key empirical papers and HRV-focused reviews. No publication date limits applied to the search criteria.

Table 1.
Summary of literature search procedures for this narrative review.
Study selection was guided by methodological rigor, ecological relevance to athlete monitoring, and applicability of HRV assessment using mobile devices. Evidence was synthesized qualitatively by prioritizing peer-reviewed studies that: evaluated HRV under resting conditions and in response to acute exercise; explored longitudinal HRV responses to training; validated ultra-short-term recordings and wearable devices; addressed methodological considerations relevant to field-based monitoring; and had direct relevance to using HRV in applied sport settings. Studies that focused primarily on areas outside of the main purpose of this review, such as in the realms of clinical disorders or pharmacological interventions, were generally excluded unless they offered essential mechanistic insight.
Because this was a narrative review, predefined inclusion/exclusion criteria and formal risk-of-bias scoring were not applied. The authors acknowledge the potential for selection bias inherent to narrative syntheses [17]. However, every effort was made to reflect a balanced cross-section of the most influential and methodologically sound work related to the use of mobile HRV devices and recording procedures for athletic contexts.
3. Choice of HRV Metric
3.1. The Common Parameters
HRV analysis begins with the detection of R-R intervals, also referred to as inter-beat intervals, which represent the time between successive R-waves in the QRS complex of an electrocardiogram (ECG). While modern wearable technologies now allow for the recording of these intervals using validated mobile devices (discussed later in this paper), ECG remains the gold standard due to its superior temporal resolution and ability to precisely detect the fiducial point of each R-wave [2]. Once extracted, these R-R intervals form the basis for calculating the various HRV metrics, which are typically categorized into three primary domains: time-domain, frequency-domain, and non-linear measures. Table 2 provides an overview of the most widely used HRV indices, outlining their physiological significance and implications for athlete monitoring.
Table 2.
Common heart rate variability metrics. Please note that this is not an exhaustive list. For a comprehensive review of available HRV indices, see Reference [2].
The selection of the appropriate HRV metric depends on the context of measurement and the goals of research or practice [1,2]. Time-domain metrics are often preferred in mobile settings due to their ease of computation and interpretation [3,20]. Frequency-domain metrics may offer richer insight into autonomic balance, especially when assessed under tightly controlled laboratory conditions [2,21,22,23]. However, controversy exists concerning the physiological underpinning of the low-frequency domain, and the complexity and respiratory sensitivity of these metrics can limit field-based applications [23,24,25]. Non-linear HRV metrics evaluate the complexity and unpredictability of heart rate patterns, which can be advantageous during non-steady state assessments [26,27,28,29]. Notably, the Poincaré plot-derived SD1 and the time-domain metric RMSSD are mathematically equivalent and, hence, both reflect vagally mediated HRV [30]. In addition, because most HRV variables follow a non-normal, right-skewed distribution, it is standard practice to apply a natural logarithmic transformation (e.g., lnRMSSD) before statistical analysis to stabilize variance and meet assumptions for parametric testing [20].
3.2. RMSSD as the Standard for Athletic Monitoring
Among the available HRV metrics, RMSSD is arguably the most common for field-based monitoring [3]. Calculated as the root mean square of the successive R-R interval differences, RMSSD primarily reflects parasympathetic (vagal) activity [31,32,33]. Numerous characteristics position RMSSD as the preferred HRV metric among athletes [32,33,34,35,36,37,38]. For instance, it is easier to compute and interpret than frequency-domain and non-linear metrics [1,4]. Furthermore, it remains relatively stable across a range of spontaneous breathing rates [39,40]. It reflects parasympathetic activity at rest and in response to acute exercise [41]. In addition, RMSSD demonstrates superior reliability and is less sensitive to external factors compared to frequency-domain metrics [42,43,44]. Therefore, the need for strict control during data collection is minimized with RMSSD.
Perhaps its most advantageous characteristic related to athlete monitoring in mobile or field-based settings is the utility of RMSSD under ultra-short timeframes. Traditional standards for short-term HRV assessment recommend a 5 min stabilization period followed by a 5 min recording period [2], a protocol often considered impractical in dynamic sport environments. However, because RMSSD is less susceptible to respiratory variations and non-physiological influences on signal drift that often confound other HRV indices [1,45], it appears to be suitable when assessed under ultra-shortened recording durations.
Indeed, several studies have shown that RMSSD maintains strong agreement with standard recording durations (i.e., 5 min stabilization preceding a 5 min recording) when derived from a 1 min segment that follows a 1 min stabilization period [31,46], and that this reliability holds irrespective of body position [47]. Similarly, Munoz et al. [48] compared multiple HRV indices across durations ranging from 10 s to 5 min and found RMSSD exhibited the strongest correlation (r > 0.90) with standard-length recordings, even at durations as short as 30 s. Further research has demonstrated that 1 min RMSSD recordings among athletes produced values nearly identical to conventional 5 min recordings across acute bouts of exercise [31] and long-term training periods [49].
3.3. Section Summary
Based on the collective evidence, RMSSD can be recommended as the primary HRV metric for field-based monitoring in athletes. Its strong association with parasympathetic activity and minimal sensitivity to respiratory fluctuations make it an ideal choice for tracking physiological trends over time. Additionally, RMSSD’s ease of calculation and its accuracy in ultra-short-term recordings across various body positions and training conditions enhances its practicality in real-world athletic settings. Therefore, this metric appears to be an asset for athletes, coaches, and practitioners seeking valid physiological feedback with minimal disruption to training or competition routines. However, it should be noted that RMSSD is not without limitations, and several practical and physiological considerations relevant to its interpretation are outlined in Section 7.
4. Choice of Mobile HRV Device
As previously mentioned, HRV is most accurately measured by collecting heart rate data via ECG and calculating it using specialized acquisition software. However, this approach is practically limited, requiring the need for laboratory equipment, specialized expertise, and controlled testing conditions, making it inconvenient for routine HRV monitoring in field settings. Although mobile-based HRV devices have gained popularity due to their convenience and accessibility, a key concern relates to their accuracy relative to ECG.
4.1. Accuracy of Various Mobile HRV Devices
A meta-analysis by Dobbs et al. [16] compared HRV data from 23 studies using portable sensors, including chest straps, wrist-worn monitors, and smartphone-based photoplethysmography (PPG) applications, and found small but acceptable discrepancies relative to ECG for all devices. Among the available HRV metrics, RMSSD consistently demonstrated the lowest error across devices, regardless of sensor type or body position [16]. Subsequent validation studies have similarly shown strong agreement between ECG and mobile HRV devices, including smartphone cameras [50,51,52], wristwatches [53,54], rings [55], chest straps [56], and ambulatory blood pressure devices [57]. Accuracy may also depend on recording duration, as a one-minute measurement is generally sufficient for RMSSD [16], whereas frequency-domain parameters typically require at least three-to-five minutes [51].
Furthermore, PPG-based devices perform best under resting conditions but lose accuracy during or immediately after exercise because of motion artefacts and vascular changes [58,59,60]. This is likely due to PPG and ECG being physiologically distinct signals. PPG reflects peripheral pulse dynamics rather than cardiac electrical activity [61]. Recent work suggests that these fundamental differences may introduce systematic variability between modalities, particularly during exercise, when vascular and pulse transit time changes can distort PPG signals relative to ECG [61].
Therefore, mobile devices appear to be suitable for measuring resting HRV, particularly for ultra-short RMSSD. However, their use during or immediately following exercise should be approached with caution due to the potential for reduced signal accuracy. Nevertheless, when applied under appropriate conditions, mobile HRV devices provide a practical and valid means of monitoring autonomic trends in athletic settings.
4.2. Real-World Practicality of Different Mobile HRV Devices
Beyond accuracy, practical considerations such as comfort, convenience, and cost may influence device selection. Wrist-worn and ring-based devices allow continuous data collection and are particularly effective for nocturnal recordings [54,62,63,64]. Many also provide additional health-related metrics such as heart rate, sleep, and oxygen saturation. Chest strap monitors yield highly accurate ECG-like signals [65] but require proper placement/contact and removal, which some users may find inconvenient and not practical for long-term continuous recordings. Wrist, ring, and chest-worn devices also tend to be more expensive than smartphone-based alternatives. In contrast, smartphone applications that rely on PPG, either through a connected finger sensor [66] or the phone’s camera [58,67], are inexpensive, portable, and ideal for consistent morning recordings [68,69]. These applications may also enhance athlete compliance because they are low-cost, easy to use, and often integrate wellness questionnaires, providing a practical solution for tracking recovery and adaptation through daily HRV measures. Ultimately, the optimal device depends on the athlete’s needs, monitoring frequency, and preferred measurement context. Table 3 summarizes commonly used mobile HRV devices, including example manufacturers, advantages, limitations, and validation findings.
Table 3.
Overview of mobile HRV devices, providing example (Ex.) manufacturers, advantages and disadvantages regarding athlete monitoring, and summary of validity findings.
It is also important to note that many commercially available HRV mobile devices (e.g., smartphone applications, wearables, etc.) automatically apply a log transformation to RMSSD. However, because lnRMSSD values are not intuitively interpretable by consumers, several systems multiply the transformed value by a constant (such as 20) to rescale the output to a more user-friendly format [30,66]. For example, a raw lnRMSSD value of 4.2 might be presented as an HRV “score” of 84. While these adjusted, arbitrary unit values are useful for tracking trends, practitioners and consumers should understand how such scores are derived to ensure consistency when interpreting HRV data across different platforms. In addition, because transformed scores do not retain the original time-domain scale, they may not be directly comparable to raw RMSSD values in milliseconds.
4.3. Section Summary
From a practitioner’s perspective, the cost–benefit of using portable devices for HRV monitoring often takes precedence over minor errors in accuracy. Furthermore, the level of error across portable devices, including wrist-worn monitors, chest straps, and smartphone-based applications, does not significantly differ when evaluating RMSSD [16]. As such, meaningful interpretation of longitudinal HRV trends depends largely on the consistency and frequency of measurement [67,68,69].
5. HRV Recording Procedures
5.1. The Importance of Daily or Near-Daily HRV Measures
Traditionally, HRV has been assessed using isolated, single-time-point measures, particularly in clinical settings [70]. However, this approach has several limitations. Single-time-point HRV measures are highly susceptible to transient fluctuations caused by daily stressors, disruptions in sleep, environmental factors, and measurement inconsistencies, making them less reliable for tracking meaningful physiological changes [38]. Additionally, isolated recordings do not account for baseline HRV, which requires frequent measurements over at least a week to establish [3]. Without this baseline, it is difficult to interpret whether a given HRV value reflects an individual’s homeostatic state or a temporary deviation. Nevertheless, because inter-individual differences in HRV can be influenced by factors unrelated to fitness or health [71], a lower HRV compared to a peer does not necessarily indicate poorer physiological status. Therefore, the focus in athletic monitoring should be on intra-individual changes, with frequent HRV assessments taken over time within an individual rather than single measurement comparisons pre-to-post training or relative to others. Therefore, establishing personalized interpretation of long-term HRV trends is essential for optimizing training and recovery strategies.
To accomplish this, athletes and practitioners should aim for daily HRV recordings over a full 7-day period and monitor trends on a week-to-week basis (see Section 6, for more detail). However, emerging evidence suggests that fewer measurements per week may still be sufficient to capture meaningful weekly trends. Plews et al. [72] investigated the minimum number of morning HRV recordings needed to approximate a full week’s average in both recreationally trained and highly trained triathletes. Their findings indicated that a minimum of five recordings per week was necessary for recreationally trained athletes, whereas recordings over just three days were sufficient for highly trained individuals to achieve acceptable agreement with the 7-day reference [72]. Accordingly, collecting 3 to 5 well-controlled, technically consistent morning recordings may provide a sufficiently accurate weekly HRV profile when daily monitoring is not feasible. Nevertheless, to ensure the highest validity and reliability of weekly HRV metrics, daily measurements with minimal missed days remain the recommended standard.
5.2. Timing Considerations for Field-Based HRV Recordings
A critical element of accurate HRV assessment is consistency in the timing of data collection. Nocturnal HRV recordings obtained during deep sleep are considered highly reflective of basal parasympathetic tone [73]. Additionally, this approach limits the influence of environmental and behavioral factors that can confound waking HRV assessments [74]. However, existing challenges limit the widespread utility of nocturnal HRV monitoring in athletes. While several commercially available wearables now offer automated nocturnal HRV tracking with reasonable accuracy [54,62,75], the practical feasibility remains limited due to costs, variability in measurement quality, and difficulties extrapolating and interpreting the data. Although nocturnal recordings represent a promising future direction for athlete monitoring, standardized, waking HRV assessments remain the most practical and scientifically supported method for high-frequency, field-based monitoring at present.
Therefore, it is recommended to record HRV as close to awakening as possible. Supporting this approach, Mishica et al. [76] demonstrated no significant differences and strong correlations between nocturnal and morning RMSSD when measured across several weeks in endurance athletes. Additionally, Williams et al. [77] has shown that HRV measures upon waking were sensitive to changes in resistance training loads across different microcycles, whereas measurements taken later in the day were less informative. Furthermore, Sherman et al. [78] suggested that morning RMSSD recordings were more strongly associated with performance in 2000 m rowing in competitive rowers when compared to recordings taken later in the day. Findings such as these are likely due to transient fluctuations in autonomic nervous system activity that can mask the relationship between HRV and physical readiness. For instance, bladder or bowel distension and digestive activity modulate vagal tone, whereas caffeine consumption stimulates sympathetic activity [79]. To minimize these influences, athletes should record HRV soon after waking and following elimination, but before consuming food or stimulants.
5.3. Body Positioning for Field-Based HRV Recordings
Another important consideration is the body position during HRV recording. The supine position is often utilized in research studies due reduced sympathetic activation [44]. However, it may not be practical during morning self-assessments, as individuals might inadvertently fall back asleep [3]. Moreover, elite endurance athletes often exhibit training-induced bradycardia and may experience “parasympathetic saturation” when measured in the supine position [38]. This phenomenon may be a result of continuously elevated levels of acetylcholine within the cardiac nodal synapses, resulting in excessively low resting heart rates and deceptively low HRV values [80]. Therefore, HRV should preferably be recorded in the seated position, as this posture yields values more reflective of training adaptations than those obtained in the supine position [81]. However, for athletes with an excessively low resting heart rate (e.g., <40 beats·min−1), the standing position may be more appropriate to avoid parasympathetic saturation [38,82]. Regardless of the chosen posture, maintaining the same body position for every recording is crucial, in that HRV values differ significantly across supine, seated, and standing positions and are therefore not interchangeable [83]. In order to ensure reliable longitudinal monitoring, practitioners and athletes should consistently use the same body position during each recording.
5.4. Ultra-Short Time Periods for Field-Based HRV Recording
One of the practical limitations of daily HRV monitoring is the time and compliance burden associated with standard 5 min recordings. To address this, the use of ultra-short-term HRV recordings has recently emerged as a practical and scientifically supported approach for daily athlete monitoring. As described in Section 3.2, RMSSD can be derived from brief (1 min) recordings, making this method well suited for routine morning assessments. Based on the findings of a number of studies [31,48,49,84], an optimal protocol involves a 1 min stabilization period, followed by a 1 min recording period using a device that automatically calculates the HRV metric, such as RMSSD or adjusted lnRMSSD. This approach minimizes participant burden while still producing reliable HRV values suitable for trend analysis. Critically, both the stabilization and recording periods should be free of movement, speech, and environmental distractions, and should be conducted under consistent daily conditions when possible.
5.5. Section Summary
Accurate and meaningful HRV monitoring requires standardized and consistent recording procedures. Single-time-point measures are limited in their ability to capture true physiological trends, highlighting the importance of frequent, longitudinal assessments that emphasize intra-individual changes rather than comparisons to normative data. Key factors include collecting data at the same time each day, consistent measurement durations, ideally upon waking, and prior to external influences such as food, caffeine, or physical activity. Additionally, maintaining a consistent body position across recordings is critical, with the seated posture often being the most practical and physiologically appropriate for most athletes. Furthermore, ultra-short-term recordings, particularly those using RMSSD, offer a convenient and reliable method for daily monitoring, but should be used consistently for long-term monitoring. To assist with implementation, Figure 1 provides a recommended, step-by-step flowchart summarizing the standardized procedures for ultra-short-term HRV recording. When implemented with consistency, this non-obtrusive protocol enables high-frequency HRV monitoring in field settings, enhancing its feasibility for integration into real-world athlete readiness assessments. This approach has also been successfully utilized in a variety of research designs [85,86,87].
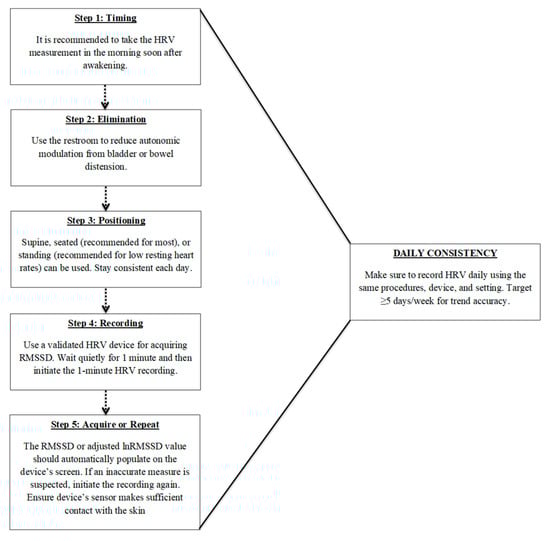
Figure 1.
Recommended procedures for daily ultra-short heart rate variability (HRV) monitoring using RMSSD. Steps include: (1) measuring shortly after awakening, (2) voiding the bladder or bowels to reduce autonomic confounding, (3) maintaining a consistent body position (seated preferred), (4) using a validated device for a 1 min recording, and (5) verifying or repeating the measure if signal quality is poor. Daily consistency in procedures and frequency (≥5 days/week) is critical for trend accuracy and meaningful interpretation of RMSSD values.
6. Data Interpretation
6.1. Establishment of a Baseline
As mentioned in Section 5, monitoring intra-individual trends over time is central to effective HRV interpretation [69,86]. To do this appropriately, athletes must first establish a stable personal baseline. In practice, this involves collecting daily waking HRV for at least 7 consecutive days under consistent conditions (e.g., same time of day, posture, and pre-measurement routine) [5,6,20]. The baseline week should be completed during a period of typical training, as excessive load can produce large day-to-day fluctuations and obscure homeostasis [86,87,88]. Once established, this baseline provides the reference point against which future deviations (whether acute or chronic) can be interpreted for load management, readiness, and recovery assessment [69,86]. Because autonomic status evolves with training and adaptation, baseline values may shift over time [69,86,87,88]. Therefore, periodic recalibration may be necessary to ensure that interpretation reflects the athlete’s current physiological state [69,86]. For instance, in applied settings, it may be useful to re-establish a fresh baseline at the beginning of each new training cycle, such as the start of the off-season after athletes have transitioned and recovered from the previous competitive season [86,87,88].
6.2. Weekly Mean of HRV
The importance of frequent (e.g., daily) HRV assessment was initially demonstrated by the seminal work of Plews et al. [88]. The study compared the relationship between isolated, single-day vs. weekly averaged RMSSD (RMSSDMEAN) values and changes in running performance, as assessed by maximal aerobic speed and timed 10 km running following 9 weeks of training [88]. The findings showed that the changes in maximal aerobic speed and 10 km performance displayed significantly stronger correlations with the changes in RMSSDMEAN values (r = 0.72 and −0.76, respectively) compared to the isolated RMSSD recordings (r = −0.06 and −0.17, respectively).
These findings were further supported by a study involving female collegiate soccer players participating in a 12-week conditioning program [87]. The results showed that the change in RMSSDMEAN from Week 1 and Week 3 was strongly correlated with the prospective change in maximal oxygen consumption at the end of the 12-week training program (r = 0.90). Specifically, players who showed an increase, no change, or decrease in RMSSDMEAN over the first three weeks exhibited a corresponding increase, no change, or decrease in maximal oxygen consumption at Week 12. Additional research suggests that RMSSDMEAN appears to increase the longer an athlete engages in training, which appears more pronounced in those with greater competitive experience [38,89], findings that are likely due to training-induced enhancements in cardiac efficiency [90]. These studies, along with others [91,92], support the use of weekly averaged HRV (specifically, RMSSDMEAN) to serve as an internal, objective indicator of the long-term physiological adaptations that underpin changes in physical fitness in response to training.
Typically derived from RMSSD, the weekly mean value is calculated by averaging daily HRV values across a fixed week (e.g., from Sunday to Saturday). This can be mathematically expressed as:
Interpreting changes in RMSSDMEAN values depends on the direction of the trend. Increasing trends in the mean value over the long term typically reflect positive training adaptations, improved cardiovascular fitness, and effective exercise prescription strategies over the long term [38,85]. Conversely, declining trends correspond to decreases in physical fitness and may indicate accumulated fatigue, nonfunctional overreaching, or overtraining [38,93,94]. Therefore, shifts in weekly mean HRV can signal whether the training program is effective or if adjustments are needed, such as modifying the training load or encouraging an extended recovery period [38,85].
6.3. Weekly Coefficient of Variation in HRV
While the weekly mean HRV provides important insight into longer-term adaptations, it does not account for the day-to-day fluctuations that may occur in response to immediate challenges to homeostasis, which is important for monitoring acute recovery status. This can be captured by calculating the CV of HRV within the same fixed week (e.g., Sunday → Saturday) that the mean value is calculated. The CV offers objective insight into internal, physiological responses and homeostatic perturbations over a short-term period, such as through a week of training [85]. The CV expresses the magnitude of day-to-day fluctuations relative to the weekly mean and hence, is calculated as:
Similar to the weekly mean values, existing research has primarily focused on the CV of RMSSD (RMSSDCV). Higher RMSSDCV values purportedly indicate greater perturbations in autonomic homeostasis, often signaling insufficient recovery during a given week [69,85,95]. Conversely, lower values may suggest more stable physiological resilience and a greater readiness to perform [69,85,95]. For example, in a case study by Flatt and Esco [96], a collegiate male cross-country athlete’s weekly RMSSDCV demonstrated a strong correlation (r ≈ 0.92) with race performance over the season. Weeks in which RMSSDCV was lower corresponded to faster completion times, whereas the weeks with higher RMSSDCv corresponded to slower race times [96].
6.4. Interpreting Both Weekly Metrics
As noted above, RMSSDMEAN and RMSSDCV are calculated from daily RMSSD values recorded throughout a given week. To illustrate this, Table 4 presents an example of 7 consecutive days of arbitrary RMSSD data, along with the corresponding weekly RMSSDMEAN and RMSSDCV. For additional context, the standard deviation for the week is also provided, since it is used with RMSSDMEAN to calculate RMSSDCV.
Table 4.
An example of daily RMSSD values across a week, as well as the weekly mean and CV calculated from the day-to-day values. Each day’s RMSSD represents a typical log-transformed and adjusted value.
In general, RMSSDMEAN and RMSSDCV are moderately-to-strongly inversely correlated, with reported coefficients of approximately r ≈ −0.50 [71]. This indicates that increases in one metric are often accompanied by decreases in the other [71]. For instance, favorable adaptations to training are often characterized by concurrent increases in RMSSDMEAN and decreases in RMSSDCV, reflecting enhanced autonomic stability and optimized performance [8,36,91,97]. As highlighted by Nakamura et al. [71], training-induced improvements in vagally mediated HRV (i.e., increased RMSSDMEAN) may correspond to enhanced homeostatic resiliency (i.e., lowered RMSSDCV) and superior responses to elevated training loads. Accordingly, training strategies aimed at increasing RMSSDMEAN and decreasing RMSSDCV may facilitate physiological adaptation, reduce the risk of accumulated fatigue, and enhance an athlete’s capacity to tolerate and recover from intensified training [71,98].
However, despite the inverse relationship between the two metrics being considered moderate-to-strong, it is far from perfect, as each variable reflects a distinct aspect of autonomic function and training status. Therefore, RMSSDMEAN and RMSSDCV should be interpreted independently, particularly since one can change while the other remains stable. This is supported by previous research demonstrating that acute periods of intensified training or short-term accumulated fatigue often correspond with elevated RMSSDCV, even though RMSSDMEAN may remain unchanged [86] or slightly decrease [99]. For instance, Flatt and Howells [100] showed no differences in RMSSDMEAN across a 3-week period of intensified training in rugby sevens players, while RMSSDCV slightly increased during the first week but moderately decreased by the third week. In addition, Flatt and Esco [37] demonstrated a decrease RMSSDCV (from ~7% to 4%) following a drop in training load from one week to the next, without a simultaneous change in RMSSDMEAN. Furthermore, RMSSDCV was more sensitive to acute adjustments in weekly training load during an 18-week periodized resistance training program in a collegiate hockey player compared to RMSSDMEAN [87]. As such, temporary increases in RMSSDCV may occur during brief periods of overload training as an “alarm” response required for general adaptation [101]. These values may subsequently decrease to reflect positive physiological adaptation to the training stimulus or after a planned deload week intended for recovery [69,85,87].
In contrast, if elevated RMSSDCV values persist for extended periods, such as beyond the duration of an overload microcycle or during typical recovery timeframes, there is a high likelihood that RMSSDMEAN will begin to decrease. This response has been shown in a non-functionally overreached triathlete whose persistent elevated RMSSDCV led to decrements in rolling averaged values [20]. Eventually, both metrics declined, coinciding with poor competition performance and the reactivation of a dormant shingles virus [20]. These observations suggest that persistence elevated RMSSDCV over several weeks may serve as an early warning sign of maladaptation, preceding declines in overall parasympathetic activity (i.e., decreased RMSSDMEAN), reduced recovery capacity, and increased risk of illness or injury.
6.5. Practical Examples of the Application of RMSSDMEAN and RMSSDCV
To contextualize these principles, Figure 2 illustrates four weekly HRV scenarios in a hypothetical athlete, including: (1) a baseline week of typical training, (2) a week of functional overreaching (FOR), (3) a week of non-functional overreaching (NFOR), and (4) a post-training week reflecting positive adaptation to a long-term program. HRV was recorded daily each morning using a validated mobile device that provided an adjusted, log-transformed RMSSD score in arbitrary units. Please note: FOR refers to a short-term performance decrement due to a brief period of intensified training, leading to subsequent performance improvement after adequate recovery [102]. In contrast, NFOR refers to a longer-term period of excessive training loads and is often accompanied by fatigue, mood disturbance, or physiological dysregulation [103,104]. While FOR is an intentional training strategy designed to boast performance, NFOR is unintentional and may lead to the onset of overtraining syndrome [103,104].
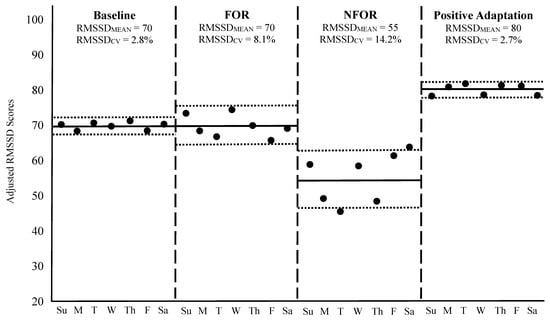
Figure 2.
Weekly HRV responses across four different scenarios. The solid black dots represent each day’s RMSSD (log-transformed and adjusted) value. The horizontal solid black lines during each week indicate the RMSSDMEAN, while the outside dotted horizontal lines correspond to RMSSDCV. The vertical dashed lines separate each week. Su = Sunday, M = Monday, T = Tuesday, W = Wednesday, Th = Thursday, F = Friday, Sa = Saturday, FOR = Functional overreaching, NFOR = Non-functional overreaching.
During the baseline week shown in Figure 2, RMSSDMEAN was 70 with an RMSSDCV of 2.8%, reflecting a stable physiological state in response to a normal training load. In the FOR scenario, RMSSDMEAN remained unchanged, but RMSSDCV increased to 8.1%, indicative of an acute perturbation to homeostasis often observed during intensified, yet intended, training microcycles [85,87,88]. It is worth noting, however, that a slight decrease in RMSSDMEAN in response to a weekly increase in training load, such as during an FOR microcycle, is not uncommon and may still reflect an appropriate and manageable training stimulus [6,86,92]. In such cases, both the elevated RMSSDCV and any drop in RMSSDMEAN are typically transient and should return to baseline as the athlete adapts to the training stimulus or following a well-timed week of recovery [88].
In contrast, the NFOR week demonstrated both a decline in RMSSDMEAN to 55 and a further elevation in RMSSDCV to 14.2%, suggesting the training load exceeded the athlete’s adaptive capacity for a prolonged period, resulting in insufficient recovery and accumulated fatigue [20,92]. Such changes may necessitate longer recovery or deload periods for the weekly metrics to normalize, to prevent the onset of overtraining syndrome [3,103,104]. However, if these responses remain prolonged, and the athlete reaches a state of chronic overtraining, then RMSSDCV may remain suppressed, but RMSSDMEAN may paradoxically decrease [20]. This decline in day-to-day variability may occur when the autonomic system becomes less responsive due to chronic stress, exhaustion, or the presence of an acute illness, leading to reduced RMSSDCV despite ongoing dysfunction [20]. It is important to note that during periods of FOR or NFOR, athletes may or may not present physical or mental symptoms of fatigue at rest, making the use of RMSSDMEAN and RMSSDCV more urgent when seeking to avoid OR.
Finally, the week representing positive adaptation showed an elevated RMSSDMEAN of 80 and an RMSSDCV similar to baseline (2.7%), signifying improved physiological function, enhanced cardiorespiratory fitness, and successful long-term training adaptation [85]. Although RMSSDCV remained unchanged from baseline, it is important to consider that the baseline value was already quite low. As previously noted, a reduction in RMSSDCV, particularly when baseline values are moderately elevated, is also an indicator of positive adaptation. In such cases, lower day-to-day variability reflects greater physiological stability and resilience, supporting the athlete’s improved readiness and capacity to tolerate intensified training loads [71].
For additional examples of interpretation, Table 5 provides a range of weekly RMSSDMEAN and RMSSDCV responses under a variety of real-world training and recovery scenarios. These hypothetical cases, developed from published HRV research and the authors’ applied experiences, are intended to help sport scientists and practitioners distinguish between positive physiological adaptations, acute homeostatic disturbances, and early signs of maladaptation. Although not specifically based on raw empirical datasets, the patterns shown above in Figure 2 and below in Table 5 reflect scientifically supported trends and offer practical guidance for interpreting HRV data within athlete monitoring systems.
Table 5.
Practical Interpretation of RMSSD Mean (log-transformed and adjusted) and CV (%) in Athlete Monitoring. Note: RMSSD values are hypothetical but based on published HRV patterns and experienced observations.
It is important to recognize that the magnitude, timing, and interpretation of HRV responses may vary considerably between individuals. The onset and severity of such changes are influenced by several factors, including the athlete’s training background, baseline cardiorespiratory fitness, psychological stressors, nutritional status, and the duration or aggressiveness of a training cycle [105,106]. For example, more experienced or aerobically fit athletes may exhibit smaller day-to-day fluctuations in HRV metrics, even under intensified training loads, due to greater physiological resilience [107]. Therefore, individualized baseline tracking and contextual interpretation are essential for accurate HRV-based decision-making.
6.6. Practical Application and Calculation Schedule
To derive meaningful RMSSDMEAN and RMSSDCV values, HRV should be recorded daily by consistently following the HRV recording procedures detailed in Section 4 and outlined in Figure 1. The RMSSDMEAN and RMSSDCV should then be calculated from a completed 7-day block of daily RMSSD values. Each week’s set (e.g., Sunday → Saturday) is averaged to obtain the weekly mean (RMSSDMEAN), and the standard deviation from those same days is used to calculate the coefficient of variation (CV = SD/Mean × 100). This “fixed-week” approach enables clear week-to-week comparison and aligns with the evidence showing that weekly metrics best reflect chronic adaptation and acute recovery.
Alternatively, practitioners may calculate the mean and CV as rolling 7-day metrics, in which each new day updates the 7-day window. This approach supports HRV-guided training models, wherein each new RMSSD value is compared against the rolling average to inform real-time adjustments in training load or recovery strategies [108]. However, rolling seven-day values differ from the fixed weekly values (e.g., RMSSDMEAN and RMSSDCV) discussed in this paper. Nevertheless, both approaches may be valuable, with fixed-week summaries used for monitoring long-term adaptation and weekly recovery status, while rolling metrics may be used for daily decision-making.
6.7. Section Summary
Based on the collective evidence, daily to near-daily HRV assessments, particularly using RMSSD, are recommended for optimizing the monitoring of recovery and training adaptations in athletes. This approach enables the calculation of both the mean and CV of HRV over the fixed weeks of a training program, with each serving distinct yet complementary roles. The weekly mean HRV reflects long-term autonomic trends and adaptations to training. On the other hand, the weekly CV of HRV identifies acute homeostatic disturbances, providing insight into recovery status and readiness to perform. Therefore, it is essential to calculate both metrics and interpret them separately, as they offer different insights into an athlete’s physiological state.
7. Additional Considerations
7.1. Automatic Calculation of Weekly Metrics
Despite the value of weekly HRV metrics, limited accessibility remains an issue. Many wearable devices do not measure HRV at all, and those that do often provide only a single daily HRV score without access to the underlying R–R interval data. There are a few platforms that automatically compute rolling seven-day RMSSD averages after a full week of data collection, which can be useful for short-term decision-making. This approach supports HRV-guided training models, wherein each new RMSSD value is compared against the rolling average to inform real-time adjustments in training load or recovery strategies [108]. However, rolling seven-day averages differ from the fixed weekly mean values (e.g., RMSSDMEAN) discussed in this paper, which are more appropriate for longitudinal monitoring (see Section 6, Data Interpretation). Both the weekly mean and CV must often be manually calculated from daily recordings, which may limit their accessibility for practitioners without data-analysis expertise or software.
7.2. Potential Limitations with Using RMSSD Alone
Although RMSSD selectively captures vagal activity [1], its capacity to reflect the full spectrum of autonomic balance, particularly in scenarios where sympathetic activation plays a central role, is limited [109,110,111]. In such cases, frequency-domain measures (e.g., LF, HF, LF/HF ratio) and non-linear methods (e.g., Poincaré plotting) may offer richer representations of both sympathetic and parasympathetic activity, as well as the adaptive complexity of cardiac control [4,112,113,114,115,116]. However, these approaches often require longer recordings and sophisticated analytic tools, which may be impractical in many applied sport settings [2,21,22].
Emerging research suggests that ratio-based, time-domain metrics may serve as practical surrogates for frequency-domain and non-linear methods. These approaches are proposed to complement RMSSD by providing a broader view of autonomic dynamics. For example, simplified indices such as SDNN/RMSSD or RMSSD/RR, as well as ultra-shortened time-domain modifications of the sympathetically mediated stress score, may provide additional insight into autonomic balance [42,111,117,118]. Such methods may be valuable when longer recordings or laboratory-based analyses are not feasible. However, further research is warranted to confirm their validity across different sports, training cycles, and populations before they are integrated into routine monitoring.
7.3. Integrating Subjective and Behavioral Indicators
Because HRV is an objective, physiological indicator, it may not fully reflect psychosocial stressors that influence training responses, such as insufficient or disrupted sleep, emotional distress, academic demands, or travel-related fatigue. These stressors can elevate sympathetic output without immediately suppressing parasympathetic activity and, hence, may result in little or no change in RMSSD despite increased allostatic load [88,119]. However, brief psychometric tools such as the Hooper Index [120,121], the Short Recovery and Stress Scale [122], the Total Quality Recovery Scale [123], the RESTQ-Sport [124], the Mclean questionnaire [125], the NASA Task Load Index [126], and the Pittsburgh Sleep Quality Index [126] have shown to be sensitive to both physical and psychological stress. When used alongside HRV, these measures can identify discrepancies between physiological signals and perceived recovery, offering early warning signs of non-functional overreaching or maladaptation [120]. Indeed, several studies have observed parallel changes in RMSSD and subjective recovery measures in athletes across training cycles [69,86,89,121]. Additional studies have supported the use of brief psychometric assessments as reliable indicators of training response, particularly when integrated with physiological monitoring [4,120].
7.4. Surrounding HRV Monitoring in Individual Athletes and Teams
Another consideration pertains to athlete compliance. As mentioned throughout the paper, daily HRV measures are important for monitoring athlete recovery and adaptation status. However, adherence to daily HRV monitoring is often high in the beginning, likely driven by novelty and motivation, but may decline over time unless intentional strategies are implemented to promote sustained compliance [85]. In team environments, promptly addressing any declines in daily recordings through communication with coaching staff can be especially valuable, as they play a pivotal role in reinforcing expectations, creating a culture of accountability, and connecting HRV tracking to tangible performance outcomes. For individual athletes, appropriately timed text message reminders and mobile-based cues can significantly improve adherence [127,128]. Practitioners may find it effective to text athletes proactively (e.g., first thing in the morning to prompt a recording) or reactively (e.g., after a missed day).
For both individuals and groups, athlete education is central to fostering long-term compliance. Athletes are more likely to integrate the practice into their daily routine when they understand the purpose of HRV tracking, such as its role in assessing recovery, identifying early signs of fatigue or illness, and guiding training load adjustments [129]. Personalizing the monitoring process by sharing meaningful feedback, such as how changes in HRV patterns relate to performance trends, further reinforces engagement by promoting a sense of ownership. Encouraging teams to view anonymized HRV trends collectively or recognizing athletes who demonstrate consistent engagement may not only educate the athletes about the importance of HRV monitoring, but could also build a shared culture.
Additionally, when working with large groups of athletes, cloud-based platforms that automatically update HRV data in real time are highly recommended for data management and compliance assurance. These systems streamline data management through secure, encrypted collection and monitoring of HRV in multiple athletes, regardless of location. Centralized access allows practitioners to identify trends and fluctuations related to athlete readiness, such as accumulated fatigue and the need for recovery interventions. Many platforms offer automated trend analysis, customizable dashboards, and integration with other health and performance data (e.g., GPS tracking, sleep monitoring, wellness questionnaires, etc.). When working with a group of athletes, practitioners and researchers are encouraged to consult the HRV device manufacturer to determine if their system supports cloud-based platforms or third-party data integration.
7.5. Signal Artifact Management in Mobile HRV Acquisition
When using mobile HRV devices, signal artifacts may arise from poor electrode or sensor contact, movement, ectopic beats, or transient vasoconstriction during recovery [60,130,131]. These disturbances distort beat-to-beat intervals and reduce device accuracy [131]. Standardized recording procedures, as described in Section 4, are therefore essential for data reliability [38]. Proper skin preparation can improve electrode or PPG contact, and many commercial platforms now incorporate automated artifact-detection and correction algorithms using threshold-based or adaptive filtering [132]. Although these methods enhance data quality, performance varies across devices and is rarely detailed in published research. Recordings with more than approximately 5% corrected beats should be discarded, as reliability declines substantially beyond this threshold [2].
Despite denoising strategies such as motion correction or filtering, HRV indices derived from exercise or immediate post-exercise recordings remain unstable [60,130]. Thus, daily HRV measurements should be performed under stationary, resting conditions to maximize accuracy and ensure meaningful assessment of recovery and adaptation.
7.6. Section Summary
While RMSSD remains a widely accepted HRV marker for monitoring athletes across training and competition periods, relying on it in isolation is not advised. At a minimum, RMSSD should be interpreted alongside simple psychometric variables, such as wellness questionnaires and training load indicators. Incorporating additional ultra-short HRV metrics, such as SDNN, to establish ratio-based parameters in conjunction with RMSSD shows promise for capturing sympathetic activity and autonomic balance, though additional validation is needed. Nevertheless, integrating multiple measures provides the most comprehensive approach to assessing training adaptation and recovery status in athletes.
8. Conclusions
HRV has become a popular “buzzword” in the realm of sport science. This review outlined the methodological considerations necessary for maximizing its utility in mobile settings, including the choice of metric and device, timing and posture of recordings, and data interpretation strategies. While a variety of HRV metrics exist, ultra-short (i.e., 1 min) RMSSD has emerged as the most user-friendly, practical, and robust for daily monitoring. Meaningful interpretation requires consistent daily measurements following standardized procedures. Weekly metrics are then derived from fixed 7-day blocks, with RMSSDMEAN reflecting chronic adaptation, and RMSSDCV representing short-term perturbations in homeostasis. This fixed week approach (e.g., Sunday-to-Saturday) allows reliable week-to-week comparisons across training periods.
Ultimately, integrating HRV monitoring into athlete management systems requires more than accurate data acquisition. It demands thoughtful implementation, consistent protocol adherence, and individualized interpretation. When HRV is combined with subjective wellness assessments and contextual training data, it evolves from a passive measurement into a dynamic decision-making tool capable of guiding recovery, optimizing training loads, and supporting long-term athletic development. As technology continues to advance and machine learning models become more sophisticated, the potential of HRV to deliver real-time, personalized insights will only expand. However, its value will remain contingent on informed application by practitioners who understand both its strengths and its limitations. With continued research, mobile HRV technologies hold strong potential to transform athlete monitoring and performance management systems.
Author Contributions
M.R.E. conceived the idea for the review paper and oversaw the drafting of the manuscript, while A.D.F., M.A.M. and B.M.K. assisted with its development. All authors have read and agreed to the published version of the manuscript.
Funding
This research received no external funding.
Data Availability Statement
Due to the nature of this review, no new data were created.
Conflicts of Interest
The authors declare no conflicts of interest.
Abbreviations
The following abbreviations are used in this manuscript:
| HRV | Heart Rate Variability |
| CV | Coefficient of Variation |
| R-R Interval | Time between successive R-waves in the QRS complex of an electrocardiogram |
| ECG | Electrocardiogram |
| RMSSD | Root Mean Square of Successive R-R Differences |
| SDNN | Standard Deviation of Normal-to-Normal Intervals |
| pNN50 | Proportion of R-R Intervals That Differ by >50 ms |
| HF | High frequency power (0.15–0.40 Hz) |
| LF | Low frequency power (0.04–0.15 Hz) |
| SD1 | Short-term variability perpendicular to line of identity of a Poincaré plot |
| SD2 | Long-term variability along the line of identity of a Poincaré plot |
| PSD | Power Spectral Density |
| n.u. | Normalized Units |
| PPG | Pulse Plethysmography |
| CI | Confidence Interval |
| Ln | Natural Log-Transformed |
| FOR | Functional Overreaching |
| NFOR | Non-Functional Overreaching |
| SS | Stress Score |
| SPS | Sympathetic/Parasympathetic Ratio |
| MSS | Modified Stress Score |
| MSPS | Modified Sympathetic/Parasympathetic Ratio |
| SRSS | Short Recovery and Stress Scale |
| TQR | Total Quality Recovery Scale |
| RESTQ-Sport | Recovery-Stress Questionnaire |
| GPS | Global Positioning System |
References
- Shaffer, F.; Ginsberg, J.P. An Overview of Heart Rate Variability Metrics and Norms. Front. Public Health 2017, 5, 258. [Google Scholar] [CrossRef]
- Task Force of the European Society of Cardiology and the North American Society of Pacing and Electrophysiology. Heart Rate Variability: Standards of Measurement, Physiological Interpretation and Clinical Use. Circulation 1996, 93, 1043–1065. [Google Scholar]
- Buchheit, M. Monitoring Training Status with HR Measures: Do All Roads Lead to Rome? Front. Physiol. 2014, 5, 73. [Google Scholar] [CrossRef]
- Laborde, S.; Mosley, E.; Thayer, J.F. Heart Rate Variability and Cardiac Vagal Tone in Psychophysiological Research—Recommendations for Experiment Planning, Data Analysis, and Data Reporting. Front. Psychol. 2017, 8, 213. [Google Scholar] [CrossRef]
- Halson, S.L. Monitoring Training Load to Understand Fatigue in Athletes. Sports Med. 2014, 44, S139–S147. [Google Scholar] [CrossRef]
- Lowe, A.C.; Niclou, A.; Varanoske, A.N.; Harris, M.N.; Hebert, C.; Johannsen, N.M.; Heymsfield, S.B.; Greenway, F.L.; Margolis, L.M.; Lieberman, H.R.; et al. Exercise Heart Rate Variability Suggests Parasympathetic Hyperactivity during Simulated Military Operations Irrespective of Testosterone Administration. Med. Sci. Sports Exerc. 2025, 57, 1979–1987. [Google Scholar] [CrossRef] [PubMed]
- Tomes, C.D.; Canetti, E.F.; Schram, B.; Orr, R. Heart Rate Variability Profile Changes Associated with Specialist Police Selection Activities: A Case Study. Work 2024, 77, 1295–1303. [Google Scholar] [CrossRef]
- Bellenger, C.R.; Karavirta, L.; Thomson, R.L.; Robertson, E.Y.; Davison, K.; Buckley, J.D. Contextualizing Parasympathetic Hyperactivity in Functionally Overreached Athletes with Perceptions of Training Tolerance. Int. J. Sports Physiol. Perform. 2016, 11, 685–692. [Google Scholar] [CrossRef] [PubMed]
- Kiviniemi, A.M.; Hautala, A.J.; Kinnunen, H.; Tulppo, M.P. Endurance Training Guided Individually by Daily Heart Rate Variability Measurements. Eur. J. Appl. Physiol. 2007, 101, 743–751. [Google Scholar] [CrossRef] [PubMed]
- Vesterinen, V.; Nummela, A.; Heikura, I.; Laine, T.; Hynynen, E.; Botella, J.; Häkkinen, K. Individual Endurance Training Prescription with Heart Rate Variability. Med. Sci. Sports Exerc. 2016, 48, 1347–1354. [Google Scholar] [CrossRef]
- Hawley, J.A.; Burke, L.M. Carbohydrate Availability and Training Adaptation: Effects on Cell Metabolism. Exerc. Sport Sci. Rev. 2010, 38, 152–160. [Google Scholar] [CrossRef]
- Kellmann, M. Preventing Overtraining in Athletes in High-Intensity Sports and Stress/Recovery Monitoring. Scand. J. Med. Sci. Sports 2010, 20, 95–102. [Google Scholar] [CrossRef]
- Meeusen, R.; Duclos, M.; Foster, C.; Fry, A.; Gleeson, M.; Nieman, D.; Raglin, J.; Rietjens, G.; Steinacker, J.; Urhausen, A. Prevention, Diagnosis and Treatment of the Overtraining Syndrome: Joint Consensus Statement of the European College of Sport Science (ECSS) and the American College of Sports Medicine (ACSM). Eur. J. Sport Sci. 2013, 13, 1–24. [Google Scholar] [CrossRef]
- Hautala, A.J.; Kiviniemi, A.M.; Tulppo, M.P. Individual Responses to Aerobic Exercise: The Role of the Autonomic Nervous System. Neurosci. Biobehav. Rev. 2009, 33, 107–115. [Google Scholar] [CrossRef] [PubMed]
- Kellmann, M.; Bertollo, M.; Bosquet, L.; Brink, M.; Coutts, A.J.; Duffield, R.; Erlacher, D.; Halson, S.L.; Hecksteden, A.; Heidari, J.; et al. Recovery and Performance in Sport: Consensus Statement. Int. J. Sports Physiol. Perform. 2018, 13, 240–245. [Google Scholar] [CrossRef]
- Dobbs, W.C.; Fedewa, M.V.; MacDonald, H.V.; Holmes, C.J.; Cicone, Z.S.; Plews, D.J.; Esco, M.R. The Accuracy of Acquiring Heart Rate Variability from Portable Devices: A Systematic Review and Meta-Analysis. Sports Med. 2019, 49, 417–435. [Google Scholar] [CrossRef]
- Green, B.N.; Johnson, C.D.; Adams, A. Writing Narrative Literature Reviews for Peer-Reviewed Journals: Secrets of the Trade. J. Chiropr. Med. 2006, 5, 101–117. [Google Scholar] [CrossRef]
- Ferrari, R. Writing Narrative Style Literature Reviews. Med. Writ. 2015, 24, 230–235. [Google Scholar] [CrossRef]
- Baethge, C.; Goldbeck-Wood, S.; Mertens, S. Publication Types in Medical Research: The Narrative Review. Dtsch. Arztebl. Int. 2019, 116, 801–807. [Google Scholar]
- Plews, D.J.; Laursen, P.B.; Kilding, A.E.; Buchheit, M. Heart Rate Variability in Elite Triathletes, Is Variation in Variability the Key to Effective Training? A Case Comparison. Eur. J. Appl. Physiol. 2012, 112, 3729–3741. [Google Scholar] [CrossRef] [PubMed]
- Pomeranz, B.; Macaulay, R.J.; Caudill, M.A.; Kutz, I.; Adam, D.; Gordon, D.; Kilborn, K.M.; Barger, A.C.; Shannon, D.C.; Cohen, R.J.; et al. Assessment of Autonomic Function in Humans by Heart Rate Spectral Analysis. Am. J. Physiol. 1985, 248, H151–H153. [Google Scholar] [CrossRef]
- Berntson, G.G.; Bigger, J.T.; Eckberg, D.L.; Grossman, P.; Kaufmann, P.G.; Malik, M.; Nagaraja, H.N.; Porges, S.W.; Saul, J.P.; Stone, P.H.; et al. Heart Rate Variability: Origins, Methods, and Interpretive Caveats. Psychophysiology 1997, 34, 623–648. [Google Scholar] [CrossRef]
- Katona, P.G.; Jih, F. Respiratory Sinus Arrhythmia: Noninvasive Measure of Parasympathetic Cardiac Control. J. Appl. Physiol. 1975, 39, 801–805. [Google Scholar] [CrossRef]
- Goldstein, D.S.; Bentho, O.; Park, M.-Y.; Sharabi, Y. Low-Frequency Power of Heart Rate Variability Is Not a Measure of Cardiac Sympathetic Tone but May Be a Measure of Modulation of Cardiac Autonomic Outflows by Baroreflexes. Exp. Physiol. 2011, 96, 1255–1261. [Google Scholar] [CrossRef]
- Billman, G.E. The LF/HF Ratio Does Not Accurately Measure Cardiac Sympatho-Vagal Balance. Front. Physiol. 2013, 4, 26. [Google Scholar] [CrossRef] [PubMed]
- Brennan, M.; Palaniswami, M.; Kamen, P. Do Existing Measures of Poincaré Plot Geometry Reflect Nonlinear Features of Heart Rate Variability? IEEE Trans. Biomed. Eng. 2001, 48, 1342–1347. [Google Scholar] [CrossRef] [PubMed]
- Richman, J.S.; Moorman, J.R. Physiological Time-Series Analysis Using Approximate Entropy and Sample Entropy. Am. J. Physiol. Heart Circ. Physiol. 2000, 278, H2039–H2049. [Google Scholar] [CrossRef]
- Peng, C.-K.; Havlin, S.; Stanley, H.E.; Goldberger, A.L. Quantification of Scaling Exponents and Crossover Phenomena in Nonstationary Heartbeat Time Series. Chaos 1995, 5, 82–87. [Google Scholar] [CrossRef]
- Casties, J.-F.; Mottet, D.; Le Gallais, D. Non-Linear Analyses of Heart Rate Variability During Heavy Exercise and Recovery in Cyclists. Int. J. Sports Med. 2006, 27, 780–785. [Google Scholar] [CrossRef]
- Ciccone, A.B.; Siedlik, J.A.; Wecht, J.M.; Deckert, J.A.; Nguyen, N.D.; Weir, J.P. Reminder: RMSSD and SD1 Are Identical Heart Rate Variability Metrics. Muscle Nerve 2017, 56, 674–678. [Google Scholar] [CrossRef] [PubMed]
- Esco, M.R.; Flatt, A.A. Ultra-Short-Term Heart Rate Variability Indexes at Rest and Post-Exercise in Athletes: Evaluating the Agreement with Accepted Recommendations. J. Sports Sci. Med. 2014, 13, 535–541. [Google Scholar] [PubMed]
- Aubert, A.E.; Seps, B.; Beckers, F. Heart Rate Variability in Athletes. Sports Med. 2003, 33, 889–919. [Google Scholar] [CrossRef] [PubMed]
- Goldberger, J.J.; Challapalli, S.; Tung, R.; Parker, M.A.; Kadish, A.H. Relationship of Heart Rate Variability to Parasympathetic Effect. Circulation 2001, 103, 1977–1983. [Google Scholar] [CrossRef] [PubMed]
- Plews, D.J.; Laursen, P.B.; Buchheit, M. Day-to-Day Heart-Rate Variability Recordings in World-Champion Rowers: Appreciating Unique Athlete Characteristics. Int. J. Sports Physiol. Perform. 2017, 12, 697–703. [Google Scholar] [CrossRef]
- Addleman, J.S.; Lackey, N.S.; DeBlauw, J.A.; Hajduczok, A.G. Heart Rate Variability Applications in Strength and Conditioning: A Narrative Review. J. Funct. Morphol. Kinesiol. 2024, 9, 93. [Google Scholar] [CrossRef]
- Lipka, A.; Luthardt, C.; Tognaccioli, T.; Cairo, B.; de Abreu, R.M. Heart Rate Variability and Overtraining in Soccer Players: A Systematic Review. Physiol. Rep. 2025, 13, e70357. [Google Scholar] [CrossRef]
- Flatt, A.A.; Esco, M.R. Smartphone-Derived Heart-Rate Variability and Training Load in a Women’s Soccer Team. Int. J. Sports Physiol. Perform. 2015, 10, 994–1000. [Google Scholar] [CrossRef]
- Plews, D.J.; Laursen, P.B.; Stanley, J.; Kilding, A.E.; Buchheit, M. Training Adaptation and Heart Rate Variability in Elite Endurance Athletes: Opening the Door to Effective Monitoring. Sports Med. 2013, 43, 773–781. [Google Scholar] [CrossRef]
- Saboul, D.; Pialoux, V.; Hautier, C. The Impact of Breathing on HRV Measurements: Implications for the Longitudinal Follow-Up of Athletes. Eur. J. Sport Sci. 2013, 13, 534–542. [Google Scholar] [CrossRef]
- Penttilä, J.; Helminen, A.; Jartti, T.; Kuusela, T.; Huikuri, H.V.; Tulppo, M.P.; Coffeng, R.; Scheinin, H. Time Domain, Geometrical and Frequency Domain Analysis of Cardiac Vagal Outflow: Effects of Various Respiratory Patterns. Clin. Physiol. 2001, 21, 365–376. [Google Scholar] [CrossRef]
- Chiang, J.K.; Lin, Y.C.; Hung, T.Y.; Kao, H.H.; Kao, Y.H. The Impact on Autonomic Nervous System Activity During and Following Exercise in Adults: A Meta-Regression Study and Trial Sequential Analysis. Medicina 2024, 60, 1223. [Google Scholar] [CrossRef] [PubMed]
- Al Haddad, H.; Laursen, P.; Chollet, D.; Ahmaidi, S.; Buchheit, M. Reliability of Resting and Postexercise Heart Rate Measures. Int. J. Sports Med. 2011, 32, 598–605. [Google Scholar] [CrossRef]
- Žunkovič, B.; Kejžar, N.; Bajrović, F.F. Standard Heart Rate Variability Parameters—Their Within-Session Stability, Reliability, and Sample Size Required to Detect the Minimal Clinically Important Effect. J. Clin. Med. 2023, 12, 3118. [Google Scholar] [CrossRef] [PubMed]
- Besson, C.; Baggish, A.L.; Monteventi, P.; Schmitt, L.; Stucky, F.; Gremeaux, V. Assessing the Clinical Reliability of Short-Term Heart Rate Variability: Insights from Controlled Dual-Environment and Dual-Position Measurements. Sci. Rep. 2025, 15, 5611. [Google Scholar] [CrossRef]
- Shaffer, F.; Meehan, Z.M.; Zerr, C.L. A Critical Review of Ultra-Short-Term Heart Rate Variability Norms Research. Front. Neurosci. 2020, 14, 594880. [Google Scholar] [CrossRef] [PubMed]
- Flatt, A.A.; Esco, M.R. Heart Rate Variability Stabilization in Athletes: Towards More Convenient Data Acquisition. Clin. Physiol. Funct. Imaging 2016, 36, 331–336. [Google Scholar] [CrossRef]
- Holmes, C.J.; Fedewa, M.V.; Dobbs, W.C.; Liu, Y.; Flatt, A.A.; Nakamura, F.Y.; Esco, M.R. The Effects of Different Body Positions on the Accuracy of Ultra-Short-Term Heart Rate Variability Indexes. J. High Technol. Manag. Res. 2020, 31, 100375. [Google Scholar] [CrossRef]
- Munoz, M.L.; van Roon, A.; Riese, H.; Thio, C.; Oostenbroek, E.; Westrik, I.; de Geus, E.J.C.; Gansevoort, R.; Lefrandt, J.; Nolte, I.M.; et al. Validity of (Ultra-)Short Recordings for Heart Rate Variability Measurements. PLoS ONE 2015, 10, e0138921. [Google Scholar] [CrossRef]
- Nakamura, F.Y.; Flatt, A.A.; Pereira, L.A.; Ramirez-Campillo, R.; Loturco, I.; Esco, M.R. Ultra-Short-Term Heart Rate Variability Is Sensitive to Training Effects in Team Sports Players. J. Sports Sci. Med. 2015, 14, 602–605. [Google Scholar]
- van Dijk, W.; Huizink, A.C.; Oosterman, M.; Lemmers-Jansen, I.L.J.; de Vente, W. Validation of Photoplethysmography Using a Mobile Phone Application for the Assessment of Heart Rate Variability in the Context of Heart Rate Variability–Biofeedback. Psychosom. Med. 2023, 85, 568–576. [Google Scholar] [CrossRef]
- Chen, Y.-S.; Lu, W.-A.; Pagaduan, J.C.; Kuo, C.-D. A Novel Smartphone App for the Measurement of Ultra-Short-Term and Short-Term Heart Rate Variability: Validity and Reliability Study. JMIR Mhealth Uhealth 2020, 8, e18761. [Google Scholar] [CrossRef]
- Pagaduan, J.C.; Chen, Y.-S. Validity of Pulse Express PRO in Measurement of Heart Rate Variability. Ger. J. Exerc. Sport Res. 2021, 51, 156–159. [Google Scholar] [CrossRef]
- Bonneval, L.; Wing, D.; Sharp, S.; Tristao Parra, M.; Moran, R.; LaCroix, A.; Godino, J. Validity of Heart Rate Variability Measured with Apple Watch Series 6 Compared to Laboratory Measures. Sensors 2025, 25, 2380. [Google Scholar] [CrossRef] [PubMed]
- Schuurmans, A.A.T.; de Looff, P.; Nijhof, K.S.; Rosada, C.; Scholte, R.H.J.; Popma, A.; Otten, R. Validity of the Empatica E4 Wristband to Measure Heart Rate Variability (HRV) Parameters: A Comparison to Electrocardiography (ECG). J. Med. Syst. 2020, 44, 190. [Google Scholar] [CrossRef]
- Liang, T.; Yilmaz, G.; Soon, C.-S. Deriving Accurate Nocturnal Heart Rate, RMSSD and Frequency HRV from the Oura Ring. Sensors 2024, 24, 7475. [Google Scholar] [CrossRef]
- Rogers, B.; Schaffarczyk, M.; Clauß, M.; Mourot, L.; Gronwald, T. The Movesense Medical Sensor Chest Belt Device as Single Channel ECG for RR Interval Detection and HRV Analysis during Resting State and Incremental Exercise: A Cross-Sectional Validation Study. Sensors 2022, 22, 2032. [Google Scholar] [CrossRef]
- Maqsood, R.; Schofield, S.; Bennett, A.N.; Khattab, A.; Bull, A.M.J.; Fear, N.T.; Boos, C.J. Validity of Ultra-Short-Term Heart Rate Variability Derived from Femoral Arterial Pulse Waveform in a British Military Cohort. Appl. Psychophysiol. Biofeedback 2024, 49, 619–627. [Google Scholar] [CrossRef] [PubMed]
- Holmes, C.J.; Fedewa, M.V.; Winchester, L.J.; MacDonald, H.V.; Wind, S.A.; Esco, M.R. Validity of Smartphone Heart Rate Variability Pre- and Post-Resistance Exercise. Sensors 2020, 20, 5738. [Google Scholar] [CrossRef] [PubMed]
- Schäfer, A.; Vagedes, J. How Accurate Is Pulse Rate Variability as an Estimate of Heart Rate Variability? A Review on Studies Comparing Photoplethysmographic Technology with an Electrocardiogram. Int. J. Cardiol. 2013, 166, 15–29. [Google Scholar] [CrossRef]
- Yuda, E.; Shibata, M.; Ogata, Y.; Ueda, N.; Yoshida, Y.; Hayano, J. Pulse Rate Variability: A New Biomarker, Not a Surrogate for Heart Rate Variability. J. Physiol. Anthropol. 2020, 39, 21. [Google Scholar] [CrossRef]
- Dewig, H.G.; Cohen, J.N.; Renaghan, E.J.; Leary, M.E.; Leary, B.K.; Au, J.S.; Tenan, M.S. Are Wearable Photoplethysmogram-Based Heart Rate Variability Measures Equivalent to Electrocardiogram? A Simulation Study. Sports Med. 2024, 54, 2927–2934. [Google Scholar] [CrossRef] [PubMed]
- de Zambotti, M.; Goldstone, A.; Claudatos, S.; Colrain, I.M.; Baker, F.C. A Validation Study of Fitbit Charge 2TM Compared with Polysomnography in Adults. Chronobiol. Int. 2018, 35, 465–476. [Google Scholar] [CrossRef]
- de Vries, H.J.; Pennings, H.J.M.; van der Schans, C.P.; Sanderman, R.; Oldenhuis, H.K.E.; Kamphuis, W. Wearable-Measured Sleep and Resting Heart Rate Variability as an Outcome of and Predictor for Subjective Stress Measures: A Multiple N-of-1 Observational Study. Sensors 2022, 23, 332. [Google Scholar] [CrossRef] [PubMed]
- Cao, R.; Azimi, I.; Sarhaddi, F.; Niela-Vilen, H.; Axelin, A.; Liljeberg, P.; Rahmani, A.M. Accuracy Assessment of Oura Ring Nocturnal Heart Rate and Heart Rate Variability in Comparison with Electrocardiography in Time and Frequency Domains: Comprehensive Analysis. J. Med. Internet Res. 2022, 24, e27487. [Google Scholar] [CrossRef] [PubMed]
- Martín Gómez, R.; Allevard, E.; Kamstra, H.; Cotter, J.; Lamb, P. Validity and Reliability of Movesense HR+ ECG Measurements for High-Intensity Running and Cycling. Sensors 2024, 24, 5713. [Google Scholar] [CrossRef]
- Esco, M.R.; Flatt, A.A.; Nakamura, F.Y. Agreement between a Smartphone Pulse Sensor Application and Electrocardiography for Determining lnRMSSD. J. Strength Cond. Res. 2017, 31, 380–385. [Google Scholar] [CrossRef]
- Plews, D.J.; Scott, B.; Altini, M.; Wood, M.; Kilding, A.E.; Laursen, P.B. Comparison of Heart-Rate-Variability Recording with Smartphone Photoplethysmography, Polar H7 Chest Strap, and Electrocardiography. Int. J. Sports Physiol. Perform. 2017, 12, 1324–1328. [Google Scholar] [CrossRef]
- Flatt, A.A.; Allen, J.R.; Keith, C.M.; Martinez, M.W.; Esco, M.R. Season-Long Heart-Rate Variability Tracking Reveals Autonomic Imbalance in American College Football Players. Int. J. Sports Physiol. Perform. 2021, 16, 1834–1843. [Google Scholar] [CrossRef]
- Flatt, A.A.; Esco, M.R. Evaluating Individual Training Adaptation with Smartphone-Derived Heart Rate Variability in a Collegiate Female Soccer Team. J. Strength Cond. Res. 2016, 30, 378–385. [Google Scholar] [CrossRef]
- Shaffer, F.; McCraty, R.; Zerr, C.L. A Healthy Heart Is Not a Metronome: An Integrative Review of the Heart’s Anatomy and Heart Rate Variability. Front. Psychol. 2014, 5, 1040. [Google Scholar] [CrossRef]
- Nakamura, F.Y.; Pereira, L.A.; Rabelo, F.N.; Flatt, A.A.; Esco, M.R.; Bertollo, M.; Loturco, I. Monitoring Weekly Heart Rate Variability in Futsal Players During the Preseason: The Importance of Maintaining High Vagal Activity. J. Sports Sci. 2016, 34, 2262–2268. [Google Scholar] [CrossRef] [PubMed]
- Plews, D.J.; Laursen, P.B.; Le Meur, Y.; Hausswirth, C.; Kilding, A.E.; Buchheit, M. Monitoring Training with Heart Rate Variability: How Much Compliance Is Needed for Valid Assessment? Int. J. Sports Physiol. Perform. 2014, 9, 783–790. [Google Scholar] [CrossRef]
- Chouchou, F.; Desseilles, M. Heart Rate Variability: A Tool to Explore the Sleeping Brain? Front. Neurosci. 2014, 8, 402. [Google Scholar] [CrossRef]
- de Zambotti, M.; Goldstein, C.; Cook, J.; Menghini, L.; Altini, M.; Cheng, P.; Robillard, R. State of the Science and Recommendations for Using Wearable Technology in Sleep and Circadian Research. Sleep 2024, 47, zsad325. [Google Scholar] [CrossRef]
- Miller, D.J.; Sargent, C.; Roach, G.D. A Validation of Six Wearable Devices for Estimating Sleep, Heart Rate and Heart Rate Variability in Healthy Adults. Sensors 2022, 22, 6317. [Google Scholar] [CrossRef]
- Mishica, C.; Kyrolainen, H.; Hynynen, E.; Nummela, A.; Holmberg, H.-C.; Linnamo, V. Evaluation of Nocturnal vs. Morning Measures of Heart Rate Indices in Young Athletes. PLoS ONE 2022, 17, e0262333. [Google Scholar] [CrossRef]
- Williams, T.D.; Esco, M.R.; Fedewa, M.V.; Bishop, P.A. Inter- and Intra-Day Comparisons of Smartphone-Derived Heart Rate Variability across Resistance Training Overload and Taper Microcycles. Int. J. Environ. Res. Public Health 2021, 18, 177. [Google Scholar] [CrossRef] [PubMed]
- Sherman, S.R.; Holmes, C.J.; Hornikel, B.; MacDonald, H.V.; Fedewa, M.V.; Esco, M.R. Heart-Rate Variability Recording Time and Performance in Collegiate Female Rowers. Int. J. Sports Physiol. Perform. 2021, 16, 550–556. [Google Scholar] [CrossRef] [PubMed]
- Quintana, D.S.; Heathers, J.A.J. Considerations in the Assessment of Heart Rate Variability in Biobehavioral Research. Front. Psychol. 2014, 5, 805. [Google Scholar] [CrossRef]
- Kiviniemi, A.M.; Hautala, A.J.; Seppänen, T.; Mäkikallio, T.H.; Huikuri, H.V.; Tulppo, M.P. Saturation of High-Frequency Oscillations of R-R Intervals in Healthy Subjects and Patients after Acute Myocardial Infarction During Ambulatory Conditions. Am. J. Physiol. Heart Circ. Physiol. 2004, 287, H1921–H1927. [Google Scholar] [CrossRef]
- Rabbani, M.; Agha-Alinejad, H.; Gharakhanlou, R.; Rabbani, A.; Flatt, A.A. Monitoring Training in Women’s Volleyball: Supine or Seated Heart Rate Variability? Physiol. Behav. 2021, 240, 113537. [Google Scholar] [CrossRef]
- Maggioni, M.A.; Rundfeldt, L.C.; Gunga, H.-C.; Joerres, M.; Merati, G.; Steinach, M. The Advantage of Supine and Standing Heart Rate Variability Analysis to Assess Training Status and Performance in a Walking Ultramarathon. Front. Physiol. 2020, 11, 731. [Google Scholar] [CrossRef]
- Damoun, N.; Amekran, Y.; Taiek, N.; Hangouche, A.J.E. Heart Rate Variability Measurement and Influencing Factors: Towards the Standardization of Methodology. Glob. Cardiol. Sci. Pract. 2024, 2024, e202435. [Google Scholar] [CrossRef]
- Forner-Llacer, F.; Aranda-Malaves, R.; Calleja-Gonzalez, J.; Perez-Turpin, J.A.; Gonzalez-Rodenas, J. Minimal Stabilization Time for Ultra-Short Heart Rate Variability Measurements in Professional Soccer. Int. J. Sports Med. 2020, 41, 1032–1038. [Google Scholar] [CrossRef]
- Esco, M.R.; Flatt, A.A.; Nakamura, F.Y. Initial Weekly HRV Response Is Related to the Prospective Change in VO2max in Female Soccer Players. Int. J. Sports Med. 2016, 37, 436–441. [Google Scholar] [CrossRef]
- Flatt, A.A.; Esco, M.R.; Nakamura, F.Y.; Plews, D.J. Interpreting Daily Heart Rate Variability Changes in Collegiate Female Soccer Players. J. Sports Med. Phys. Fit. 2017, 57, 907–915. [Google Scholar] [CrossRef] [PubMed]
- Holmes, C.J.; Wind, S.A.; Esco, M.R. Heart Rate Variability Responses to an Undulating Resistance Training Program in Free-Living Conditions: A Case Study in a Collegiate Athlete. Sports 2018, 6, 121. [Google Scholar] [CrossRef] [PubMed]
- Plews, D.J.; Laursen, P.B.; Kilding, A.E.; Buchheit, M. Evaluating Training Adaptation with Heart-Rate Measures: A Methodological Comparison. Int. J. Sports Physiol. Perform. 2013, 8, 688–691. [Google Scholar] [CrossRef]
- Flatt, A.A.; Hornikel, B.; Nakamura, F.Y.; Esco, M.R. Effect of Competitive Status and Experience on Heart Rate Variability Profiles in Collegiate Sprint-Swimmers. J. Strength Cond. Res. 2022, 36, 2898–2904. [Google Scholar] [CrossRef] [PubMed]
- Thayer, J.F.; Yamamoto, S.S.; Brosschot, J.F. The Relationship of Autonomic Imbalance, Heart Rate Variability and Cardiovascular Disease Risk Factors. Int. J. Cardiol. 2010, 141, 122–131. [Google Scholar] [CrossRef]
- Nakamura, F.Y.; Antunes, P.; Nunes, C.; Costa, J.A.; Esco, M.R.; Travassos, B. Heart Rate Variability Changes from Traditional vs. Ultra–Short-Term Recordings in Relation to Preseason Training Load and Performance in Futsal Players. J. Strength Cond. Res. 2020, 34, 2974–2981. [Google Scholar] [CrossRef]
- Bellenger, C.R.; Fuller, J.T.; Thomson, R.L.; Davison, K.; Robertson, E.Y.; Buckley, J.D. Monitoring Athletic Training Status Through Autonomic Heart Rate Regulation: A Systematic Review and Meta-Analysis. Sports Med. 2016, 46, 1461–1486. [Google Scholar] [CrossRef]
- Iizuka, T.; Ohiwa, N.; Atomi, T.; Shimizu, M.; Atomi, Y. Morning Heart Rate Variability as an Indication of Fatigue Status in Badminton Players During a Training Camp. Sports 2020, 8, 147. [Google Scholar] [CrossRef]
- Iizuka, T.; Kon, M.; Maegawa, T.; Yuda, J.; Aoyanagi, T.; Takahashi, H.; Atomi, T.; Shimizu, M.; Atomi, Y. Comparison of Morning Heart Rate Variability at the Beginning and End of a Competition Season in Elite Speed Skaters. Sports 2020, 8, 164. [Google Scholar] [CrossRef] [PubMed]
- Nakamura, F.Y.; Costa, J.A.; Travassos, B.; Ortuño, D.; Pino-Ortega, J. Intraindividual Relationships Between Training Loads and Heart-Rate Variability in High-Level Female Futsal Players: A Longitudinal Study. Int. J. Sports Physiol. Perform. 2023, 18, 306–312. [Google Scholar] [CrossRef] [PubMed]
- Flatt, A.A.; Esco, M.R. Endurance Performance Relates to Resting Heart Rate and Its Variability: A Case Study of a Collegiate Male Cross Country Athlete. J. Aust. Strength Cond. 2014, 22, 39–45. [Google Scholar]
- Le Meur, Y.; Pichon, A.; Schaal, K.; Schmitt, L.; Louis, J.; Gueneron, J.; Vidal, P.P.; Hausswirth, C. Evidence of Parasympathetic Hyperactivity in Functionally Overreached Athletes. Med. Sci. Sports Exerc. 2013, 45, 2061–2071. [Google Scholar] [CrossRef]
- Figueiredo, D.H.; Moreira, A.; Gonçalves, H.R.; Stanganelli, L.C.R. Effect of Overload and Tapering on Individual Heart Rate Variability, Stress Tolerance, and Intermittent Running Performance in Soccer Players During a Preseason. J. Strength Cond. Res. 2019, 33, 1222–1231. [Google Scholar] [CrossRef]
- Plews, D.J.; Laursen, P.B.; Kilding, A.E.; Buchheit, M. Heart-Rate Variability and Training-Intensity Distribution in Elite Rowers. Int. J. Sports Physiol. Perform. 2014, 9, 1026–1032. [Google Scholar] [CrossRef]
- Flatt, A.A.; Howells, D. Effects of Varying Training Load on Heart Rate Variability and Running Performance among an Olympic Rugby Sevens Team. J. Sci. Med. Sport 2019, 22, 222–226. [Google Scholar] [CrossRef]
- Buckner, S.L.; Mouser, J.G.; Dankel, S.J.; Jessee, M.B.; Mattocks, K.T.; Loenneke, J.P. The General Adaptation Syndrome: Potential Misapplications to Resistance Exercise. J. Sci. Med. Sport 2017, 20, 1015–1017. [Google Scholar] [CrossRef]
- Bellinger, P. Functional Overreaching in Endurance Athletes: A Necessity or Cause for Concern? Sports Med. 2020, 50, 1059–1073. [Google Scholar] [CrossRef]
- Cardoos, N. Overtraining Syndrome. Curr. Sports Med. Rep. 2015, 14, 157–158. [Google Scholar] [CrossRef]
- Kreher, J.B. Diagnosis and Prevention of Overtraining Syndrome: An Opinion on Education Strategies. J. Sports Med. 2016, 7, 115–122. [Google Scholar] [CrossRef]
- Kim, H.-G.; Cheon, E.-J.; Bai, D.-S.; Lee, Y.H.; Koo, B.-H. Stress and Heart Rate Variability: A Meta-Analysis and Review of the Literature. Psychiatry Investig. 2018, 15, 235–245. [Google Scholar] [CrossRef]
- Teisala, T.; Mutikainen, S.; Tolvanen, A.; Rottensteiner, M.; Leskinen, T.; Kaprio, J.; Kolehmainen, M.; Rusko, H.; Kujala, U.M. Associations of Physical Activity, Fitness, and Body Composition with Heart Rate Variability-Based Indicators of Stress and Recovery on Workdays: A Cross-Sectional Study. J. Occup. Med. Toxicol. 2014, 9, 16. [Google Scholar] [CrossRef] [PubMed]
- Lundstrom, C.J.; Foreman, N.A.; Biltz, G. Practices and Applications of Heart Rate Variability Monitoring in Endurance Athletes. Int. J. Sports Med. 2023, 44, 9–19. [Google Scholar] [CrossRef]
- Casanova-Lizón, A.; Manresa-Rocamora, A.; Sarabia, J.M.; Pastor, D.; Javaloyes, A.; Peña-González, I.; Moya-Ramón, M. Impact of Heart Rate Variability-Based Exercise Prescription: Self-Guided by Technology and Trainer-Guided Exercise in Sedentary Adults. Front. Sports Act. Living 2025, 7, 1578478. [Google Scholar] [CrossRef] [PubMed]
- Navarro-Lomas, G.; de la O, A.; Jurado-Fasoli, L.; Castillo, M.J.; Femia, P.; Amaro-Gahete, F.J. Assessment of Autonomous Nerve System Through Non-Linear Heart Rate Variability Outcomes in Sedentary Healthy Adults. PeerJ 2020, 8, e10178. [Google Scholar] [CrossRef]
- Naranjo Orellana, J.; de la Cruz Torres, B.; Sarabia Cachadiña, E.; de Hoyo, M.; Domínguez Cobo, S. Two New Indexes for the Assessment of Autonomic Balance in Elite Soccer Players. Int. J. Sports Physiol. Perform. 2015, 10, 452–457. [Google Scholar] [CrossRef] [PubMed]
- Esco, M.R.; Williford, H.N.; Flatt, A.A.; Freeborn, T.J.; Nakamura, F.Y. Ultra-Shortened Time-Domain HRV Parameters at Rest and Following Exercise in Athletes: An Alternative to Frequency Computation of Sympathovagal Balance. Eur. J. Appl. Physiol. 2018, 118, 175–184. [Google Scholar] [CrossRef] [PubMed]
- Bulte, K.R.; Bruce, L.; Hammond, K.; Corrigan, S.L.; Main, L.C. Use of Heart-Rate Variability to Examine Readiness to Perform in Response to Overload and Taper in Swimmers. Int. J. Sports Physiol. Perform. 2025, 20, 918–924. [Google Scholar] [CrossRef] [PubMed]
- Csathó, Á.; van der Linden, D.; Matuz, A. Change in Heart Rate Variability with Increasing Time-on-Task as a Marker for Mental Fatigue: A Systematic Review. Biol. Psychol. 2024, 185, 108727. [Google Scholar] [CrossRef] [PubMed]
- Pham, T.; Lau, Z.J.; Chen, S.H.A.; Makowski, D. Heart Rate Variability in Psychology: A Review of HRV Indices and an Analysis Tutorial. Sensors 2021, 21, 3998. [Google Scholar] [CrossRef]
- Salazar-Martínez, E.; Naranjo-Orellana, J.; Sarabia-Cachadiña, E. Heart Rate Variability: Obtaining the Stress Score from SDNN Values. Isokinet. Exerc. Sci. 2024, 32, 301–307. [Google Scholar] [CrossRef]
- Miranda-Mendoza, J.; Reynoso-Sánchez, L.F.; Hoyos-Flores, J.R.; Quezada-Chacón, J.T.; Naranjo, J.; Rangel-Colmenero, B.; Hernández-Cruz, G. Stress Score and lnRMSSD as Internal Load Parameters During Competition. Rev. Int. Med. Cienc. Act. Fís. Deporte 2020, 20, 21–35. [Google Scholar] [CrossRef]
- Fields, A.D.; Mohammadnabi, M.A.; Fedewa, M.V.; Esco, M.R. Modified Stress Score and Sympathetic:Parasympathetic Ratio Using Ultrashort-Term HRV in Athletes: A Novel Approach to Autonomic Monitoring. J. Funct. Morphol. Kinesiol. 2025, 10, 310. [Google Scholar] [CrossRef]
- Boullosa, D.; Medeiros, A.R.; Flatt, A.A.; Esco, M.R.; Nakamura, F.Y.; Foster, C. Relationships Between Workload, Heart Rate Variability, and Performance in a Recreational Endurance Runner. J. Funct. Morphol. Kinesiol. 2021, 6, 30. [Google Scholar] [CrossRef]
- Stanley, J.; Peake, J.M.; Buchheit, M. Consecutive Days of Cold Water Immersion: Effects on Cycling Performance and Heart Rate Variability. Eur. J. Appl. Physiol. 2013, 113, 371–384. [Google Scholar] [CrossRef]
- Rabbani, A.; Clemente, F.M.; Kargarfard, M.; Chamari, K. Match Fatigue Time-Course Assessment Over Four Days: Usefulness of the Hooper Index and Heart Rate Variability in Professional Soccer Players. Front. Physiol. 2019, 10, 109. [Google Scholar] [CrossRef]
- Hooper, S.L.; Mackinnon, L.T.; Howard, A.; Gordon, R.D.; Bachmann, A.W. Markers for Monitoring Overtraining and Recovery. Med. Sci. Sports Exerc. 1995, 27, 106–112. [Google Scholar] [CrossRef]
- Nässi, A.; Ferrauti, A.; Meyer, T.; Pfeiffer, M.; Kellmann, M. Development of Two Short Measures for Recovery and Stress in Sport. Eur. J. Sport Sci. 2017, 17, 894–903. [Google Scholar] [CrossRef]
- Kenttä, G.; Hassmén, P. Overtraining and Recovery: A Conceptual Model. Sports Med. 1998, 26, 1–16. [Google Scholar] [CrossRef]
- González-Boto, R.; Salguero, A.; Tuero, C.; Márquez, S.; Kellmann, M. Spanish Adaption and Analysis by Structural Equation Modeling of an Instrument for Monitoring Overtraining: The Recovery-Stress Questionnaire (RESTQ-Sport). Soc. Behav. Pers. 2008, 36, 635–650. [Google Scholar] [CrossRef]
- McLean, K.N.; Mallett, C.J.; Newcombe, P. Assessing Coach Motivation: The Development of the Coach Motivation Questionnaire (CMQ). J. Sport Exerc. Psychol. 2012, 34, 184–207. [Google Scholar] [CrossRef] [PubMed]
- Stephenson, M.D.; Thompson, A.G.; Merrigan, J.J.; Stone, J.D.; Hagen, J.A. Applying Heart Rate Variability to Monitor Health and Performance in Tactical Personnel: A Narrative Review. Int. J. Environ. Res. Public Health 2021, 18, 8143. [Google Scholar] [CrossRef] [PubMed]
- Liu, S.; Willoughby, J.F. Do Fitness Apps Need Text Reminders? An Experiment Testing Goal-Setting Text Message Reminders to Promote Self-Monitoring. J. Health Commun. 2018, 23, 379–386. [Google Scholar] [CrossRef] [PubMed]
- Fjeldsoe, B.S.; Marshall, A.L.; Miller, Y.D. Behavior Change Interventions Delivered by Mobile Telephone Short-Message Service. Am. J. Prev. Med. 2009, 36, 165–173. [Google Scholar] [CrossRef]
- Thorpe, R.T.; Atkinson, G.; Drust, B.; Gregson, W. Monitoring Fatigue Status in Elite Team-Sport Athletes: Implications for Practice. Int. J. Sports Physiol. Perform. 2017, 12, S227–S234. [Google Scholar] [CrossRef]
- Hernando, D.; Roca, S.; Sancho, J.; Alesanco, Á.; Bailón, R. Validation of the Apple Watch for Heart Rate Variability Measurements During Relax and Mental Stress in Healthy Subjects. Sensors 2018, 18, 2619. [Google Scholar] [CrossRef]
- Giles, D.; Draper, N.; Neil, W. Validity of the Polar V800 Heart Rate Monitor to Measure RR Intervals at Rest. Eur. J. Appl. Physiol. 2016, 116, 563–571. [Google Scholar] [CrossRef] [PubMed]
- Tarvainen, M.P.; Niskanen, J.P.; Lipponen, J.A.; Ranta-Aho, P.O.; Karjalainen, P.A. Kubios HRV—Heart Rate Variability Analysis Software. Comput. Methods Programs Biomed. 2014, 113, 210–220. [Google Scholar] [CrossRef] [PubMed]


Disclaimer/Publisher’s Note: The statements, opinions and data contained in all publications are solely those of the individual author(s) and contributor(s) and not of MDPI and/or the editor(s). MDPI and/or the editor(s) disclaim responsibility for any injury to people or property resulting from any ideas, methods, instructions or products referred to in the content. |
© 2025 by the authors. Licensee MDPI, Basel, Switzerland. This article is an open access article distributed under the terms and conditions of the Creative Commons Attribution (CC BY) license.