1. Introduction
Numerical simulation was first applied to model one-dimensional unstable radial and linear flow [
1,
2]. With the enhancement of computing capabilities, Clough et al. [
3] first applied finite element software to pit engineering, proposing the parameterized finite element method and concluding that optimizing support structure parameters can effectively reduce the horizontal displacement of retaining structures. Numerical simulation effectively models the interaction between soil and support structures during the excavation of pits [
4,
5,
6,
7,
8] and offers excellent three-dimensional (3D) visualization effects. Neural networks in pit deformation monitoring, with field monitoring data as the learning object, are relatively simple to model, and the prediction results are more refined on the time scale [
9,
10,
11,
12,
13]. Currently, most scholars studying deformation predictions of deep pits caused by excavation solely use either numerical simulation or machine learning methods. Single analysis methods have certain limitations in addressing the complex geological environments and engineering characteristics of deep pit projects.
The method of parametric inverse analysis is widely used in engineering and slope engineering under complex geological conditions [
14,
15,
16,
17]. Zhang et al. used different theoretical methods to analyze the distribution law of soil pressure on the side of the diaphragm wall and verified the applicability of the theoretical methods, which was in good agreement with the measured values [
18,
19], which provides a certain theoretical basis for this paper to use finite element numerical simulation to carry out parameter sensitivity analysis. Zhang et al. [
20] employed a design method for resisting the overturning of rigid retaining walls in unsaturated soil excavations and verified the applicability of the adopted approach. Ramakrishna Annapareddy et al. [
21] developed a novel method reliant on suction stress for calculating horizontal and vertical seismic acceleration profiles within backfilled soil, and they validated the feasibility of this method.
In recent years, to provide crucial technical support for the design and construction safety of pits, scholars have combined finite element numerical simulation with neural networks. By inverting soil layer parameters through neural network models, they have optimized input parameters for finite element software, achieving significant research outcomes [
22,
23,
24,
25,
26,
27,
28,
29,
30]. Ling et al. [
22] proposed an intelligent displacement back-analysis method based on improved PSO and BP neural networks. By integrating measured displacement data from surrounding rocks at the construction site, they successfully inverted the mechanical parameters of the tunnel surrounding rocks, demonstrating the feasibility of this method. Kwang et al. [
24] used actual displacement monitoring data and combined finite element and neural network methods to invert geotechnical parameters, obtaining optimal parameters and confirming the reliability of this method. Li et al. [
25] utilized the Mind Evolutionary Computation (MEC) algorithm to optimize initial weights and thresholds of BP neural networks, combined with finite element numerical simulation, proposed a soil layer parameter inversion analysis method based on horizontal displacement of pits and verified the stability and accuracy of the results. Wang et al. [
26], based on actual data from a subway tunnel, used a BP neural network to invert the physical and mechanical parameters of the soil. The calculated results were input into the MIDAS GTS NX software for forward numerical simulation, predicting deformations in subway tunnel structures due to excavation. Zou et al. [
27] used the finite difference numerical simulation software to conduct numerical simulation calculations for a deep pit of a station, built a training set based on the numerical simulation results, used the BP neural network to invert the formation parameters of the deep pit of the station, and applied the inversion parameters to the construction to verify the rationality of the method. Ma et al. [
28] designed 64 representative soil parameter combinations through orthogonal experiments, obtained the displacement value of each parameter combination through finite element numerical calculation, used the actual monitoring data to invert the soil parameter of dynamic deformation of the pit, obtained the deformation data of the next excavation stage, and verified the accuracy and feasibility of this method. Zhao et al. [
29] used PLAXIS finite element software to simulate and analyze the deformation characteristics of deep pit excavation and, combined with the Sparrow Search Algorithm BP(SSA-BP) neural network, proposed the parameter back analysis method of the HSS model in the Dalian area. The results showed that, under the premise of reasonable parameter selection. The finite element analysis results of the Hardening soil-Small (HSS) model considering the characteristics of Soil small strain were highly consistent with the actual deformation laws of the pit, which proved the rationality of the parameter reverse analysis.
Analysis of current research, both domestically and internationally, reveals that the accuracy of numerical simulations is greatly influenced by the input parameters of the soil layers, and the three-dimensional visualization effects of neural network predictions are suboptimal. At present, most scholars only invert specific soil layer parameters. However, during the excavation of deep pits, the spatial shape, excavation area, and depth of the pit are constantly changing. Therefore, it becomes particularly important to develop multifaceted coupled numerical simulation techniques that closely align with the practical realities of engineering projects.
This study is based on a deep pit project and conducts a sensitivity analysis of soil layer parameters. Using orthogonal testing, different parameter combinations are derived. These combinations are then utilized in PLAXIS 3D to compute displacement values at various sensor points, thus generating training samples. By leveraging the powerful nonlinear mapping capabilities of neural networks and the global optimization features of PSO and integrating actual onsite measurement values, the study successfully inverts the parameters of multiple soil layers. The inverted parameters are subsequently used as input parameters in PLAXIS 3D, enabling dynamic prediction throughout the entire excavation process of the pit.
2. Fundamental Principles
2.1. Displacement Calculation in PLAXIS 3D
PLAXIS 3D V20 Update 1 is a three-dimensional geological modeling and numerical analysis software based on the finite element method. In displacement calculations, the model is discretized into a finite number of elements, and a system of linear equations is solved to determine the displacement and stress state of each element. Based on the solutions obtained, the deformations of the soil and the retaining structures during the excavation process can be computed.
2.2. Neural Networks
2.2.1. BP Neural Networks
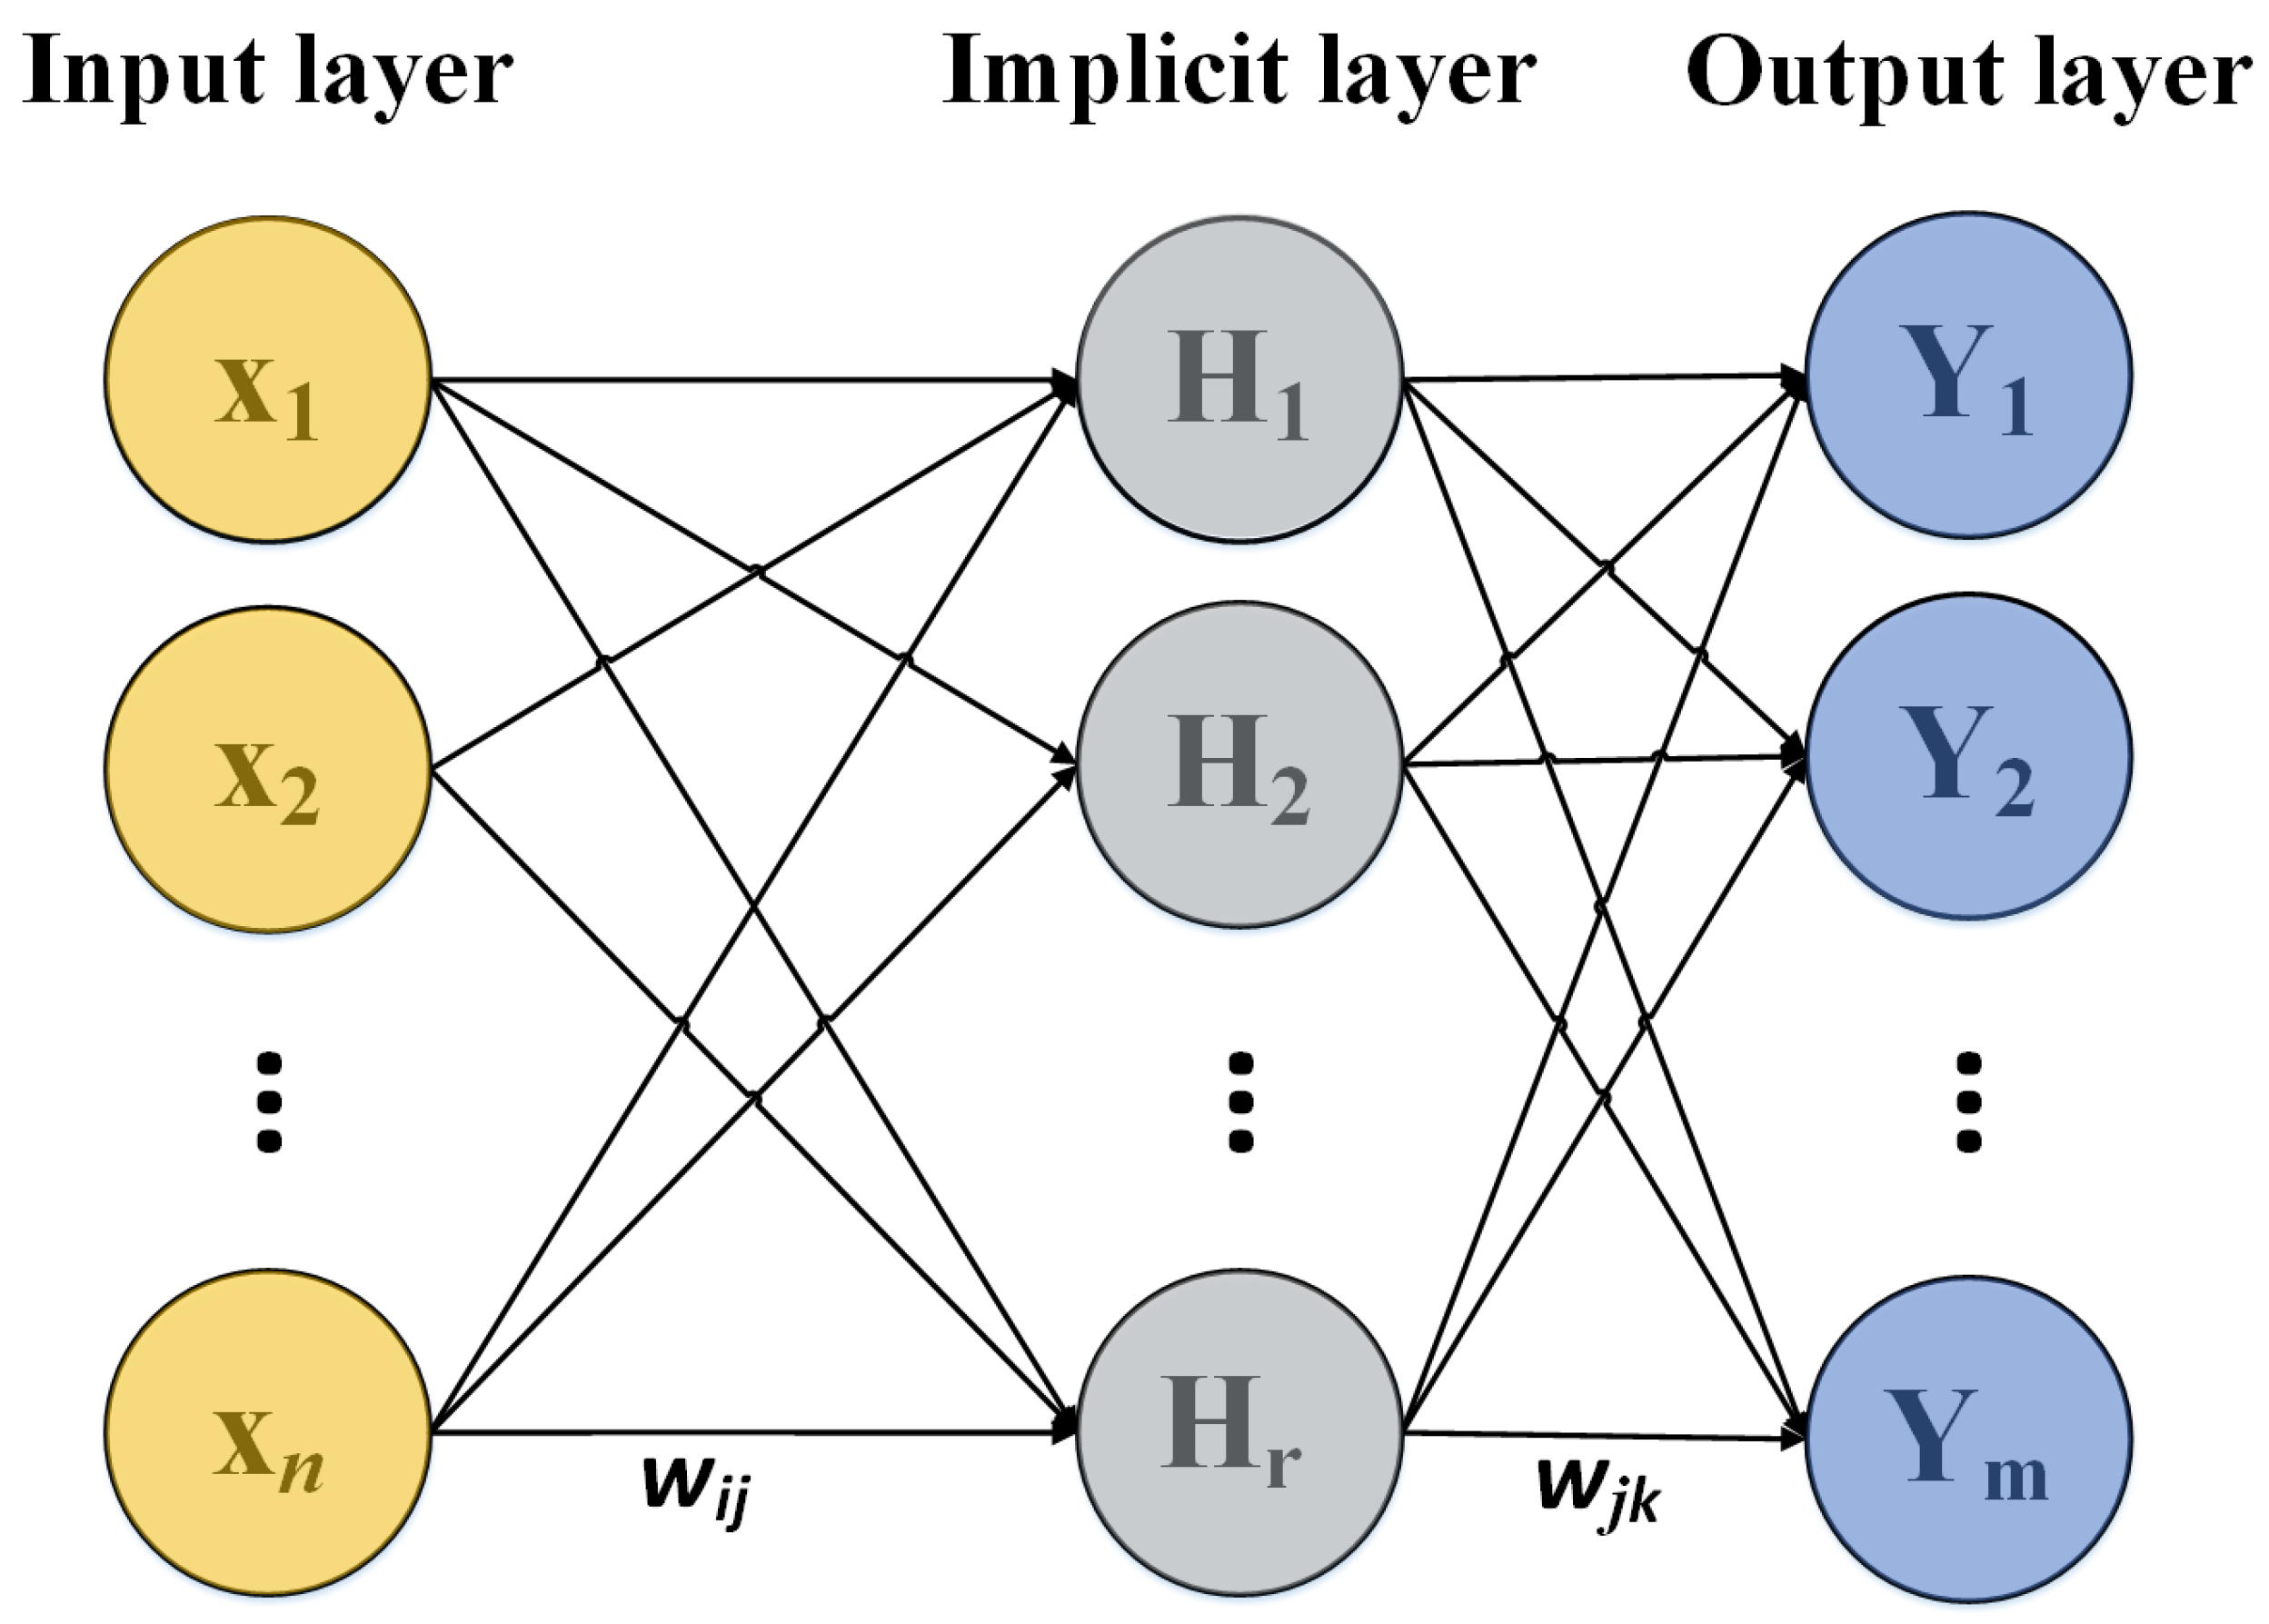
The BP neural network is a multi-layer feedforward neural network trained using the error backpropagation algorithm. It primarily consists of an input layer, hidden layers, and an output layer. The process of backpropagation in a BP neural network involves continuously adjusting the weights and thresholds based on the error values. The basic structure of the BP neural network is illustrated in
Figure 1.
In
Figure 1, the BP neural network’s input values are denoted as
, and the output values as
, the weights of the BP neural network are represented by
and
, while
represents the number of nodes in the input layer and
the number of nodes in the output layer. The specific training steps of the BP neural network are as follows:
Step 1: Network Initialization; assume the initial thresholds of the network are and ;
Step 2: Hidden Layer Output Calculation; the formula is as follows:
In the formula: and respectively represent the weights and thresholds between the input layer and the hidden layer of the BP neural network, represents the number of nodes in the hidden layer, and is the activation function of the hidden layer.
Step 3: Output Layer Calculation: the formula for calculating the neural network’s predictive output is as follows:
In the formula, and represent the connection weights and thresholds of the neural network, respectively.
Step 4: Error Calculation: the error
is calculated based on the predicted output
and the desired output
of the neural network. The calculation formula is as follows:
Step 5: Updating the Weights of the Input and Hidden Layers. Update the network connection weights
and
using the predicted error
from the BP neural network. The calculation formula is as follows:
In the formula: is the learning rate.
Step 6: Judge whether the algorithm is finished or not; otherwise, return to Step 2 until the end.
2.2.2. Particle Swarm Optimization (PSO)
The PSO is primarily inspired by observations of bird predation behavior. The principle of the algorithm is as follows:
Suppose there are
particles in D-dimensional space, with the position of the particle
given by
and velocity by
. The fitness value is calculated by inserting
into the objective function to assess the quality of the particle’s position. The optimal position during a single particle’s flight is denoted as
, comparing the flight experiences of all particles in the population, and the best group position is determined as
,
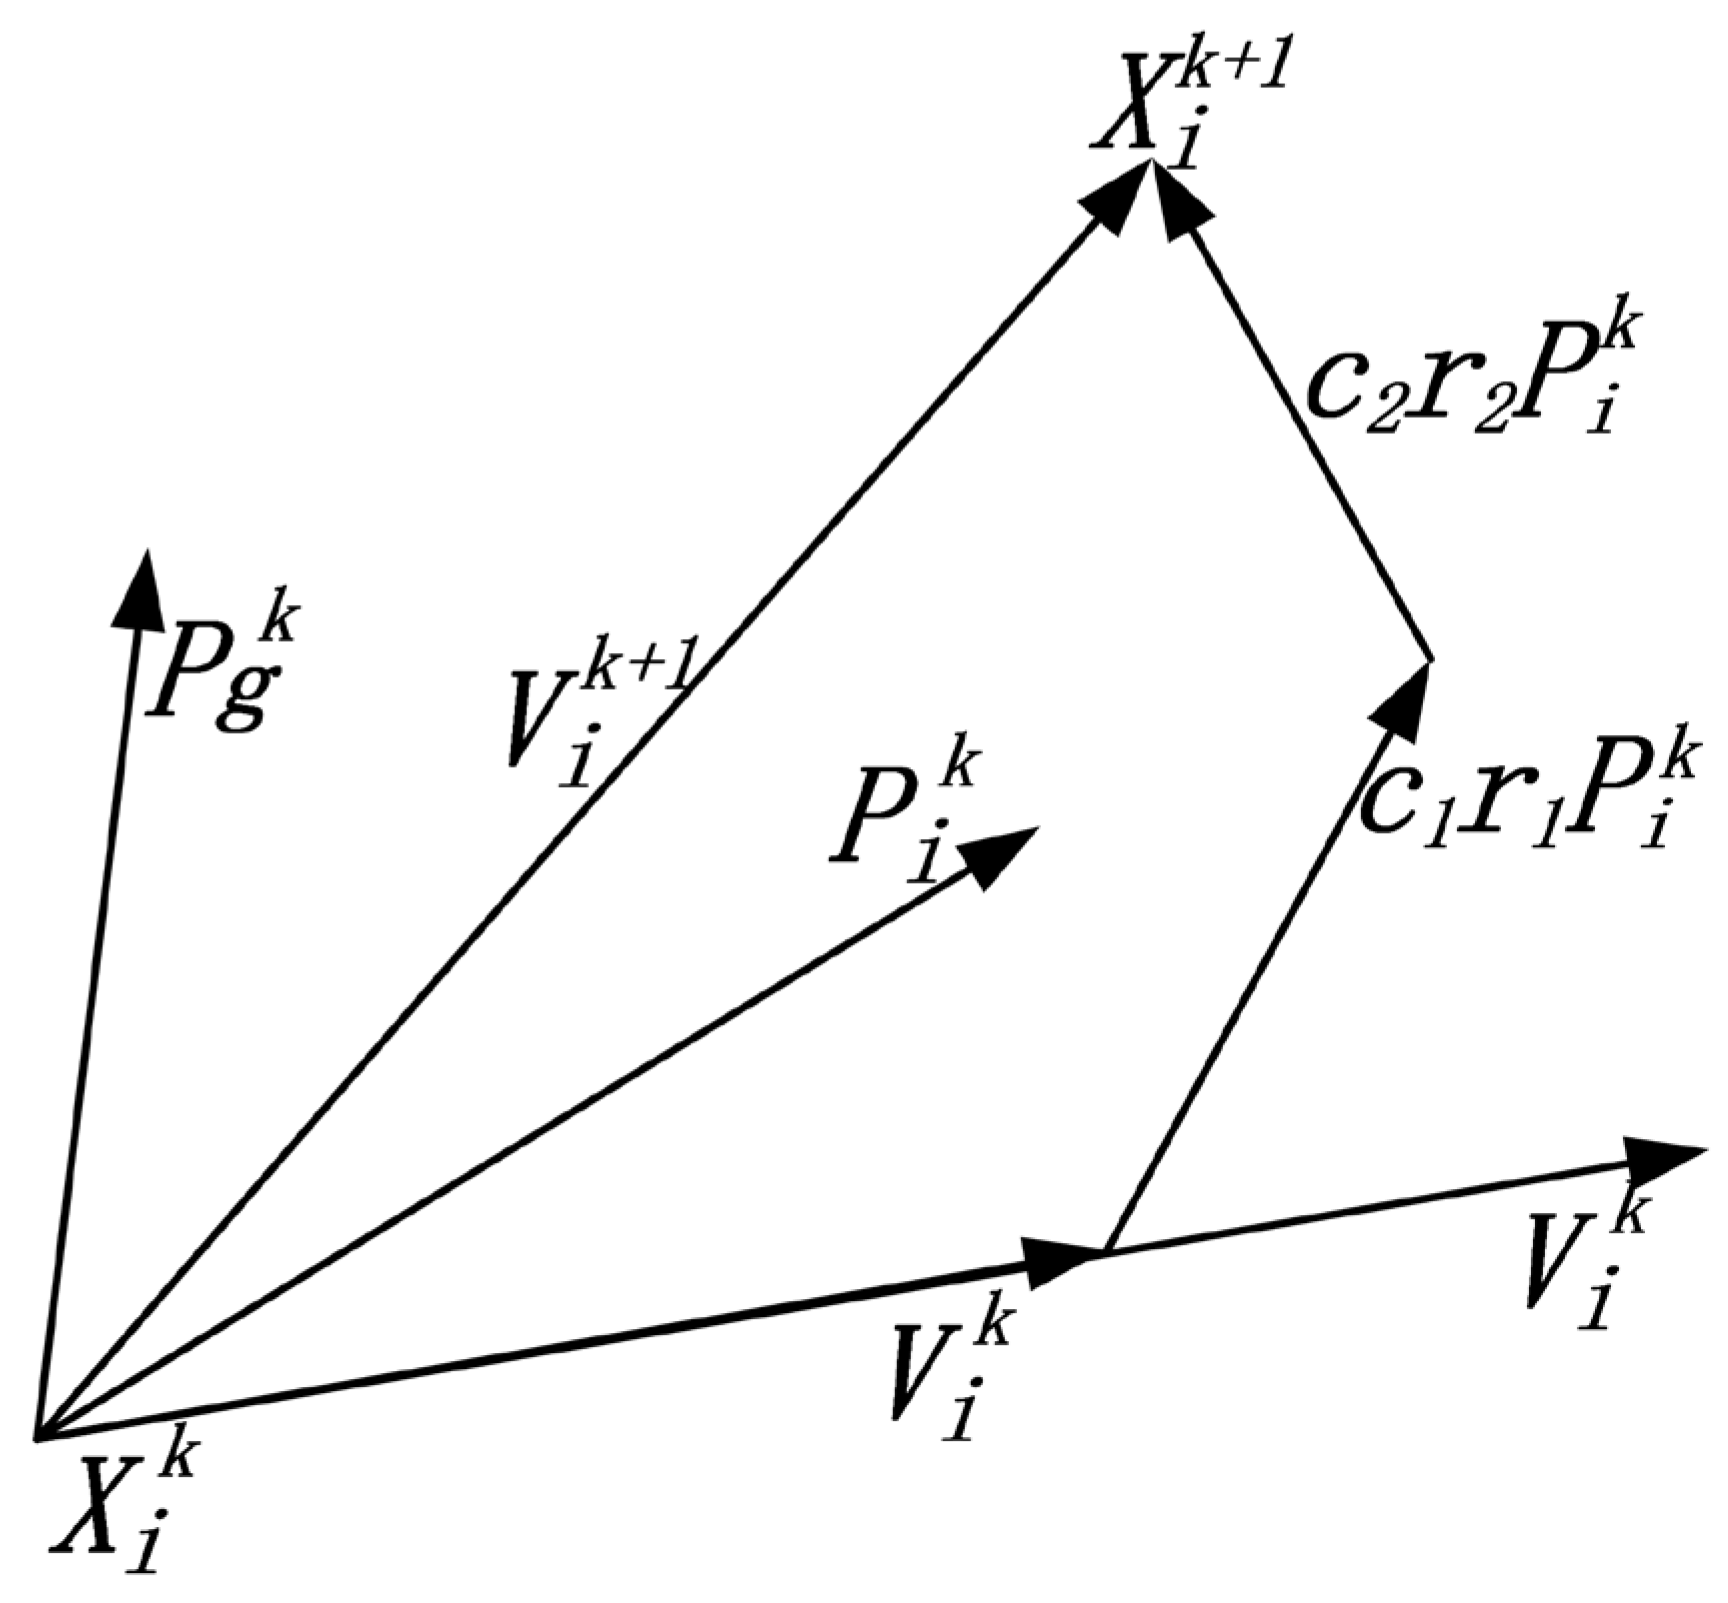
. Each particle updates its velocity and position according to Formulas (5) and (6). The schematic diagram of particle position updates is shown in
Figure 2.
In the formula, is the inertia weight factor, is the learning factor, is a random number in the interval [0,1], and is the number of iterations.
Formula (5) indicates that the velocity update for particle is primarily determined by three factors: the velocity of particle at the previous moment, labeled as ; the distance between the current position of particle and its optimal position, denoted as ; and the distance between the current position of particle and the overall best position, marked as .
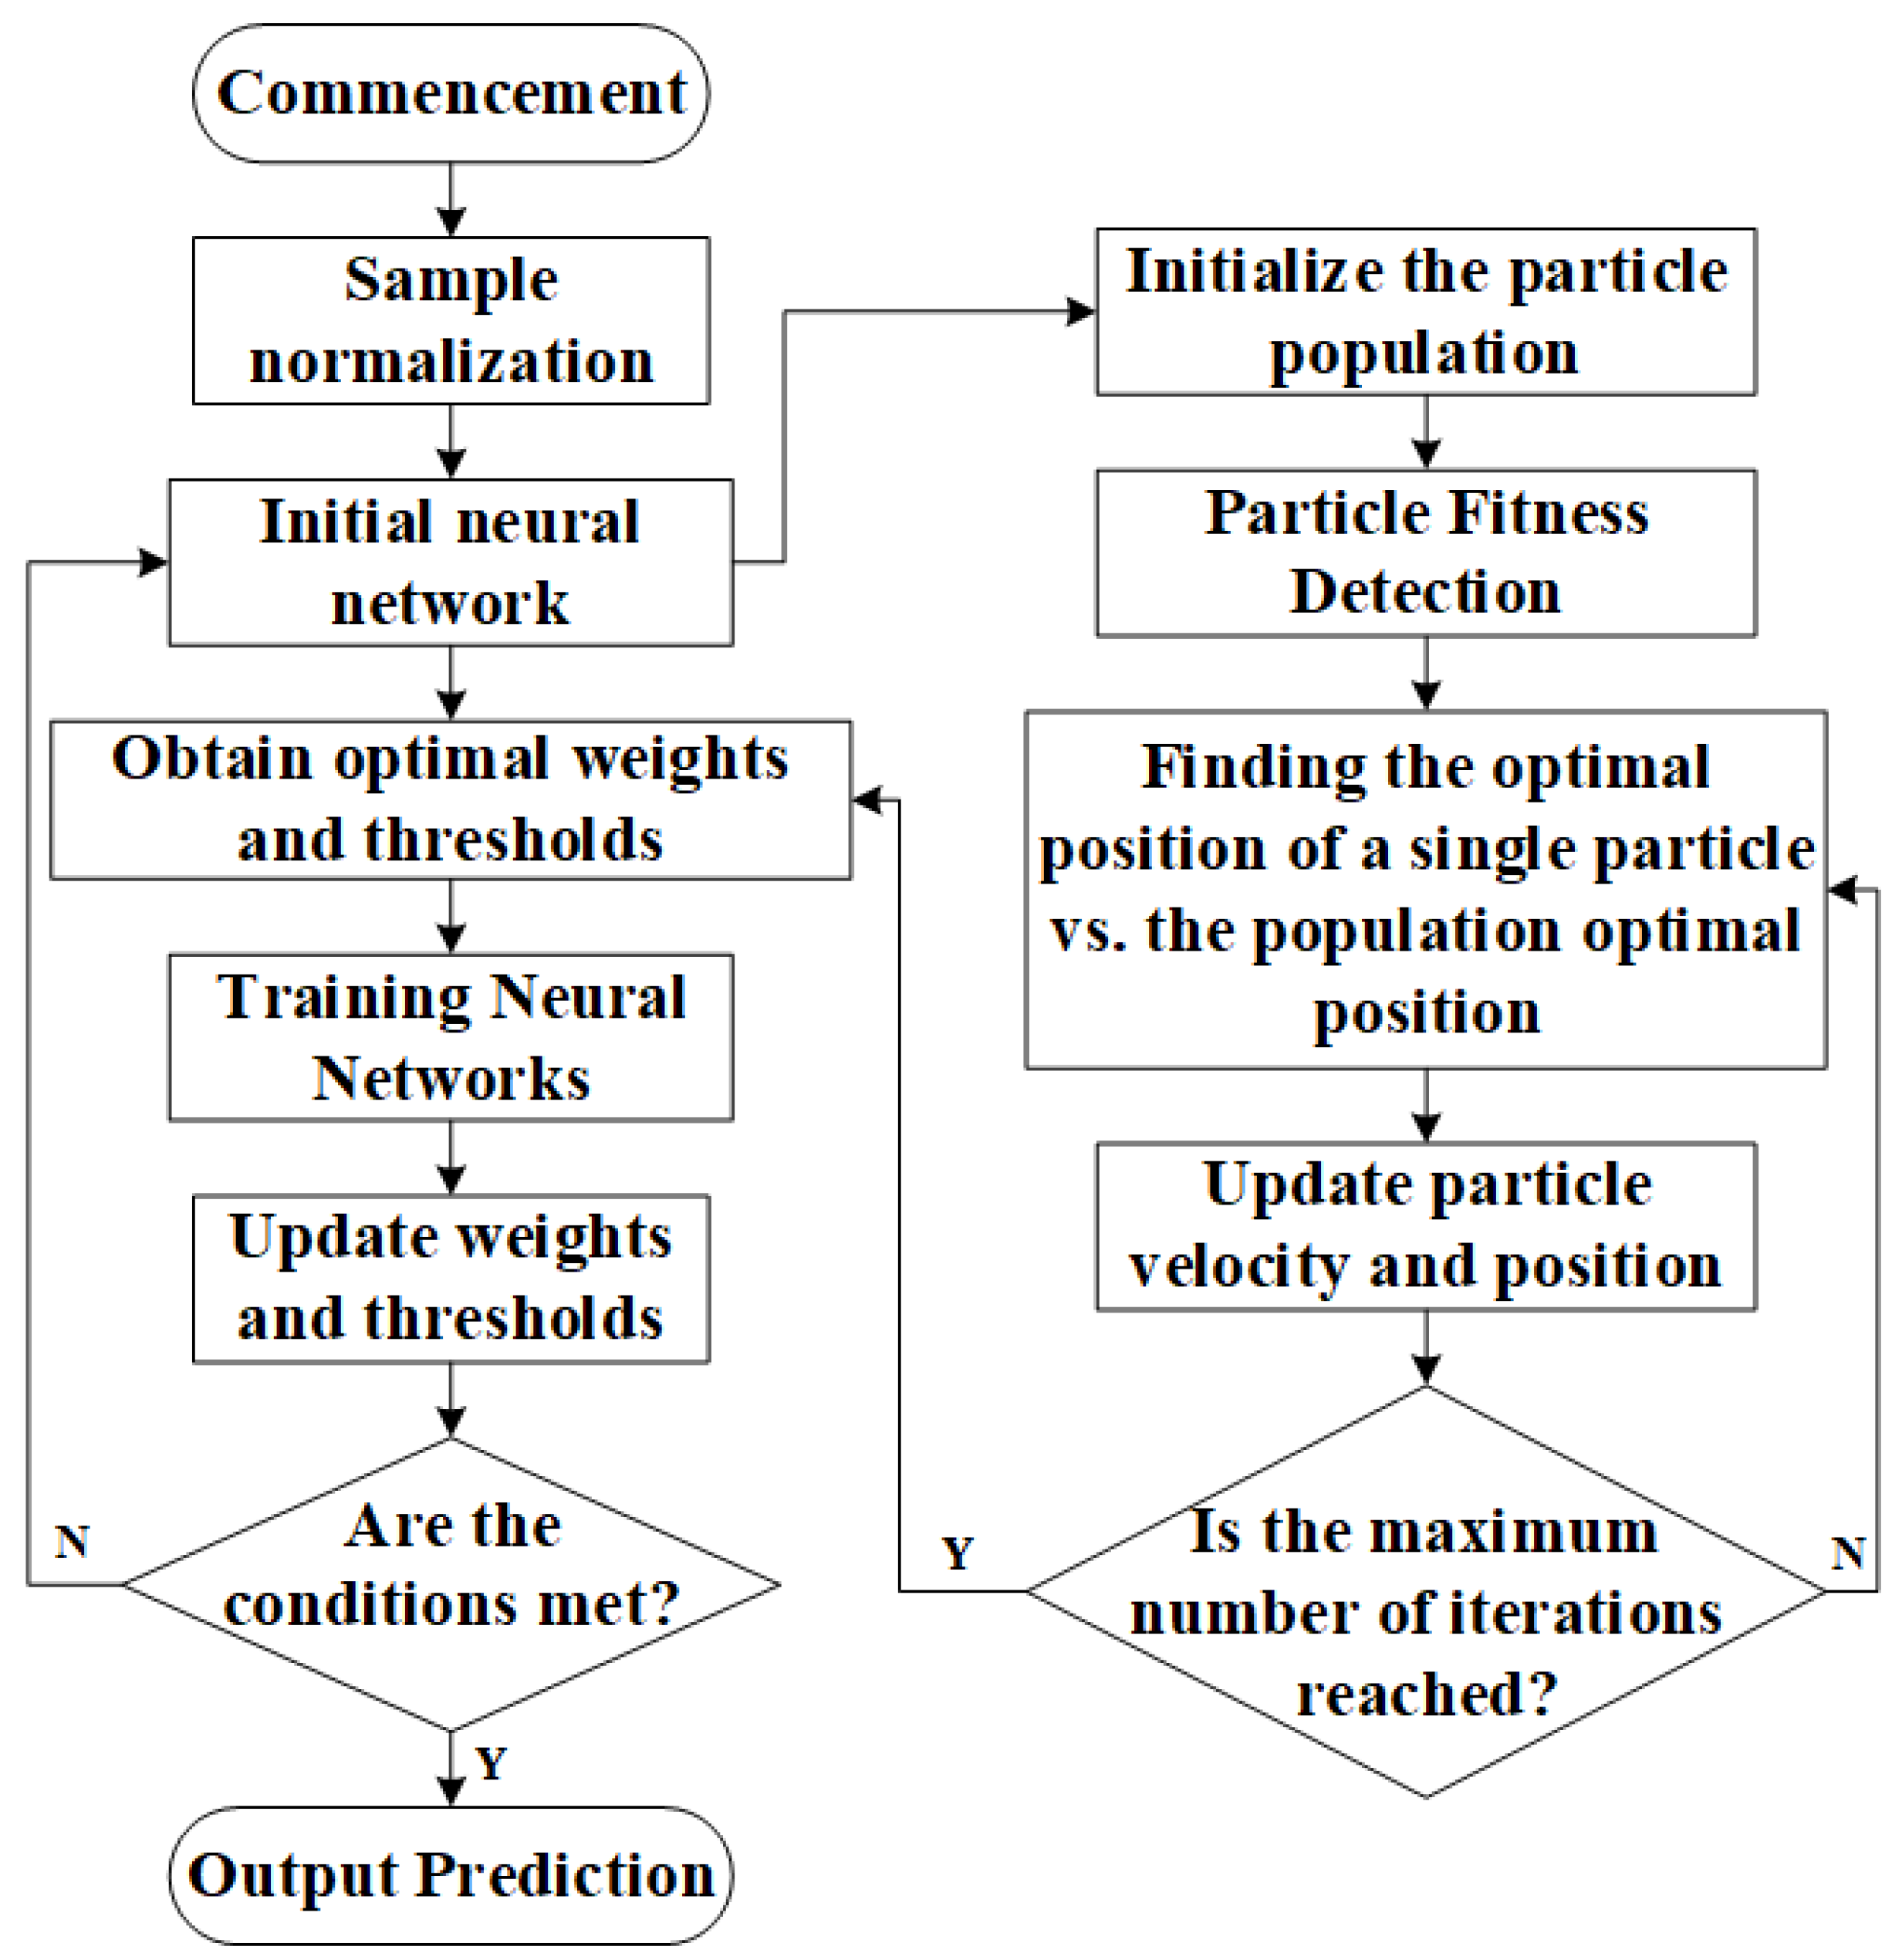
2.2.3. PSO-BP Neural Networks
PSO is a straightforward and easy-to-implement method for parameter tuning, primarily focused on searching for the optimal initial weights and thresholds. To address issues such as significant errors and the tendency of traditional BP neural networks to converge to local minima, PSO is employed to optimize BP neural networks. The implementation process of the algorithm is illustrated in
Figure 3.
2.3. Inversion of Soil Layer Parameters
Utilizing the powerful nonlinear mapping capabilities of neural networks along with the global optimization features of PSO enables accurate and rapid determination of soil layer parameter values. The steps of the parameter inversion method adopted in this study are as follows:
Step 1: Sample Collection
Through orthogonal experimentation, different parameter value combinations are obtained. PLAXIS 3D is used to calculate displacement values at sensor points under these different parameter combinations, generating displacement data for each parameter group, which serve as training samples for the neural network.
Step 2: Construction of Nonlinear Function Relationships
Machine learning algorithms are written by using MATLAB V9.10 software. To accelerate the convergence of the neural network, input data are normalized, and output data are reverse normalized. The number of nodes in the hidden layer is determined, and a transfer function suitable for each set of parameters and their corresponding displacement values is defined.
Step 3: Sample Output and Testing
Displacement values measured at specific sensor points under a certain working condition are used as input samples. The output parameter combinations, which are the inverted soil layer parameters, are then used to update the input parameters in PLAXIS 3D and perform calculations to predict deformations for the next working condition.
3. Engineering Overview
3.1. Excavation Profile
The pit is irregular, with a total area of approximately 8000 m2. The excavation depth of the pit ranges from 10.95 m to 11.90 m, with a maximum length of 103.5 m and a maximum width of 80 m. Ground elevations around the site are set at −0.300 m (relative elevation). The top elevation of the basement floor slab in the second basement is −9.95 m., with a thickness of 0.8 m and a cushion layer thickness of 0.1 m. The bottom elevation of the basement floor cushion layer is −10.85 m. The thickness of the bearing platform at the edge of the pit is 1.2 m and 1.8 m, respectively, with the bottom elevation of the platform cushion layer ranging from −11.25 m to −11.85 m. The bottom elevation of the cushion layer of the partial edge sump floor is −12.20 m. The excavation depth of the elevator pits in the water collecting wells and other pits within the pit ranges from 0.85 m to 3.45 m. Based on the severity of the impact on the surrounding environment and underground structures due to the excavation depth, support structure damage, soil instability, or excessive deformation, the safety level of this pit is classified as Grade I.
3.2. Geological Conditions
The maximum depth of exploration is 90.75 m below the natural ground surface of the site, and the soils at the shallow depth, except for the soil fill, consist of the Quaternary Holocene to Middle to Late Pleistocene alluvial to lacustrine clastic sediments. The survey report shows that the soil layer around the pit from the top down is 1-1 plain fill, 1-2 plain fill, 3 clay, 4-1 silty clay, 4-2silt with silt-sand. The physical and mechanical parameters of each soil layer are listed in
Table 1, and a typical geological profile is shown in
Figure 4.
3.3. Hydrogeological Conditions
The surface water system in the area is well-developed, with a dense network of rivers and lakes. The fluctuations in river and lake water levels generally correspond to the inter-annual and intra-annual variations in precipitation, albeit with some lag. The groundwater level remains consistently higher than the surface water level, exhibiting the characteristic of unidirectional discharge into rivers and lakes. Shallow confined aquifers exist in the silt and fine sand layers, and their dynamics are influenced by factors such as atmospheric precipitation, topography, and surface water bodies, exhibiting characteristics of precipitation-induced fluctuations. Pre-excavation precipitation measures are undertaken, and the groundwater types relevant to this project mainly include phreatic water and micro-confined water. Refer to the typical geological section in
Figure 4 for details.
3.4. Surrounding Environment and Protection Scheme
To the east of the pit lies an approximately 8.0 m wide municipal road, while at the northeast corner stands a 15-story existing building; the nearest distance from the proposed pit is 5.0 m. The southern and western sides of the site are bordered by municipal roads, and to the north, there are municipal roads and a market building.
The protection system for this pit involves the use of a bored pile/biting pile combined with two layers of reinforced concrete internal support. The piles are treated with shotcrete protection, supplemented by fully enclosed Cutter Soil Mixing cement-soil mixed curtain walls for waterproofing. The bored piles are constructed flush with the inner side of the excavation, with a clear spacing of 0.2 m between piles and a 0.2 m clear spacing between the cement-soil mixed curtain wall and the bored piles. The support system utilizes bracing, counter-bracing, and edge trusses, along with steel columns supplemented by bored piles as the vertical support structure for the horizontal support system. Drainage in the pit using pipe wells to evacuate dry precipitation and open ditch catchment wells to pump water. The bored piles and biting piles are constructed using underwater C30 concrete, while the crown beams, wale, support beams, and biting file guide walls are constructed with C30 concrete and the sprayed concrete surface layer with C20. Reinforcement bars are of HPB300 and HRB400 grades, and the cement is P.O42.5 ordinary Portland cement.
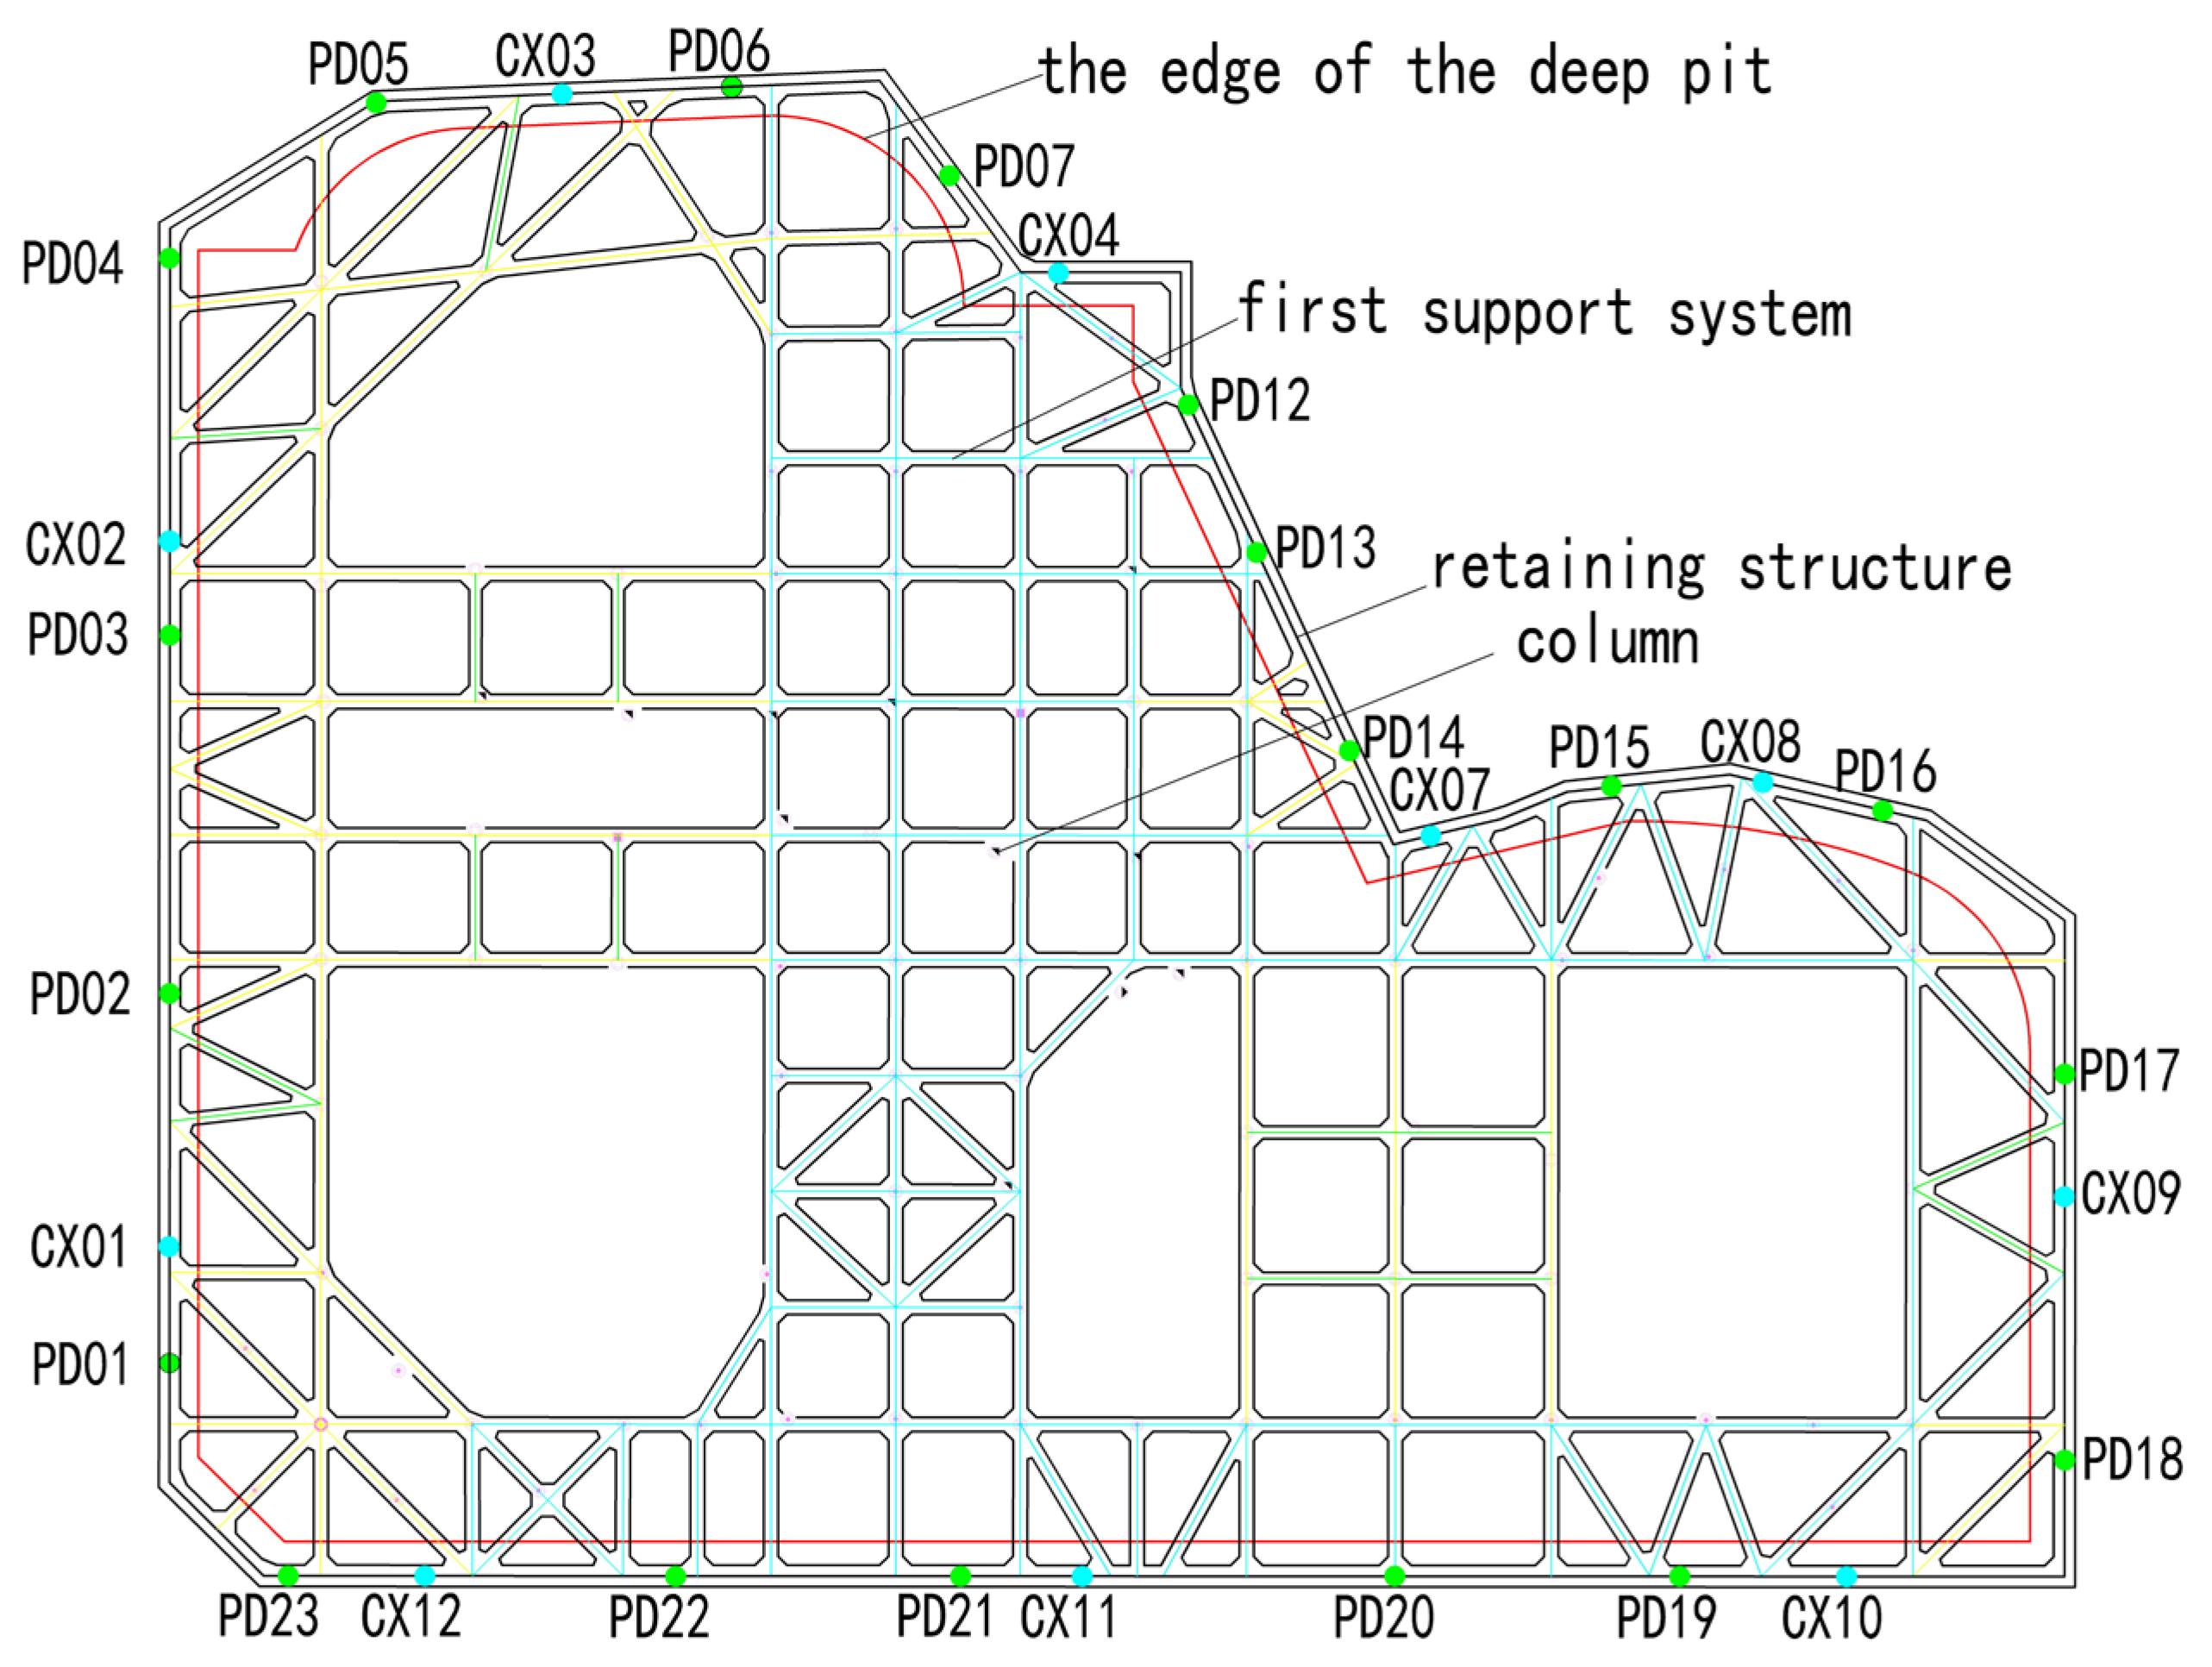
3.5. Pit Monitoring Design
Monitoring focuses on the pit support structure, the bottom and surrounding soil of the pit, surrounding buildings, relevant pipelines and facilities, municipal structures, groundwater conditions, and important surrounding roads. Monitoring continues until the completion of the pit, with a frequency of once per day. This study primarily calculates the vertical displacements of pile tops (PD01–PD23) and the deep horizontal displacements of piles (CX01–CX12) to assess whether the accuracy of numerical simulation predictions improves after parameter inversion. Vertical displacement monitoring employs the leveling method using an electronic level; deep horizontal displacement monitoring of the support structure utilizes inclinometers, with the bottom of the inclinometer casing serving as the reference point for monitoring the deformation of the support structure. The layout of the pit plan and monitoring points is illustrated in
Figure 5.
4. Numerical Simulation Results and Sensitivity Analysis of Parameters
4.1. Finite Element Model
The dimensions of the finite element model were determined according to specifications and reference to similar engineering experiences, considering the influence of hydrogeological conditions and in conjunction with engineering background materials. The model dimensions were set at 340 m × 280 m × 100 m. The establishment of the model incorporated the actual excavation process of the pit and the constitutive relationship of the soil adopted the small strain HSS model. Plate elements in PLAXIS 3D can withstand vertical loads and possess the ability to resist bending and elastic deformation. Therefore, plate elements were used to simulate the support of the row pile. The thickness of the plate element was calculated to be 0.7 m using the formula for stiffness equivalent conversion Equation (7). Interface elements were used to simulate the waterproof curtain and the interaction between the soil and the structure. The boundary of the pit was assumed to be impermeable. Internal support using steel support equivalent reinforced concrete internal support and embedded beam elements were used to simulate the vertical support structure of the horizontal support system.
In the Equation, represents the pile spacing, represents the pile diameter, and represents the equivalent thickness.
In the HSS constitutive model, the soil stiffness parameters, including the reference stiffness modulus
, modulus of unloading and reloading
, and reference tangent modulus
, are derived from laboratory soil compression modulus tests. The relationship among these parameters [
31] is referenced from Equation (8):
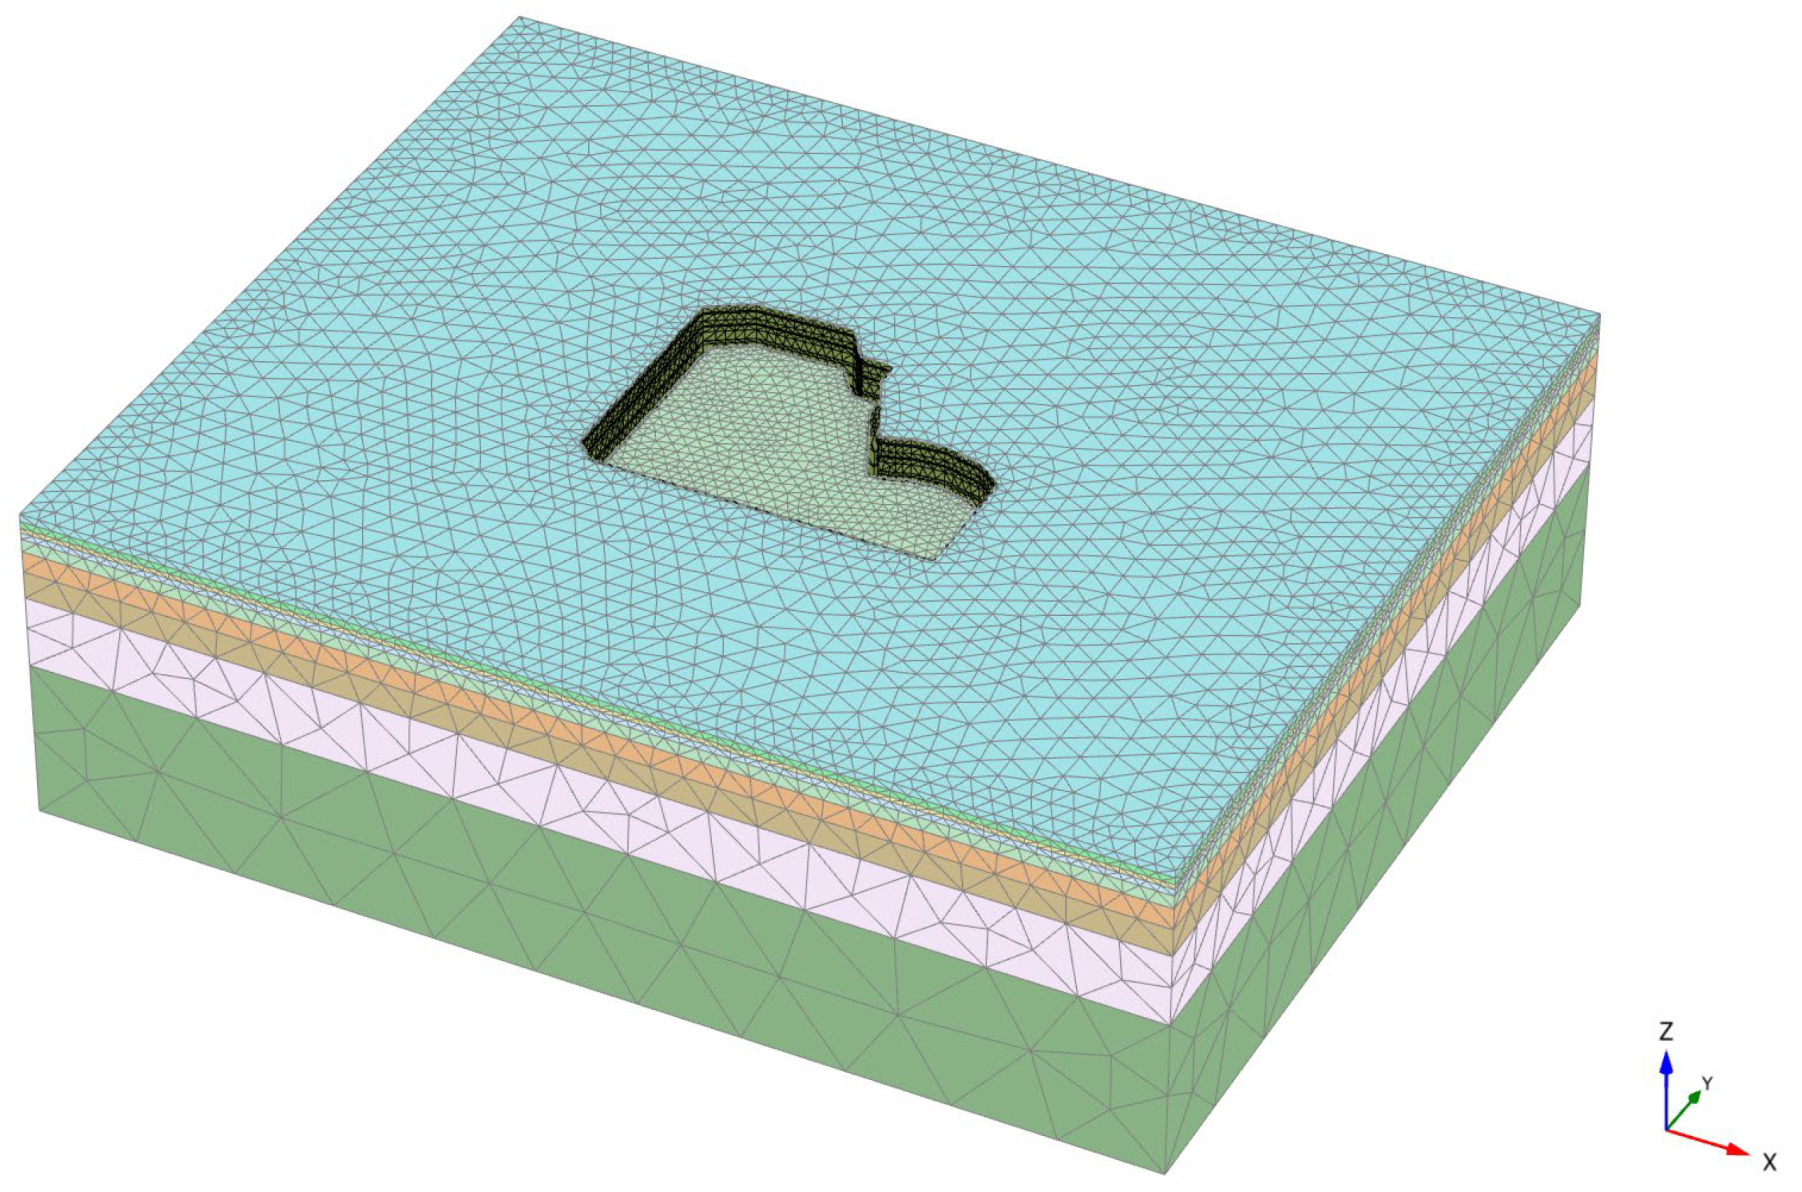
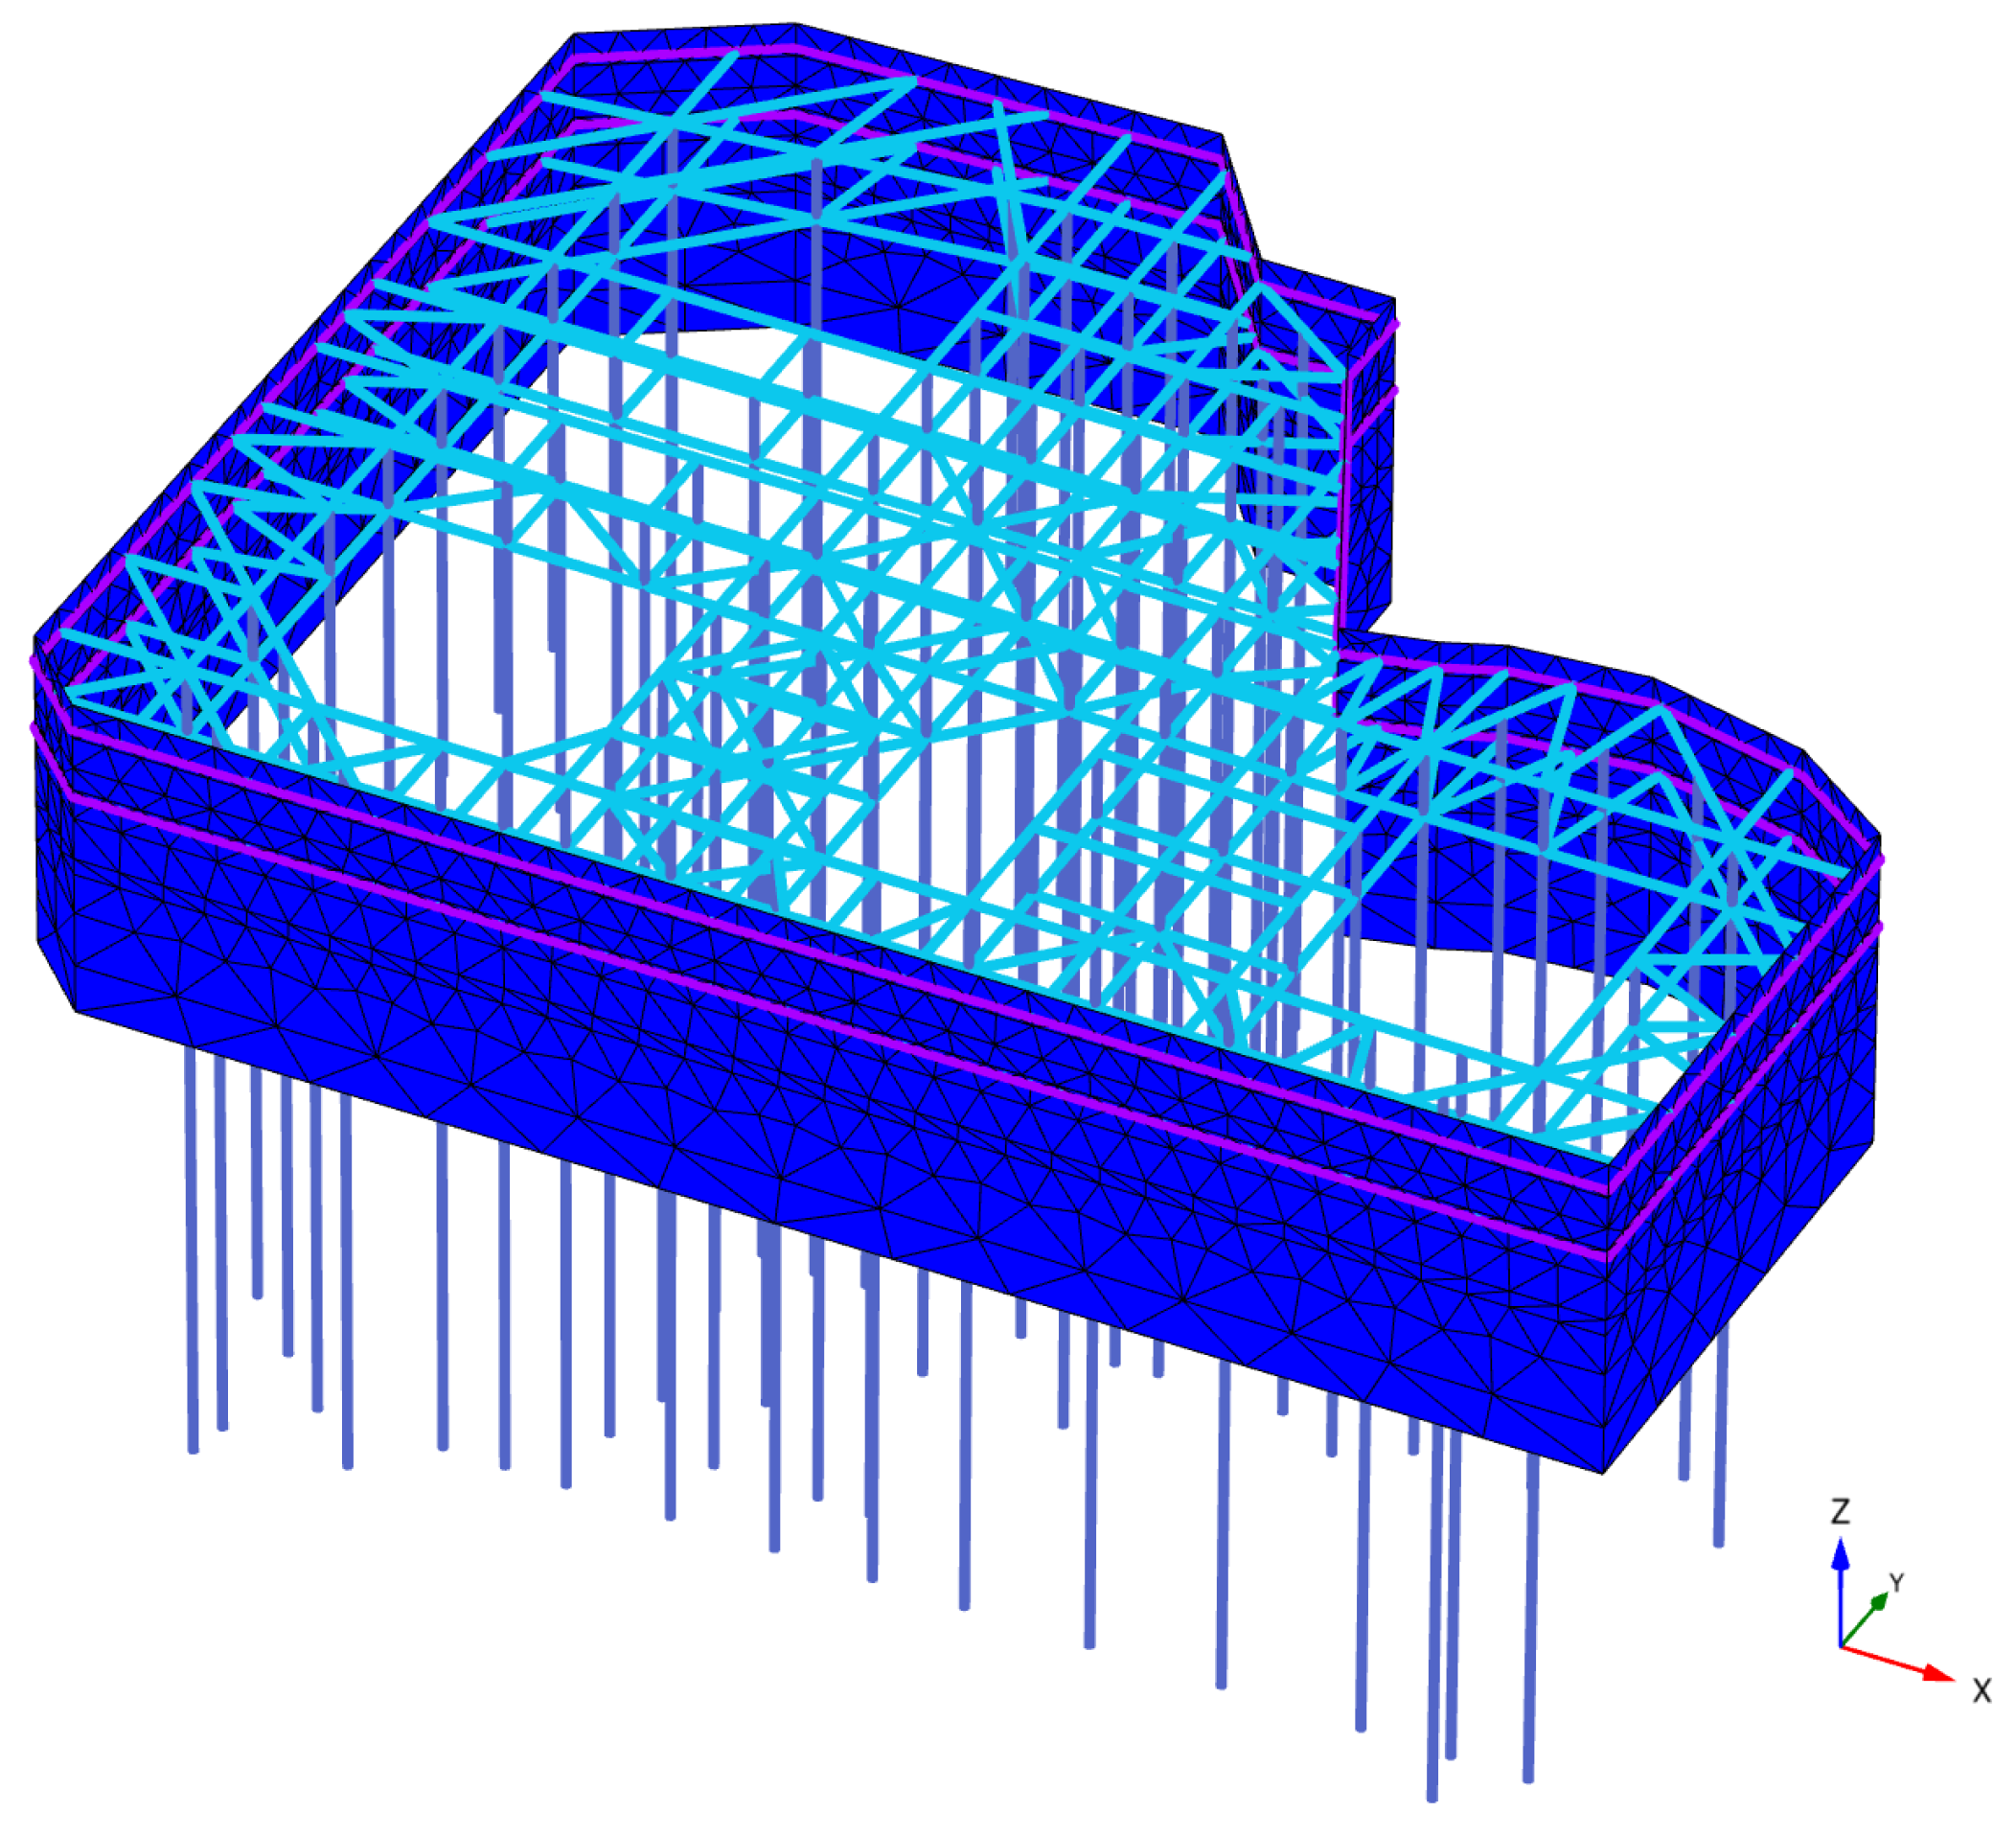
The model constructed using PLAXIS 3D finite element software is depicted in
Figure 6, while the support structure is illustrated in
Figure 7. A total of 169,360 elements and 257,191 nodes were generated. The model’s computational boundary conditions are based on the excavation of the pit. It is assumed that dewatering is completed during excavation without considering the influence of groundwater.
The simulation of staged construction steps is based on actual construction procedures, outlined as follows:
Condition 1: Completion of dewatering processes, installation of drainage and row of piles;
Condition 2: Excavation to support the crown beam bottom elevation −1.8 m, with the addition of the first support system;
Condition 3: Sequential excavation of soil layers to the bottom elevation of −6.7 m of the second support system, followed by the installation of wale and the second tier of support;
Condition 4: Layered excavation of soil down to the slab bottom at an elevation of −11.25 m.
4.2. Numerical Simulation Results
To validate the feasibility of selected support structures and the accuracy of numerical simulation results, initial input parameters were employed to calculate representative displacement values at monitoring points PD21 (vertical displacement of pile top) and CX07 (horizontal displacement along the pile shaft).
(1) Vertical displacement of pile top
Figure 8 reveals that during the excavation and supporting phases, the vertical displacement at PD21 fluctuates, mirroring the trend observed in field monitoring data, albeit with larger amplitude fluctuations. The continued increase in displacement at the pile top during the later stages of construction is attributed to the excavation process exposing the pit bottom, causing a slight upward shift of the surrounding piles due to heaving at the pit base. In later construction phases, the field-measured values exceed the simulation results of the pile top displacement. This discrepancy arises because finite element software cannot precisely mimic the excavation process stage by stage, and the simulated phases are often completed earlier than the actual excavation, leading to differences between measured and simulated outcomes.
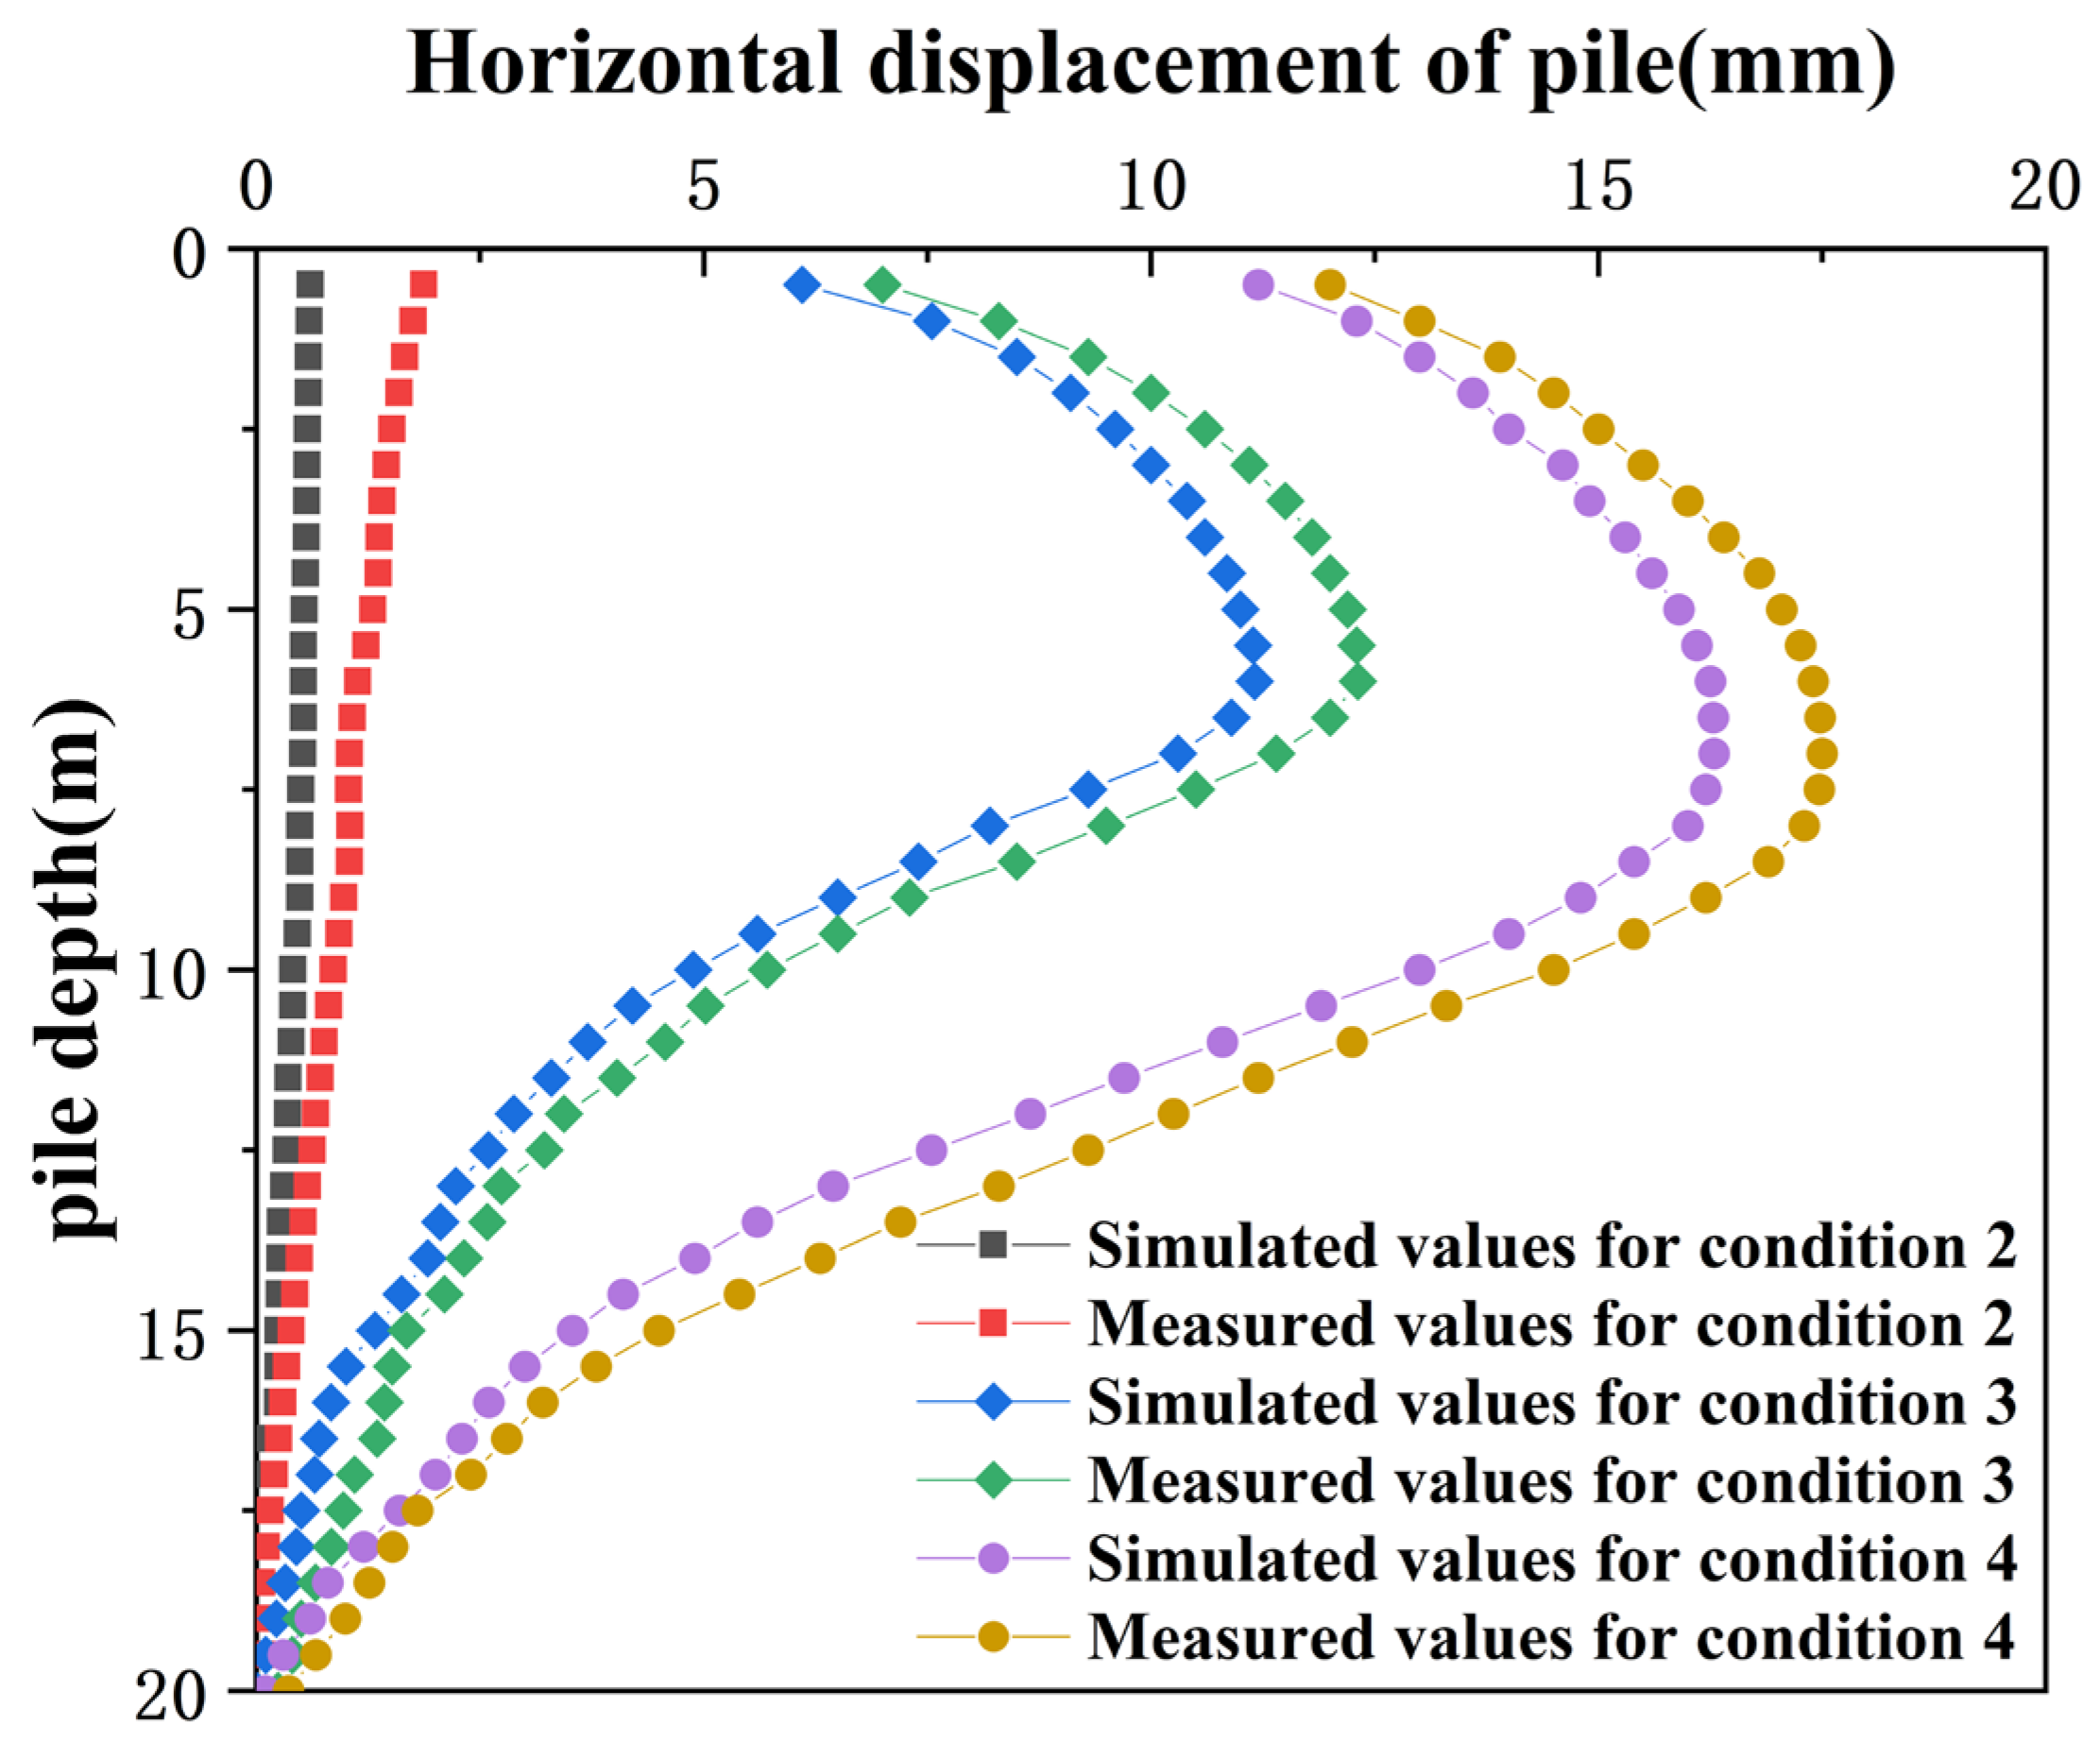
Pit excavation to the bottom of the pit, under different working conditions CX07 horizontal displacement of pile simulated values and measured values as shown in
Figure 9. When the foundation pit is excavated to the bottom elevation, the simulated and measured values of the horizontal displacement of pile CX07 are presented in
Figure 9. A horizontal displacement is taken every 0.5 m from the top of pile CX07 to the bottom of the pile;
Figure 9 shows the monitoring value at the end of construction. Field measurements indicate that internal bracing effectively mitigates horizontal displacement along the pile shaft, affirming the adequacy of the support and bracing design. During the excavation to a shallow depth in condition two, the horizontal displacement decreases progressively from the pile top to the bottom. In conditions three and four, the horizontal displacement of the pile increases first and then decreases from top to bottom; as the excavation depth increases, the position of maximum horizontal displacement moves downward. The maximum measured horizontal displacement was 17.51 mm, compared to the simulated maximum of 16.29 mm. Both measured and simulated displacements remained within the warning thresholds, suggesting that the numerical model accurately reflects changes in horizontal displacement along the pile shaft.
Overall, although there are uncontrollable discrepancies between the numerical results and field measurements, the trends are generally consistent. This demonstrates that the use of PLAXIS 3D for simulating deep excavation and deformation effectively captures the dynamic changes in the displacement of support structures, and numerical simulation can reliably predict pit deformations and accurately reflect the stability and safety of the excavation.
4.3. Impact of Parameters on Simulation Outcomes
The use of the HSS model for numerical simulation indicates that it is challenging to ascertain soil stiffness parameters
,
, and
, often leading to empirical estimates within a reference range, which introduces deviations between simulation results and actual field conditions. The effective Friction angle (
) and effective cohesion (
) directly influence the shear strength and stability of the soil, impacting the output of numerical simulations of excavation and support. During the dynamic construction process of a deep pit, the soil within the pit undergoes vertical unloading, leading to dynamic changes in stress states and continuous variations in soil parameter values, affecting the overall stability of the excavation. By evaluating the maximum horizontal displacement at monitoring point CX01, the influence of soil parameters
,
,
,
, and
on the numerical simulation results is determined by the method of controlling variables. By changing the values of the original soil parameters to 0.7 and 1.3 times the original, and other parameter values remain unchanged, the numerical simulation calculation results are shown in
Table 2.
Table 2 indicates that the impact of soil parameters on the results of numerical simulations varies in the order of
>
>
>
, with parameters
and
having a similar effect. Since parameter
can be determined through in-lab geotechnical testing, this study focuses on the inversion of soil parameters
,
, and
, which significantly affect the outcomes.
Parameter inversion was performed for soil layers spanning from the top to the bottom of the pit, encompassing five distinct layers. However, due to the negligible displacement changes observed during the excavation of the first layer, this study only conducts parameter inversion for the second through fifth layers. This approach allows the input parameters in PLAXIS 3D to more closely align with the actual soil parameters encountered during the construction process, enhancing the accuracy and relevance of the numerical model.
6. Conclusions
Through the establishment of a numerical model using PLAXIS 3D and inversion of soil parameters using the PSO-BP neural network to update input parameters of the model, this study has successfully implemented dynamic predictions throughout the entire process of deep excavation. The feasibility of the inverted parameters was verified with actual project data, confirming the effectiveness of the model updates.
Specific conclusions are as follows:
(1) Utilizing the Particle Swarm Optimization to enhance the BP neural network for soil layer parameter inversion significantly improves the convergence speed of the model and prevents the common issue of the network becoming trapped in local optima;
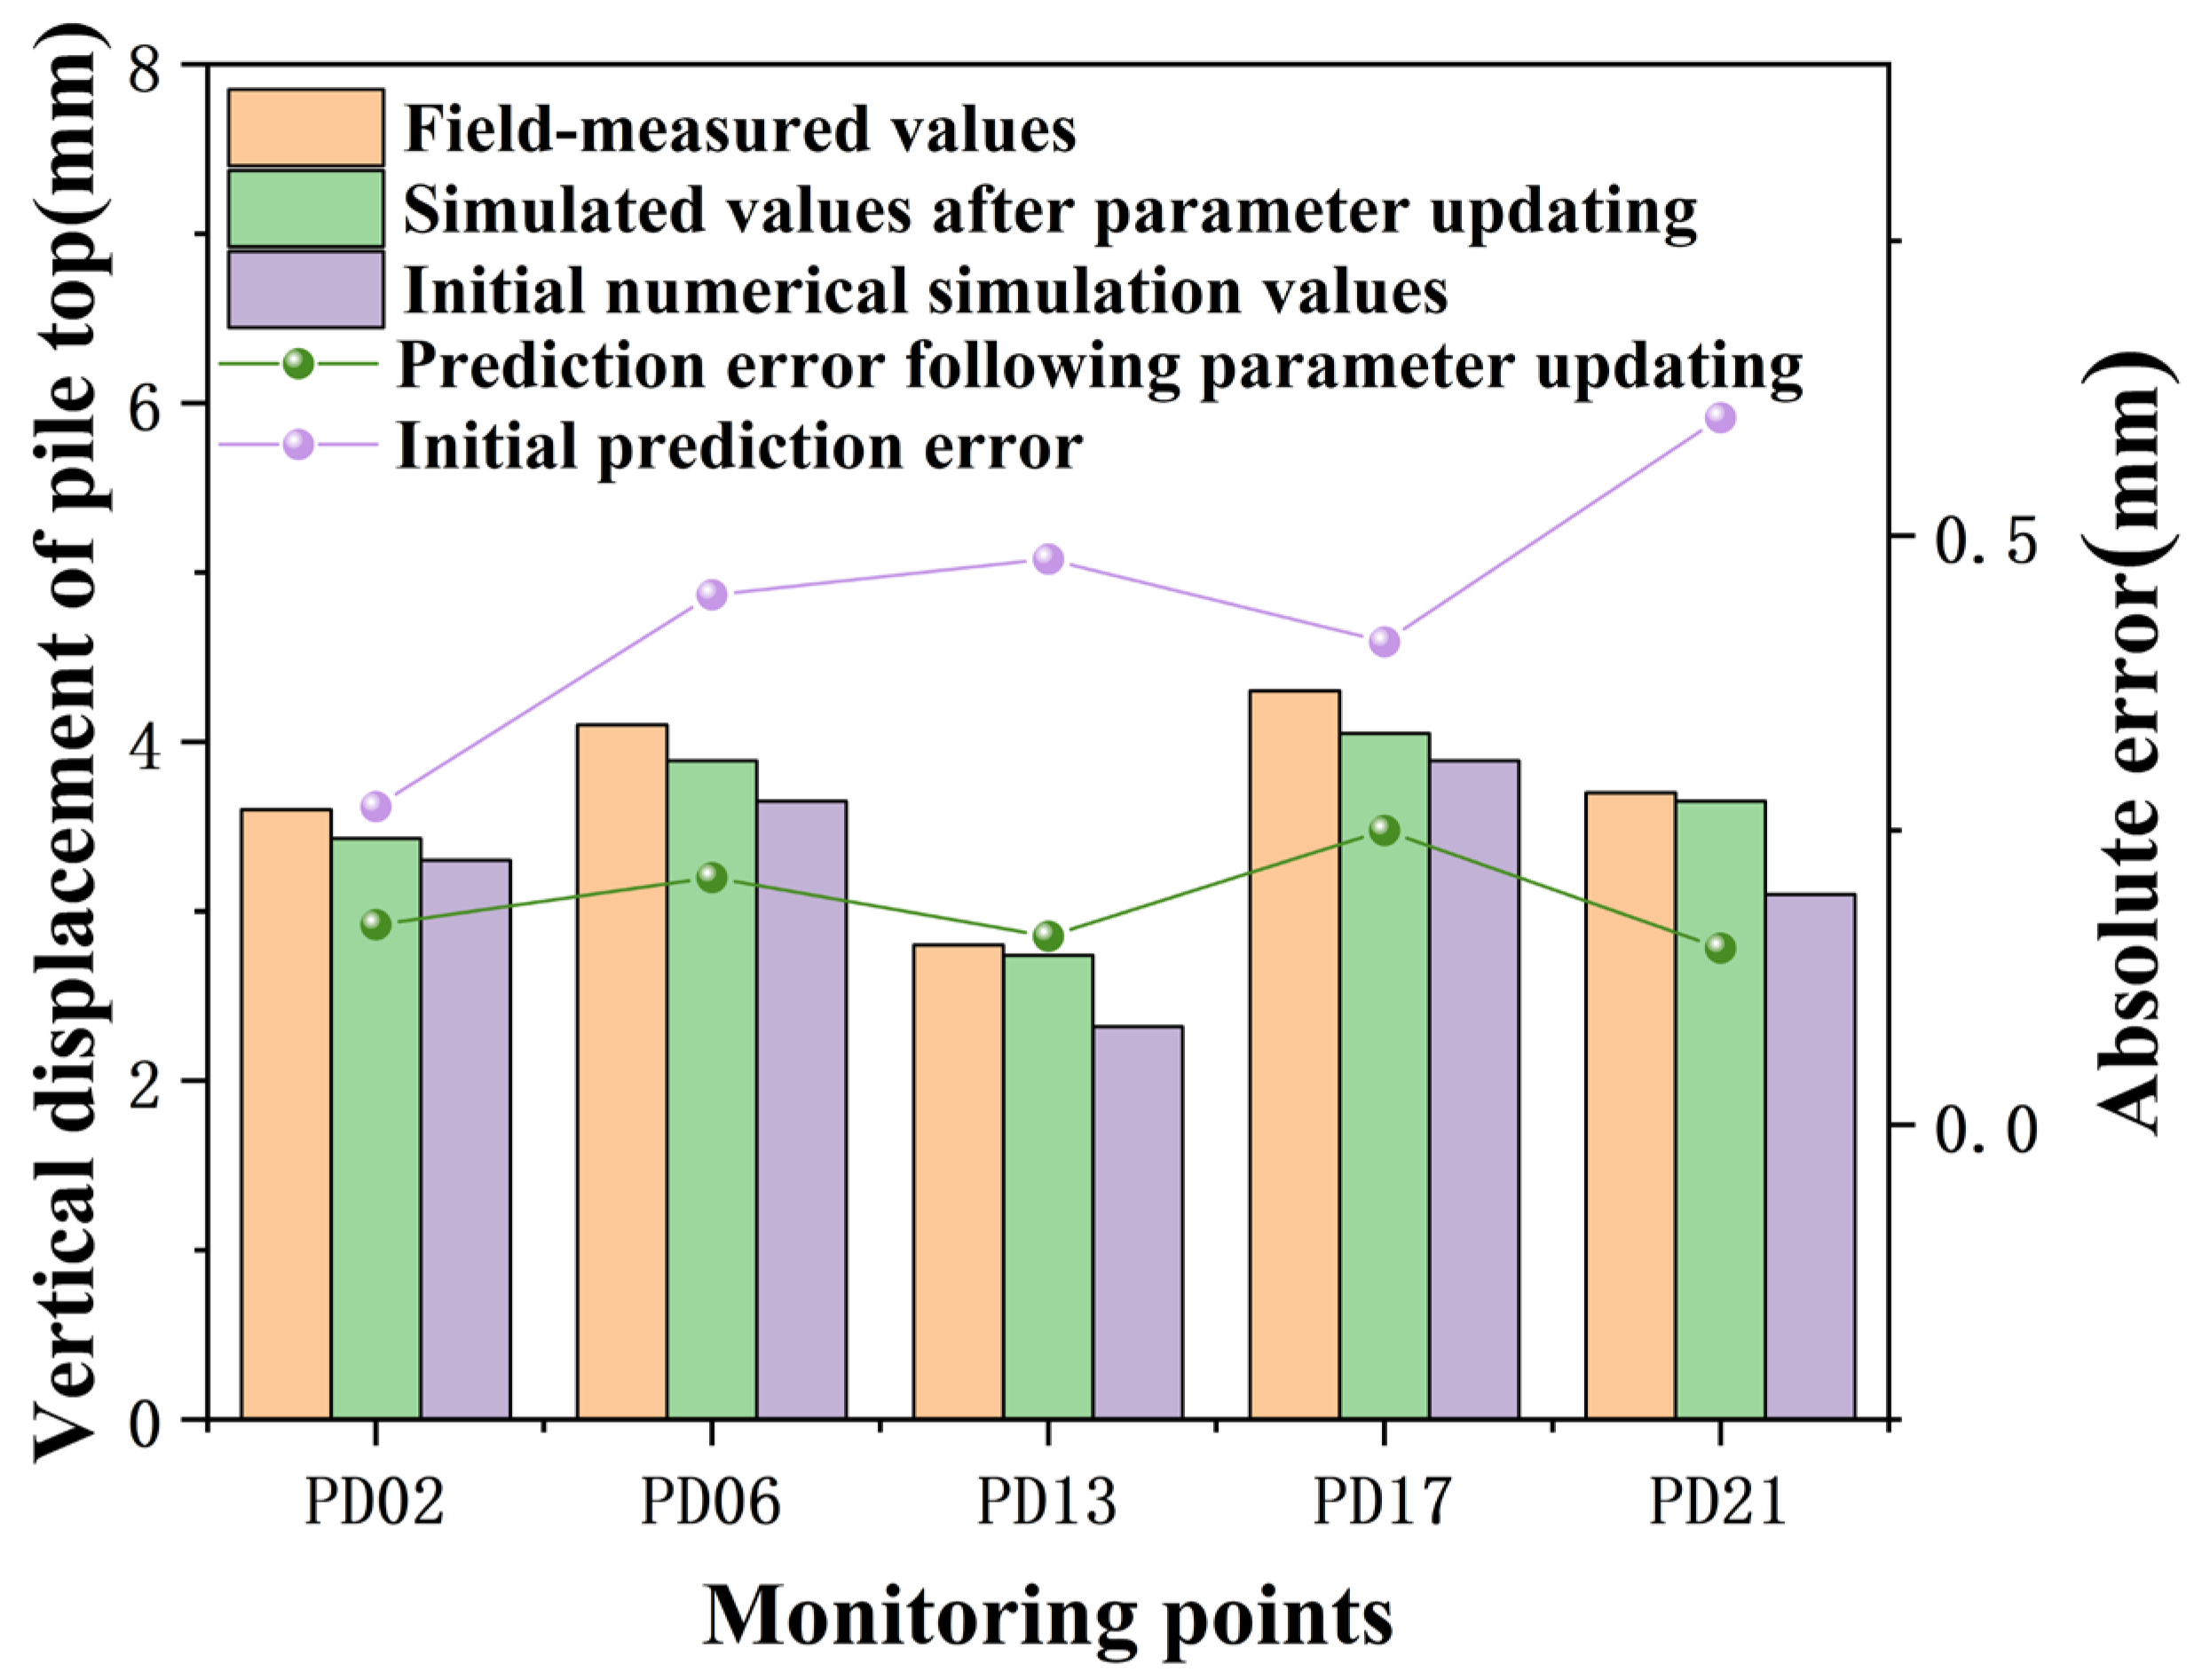
(2) The actual changes in vertical displacements at the pile top and horizontal displacements along the pile body during the excavation and support process are generally consistent with those predicted by the simulation; the absolute errors between initial numerical simulation results and measured values are greater than those between updated predicted values and measured values;
(3) Dynamic prediction results are closer to actual measurements compared to initial numerical simulations. The methodology of inverting soil layer parameters based on field measurements from previous conditions is feasible and provides valuable insights for selecting soil parameters in the region.
While this study has achieved dynamic prediction throughout the entire process of pit excavation, there are still limitations, specifically manifesting in the following aspects:
(1) The numerical simulation adopted in this paper for the excavation and deformation monitoring of pits did not take into account the dynamic loads around the pit perimeter, as well as the influence of existing surrounding structures on the retaining system. Due to the reduction of the groundwater level to the bottom elevation of the pit before construction, the soil humidity and suction state above the groundwater level were not considered in the numerical simulation;
(2) In the future, the authors will focus on investigating the influence of soil parameters on the displacement of the retaining structure of pits, as well as the impact of multiple soil parameters from different soil layers in the excavation area on the results of numerical simulations.


