Abstract
In order to improve the response characteristics of the surface acoustic wave (SAW) sensor to trace gases, a SAW CO gas sensor based on a Pd–Pt/SnO2/Al2O3 film with a high-frequency response performance is proposed in this paper. The gas sensitivity and humidity sensitivity of trace CO gas are tested and analyzed under normal temperatures and pressures. The research results show that, compared with the frequency response of the Pd–Pt/SnO2 film, the CO gas sensor based on a Pd–Pt/SnO2/Al2O3 film has a higher frequency response performance, and the sensor has high-frequency response characteristics to CO gas with a concentration in the range of 10–100 ppm. The average response recovery time of 90% ranges from 33.4 s to 37.2 s, respectively. When the CO gas with a concentration of 30 ppm is tested repeatedly, its frequency fluctuation is less than 5%, indicating that the sensor has good stability. In the range of relative humidity (RH) from 25% to 75%, it also has high-frequency response characteristics for CO gas with a 20 ppm concentration.
1. Introduction
As a large coal energy country, China’s coal production and coal storage levels are extremely high. However, there are many natural gas accidents caused by coal mining [1,2,3], with CH4 accidents accounting for the majority of these [4,5]. The latter refers to the accidents caused by trace toxic and harmful gases, such as CO, CO2, and H2S, as well as other trace gases [6,7]. The harmful impacts of such gases cannot be underestimated.
SAW sensors are gaining more and more attention as SAW technology is improving. Compared to other types of sensors, SAW sensors have greater advantages, such as high measurement accuracy, high sensitivity, small size, light weight, low power consumption, and the possibility of wireless passive [8,9,10]. Moreover, a wide range of gases can be detected by simply coating the sensitive area of the device with a sensitive material with different gas adsorption properties. These good features make the application of SAW sensors promising. However, there are also some challenges, as the response degree of different sensitive films to different gases is different, and the avenues of improving the response degree of SAW sensors to gases with greater efficiency and accuracy are currently subject to intense research activity among scholars.
In 1986, David et al. [11] used SAW gas sensors coated with different sensitive films to detect 11 chemical vapors. In 2003, Weimar et al. [12] used the thick film technique to develop a sensor with Pd material loaded on SnO2 to study the effect of water vapor on CO gas sensing. On the other hand, in 2009, Huang Guogang et al. [13] used the frequency division technique and achieved high-accuracy measurements of CO gas frequency by improving the test technique with the help of the frequency error multiplication method for acoustic surface wave sensors. In 2017, Wang Qingji et al. [14] prepared a Pd-doped SnO2 hollow structure using a hydrothermal synthesis method, and developed a CO sensor with high response values from this sensitive material. This sensor achieved a response value of 14.7 for 100 ppm CO. In 2019, Pengjian Wang [15] et al. fabricated a CO gas sensor based on a PdO-loaded SnO2 film, and the results showed that the sensor had the best sensitivity for 100 ppm CO at a specific temperature. In 2020, Xiaofeng Xu et al. [16] used the sol–gel method to prepare the SAW sensor with the ZnO–Al2O3 thin film, which can detect H2S gas with a gas-moisture sensitivity at room temperature, making significant progress in regards to the effect of humidity on gas. In 2022, Yuan Tongwei et al. [17] prepared a new type of CO gas sensing material with porous n–ZnO/p–Co3O4 nano sheets using a new method of etching forging. The sensors under this sensitive material have high response characteristics to CO gas and an excellent anti-interference ability.
Although significant research results have been achieved in the detection of trace toxic and hazardous gases, the response values for trace gases need to be higher and more accurate. Therefore, this chapter investigates ways to improve the frequency response of SAW sensors to gases. In this study, a high-frequency SAW CO gas sensor based on a Pd–Pt/SnO2/Al2O3 sensitive film was prepared, which has high response characteristics for the trace amounts of low-concentration CO gas generated in coal mines. It is also capable of detecting high frequencies for trace ppm levels of CO gas at room temperature, and has a high-frequency response performance at different RH environments.
2. Experimental Part
2.1. Sensing Mechanism
2.1.1. Elastic Loading Effect
The elastic load means that a specific gas is adsorbed on the surface of the SAW sensor, and that the elastic modulus before and after the sensitive film will change, resulting in propagation speed changes, which will affect the center frequency of the device. The relationship between the frequency offset and elastic modulus of the SAW sensor is shown in Formula (1) [18].
where is the elastic sensitivity coefficient, is the center frequency of the SAW sensor, is the thickness of the sensitive film, is the initial wave velocity of the SAW sensor, is the volume component of the elastic modulus, and is the shear modulus of the elastic modulus.
When the elastic load changes, the center frequency of the device also changes. When the value of the bulk component of the elastic modulus is less than 106 Pa, the effect of the elastic load on the device is almost zero, and when the value of the shear modulus of the elastic modulus is greater than 109 Pa, the elastic load is generated at this time. The effect cannot be ignored, and it will cause a large shift in the center frequency of the device.
2.1.2. Conductivity Loading Effect
The relationship between the shift of the SAW sensor frequency response and the conductivity is shown in Formula (2).
where is the conductivity on the sensitive film, is the electromechanical coupling coefficient of the piezoelectric substrate, and is the dielectric constant.
After the gas is adsorbed by the sensitive membrane, its conductivity and dielectric constant will change, resulting in a large frequency shift. However, the greater the conductivity, the better. Only when the conductivity is in a proper range can the SAW gas sensor have the best sensitivity.
2.1.3. Mass Loading Effect
The relationship between the frequency offset of the sensor and the quality change in its sensitive film is shown in Formula (3) [19].
where is the frequency offset of the sensor, is the center frequency of the sensor, is the constant of the piezoelectric substrate material, and is the mass change of the sensitive film.
The constants and are obtained differently with different piezoelectric substrate materials. When the sensitive film makes contact with a specific gas, the gas molecules will combine with the sensitive film and immerse in it, thus increasing the quality of the film. Before and after the adsorption of gas on the sensitive film, the quality of the sensitive film will change, which will affect the center frequency of the sensor, resulting in a frequency offset.
2.2. Preparation and Characterization of Sensitive Films
In this paper, metal PdCl2 solutions and PtCl2 solutions (Pd, Pt content ≥ 59%, Shanghai Jiuling Chemical Co., Shanghai, China), SnO2 powder (around 45 nm, 99.99% purity, Shanghai Jiuling Chemical Co., Shanghai, China), and Al2O3 powder (20–50 nm, 99.99% purity, Shanghai Jiuling Chemical Co., Shanghai, China) were used as basic raw materials. First, SnO2 powder (13.2 g) and Al2O3 powder (3 g) were taken in the molar mass ratio of Sn:Al = 1:1, and then the SnO2 powder was mixed with an appropriate amount of deionized water and stirred thoroughly, Afterwards, the Al2O3 powder was added and then stirred at a constant speed at 30 °C for 2 h to allow the Al2O3 material to be evenly adhered to. The SnO2/Al2O3 mixture was then obtained by stirring for 2 h at a constant speed at 30 °C, allowing the Al2O3 material to adhere uniformly to the SnO2 material. Subsequently, about 0.1 mL of PdCl2 solution and PtCl2 solution was added to the SnO2/Al2O3 mixture via a micro syringe, the Pd–Pt/SnO2/Al2O3 films were obtained by standing for 5 h, evaporating in a water bath at 60 °C, before being heated for 2 h in muffle furnace at 500 °C (Model: TX–08, Shanghai KEA Experimental Instrument Factory, Shanghai, China). It was then removed, left to cool, and grinded for use.
The reason for first adding SnO2 powder and deionized water, followed by Al2O3 powder, is because SnO2 materials generally exhibit three crystal structures (tetragonal, orthorhombic, and cubic), the former of which indicates the most common crystal structure for SnO2, while Al2O3 has a mesoporous structure with a high specific surface area [20] (≥230 m2/g) and can better adhere to the surface of SnO2. This increases the active sites for gas adsorption and improves its sensitivity. The noble metal has good catalytic and low-temperature activity and is attached to the surface of the material to shorten the response recovery time. A diagram of the lamination of the film material is shown in Figure 1 (with the frontal lamination effect as an example).
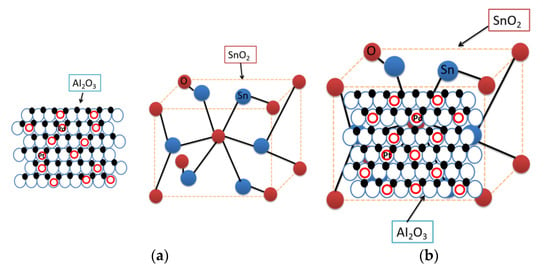
Figure 1.
Schematic diagram of the material structure: (a) SnO2 and Al2O3 structure; and (b) SnO2/Al2O3 composite structure.
Figure 2 shows the morphological results of the Pd–Pt/SnO2 thin films and Pd–Pt/SnO2/Al2O3 thin films. As the figure shows, the microscopic dimensions of the Pd–Pt/SnO2 material were 60–80 nm and the perimetric dimensions of the Pd–Pt/SnO2/Al2O3 material were 20–60 nm. The sensitive film had an increased specific surface area and more active sites after adding Al2O3, and its adsorption effect on gases was enhanced.
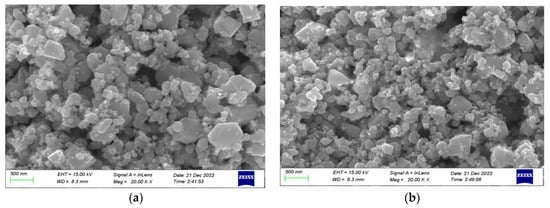
Figure 2.
SEM characterization of sensitive films: (a) the Pd–Pt/SnO2 thin film; and (b) the Pd–Pt/SnO2/Al2O3 thin film.
Figure 3 and Figure 4 and Table 1 shows the results of the energy spectrum characterization analysis of the Pd–Pt/SnO2/Al2O3 thin film. Figure 3 shows that each element (Al, Sn, O, Pd, and Pt) was present in the composite film and can be uniformly distributed, proving that the composite film prepared was consistent with the above theoretical analysis.
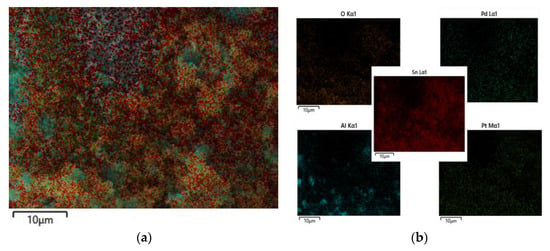
Figure 3.
Elemental distribution of Pd–Pt/SnO2/Al2O3 films: (a) elegional elemental distribution maps; and (b) single elemental distribution maps.
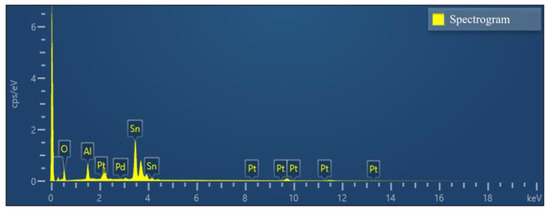
Figure 4.
Total spectrum of Pd–Pt/SnO2/Al2O3 thin films with elemental distribution.

Table 1.
Total distribution spectral chart elemental content analysis table.
3. Results
3.1. Construction of SAW Gas Sensor Performance Test System
The main purpose of building the test system of the SAW CO gas sensor was to separate the interference factors such as the temperature, humidity, and pressure from the test system, and discuss and analyze them separately, thereby reducing the test error. Information on the CO gas performance test system and the test apparatus is shown in Figure 5 and Table 2, respectively.
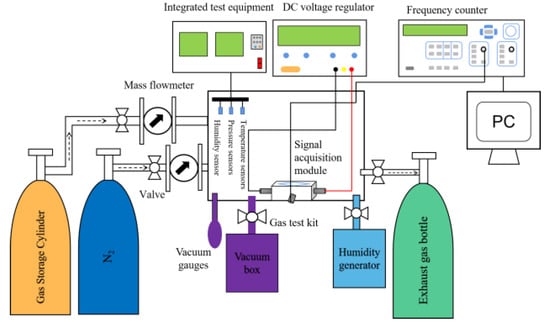
Figure 5.
Schematic diagram of the gas susceptibility test system.

Table 2.
Information sheet on the instruments used in the SAW sensor gas sensing test system.
In this experiment, we only analyzed the gas sensitivity and humidity sensitivity of the gas. Therefore, pressure sensors and temperature sensors were needed to control the variables to ensure that the experiment was conducted at room temperature and room pressure, and real-time monitoring was carried out. Before testing the CO gas sensitivity, each piece of equipment was first debugged to check the air tightness of the whole test system, and then a vacuum pump was used to evacuate the vacuum in the test box for 30 min, followed by a vacuum gauge to observe the gas in the test box. During the test, N2 gas was introduced under a normal temperature, and the air pressure in the test box was always kept as a standard atmospheric pressure, so as to eliminate interference factors (such as the water vapor or impurity gas) that affect the sensitive membrane in the test box. The gas used in the test was a mixture of N2 as the reference gas and CO gas, and the flow rates of N2 and CO were then controlled by the mass flowmeter, so as to accurately control the CO concentration. When testing the humidity sensitivity of CO, the RH value of the test box was adjusted with the humidity generator. To test the gas humidity sensitivity of CO, the network analyzer was used to record the working frequency and other relevant parameters of the SAW sensor.
3.2. Sensitive Film RESPONSE Test
The CO concentration under the coal mine was not expected to exceed 24 ppm. Therefore, the test was conducted in a 10–100 ppm CO gas concentration. Based on the prepared Pd–Pt/SnO2 thin film and Pd–Pt/SnO2/Al2O3 thin film SAW sensors, the gas sensitivity of the 100 ppm CO gas was detected. When the working voltage was set to 12 V, the ambient temperature was controlled at room temperature (25 °C), the ambient RH was maintained at 50%, and the frequency response of the above two sensitive films to CO was tested. The results are shown in Figure 6.
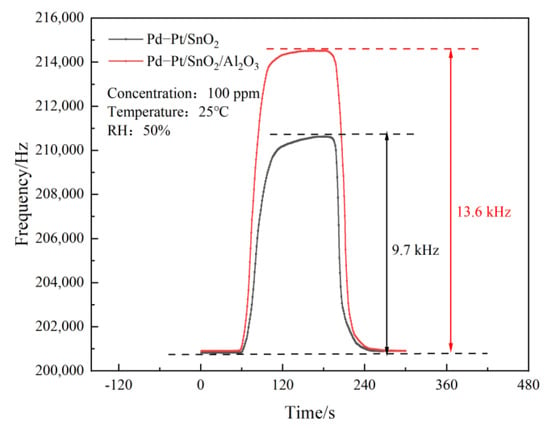
Figure 6.
SAW sensor atrophicity test based on Pd–Pt/SnO2 and Pd–Pt/SnO2/Al2O3 thin films.
The figure shows that the frequency response of the Pd–Pt/SnO2/Al2O3 film SAW sensor to the 100 ppm CO gas concentration (13.6 kHz) was significantly higher than that of the Pd–Pt/SnO2 film SAW sensor in the 100 ppm CO gas concentration (9.7 kHz). This shows that the Pd–Pt/SnO2/Al2O3 composite film can inherit the mesoporous structure of Al2O3, increases the specific surface area, and improve the sensitivity of the sensor.
3.3. Gas Sensitivity Test
Under the same test conditions, Figure 7 shows the SAW sensor based on the Pd–Pt/SnO2/Al2O3 sensitive film for the 10–100 ppm CO dynamic response of the gas concentration. The figure shows that the response frequency of the 10 ppm CO gas concentration was 1.1 kHz, and that the response frequency of the 100 ppm CO gas concentration reached 13.6 kHz, indicating that the SAW sensor under the membrane has high-frequency response characteristics to CO gas.
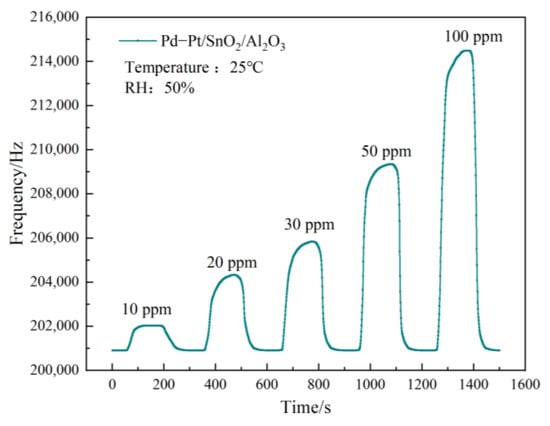
Figure 7.
Dynamic response of different CO concentrations of SAW sensors.
3.4. Response Recovery Characteristic Test
Under the same test conditions (25 °C, RH 50%), through the different CO gas concentrations configured, the SAW sensor of the Pd–Pt/SnO2/Al2O3 film was used to measure the 10 ppm to 100 ppm response recovery curve. The test results are shown in Figure 8. The figure shows that the SAW sensor based on the Pd–Pt/SnO2/Al2O3 composite film has a good response and recovery performance to different CO gas concentrations. Among them, 90% of the average response time equated to about 33.4 s, and 90% of the average recovery time equated to about 37.2 s. The response speed of the sensor was slightly faster than the recovery speed.
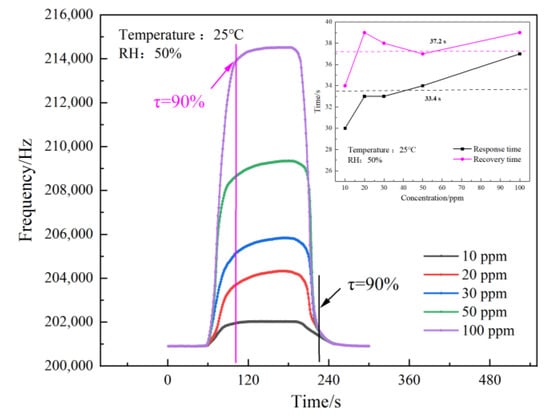
Figure 8.
Response recovery time complex characteristic curve of the SAW sensor.
3.5. Stability Test
The test conditions are the same as the above. The SAW sensor of the Pd–Pt/SnO2/Al2O3 sensitive film in the CO gas with a concentration of 30 ppm was used over four cycles to measure the stability of the sensor, as shown in Figure 9a. The amplitude changes in the frequency response of the composite membrane SAW sensor in each cycle were 4.92 kHz, 4.94 kHz, and 4.91 kHz, respectively. The test results show that the fluctuation in the frequency response was less than 5%. They also show that the sensor has good short-term stability.
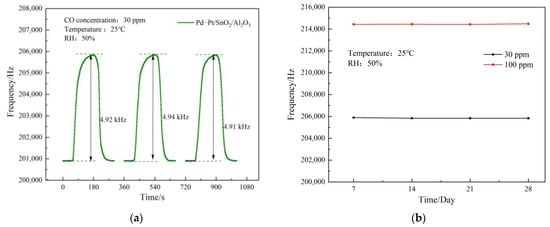
Figure 9.
SAW sensor stability testing: (a) short-term stability; and (b) long-term stability.
Under the same test conditions, use the SAW sensor was used with the Pd–Pt/SnO2/Al2O3 composite film to test the CO gas within 30 days, and the data were recorded every 7 days to investigate the long-term stability of the SAW sensor. For this long-term stability test, CO gas with concentrations of 30 ppm and 100 ppm were selected as the two groups of experimental objects, and the test results are shown in Figure 9b. The figure shows that the sensor had a stable response to 30 ppm and 100 ppm CO gas within 30 days of testing, demonstrating that the SAW sensor based on the Pd–Pt/SnO2/Al2O3 composite sensitive film has good long-term stability for CO gas.
3.6. Humidity Test
The SAW gas sensor based on the Pd–Pt/SnO2/Al2O3 sensitive film uses CO gas with a concentration of 20 ppm, and conducts short-term humidity sensitivity performance tests of CO gas under three humidity conditions of 25%, 50%, and 75%, Three sets of experiments with different humidity levels were tested independently. The test results are shown in Figure 10 below.
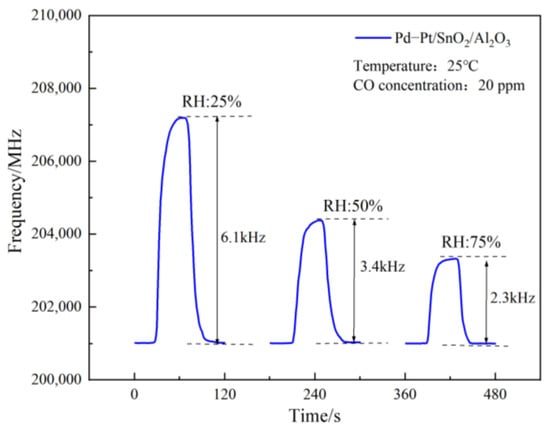
Figure 10.
SAW sensor moisture sensitivity test.
The figure demonstrates that, with the increase in test humidity, the response frequency of the SAW gas sensor to CO decreased, the RH increased from 25% to 50% (and then to 75%), and the frequency decreased from 6.1 kHz to 3.4 kHz (and then to 2.3 kHz). The Pd–Pt/SnO2/Al2O3 sensitive film’s response frequency to CO gas decreased, possibly because the higher humidity meant more H2O molecules could be deposited on the film. On the one hand, H2O molecules occupied the active sites on the film by adsorbing CO gas. On the other hand, after more H2O molecules were adsorbed on the film, not only did the conductivity and elastic modulus change to some extent, but the quality of the film also improved. Under the mechanism of the mass loading effect, the response frequency of the film for detecting gas decreased. However, the SAW gas sensor based on the Pd–Pt/SnO2/Al2O3 sensitive film was still found to have a good humidity sensitive detection performance for CO gas in a certain humidity environment
4. Conclusions
In this paper, a high-frequency response SAW CO gas sensor with the Pd–Pt/SnO2/Al2O3 sensitive film was prepared. The gas sensitivity and humidity sensitivity of trace toxic CO gas were tested and analyzed at 25 °C and 50% RH. The following conclusions can be drawn from the test results. In the detection of 100 ppm CO gas concentration, the Pd–Pt/SnO2/Al2O3 sensitive film had a higher response frequency than the Pd–Pt/SnO2 sensitive film. In the range of 10–100 ppm CO gas concentration, the sensor based on the Pd–Pt/SnO2/Al2O3 sensitive film had high-frequency response characteristics, and the average response time and recovery time of 90% were 33.4 s and 37.2 s, respectively. When the CO gas with a 30 ppm concentration was tested repeatedly, its frequency response fluctuation was less than 5%, indicating that the sensor has good stability. In the range of RH of 25–75%, with the increase of RH, mainly due to the mass loading effect, the response frequency decreased, but it still had good response characteristics.
Author Contributions
Conceptualization, B.S. and H.Y.; methodology, H.Y.; software, H.Y.; validation, B.S., H.Y. and X.L.; formal analysis, C.J. and T.Z.; investigation, X.L.; data curation, H.Y.; writing—original draft preparation, H.Y.; writing—review and editing, B.S.; supervision, B.S. All authors have read and agreed to the published version of the manuscript.
Funding
This work was funded by the National Natural Science Foundation of China (grant number: 52074111), the Natural Science Foundation of Heilongjiang Province (grant number: YQ2020E034), post–doctoral funded projects in Heilongjiang Province (grant number: LBH–Z22248), and the development of key technologies for coal mine fire prevention and major disaster monitoring (grant number: 2020ZX04A01).
Institutional Review Board Statement
Not applicable.
Informed Consent Statement
Not applicable.
Data Availability Statement
The data presented in this study are available on reasonable request from the corresponding author.
Conflicts of Interest
The authors declare no conflict of interest.
References
- Ding, B. Characteristics of Major Disasters and Accidents in China’s Coal Mines and Prevention Measures. Coal Sci. Technol. 2017, 45, 109–114. [Google Scholar] [CrossRef]
- Zhang, D.; Nie, B.; Wang, L. Analysis of disaster–causing factors of coal mine safety production accidents in my country. China Saf. Prod. Sci. Technol. 2013, 9, 136–140. [Google Scholar] [CrossRef]
- Li, F. Research on Analysis and Prevention Measures of Coal Mine Water Accidents. China Coal 2022, 48, 14–19. [Google Scholar] [CrossRef]
- Li, K.; Wang, L.; Chen, X. An analysis of gas accidents in Chinese coal mines, 2009–2019. Extr. Ind. Soc. 2022, 9, 101049. [Google Scholar] [CrossRef]
- Wang, B.; Hu, Z. Statistical analysis of the status quo and regularity of gas explosion accidents in coal mines. Coal Technol. 2022, 41, 148–151. [Google Scholar] [CrossRef]
- Sun, P. Research on Mass–Sensitive Toxic and Harmful Gas Sensors and Arrays. Ph.D. Thesis, University of Electronic Science and Technology, Chengdu, China, 2010. [Google Scholar] [CrossRef]
- Long, Y. Study on the Sensitive Mechanism and Characteristics of Surface Acoustic Wave Trace Gas Sensor. Ph.D. Thesis, University of Electronic Science and Technology, Chengdu, China, 2019. [Google Scholar]
- Pohl, A. A review of wireless SAW sensors. IEEE Trans. Ultrason. Ferroelectr. Freq. Control. 2000, 47, 317–332. [Google Scholar] [CrossRef] [PubMed]
- Bulst, W.-E.; Fischerauer, G.; Reindl, L. State of the art in wireless sensing with surface acoustic waves. IEEE Trans. Ind. Electron. 2001, 48, 265–271. [Google Scholar] [CrossRef]
- Li, F.; Xiang, D.; Chiang, S.; Tittmann, B.R.; Searfass, C. Wireless surface acoustic wave radio frequency identification (SAW-RFID) sensor system for temperature and strain measurements. In Proceedings of the 2011 IEEE International Ultrasonics Symposium, Orlando, FL, USA, 18–21 October 2011. [Google Scholar] [CrossRef]
- Ballantine, D.S.; Rose, S.L.; Grate, J.W.; Wohltjen, H. Correlation of surface acoustic wave device coating responses with solubility properties and chemical structure using pattern recognition. Anal. Chem. 1986, 58, 3058–3066. [Google Scholar] [CrossRef]
- Bârsan, N.; Weimar, U. Understanding the fundamental principles of metal oxide based gas sensors; the example of CO sensing with SnO2 sensors in the presence of humidity. J. Phys. Condens. Matter 2003, 15, 20. [Google Scholar] [CrossRef]
- Huang, G.; Chen, M.; Zhang, P. Research on high precision frequency measurement of SAW CO gas sensor. Comput. Meas. Control. 2009, 17, 1033–1035+1038. [Google Scholar] [CrossRef]
- Wang, Q. Research on High Performance Modified SnO2 Semiconductor Oxide Type Gas Sensors; Jilin University: Changchun, China, 2017. [Google Scholar]
- Wang, P. Doped/Supported Nano Tin Dioxide–Structural Regulation and Toxic Gas Sensing; Northwest University: Xi’an, China, 2019. [Google Scholar]
- Xu, X. Research on SAW Gas/Humidity Sensor Based on Metal Oxide Film. Master’s Thesis, University of Electronic Science and Technology, Chengdu, China, 2020. [Google Scholar] [CrossRef]
- Yuan, T.; Ma, Z.; Nekouei, F.; Zhang, W.; Xu, J. Zeolitic imidazolate framework-derived n-ZnO/p-Co3O4 heterojunction by ion-etching method for superior CO toxic gas sensor. Sens. Actuators B Chem. 2023, 374, 132717. [Google Scholar] [CrossRef]
- Tang, Q. Preparation and Performance of Surface Acoustic Wave Ammonia Sensor; University of Electronic Science and Technology of China: Chengdu, China, 2019. [Google Scholar]
- Li, D. Preparation and Performance Study of H2S and Other Toxic and Harmful Gas Sensors; University of Electronic Science and Technology: Chengdu, China, 2019. [Google Scholar]
- Zhang, H.; Shen, B.; Hu, W.; Liu, X. Research on a Fast-Response Thermal Conductivity Sensor Based on Carbon Nanotube Modification. Sensors 2018, 18, 2191. [Google Scholar] [CrossRef] [PubMed]
Disclaimer/Publisher’s Note: The statements, opinions and data contained in all publications are solely those of the individual author(s) and contributor(s) and not of MDPI and/or the editor(s). MDPI and/or the editor(s) disclaim responsibility for any injury to people or property resulting from any ideas, methods, instructions or products referred to in the content. |
© 2023 by the authors. Licensee MDPI, Basel, Switzerland. This article is an open access article distributed under the terms and conditions of the Creative Commons Attribution (CC BY) license (https://creativecommons.org/licenses/by/4.0/).