


Credit Card Fraud Detection: An Improved Strategy for High Recall Using KNN, LDA, and Linear Regression


Abstract
:1. Introduction
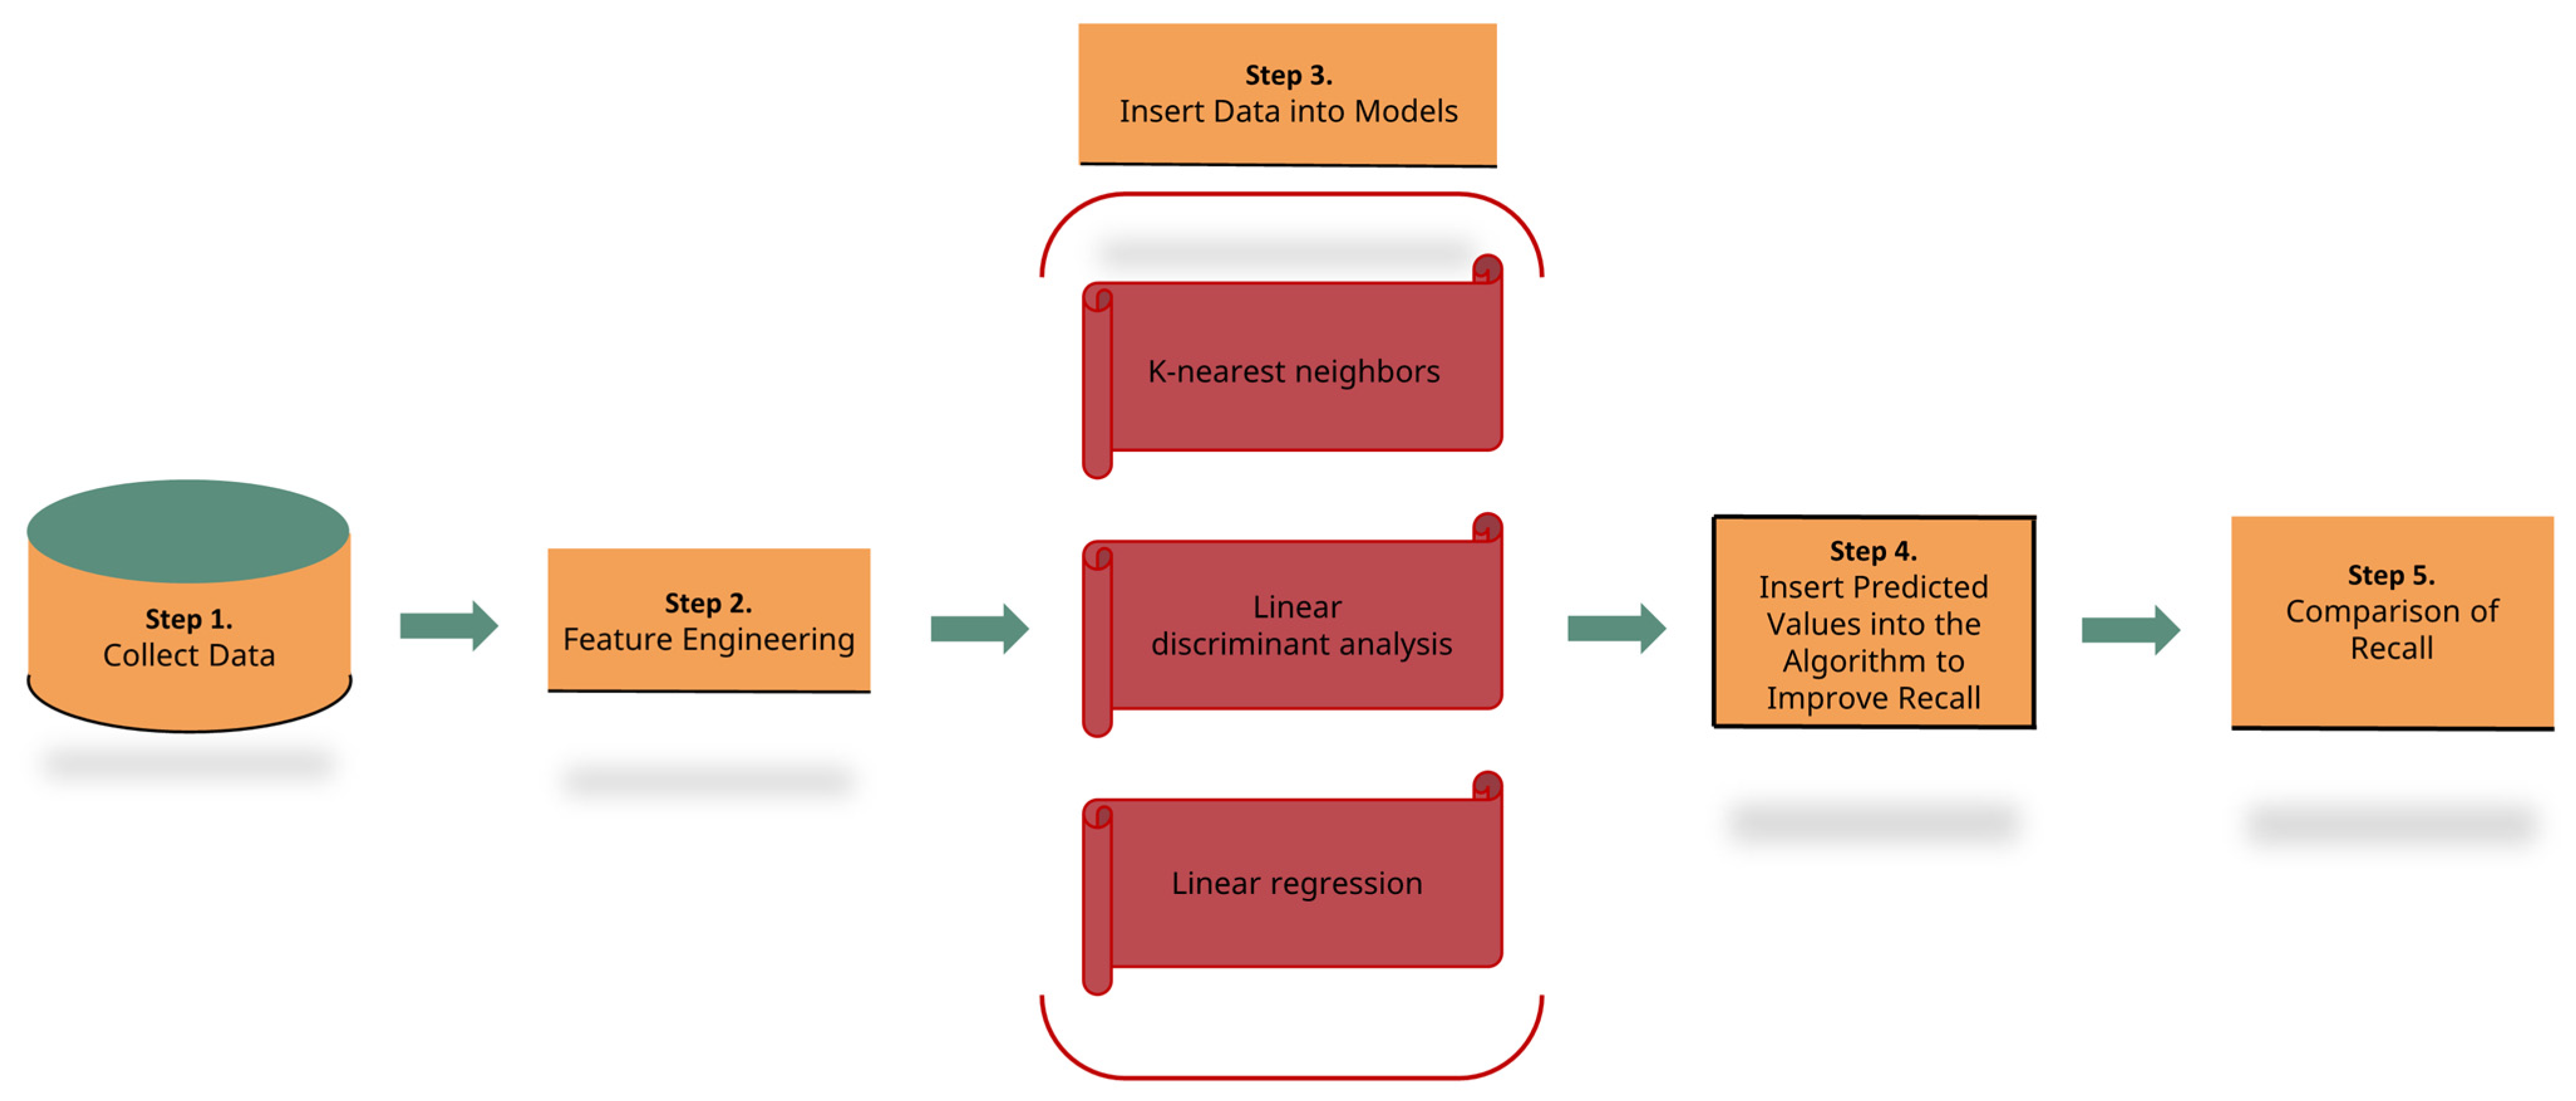
- We conducted experiments employing three machine learning algorithms (KNN, LDA, and LR) as well as our integrated algorithm, attaining superior recall in detection performance. Thus, this methodology could be adopted in other fields where recall is crucial. It is depicted abstractly in Figure 1.
- We applied the proposed approach to four extensive datasets concerning credit card fraud, including a real-world dataset.
- We verified that our methodology outperforms individual machine learning models in terms of recall using PyCaret, an automated machine learning library.
2. Related Studies
2.1. Importance of Recall
2.2. Classification Using KNN and LDA
2.3. Shortfalls of Previous Studies
3. Summary of the Proposed Strategy
3.1. Dataset Handling
3.1.1. Synthetic Financial Datasets for Fraud Detection [18]
3.1.2. Credit Card Transactions Fraud Detection Dataset [19]
3.1.3. Credit-card-Fraud Detection Imbalanced Dataset [20]
3.1.4. IEEE_CIS Fraud Detection [21]
3.2. Description of the Models and Methodology
3.2.1. Machine Learning Models
- Collect training data.
- Measure the similarity between the new input data and training data.
- Choose the nearest K-neighbors.
- Examine the labels of the selected nearest neighbors and classify or calculate the mean value for regression prediction.
- 1.
- Calculate the scatter within classes and between classes. The within-class scatter matrix is defined by Equation (3), while the between-class scatter matrix is defined by Equation (4).
- 2.
- Optimize the ratio of between-class variance to within-class variance by identifying vectors that maximize the separation between classes while minimizing the variance within each class.
- 3.
- Choose a new dimension and use the identified vectors to project data into a lower dimension, maximizing the separation between classes.
- 4.
- Identify the optimal vectors by computing the eigenvectors and eigenvalues of , selecting those that maximize the separation between classes when data is projected onto them.
3.2.2. Our Proposed Methodology
| Algorithm 1: Algorithm we made for better recall |
| Input: pKNN = A predicted value from KNN pLDA = A predicted value from LDA pLR = A predicted value from LR mvLR = A mean value from LR Output: pOR = Predicted value from our methodology FOR i FROM 0 to array of zeros with a length of a dataset DO /*If “non-fraud” Comes Out from Both Models*/ IF (pKNN[i] is 0 OR pLDA[i] is 0) THEN IF (pLR[i] < mvLR) THEN pOR[i] ← 0 END IF /*If “fraud” Comes Out from Both Models*/ ELSE IF (pKNN[i] is 1 OR pLDA[i] is 1) THEN IF (pLR[i] > mvLR) THEN pOR[i] ← 1 END IF /*Allocating Predicted Values from KNN to Remainings*/ ELSE pOR [i] ← pKNN[i] END IF END FOR |
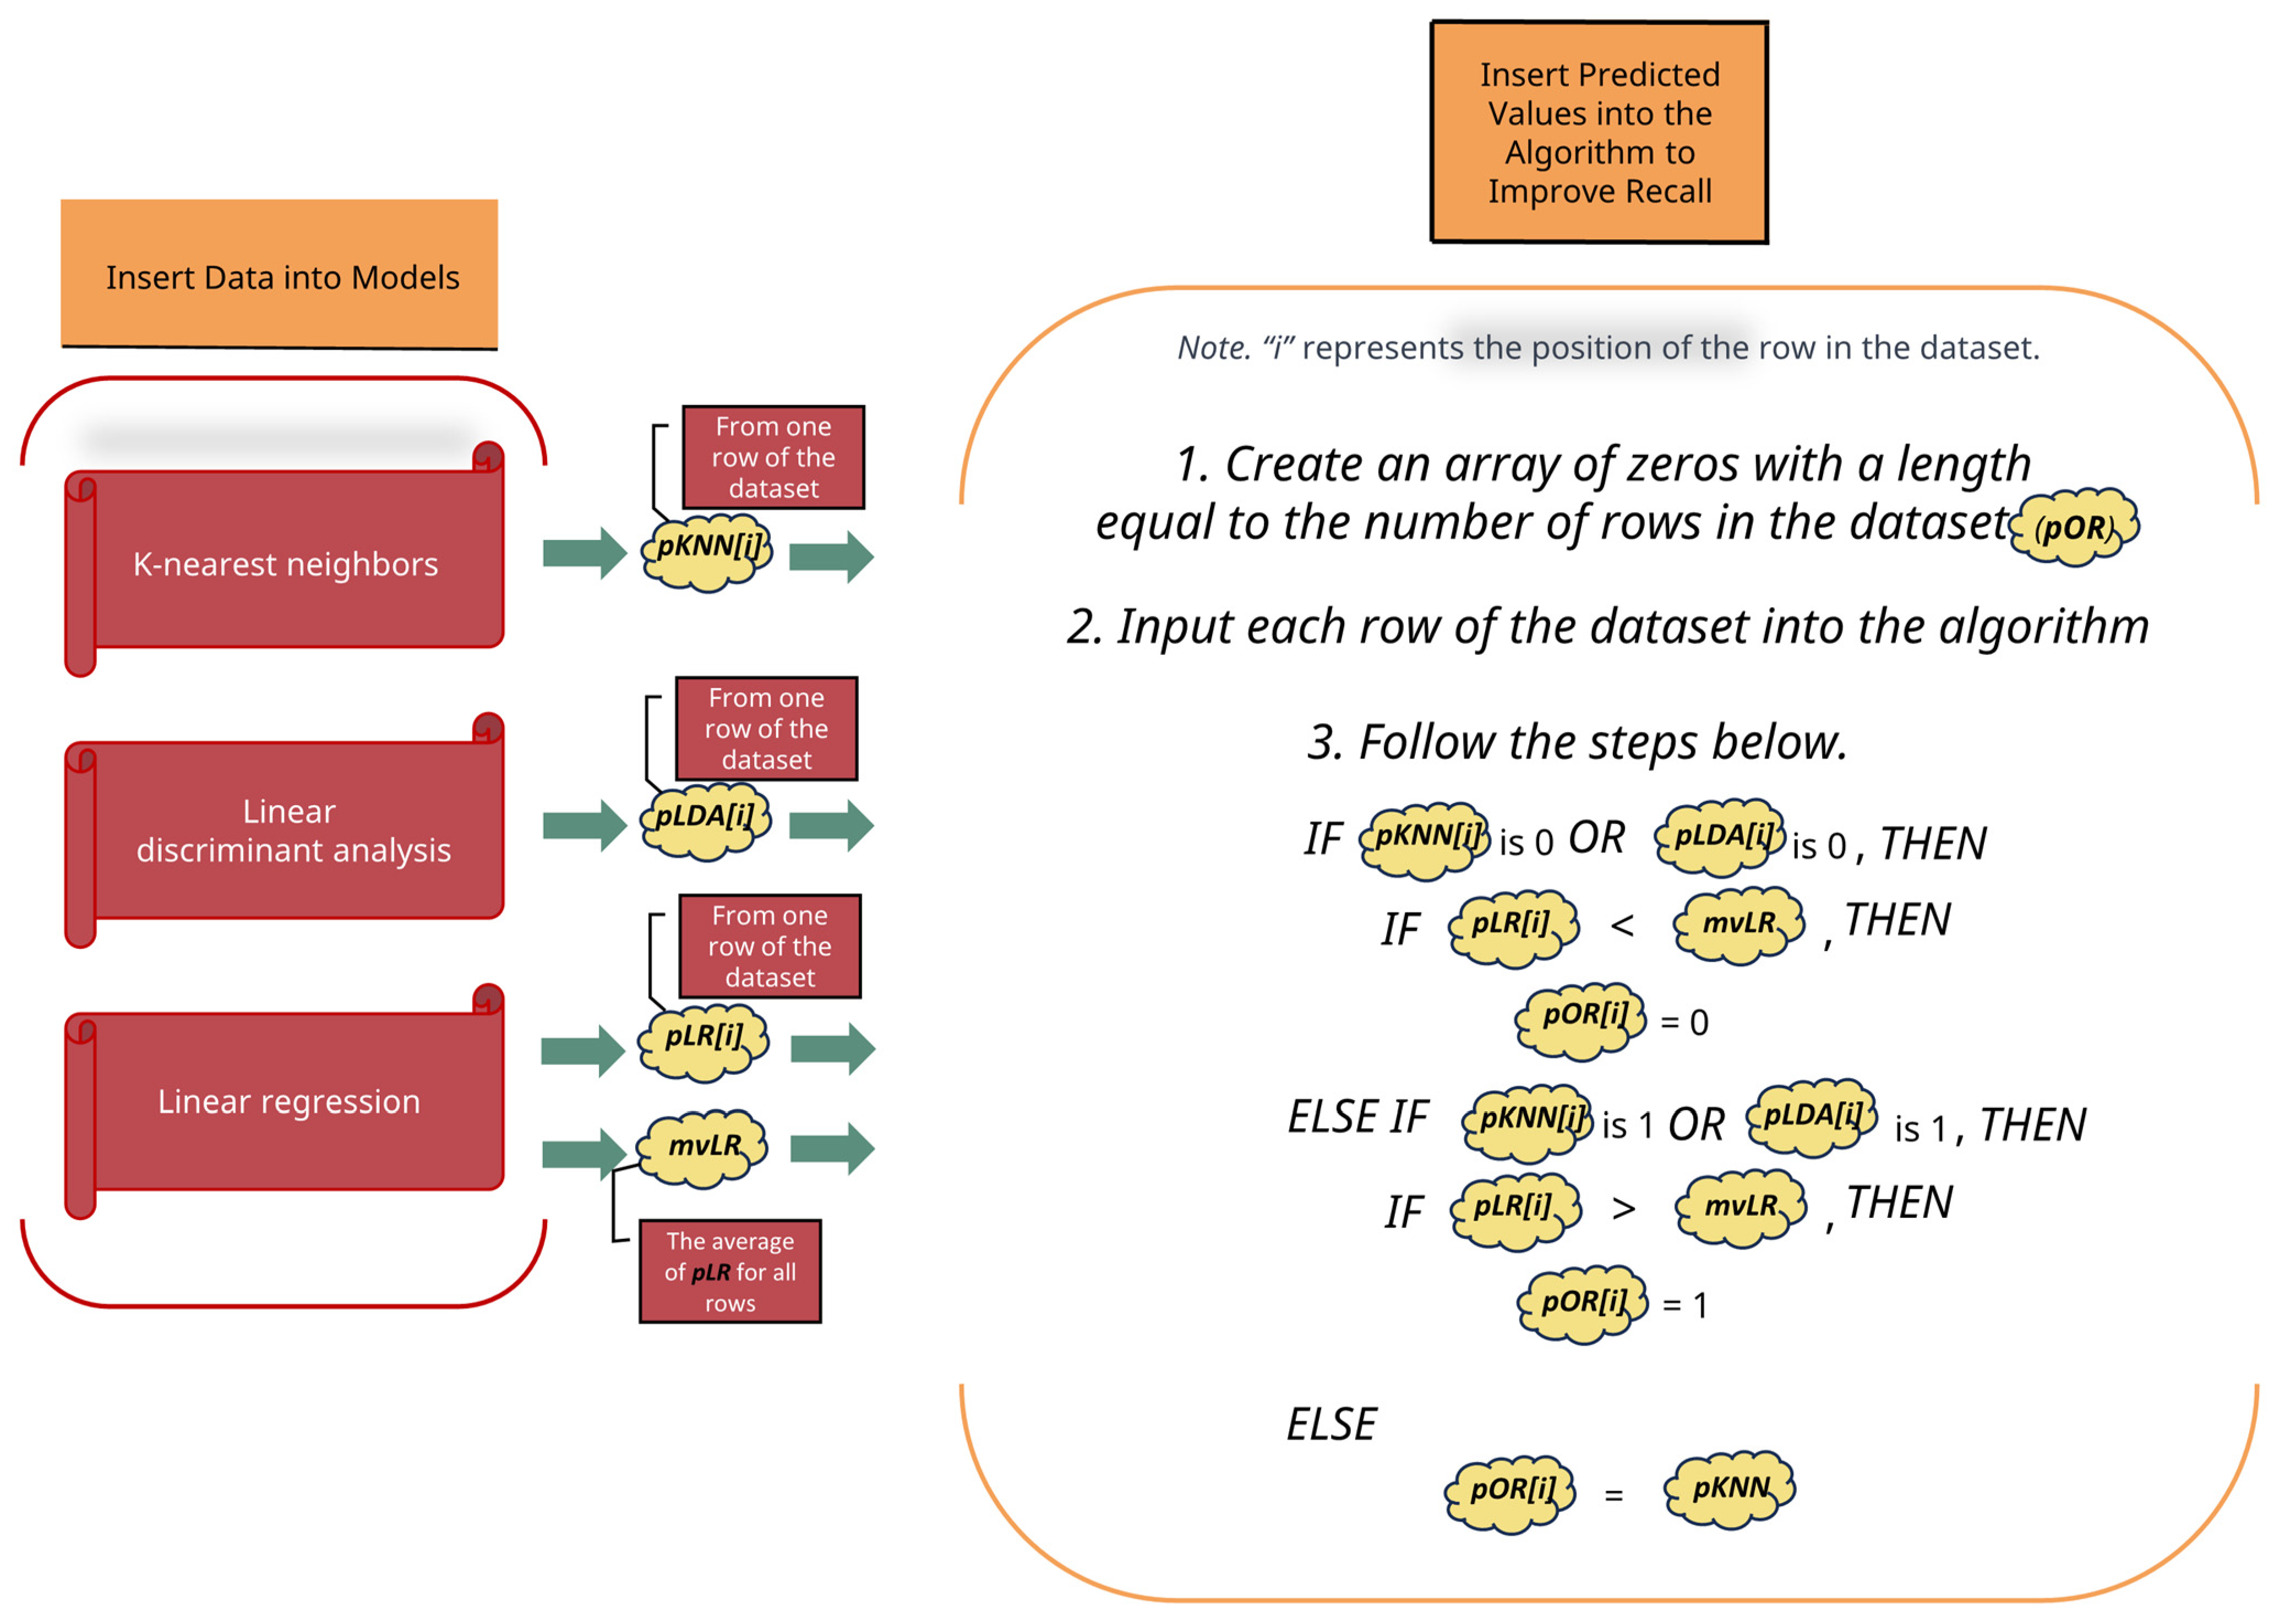
- If pKNN[i] is 0 or pLDA[i] is 0, and pLR[i] is less than mvLR, then pOR[i] is set to 0.
- Conversely, if pKNN[i] is 1 or pLDA[i] is 1, and pLR[i] is greater than mvLR, then set pOR[i] to 1.
- If neither of the conditions is met in a particular row, pOR[i] simply takes on the value of pKNN[i].
- As “i” progresses through the dataset rows, the pOR array is modified accordingly based on the logic applied.
4. Results and Setup
4.1. Results
4.2. Hardware and Software Setup
- Central Processing Unit: 13th Gen Intel® Core™ i5-13500 2.50 GHz
- Random Access Memory: DDR5 32.0 GB
- JupyterLab 3.3.2
- Pandas 1.5.3
- Plotly 5.15.0
- PyCaret 3.0.4
- Python 3.9.7
- Scikit-learn 1.2.2
5. Discussion
6. Conclusions
Author Contributions
Funding
Acknowledgments
Conflicts of Interest
Abbreviations
| DT | Decision Tree |
| ET | Extra Trees |
| GBC | Gradient Boosting Classifier |
| KNN | K-Nearest Neighbor |
| LDA | Linear Discriminant Analysis |
| LGBM | Light Gradient Boosting Machine |
| LR | Linear Regression |
| NB | Naive Bayes |
| QDA | Quadratic Discriminant Analysis |
| RF | Random Forest |
| SVM | Support Vector Machine |
Appendix A

| Index | Dataset # | Top # | Model | Recall | Accuracy | Precision |
|---|---|---|---|---|---|---|
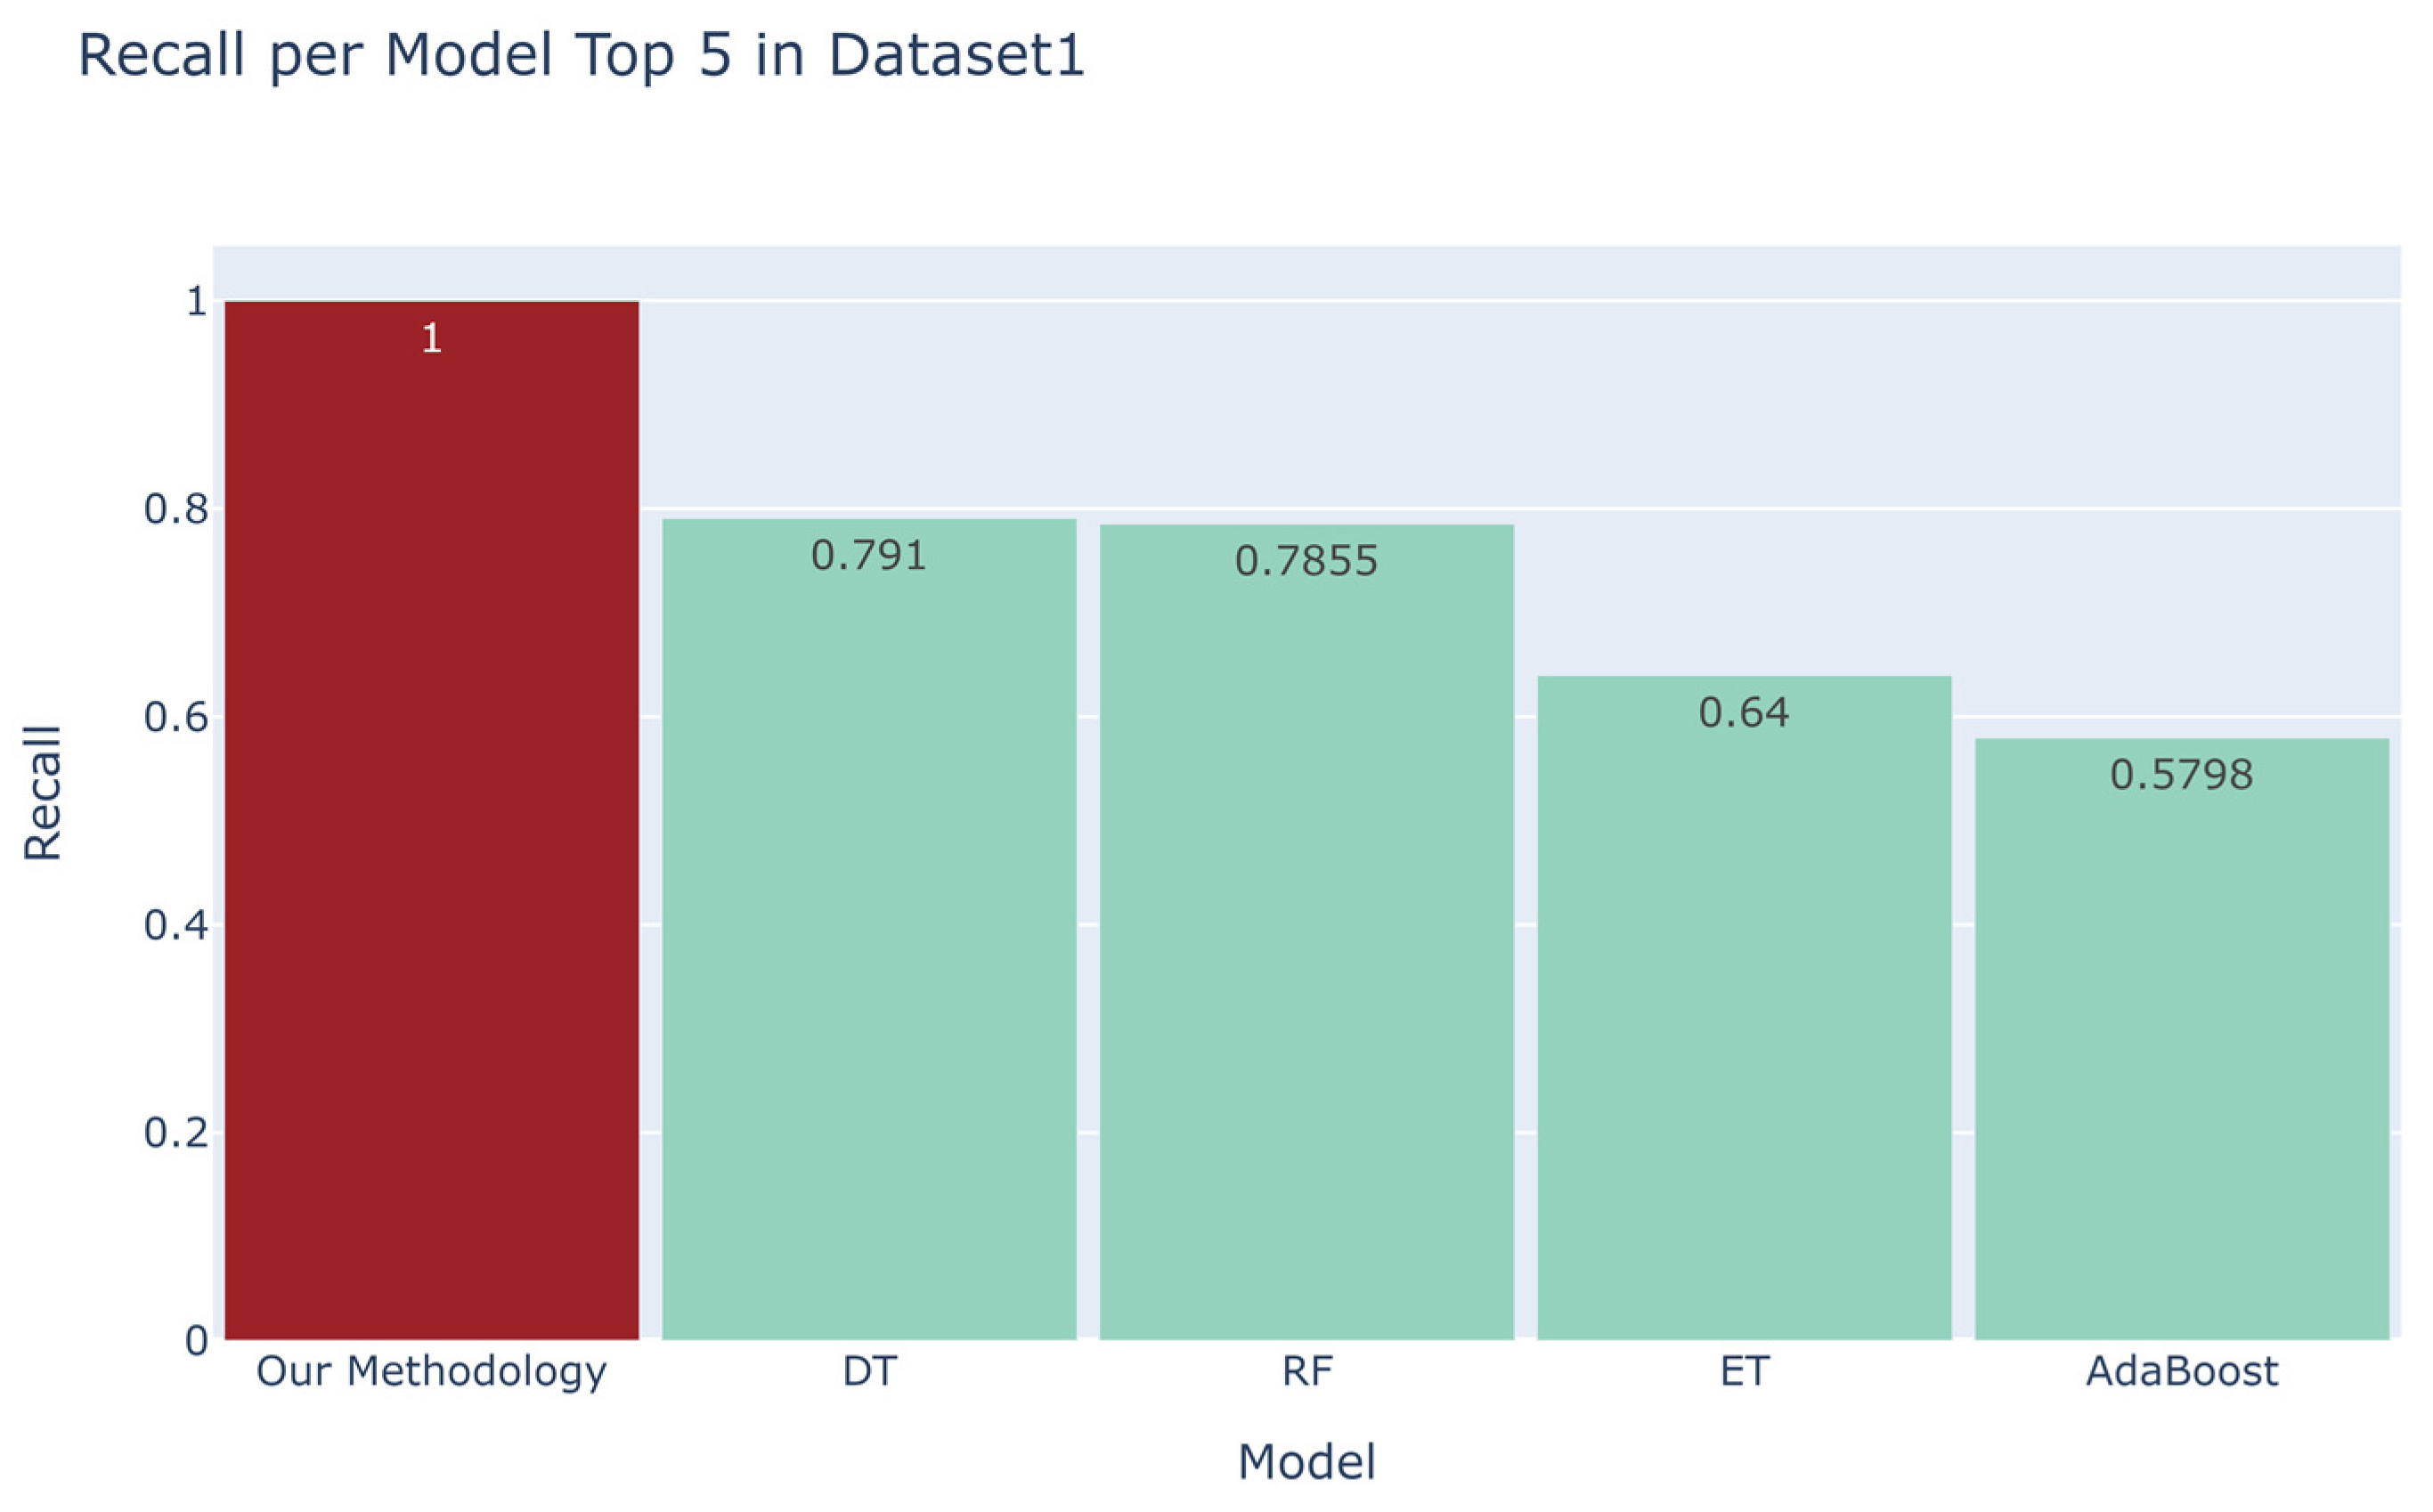
| 1 | 1 | 1 | Our Method | 1.0 | 0.9989 | 0.0656 |
| 2 | 1 | 2 | DT | 0.7910 | 0.9996 | 0.8036 |
| 3 | 1 | 3 | RF | 0.7855 | 0.9998 | 0.9853 |
| 4 | 1 | 4 | ET | 0.6400 | 0.9996 | 0.9982 |
| 5 | 1 | 5 | AdaBoost | 0.5798 | 0.9995 | 0.9549 |
| 6 | 2 | 1 | Our Method | 0.9701 | 0.9951 | 0.0635 |
| 7 | 2 | 2 | QDA | 0.3054 | 0.9900 | 0.1938 |
| 8 | 2 | 3 | LDA | 0.3027 | 0.9907 | 0.2092 |
| 9 | 2 | 4 | GBC | 0.2810 | 0.9956 | 0.6450 |
| 10 | 2 | 5 | LGBM | 0.2423 | 0.9949 | 0.4906 |
| 11 | 3 | 1 | Our Method | 1.0 | 0.9873 | 0.2440 |
| 12 | 3 | 2 | LGBM | 0.6508 | 0.9931 | 0.9149 |
| 13 | 3 | 3 | DT | 0.6447 | 0.9861 | 0.5822 |
| 14 | 3 | 4 | RF | 0.6300 | 0.9926 | 0.9052 |
| 15 | 3 | 5 | GBC | 0.5916 | 0.9925 | 0.9476 |
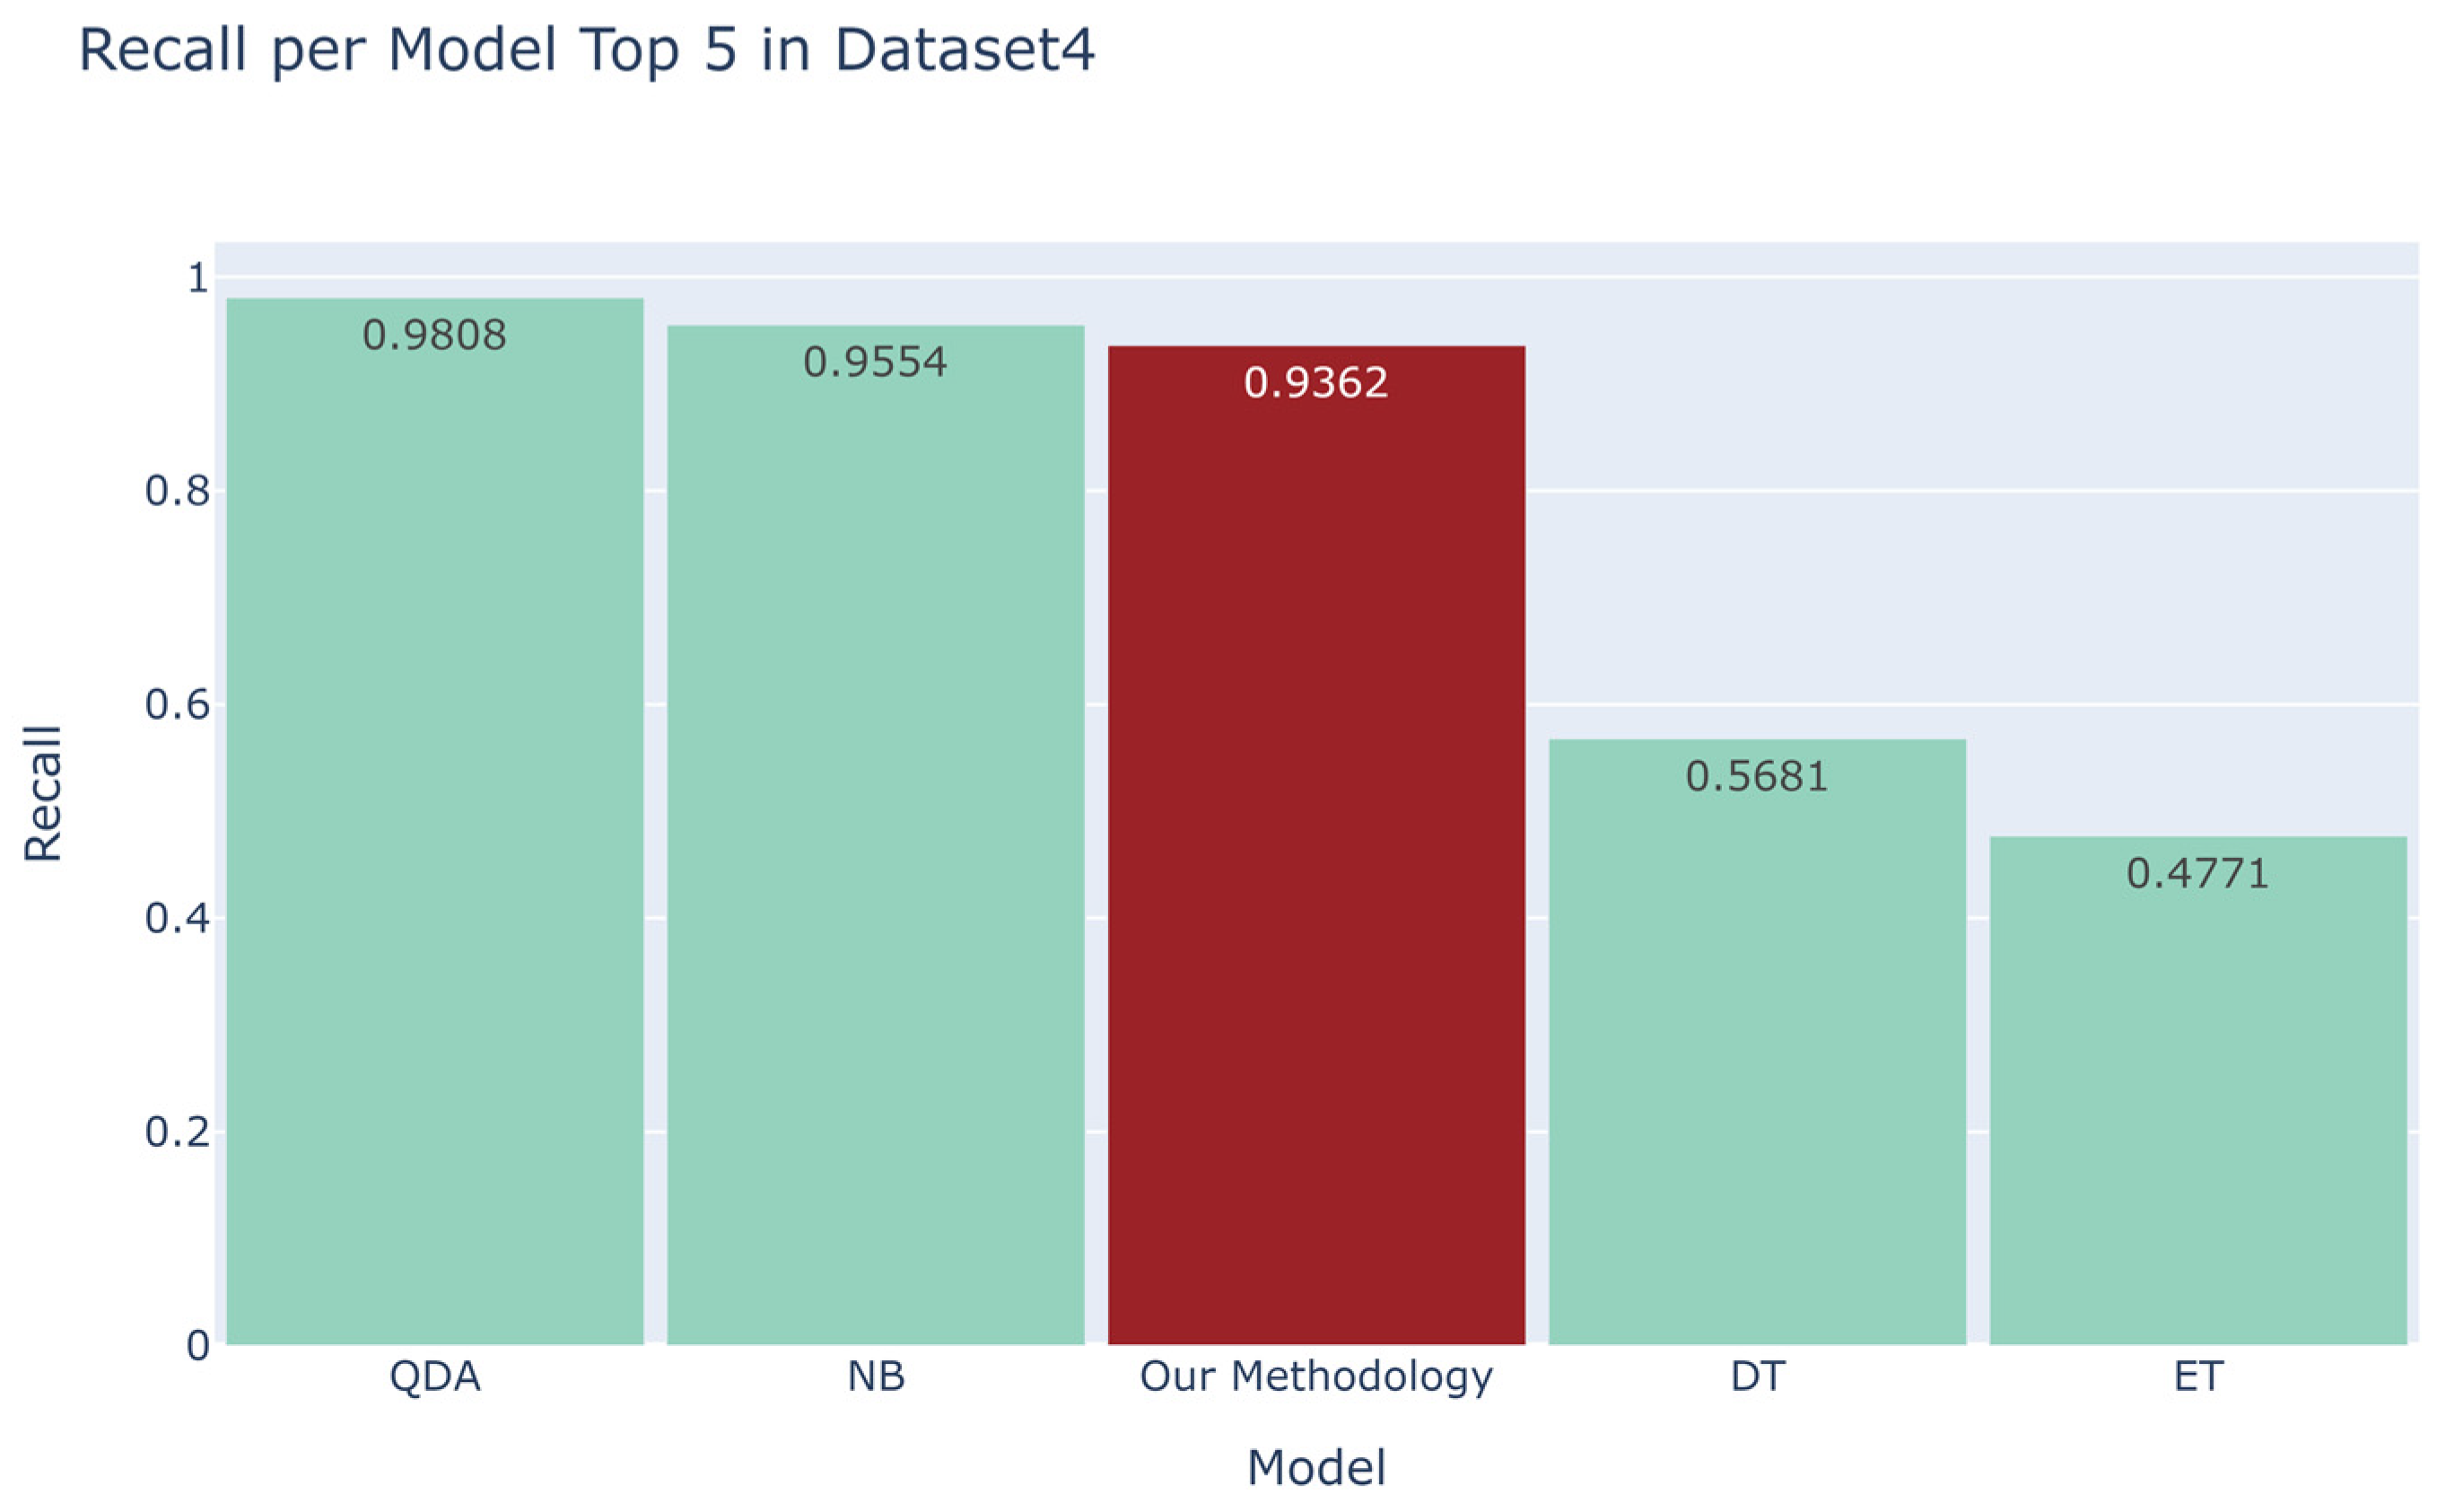
| 16 | 4 | 1 | QDA | 0.9808 | 0.1135 | 0.0373 |
| 17 | 4 | 2 | NB | 0.9554 | 0.0500 | 0.0340 |
| 18 | 4 | 3 | Our Method | 0.9362 | 0.9664 | 0.0429 |
| 19 | 4 | 4 | DT | 0.5681 | 0.9666 | 0.5207 |
| 20 | 4 | 5 | ET | 0.4771 | 0.9801 | 0.9137 |
References
- Fraud—Quick Search Results. Available online: https://www.oed.com/search/dictionary/?scope=Entries&q=fraud (accessed on 28 July 2023).
- Cherif, A.; Badhib, A.; Ammar, H.; Alshehri, S.; Kalkatawi, M.; Imine, A. Credit card fraud detection in the era of disruptive technologies: A systematic review. J. King Saud Univ. Comput. Inf. Sci. 2022, 35, 145–174. [Google Scholar] [CrossRef]
- Davidson, A. Card Not Present Fraud Is Skyrocketing. National Association of Federally-Insured Credit Unions. Available online: https://www.nafcu.org/nafcuservicesnafcu-services-blog/card-not-present-fraud-skyrocketing (accessed on 28 July 2023).
- Security.org Team. 2023 Credit Card Fraud Report. Security.org. Available online: https://www.security.org/digital-safety/credit-card-fraud-report/ (accessed on 28 July 2023).
- Department of Financial Payment, Bank of Korea. Payment and Settlement Survey Data: Current Status and Implications of Discussions on Cross-Border Payment and Settlement Systems in Major Countries. Available online: https://www.bok.or.kr/portal/bbs/B0000232/view.do?nttId=10068027&menuNo=200706 (accessed on 28 July 2023).
- Zheng, L.; Liu, G.; Yan, C.; Jiang, C. Transaction Fraud Detection Based on Total Order Relation and Behavior Diversity. IEEE Trans. Comput. Soc. Syst. 2018, 5, 796–806. [Google Scholar] [CrossRef]
- Lei, J.Z.; Ghorbani, A.A. Improved competitive learning neural networks for network intrusion and fraud detection. Neurocomputing 2011, 75, 135–145. [Google Scholar] [CrossRef]
- Prasetiyo, B.; Alamsyah Muslim, M.A.; Baroroh, N. Evaluation performance recall and F2 score of credit card fraud detection unbalanced dataset using SMOTE oversampling technique. In Journal of Physics: Conference Series; IOP Publishing: Bristol, UK, 2021. [Google Scholar]
- Gupta, A.; Anand, A.; Hasija, Y. Recall-based Machine Learning approach for early detection of Cervical Cancer. In Proceedings of the 2021 6th International Conference for Convergence in Technology (I2CT), Maharashtra, India, 2–4 April 2021. [Google Scholar]
- Murugappan, M. Electromyogram signal based human emotion classification using KNN and LDA. In Proceedings of the IEEE International Conference on System Engineering and Technology, Shah Alam, Malaysia, 27–28 June 2011. [Google Scholar]
- Starzacher, A.; Rinner, B. Evaluating KNN, LDA and QDA Classification for embedded online Feature Fusion. In Proceedings of the 2008 International Conference on Intelligent Sensors, Sensor Networks and Information Processing, Sydney, NSW, Australia, 15–18 December 2008. [Google Scholar]
- Lopez-Bernal, D.; Balderas, D.; Ponce, P.; Molina, A. Education 4.0: Teaching the Basics of KNN, LDA and Simple Perceptron Algorithms for Binary Classification Problems. Future Internet 2021, 13, 193. [Google Scholar] [CrossRef]
- Save, P.; Tiwarekar, P.; Jain, K.N.; Mahyavanshi, N. A novel idea for credit card fraud detection using decision tree. Int. J. Comput. Appl. 2017, 161, 6–9. [Google Scholar] [CrossRef]
- Husejinovic, A. Credit card fraud detection using naive Bayesian and c4. 5 decision tree classifiers. Credit Card Fraud Detect. Using Naive Bayesian C 2020, 4, 1–5. [Google Scholar]
- Şahin, Y.G.; Duman, E. Detecting credit card fraud by decision trees and support vector machines. In Proceedings of the International MultiConference of Engineers and Computer Scientists 2011, Hong Kong, China, 16–18 March 2011. [Google Scholar]
- Xuan, S.; Liu, G.; Li, Z.; Zheng, L.; Wang, S.; Jiang, C. Random forest for credit card fraud detection. In Proceedings of the 2018 IEEE 15th international conference on networking, sensing and control (ICNSC), Zhuhai, China, 27–29 March 2018; IEEE: Piscataway, NJ, USA, 2018; pp. 1–6. [Google Scholar]
- Kumar, M.S.; Soundarya, V.; Kavitha, S.; Keerthika, E.S.; Aswini, E. Credit card fraud detection using random forest algorithm. In Proceedings of the 2019 3rd International Conference on Computing and Communications Technologies (ICCCT), Gangtok, India, 21 February 2019; IEEE: Piscataway, NJ, USA, 2019; pp. 149–153. [Google Scholar]
- Lopez-Rojas, E. Synthetic Financial Datasets For Fraud Detection. Kaggle. Available online: https://www.kaggle.com/datasets/ealaxi/paysim1 (accessed on 29 July 2023).
- Shenoy, K. Credit Card Transactions Fraud Detection Dataset. Kaggle. Available online: https://www.kaggle.com/datasets/kartik2112/fraud-detection (accessed on 29 July 2023).
- Yadav, S. Credit-Card-Fraud Detection-Imbalanced-Dataset. Kaggle. Available online: https://www.kaggle.com/datasets/dark06thunder/credit-card-dataset (accessed on 29 July 2023).
- IEEE Computational Intelligence Society. IEEE-CIS Fraud Detection. Kaggle. Available online: https://www.kaggle.com/competitions/ieee-fraud-detection (accessed on 29 July 2023).
- Sahin, Y.; Duman, E. Detecting credit card fraud by ANN and logistic regression. In Proceedings of the 2011 international symposium on innovations in intelligent systems and applications, Istanbul, Turkey, 15 June 2011; IEEE: Piscataway, NJ, USA, 2011; pp. 315–319. [Google Scholar]
- Zahoora, U.; Rajarajan, M.; Pan, Z.; Khan, A. Zero-day ransomware attack detection using deep contractive autoencoder and voting based ensemble classifier. Appl. Intell. 2022, 52, 13941–13960. [Google Scholar] [CrossRef]
- Verma, R.; Chandra, S. RepuTE: A soft voting ensemble learning framework for reputation-based attack detection in fog-IoT milieu. Eng. Appl. Artif. Intell. 2023, 118, 105670. [Google Scholar] [CrossRef]
- Malik, E.F.; Khaw, K.W.; Belaton, B.; Wong, W.P.; Chew, X. Credit card fraud detection using a new hybrid machine learning architecture. Mathematics 2022, 10, 1480. [Google Scholar] [CrossRef]
- Jiang, S.; Dong, R.; Wang, J.; Xia, M. Credit Card Fraud Detection Based on Unsupervised Attentional Anomaly Detection Network. Systems 2023, 11, 305. [Google Scholar] [CrossRef]
- Akshaya, V.; Sathyapriya, M.; Ranjini Devi, R.; Sivanantham, S. Detecting Credit Card Fraud Using Majority Voting-Based Machine Learning Approach. In Intelligent Systems and Sustainable Computing: Proceedings of ICISSC 2021; Springer Nature: Singapore, 2022; pp. 327–334. [Google Scholar]
- Cai, Q.; He, J. Credit Payment Fraud detection model based on TabNet and Xgboot. In Proceedings of the 2022 2nd International Conference on Consumer Electronics and Computer Engineering (ICCECE), Guangzhou, China, 14–16 January 2022; IEEE: Piscataway, NJ, USA, 2022; pp. 823–826. [Google Scholar]
- Nguyen, N.; Duong, T.; Chau, T.; Nguyen, V.H.; Trinh, T.; Tran, D.; Ho, T. A proposed model for card fraud detection based on Catboost and deep neural network. IEEE Access 2022, 10, 96852–96861. [Google Scholar] [CrossRef]
- Cochrane, N.; Gomez, T.; Warmerdam, J.; Flores, M.; Mccullough, P.; Weinberger, V.; Pirouz, M. Pattern Analysis for Transaction Fraud Detection. In Proceedings of the IEEE Annual Computing and Communication Workshop and Conference (CCWC), Las Vegas, NV, USA, 27–30 January 2021. [Google Scholar]
- Peterson, L.E. K-nearest neighbor. Scholarpedia 2009, 4, 1883. [Google Scholar] [CrossRef]
- Buckland, M.; Gey, F. The relationship between recall and precision. J. Am. Soc. Inf. Sci. 1994, 45, 12–19. [Google Scholar] [CrossRef]


| Author | Year | Method | Shortfall |
|---|---|---|---|
| Zahoora et al. [23] | 2022 | Achieved a high recall value in detecting zero-day ransomware by employing a self-made voting mechanism. This mechanism was a combination of Contractive Autoencoder (CAE) and four combination rules. | Due to the limited scope of the dataset they utilized, the generalizability of their method cannot be assured when applied to entirely different datasets. |
| Verma and Chandra [24] | 2023 | Proposed a RepuTE Framework aimed at enhancing trust in fog computing, using a soft-voting ensemble model to classify and predict DoS/DDoS and Sybil attacks. The model achieved a 99.99% accuracy rate, outperforming existing solutions. | In imbalanced scenarios like credit card fraud datasets, the method’s effectiveness is uncertain. |
| Malik et al. [25] | 2022 | Evaluated performance from seven hybrid models, which are in conjunction with AdaBoost, and found that AdaBoost combined with LGBM shows high performance in terms of ROC score. | No mention of accuracy. As will be elaborated later in this study, while the NB model shows high recall, its accuracy is conspicuously low. |
| Jiang et al. [26] | 2023 | Proposed a novel unsupervised attentional anomaly detection network-based framework for credit card fraud detection (UAAD-FDNet) designed to achieve high precision, recall, F1 score, and AUC. | Recall is relatively low compared to precision, F1 score, and AUC score. It could have been higher. One dataset was employed. |
| Akshaya et al. [27] | 2022 | Comparing the predictive performance of various models, including logistic regression, GBC, KNN, and RF, it was found that a voting classifier, which leverages these aforementioned models, yields the highest accuracy and F1 score. | In terms of recall, the voting classifier presented low performance according to their data. |
| Cai and He [28] | 2022 | Proposed a hybrid model in conjunction with XGBoost and TabNet after replacing the missing value with −999 in order to reach a high AUC score and accuracy. | Comparison of performance was implemented with only four models and one dataset. AUC score and accuracy were only considered, and detailed recall was not introduced. |
| Nguyen et al. [29] | 2022 | Evaluated the AUC score using catboost and deep neural networks after categorizing credit card users as either old or new. Feature engineering and transformations were also implemented to achieve a high AUC score. | Detailed information about recall and precision was not provided, and only one dataset was employed. |
| Cochrane et al. [30] | 2021 | Combined predicted values from LR, DT, and logistic regression models and applied a particular formula to elevate recall and precision. | Only recall and precision are considered, and accuracy is not mentioned. The performance could have been higher. |
| Index | Model | Accuracy | Recall |
|---|---|---|---|
| 1 | Our Method | 0.9664 | 0.9362 |
| 2 | QDA | 0.1135 | 0.9808 |
| 3 | NB | 0.0500 | 0.9554 |
Disclaimer/Publisher’s Note: The statements, opinions and data contained in all publications are solely those of the individual author(s) and contributor(s) and not of MDPI and/or the editor(s). MDPI and/or the editor(s) disclaim responsibility for any injury to people or property resulting from any ideas, methods, instructions or products referred to in the content. |
© 2023 by the authors. Licensee MDPI, Basel, Switzerland. This article is an open access article distributed under the terms and conditions of the Creative Commons Attribution (CC BY) license (https://creativecommons.org/licenses/by/4.0/).
Share and Cite
Chung, J.; Lee, K. Credit Card Fraud Detection: An Improved Strategy for High Recall Using KNN, LDA, and Linear Regression. Sensors 2023, 23, 7788. https://doi.org/10.3390/s23187788
Chung J, Lee K. Credit Card Fraud Detection: An Improved Strategy for High Recall Using KNN, LDA, and Linear Regression. Sensors. 2023; 23(18):7788. https://doi.org/10.3390/s23187788
Chicago/Turabian StyleChung, Jiwon, and Kyungho Lee. 2023. "Credit Card Fraud Detection: An Improved Strategy for High Recall Using KNN, LDA, and Linear Regression" Sensors 23, no. 18: 7788. https://doi.org/10.3390/s23187788
APA StyleChung, J., & Lee, K. (2023). Credit Card Fraud Detection: An Improved Strategy for High Recall Using KNN, LDA, and Linear Regression. Sensors, 23(18), 7788. https://doi.org/10.3390/s23187788