Article

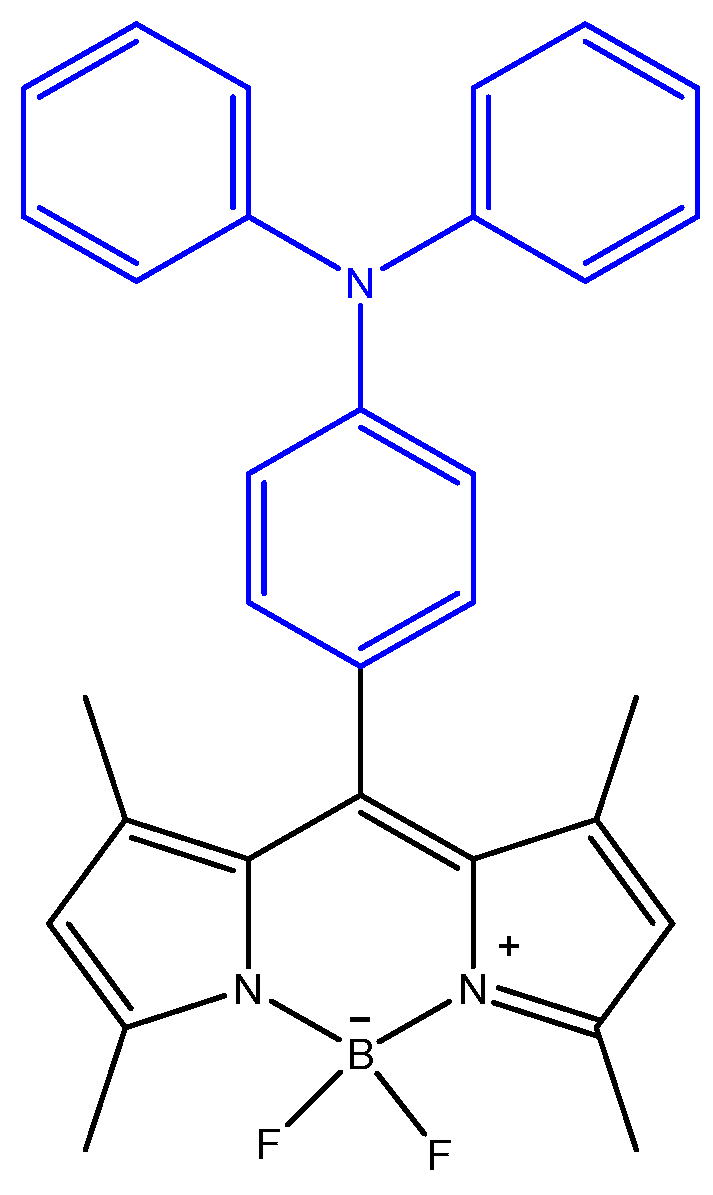
Colorimetric Chemosensor for Cu2+ and Fe3+ Based on a meso-Triphenylamine-BODIPY Derivative

by
Sónia C. S. Pinto
,
Raquel C. R. Gonçalves
,
Susana P. G. Costa
and
M. Manuela M. Raposo
*
Centre of Chemistry, University of Minho, Campus de Gualtar, 4710-057 Braga, Portugal
*
Author to whom correspondence should be addressed.
Sensors 2023, 23(15), 6995; https://doi.org/10.3390/s23156995
Submission received: 9 July 2023 / Revised: 29 July 2023 / Accepted: 31 July 2023 / Published: 7 August 2023
(This article belongs to the Special Issue Colorimetric Sensors: Methods and Applications)

Abstract

:
Optical chemosensors are a practical tool for the detection and quantification of important analytes in biological and environmental fields, such as Cu2+ and Fe3+. To the best of our knowledge, a BODIPY derivative capable of detecting Cu2+ and Fe3+ simultaneously through a colorimetric response has not yet been described in the literature. In this work, a meso-triphenylamine-BODIPY derivative is reported for the highly selective detection of Cu2+ and Fe3+. In the preliminary chemosensing study, this compound showed a significant color change from yellow to blue–green in the presence of Cu2+ and Fe3+. With only one equivalent of cation, a change in the absorption band of the compound and the appearance of a new band around 700 nm were observed. Furthermore, only 10 equivalents of Cu2+/Fe3+ were needed to reach the absorption plateau in the UV-visible titrations. Compound 1 showed excellent sensitivity toward Cu2+ and Fe3+ detection, with LODs of 0.63 µM and 1.06 µM, respectively. The binding constant calculation indicated a strong complexation between compound 1 and Cu2+/Fe3+ ions. The 1H and 19F NMR titrations showed that an increasing concentration of cations induced a broadening and shifting of the aromatic region peaks, as well as the disappearance of the original fluorine peaks of the BODIPY core, which suggests that the ligand–metal (1:2) interaction may occur through the triphenylamino group and the BODIPY core.

1. Introduction

Metal ions play a crucial role in several biological processes, nutrient cycling, and the functioning of the ecosystem. However, the deregulation of ionic concentrations represents a potential risk to living organisms and the ecosystem, leading to health problems and environmental pollution [1,2,3]. Concerning biological systems, metal ions are considered important elements that regulate and participate in several extra- and intra-cellular processes, such as osmotic pressure regulation, cell signaling (e.g., neurotransmission and muscle contraction), protein and enzyme activity required for oxygen transport, energy production, the regulation of gene expression, and the synthesis of essential molecules [4].
Among several other ions, Cu2+ and Fe3+ play an important role in various biochemical processes; however, the deregulation of the homeostasis of these cations has been identified as the primary cause of many diseases. For example, high levels of Cu2+ can lead to a higher production of reactive oxygen species (ROS) which contributes to the development of different pathologies, such as cancer and neurodegenerative diseases, including Menkes, Wilson, and Alzheimer’s. Moreover, studies have shown that copper levels in the blood serum of cancer patients are considerably above normal values. In contrast, iron deficiency is also associated with several diseases, such as anemia, diabetes, Parkinson’s, and dysfunction of the heart, pancreas, and liver [5,6,7,8]. Apart from that, these elements are non-biodegradable, which is an increased risk for the environment and human health. In this sense, the detection of these two important cations has been a major goal [9,10,11].
Colorimetric sensors are a practical tool for the detection and quantification of these analytes with biological and environmental importance. Compared to other analytical techniques, optical chemosensing displays advantages, including simplicity, speed of response, easy and direct visualization of the results, non-expensive equipment, and high selectivity and sensitivity. For those reasons, investment has been made in the design and synthesis of colorimetric sensors for the detection of these cations of interest. Several chemosensors based on rhodamine, aldazine, carbazole, tetrathiafulvalene spirooxazine, triarylimidazopyridine, and Schiff base core have been developed for the detection of Cu2+ and Fe3+ [9,10,12,13,14,15,16,17,18,19].
4,4-Difluoro-4-bora-3a,4a-diaza-s-indacene, also known as BODIPY, has been recognized as a remarkable chromophore scaffold due to its excellent photophysical properties, such as high molar absorptivity coefficients, narrow and intense absorption bands in the visible range, and great photostability. Furthermore, the core of BODIPY can be functionalized in order to improve its photophysical properties for its intended applications [20,21]. Although several chemosensors based on a BODIPY core have been reported for the detection of Cu2+ and Fe3+, these sensors detect these cations separately [22,23,24]. Most of these chemosensors also display a fluorimetric response which requires specialized equipment for the visualization of the results. In contrast, chemosensors that are based on a colorimetric response provide direct and real-time detection and identification of the target analyte. To the best of our knowledge, a BODIPY derivative capable of detecting Cu2+ and Fe3+ simultaneously through a colorimetric response has not yet been described in the literature. Additionally, given the paramagnetic behavior of Cu2+ and Fe3+ and, consequently, their fluorescence quenching effect, optical sensors with an intense colorimetric response for these analytes are extremely attractive [25,26].
In continuation of the research developed by our group [27,28,29,30], we present an evaluation of the ion chemosensory ability of a meso-triphenylamine-BODIPY 1 in this work (TPA-BODIPY, Figure 1), which was recently synthesized by us [31,32]. The chemosensory ability was investigated by a preliminary study against several cations and anions with biomedical relevance, followed by spectrophotometric titrations, the Job’s plot method, and 1H NMR titrations.

2. Materials and Methods

2.1. Materials

All absorption measurements were obtained using a Shimadzu UV/3101PC spectrophotometer (200–800 nm). 1H NMR analysis was carried out on a Bruker Avance III apparatus at an operating frequency of 400 MHz at 25 °C using the solvent peak as an internal reference. The deuterated solvent used was DMSO-d6 with 99.8% deuteration degree which contained <0.02% v/v of water (Euriso-top). All commercial reagents and solvents were used as received. BODIPY 1 was previously synthesized by our research group [31,32].

2.2. Synthesis of BODPY Derivative 1

2,4-Dimethylpyrrole (1.0 mmol) and 4-(diphenylamino)-benzaldehyde (1.0 mmol) were dissolved in dry dichloromethane (DCM) (100 mL) in the presence of a catalytical amount of trifluoroacetic acid (TFA). The reaction mixture was stirred at room temperature for 50 min. 2,3-Dichloro-5,6-dicyano-1,4-benzoquinone (1.9 mmol) dissolved in dry DCM (100 mL) was added to the reaction mixture, and the stirring time was extended for another 50 min. Triethylamine (16 mmol) was added, followed by treatment with BF3.OEt2 (26.8 mmol). After stirring for 30 min, the mixture was evaporated under reduced pressure, and the crude residue was purified by dry flash chromatography using a petroleum ether/ethyl acetate (4:1) mixture as the eluent. The pure BODIPY derivative 1 (Figure 1) was obtained as a dark red and orange solid with a 16% yield. 1H NMR (400 MHz, CDCl3): δ = 1.60 (s, 6H, CH3-1 and CH3-7), 2.57 (s, 6H, CH3-3 and CH3-5), 6.02 (s, 2H, H-2 and H-6), 7.06–7.19 (m, 9H, 9 × Ar-H), and 7.22–7.27 (m, 5H, 5 × Ar-H) ppm. 13C RMN (100.6 MHz, CDCl3): δ = 14.56, 121.16, 123.30, 123.46, 124.72, 128.881, and 129.45 ppm. MS (ESI) m/z (%): 493 ([M + 2]+•, 10), 492 ([M + 1]+•, 46), 491 ([M]+•, 100), 419 (13), and 274 (20). HRMS (ESI) m/z: [M]+• calculated for C31H28BF2N3, 491.2339 was found to be 491.2345.

2.3. Photophysical Characterization of BODIPY Derivative 1

The photophysical characterization of BODIPY derivative 1 in acetonitrile (1 × 10⁻⁵ M) was carried out using a standard quartz cells 1 cm optical path. A 1 × 10⁻⁵ M Rhodamine 6G (ΦF = 0.95) solution in ethanol was used as a fluorescence standard [33]. Fluorescence was measured after excitation of the compound and as the standard at the maximum absorption wavelength of BODIPY 1. The relative quantum fluorescence yield of BODIPY 1 was calculated using Equation (1).
Φ F c o m p = A s × F c o m p × n s 2 A c o m p × F s × n c o m p 2 × Φ F s
where As and Acomp, Fs and Fcomp, and ns and ncomp correspond to the absorbances, areas under the fluorescence curve, and refractive index value of the solvent of the standard and compound 1, respectively.

2.4. Preliminary Chemosensory Tests

The preliminary study of the chemosensory capacity of the BODIPY 1 (1 × 10⁻⁵ M) was carried out in acetonitrile (ACN). The cation solutions (Ag+, K+, Li+, Na+, Cu+, TBT+, Cs2+, Hg2+, Ca2+, Co2+, Pb2+, Mn2+, Fe2+, Zn2+, Ni2+, Cd2+, Cu2+, Pd2+, Sn2+, Fe3+, and Al3+) in the form of perchlorate salts, except for Pd2+ and Li+ whose counter-ion was tetrafluoroborate, were prepared in ACN with a concentration of 1 × 10⁻² M. These ions were selected due to their biological and environmental interest. Then, 50 equivalents (equiv.) of each ion were added to the solution of the compound, and the color variation of the solutions was visualized under natural light and the fluorescence variation under UV radiation at λmax = 312 nm. The absorption spectrum of BODIPY 1 in the presence of all cations was obtained using 3 mL of BODIPY 1 solution in ACN (1 × 10⁻⁵ M) and 10 equivalents (30 µL) of each cation in acetonitrile (1 × 10⁻² M).

2.5. Spectrophotometric Titrations, Limit of Detection, and Binding Constant

Spectrophotometric titrations were carried out for Cu2+ and Fe3+ since these ions induced a relevant optical response. The titrations were performed at room temperature using the solution of 1 in ACN (1 × 10⁻⁵ M) and the solutions of Cu2+ and Fe3+ in acetonitrile (1 × 10⁻² M). A successive addition of each cation was made to 3 mL of compound 1 solution in a standard quartz cuvette. The absorption graphs were collected until the absorbance reached a plateau.
The limit of detection (LOD) for Cu2+ and Fe3+ was calculated using the slope of the linear zone of absorbance versus the ion concentration graph and the standard deviation of 5 replicates of absorbance measurements of the analyte-free solution. According to these data, the LOD was calculated by the following equation (Equation (2)) [25]:
L O D = 3 σ k
where σ is the standard deviation of the absorbance of the chemosensor without analyte and k is the slope of the linear fitting of the calibration curve.
The binding constant of both complexes was determined using UV-vis titration data and the Benesi–Hildebrand equation (Equation (3)) [34,35]:
1 A A 0 = 1 K a A m a x A 0 I o n n + 1 A m a x A 0
where A0 is the absorbance of 1 in the absence of ion, A is the absorbance of 1 with different concentrations of ion, Amax is the absorbance of 1 at the complete interaction with ion, n is the binding stoichiometry of metal, and Ka is the binding constant value. This Ka value was calculated using the ratio of the intercept to the slope of the straight line from the Benesi–Hildebrand plot.

2.6. Job’s Plot

The binding stoichiometry of the complexes 1-Cu2+ and 1-Fe3+ was determined using the Job’s plot method. The solutions of both ions and compound 1 were prepared in ACN with a final concentration of 5 × 10⁻⁵ M. Then, 0.3–2.7 mL of the compound 1 solution was transferred to vials, and the Cu2+ and Fe3+ solutions were added to each solution of 1 prepared previously to complete a final volume of 3 mL per vial. The UV-vis spectrum of the different samples was recorded at 697/700 nm, and the absorbance values against the molar fractions of each cation—Cu2+ and Fe3+—were plotted.

2.7. 1H and 19F NMR Titration

NMR titrations were accomplished using a similar sequential addition of ion equivalents to the compound solution. For this process, an NMR glass tube with 1 (2.53 mg) dissolved in 600 μL of DMSO-d6 or ACN-d3 and a Cu2+ solution (3 × 10⁻¹ M) in 1000 μL of DMSO-d6 or ACN-d3 were prepared. Then, 0–5 equivalents of Cu2+ were sequentially added to the NMR glass tube, and the 1H NMR spectrum was recorded after each addition.

3. Results and Discussion

3.1. Synthesis of BODIPY 1

BODIPY derivative 1 functionalized at the meso position with the triphenylamino (TPA) group (Figure 1) was previously synthesized by our research group through two reactional steps at room temperature. The first step involved a condensation reaction of 2,4-dimethylpyrrole and 4-(diphenylamino)-benzaldehyde in dichloromethane (DCM) in the presence of a catalytic amount of trifluoroacetic acid (TFA) to form the dipyrromethane core. The second reactional step consisted of the oxidation of dipyrromethane to dipyrromethene through the addition of a solution of 2,3-dichloro-5,6-diciano-p-benzoquinone (DDQ) followed by a complexation reaction with BF3.OEt2 in the presence of triethylamine (Scheme 1). Finally, the crude residue was purified using petroleum ether/ethyl acetate (4:1) as eluent through a dry flash chromatography column, and the pure compound was obtained as an orange solid with a 16% yield. Through the 1H NMR spectrum, it was possible to confirm the presence of the triphenylamine group at the meso position of the BODIPY core, with the characteristic proton signals appearing in the aromatic zone of the spectrum. Additionally, the signals in the 13C NMR spectrum and the obtained data from mass spectrometry were in agreement with the expected structure [31,32].
The D-π-A BODIPY molecule comprises a signaling subunit based on the BODIPY core, as an electron acceptor chromophore that is functionalized at position eight with a recognition subunit based on a TPA group which functions as the electron-donating moiety. Additionally, TPA has been previously reported as the binding site of Fe3+ through the N atom [36].

3.2. Photophysical Characterization of BODIPY Derivative 1

The spectroscopic characterization of BODIPY 1 was carried out in acetonitrile solution (1 × 10⁻⁵ M). The derivative 1 exhibited an intense absorption band (logε = 3.96) at 497 nm, and upon excitation, it showed an emission band at 519 nm. The relative fluorescence quantum yield, which was determined by using Rhodamine 6G in ethanol as a standard (ΦF = 0.95), was found to be quite low (ΦF = 0.005), probably due to the rotational freedom and the higher probability of the occurrence of non-radiative relaxation. The Stokes’ shift of BODIPY derivative 1 was relatively short (22 nm, 454,545.45 cm−1), which is usual for this class of compounds [37].

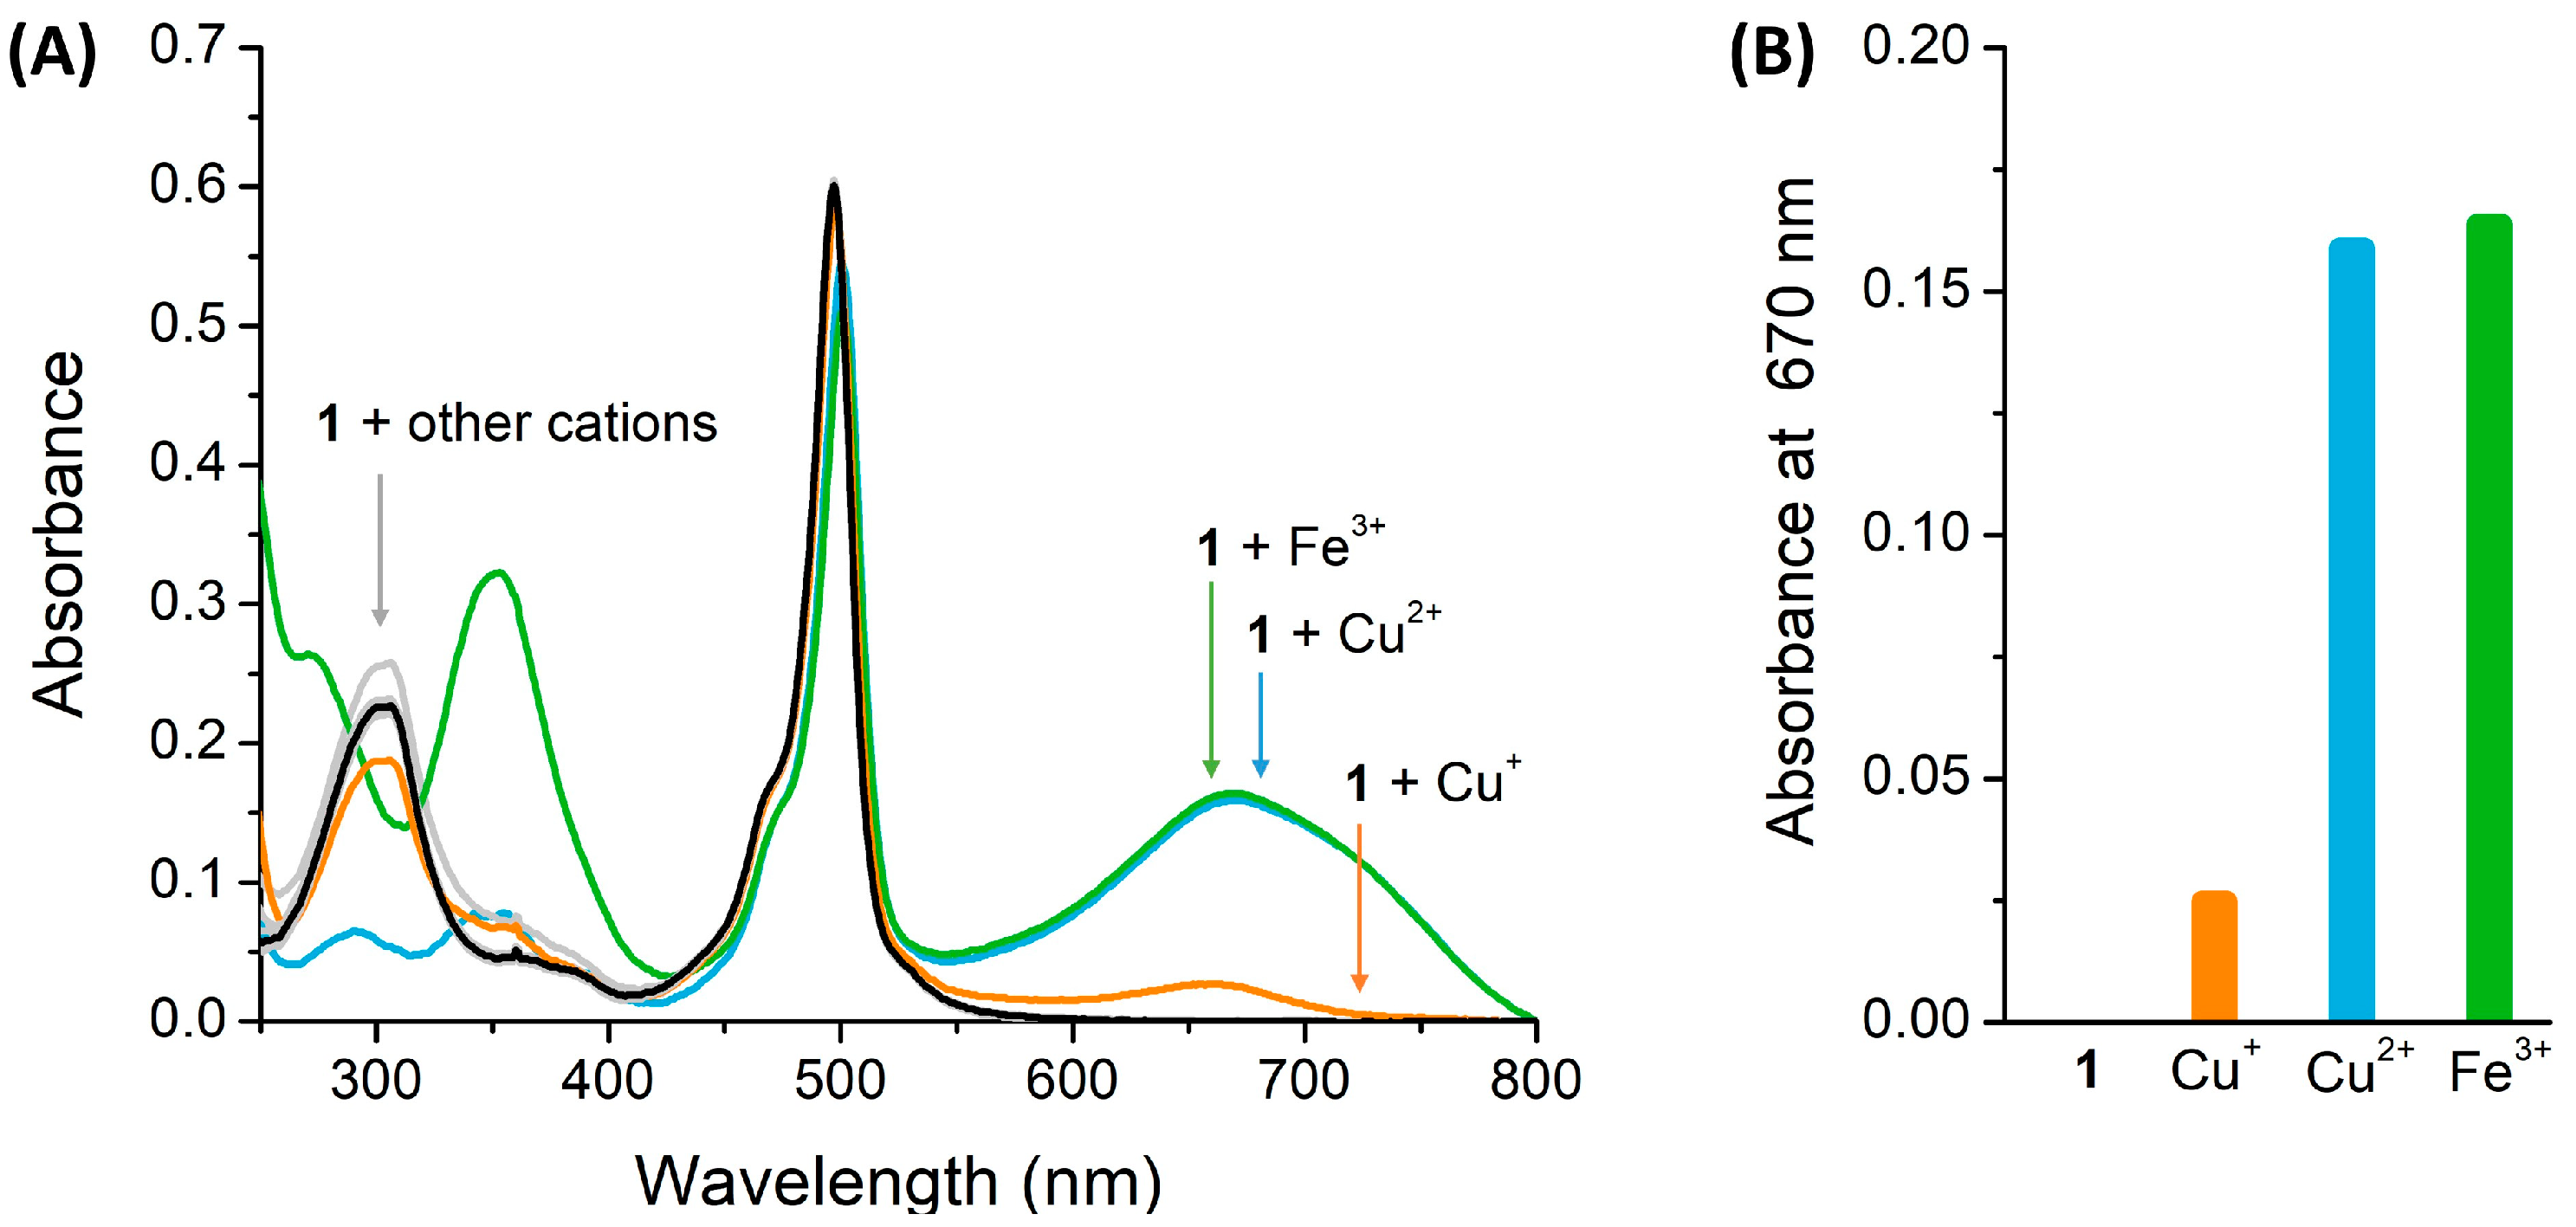
3.3. Preliminary Chemosensing Study

This preliminary chemosensory study is a simple and quick approach to evaluate the possible interaction between BODIPY 1 and different ions. In this sense, the colorimetric and fluorimetric behavior of BODIPY 1 was studied in acetonitrile (ACN) by the addition of 50 equivalents of biologically and environmentally important cations (Ag+, K+, Li+, Na+, Cu+, TBT+, Cs2+, Hg2+, Ca2+, Co2+, Pb2+, Mn2+, Fe2+, Zn2+, Ni2+, Cd2+, Cu2+, Pd2+, Sn2+, Fe3+, and Al3+) to the compound’s solution. Acetonitrile was used as solvent for this study since it is an aprotic solvent which cannot establish hydrogen bonds and interfere with the recognition system.
As shown in Figure 2, the compound 1 solution displays a light yellow color in the absence of any cation. However, upon the addition of 50 equivalents of each ion to the compound solution, a clear color change of the solution from light yellow to blue–green in the presence of Cu2+ and Fe3+ was observed, while other cations were unable to induce a perceptible color change. In contrast, compound 1 did not exhibit fluorescence emission variation in the presence of any cation. Additionally, the preliminary chemosensory study of compound 1 in the presence of different anions (H2PO4, CH3COO, NO3, ClO4, HSO4, BzO, Br, CN, I, F) was also tested, but no optical response was detected.
In addition, the absorption spectrum of the compound was plotted in the absence and presence of 10 equivalents of each cation. As depicted in Figure 3A, compound 1 in the absence of ions (in black) shows a maximum absorption band at 497 nm, which corresponds to the light yellow of the compound solution in ACN, and another band at 305 nm, corresponding to the absorption of the TPA moiety [38,39]. The characteristic absorption spectrum of compound 1 suffered significant changes in the presence of 10 equivalents of Cu2+ and Fe3+, with the appearance of a new band around 670 nm. In contrast, the other cations induced either no or a slight change in the compound’s absorption spectrum. In the case of Cu+, the presence of the cation induced the appearance of a new absorption band around 670 nm; however, it does not show a significant absorbance intensity change when compared to Cu2+ and Fe3+ (Figure 3B), which is in agreement with the results from the preliminary chemosensory ability (Figure 2) where no significant change in the color of the solution of compound 1 was observed in the presence of 50 equivalents of Cu+. Moreover, the absorption band that appears around 355 nm in the presence of Fe3+ (in green) corresponds to the self-absorption of Fe3+ [40]. Based on these results, compound 1 shows an interesting potential as a selective colorimetric chemosensor of Cu2+ and Fe3+.

3.4. Spectrophotometric Titrations

According to the results obtained in the preliminary evaluation of the chemosensory capacity of BODIPY 1, spectrophotometric titrations in acetonitrile were carried out to further investigate the efficiency of BODIPY 1 toward Cu2+ and Fe3+ detection. Thus, increasing amounts of each cation (0–10 equivalents) were added to the compound’s solution; simultaneously, the corresponding absorption spectrum was obtained.
The titration graphs allowed us to follow the changes in the compound’s absorption bands while the number of equivalents of each cation was increasing. After the addition of increasing amounts of Cu2+ and Fe3+, a progressive decrease in the absorption band of 305 nm was observed, while a new red-shifted band appeared at 697 nm and 700 nm for Cu2+ and Fe3+, respectively. This reflects a color change in the compound’s solution from light yellow to blue–green (Figure 4A and Figure 5A). Moreover, the appearance of a new absorption band around 700 nm in the presence of these cations can be attributed to the complex formation between 1 and Cu2+/Fe3+ ion. These results indicate that Cu2+ and Fe3+ may have identical coordination behavior with compound 1. Concerning the peak at 492 nm, the decrease was significantly more prominent in the titration with Fe3+ when compared to Cu2+. The complexation between cation-ligand 1 reached the maximum variation of the absorption band intensity with only 10 equivalents of each cation which proved the high sensitivity of BODIPY 1 toward Cu2+ and Fe3+.
Additionally, the corresponding absorbance calibration curve was obtained as a function of the Cu2+ and Fe3+ concentration (Figure 4B and Figure 5B). Both calibration curves of Cu2+ and Fe3+ exhibited good linear relationships, with correlation coefficients of R2 = 0.9804 and 0.9591, respectively.
Therefore, Cu2+ and Fe3+ can be quantified within this range. According to these data, the limit of detection (LOD) was calculated using the slope of the linear zone of absorbance versus the ion concentration graph.
Moreover, the maximum acceptable copper and iron level (20.5 μM and 5.4 μM, respectively) in drinking water, as stated by the World Health Organization (WHO) and the U.S. Environmental Protection Agency (EPA), and the normal range of copper and iron in whole blood is between 13–21 µM and 7–29 µM, respectively [41,42,43,44]. These reference values are higher than the LOD values of 1 for Cu2+ (0.63 µM) and Fe3+ (0.82 µM) and are within the linear range of the calibration curve. The BODIPY derivative 1, like other chemosensors, has a low limit of detection for Cu2+ (LOD = 0.63 µM) and Fe3+ (LOD = 0.82 µM). However, many reported colorimetric sensors in the literature display a detection signal for these cations at a lower absorption wavelength (ranging from 292 to 570 nm) [12,19,45,46,47,48,49,50], whereas our compound has a detection signal around 700 nm. This feature is an advantage for the potential quantitative monitoring of Cu2+ and Fe3+ ions in environmental/biological samples since water and some biomolecules have a strong self-absorption ranging from 250 to 580 nm [51,52]. Thus, these interferences may be avoided at longer wavelengths, resulting in a higher sensitivity detection of the target cations. These results suggest a good potential of compound 1 as a colorimetric chemosensor for these cations in environmental and biological samples.

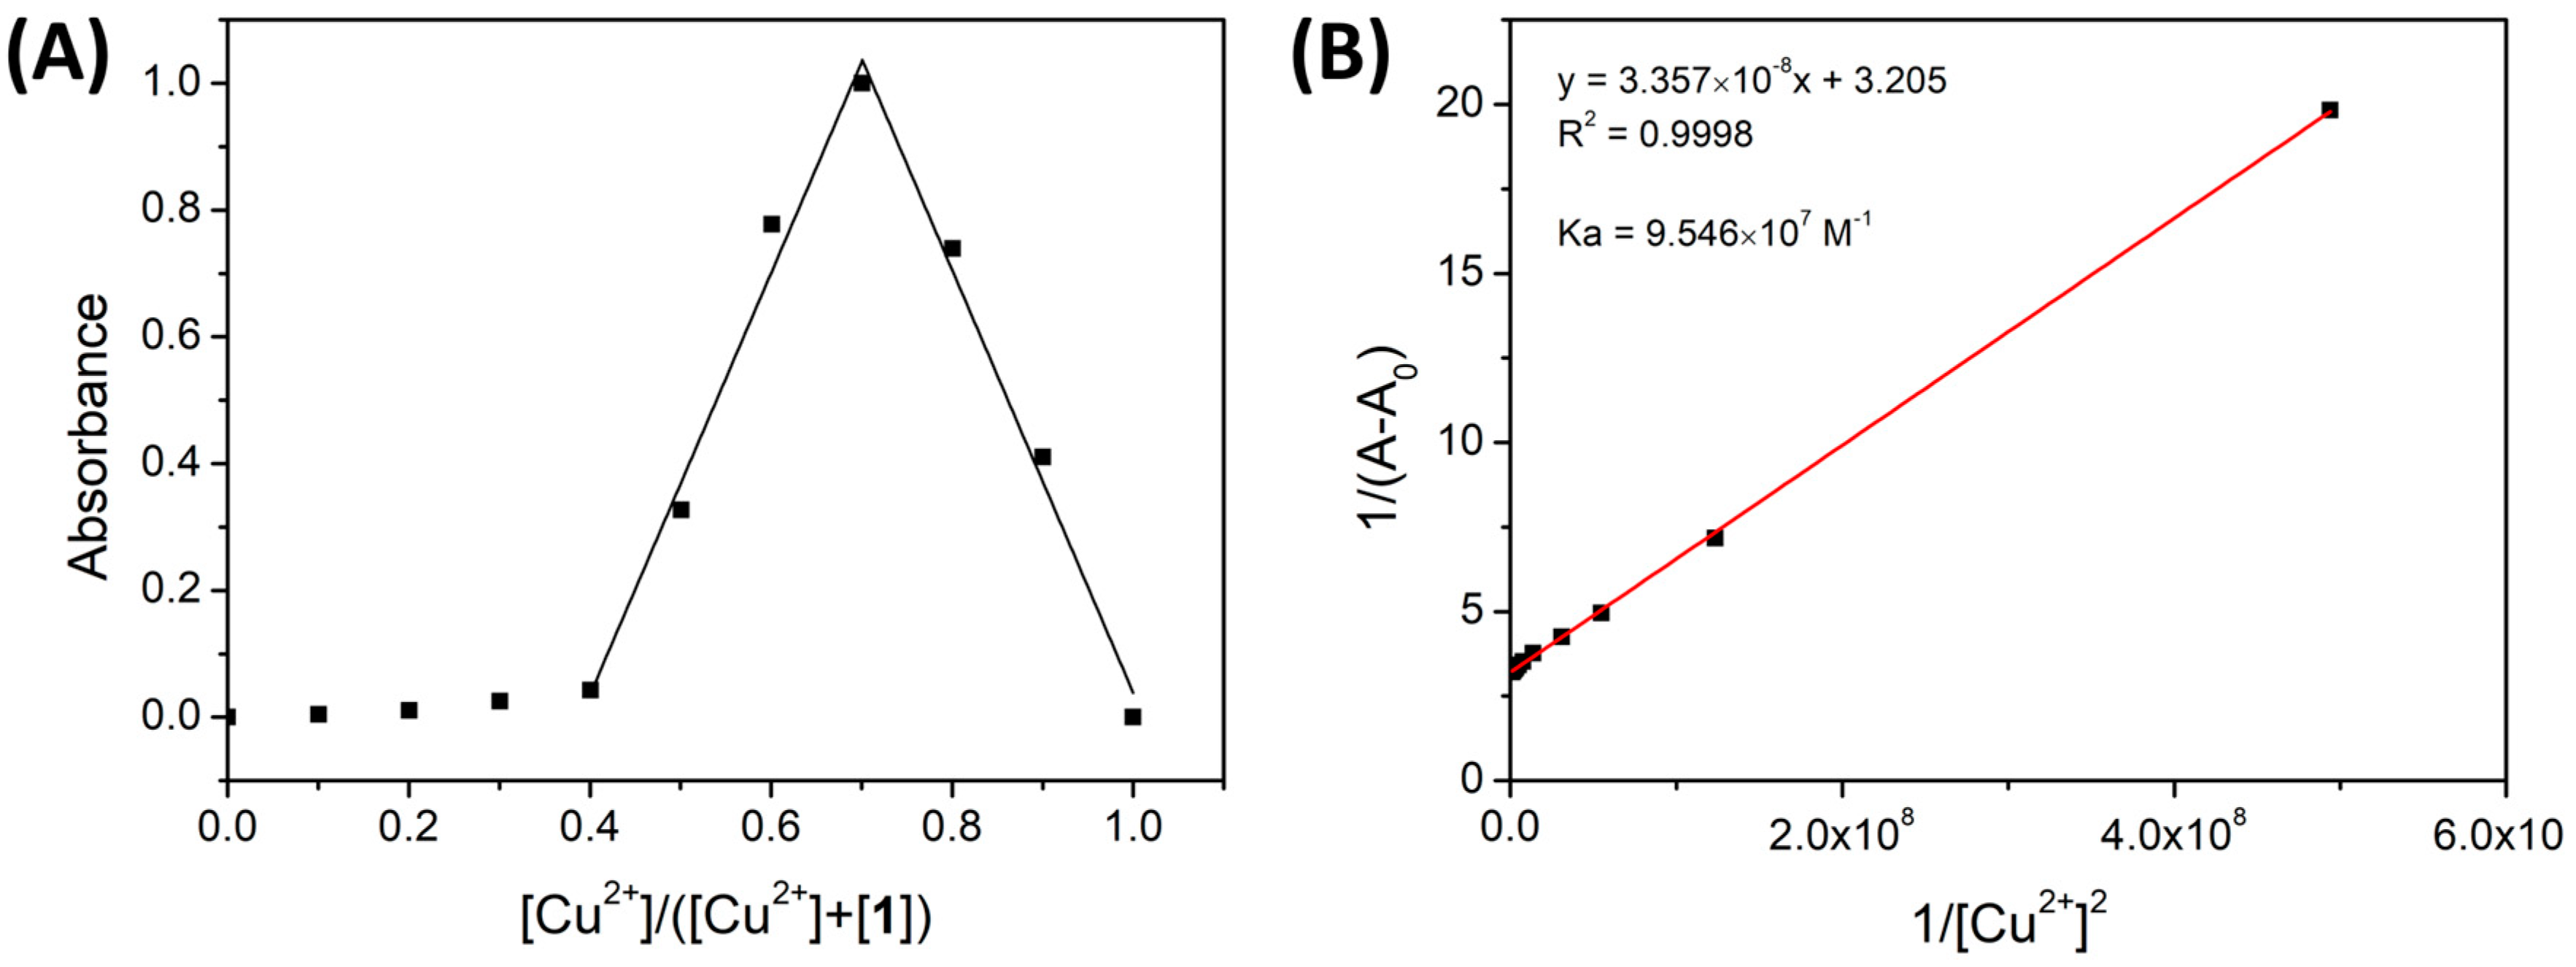
3.5. Binding Stoichiometry and Constant

The binding stoichiometry of the complexes 1-Cu2+ and 1-Fe3+ was determined using a Job’s plot [53] with absorption bands at 697 nm and 700 nm, respectively. The corresponding absorbance was plotted as a function of the mole fraction of the cation (Figure 6A and Figure 7A). In both cases, the highest absorbance was reached at cation 0.7 mole fraction, indicating the formation of a 1:2 complex between ligand 1 and metal.
The binding constant values were determined by the Benesi–Hildebrand method using the UV-vis titration data. The absorbance variations in the presence of Cu2+ and Fe3+ (697 nm and 700 nm, respectively) (1/(AA0)) were plotted as a function of 1/[ion]2, and the binding constant (Ka) was calculated using the ratio of the intercept to the slope of the graph.
As shown in Figure 6B and Figure 7B, both Benesi–Hildebrand plots exhibited good linear relationships with correlation coefficients of R2 = 0.9998 and 0.998. This good fitting confirms the 1:2 complex formation and corroborates the Job’s plot results. The Ka of 1-Cu2+ and 1-Fe3+ was calculated to be 7.825 × 10⁶ M−1 and 9.546 × 10⁷ M−1, respectively, indicating a strong complexation between compound 1 and Fe3+/ Cu2+ ions and a higher binding affinity of Fe3+ toward 1 than Cu2+.

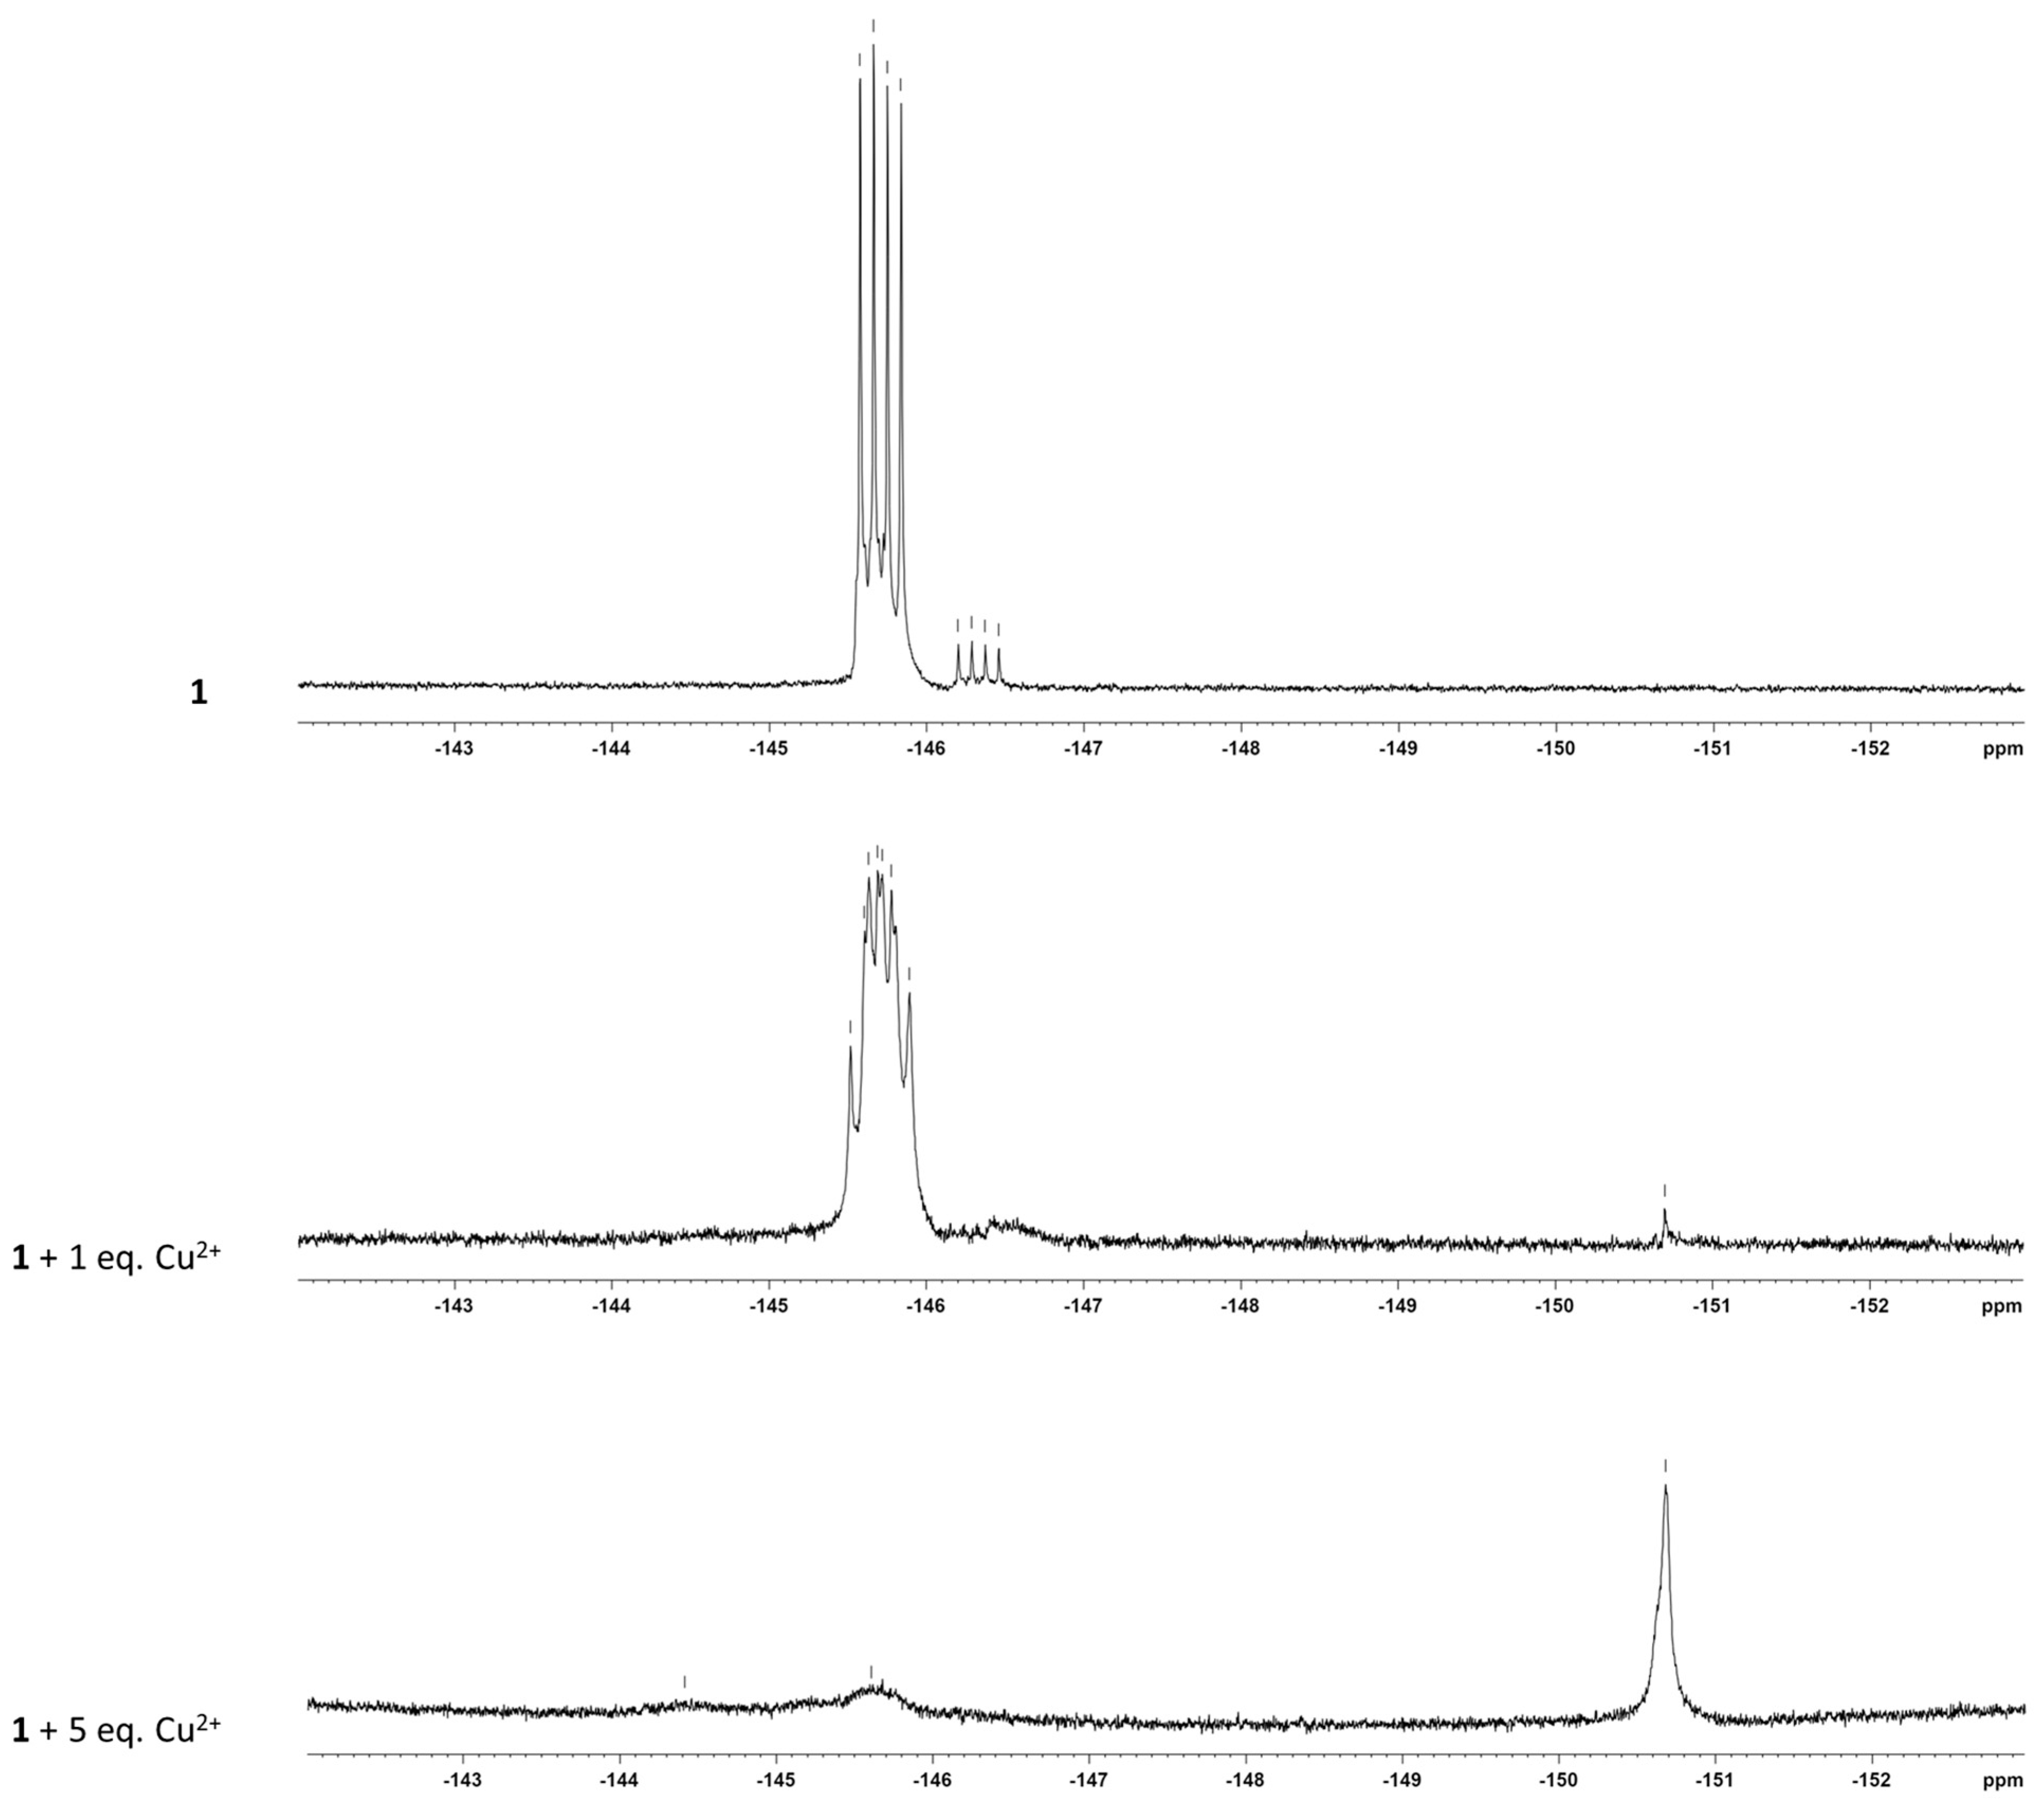
3.6. 1H and 19F NMR Titrations

To corroborate the previous findings and investigate the binding site of Cu2+ and Fe3+, the 1H and 19F NMR titrations of 1 with Cu2+ and Fe3+ were carried out. In this study, the concentration of compound 1 was fixed, while the concentration of the cation was gradually increased (0–5 eq.), and the 1H and 19F NMR spectra were recorded. As depicted in Figure 8, the proton peaks in the aromatic region ascribed to the TPA moiety became broader, and the proton signal at 7.36–7.04 ppm shifts to 7.28–6.98 ppm upon the sequential addition of Cu2+. Considering that the paramagnetic behavior of Cu2+ and Fe3+ affects the relaxation times of protons, and consequently, the frequency of protons near the ions’ binding region, these results point to an interaction with the TPA moiety, which can possibly occur through the coordination of the cations with the N atom of the triphenylamino group [36].
To avoid the presence of the broad water peak in the protons’ region of the BODIPY core, we also performed the 1H NMR titrations in deuterated acetonitrile (Figure S1). It was observed a breadth, decrease of intensity, and shift of the aromatic protons in the presence of 1 equivalent of Cu2+. Moreover, the proton peaks of the BODIPY core were also affected by the presence of the cation. As shown in Figure S1, the singlets of H-2 and H-6 at 6.11 ppm and CH3-3 and CH3-5 at 2.48 ppm split in two different peaks, respectively. In contrast, the singlet of CH3-1 and CH3-7 at 1.59 ppm only suffered a slight shift. These results may indicate the loss of the BODIPY core’s symmetry.
Additionally, the 19F NMR spectrum was recorded to gain more insight into a possible interaction between the cations and the BODIPY core. As shown in Figure 9, it was observed a doublet of quartets for each fluorine atom due to the 19F-19F coupling and 19F-11B coupling [54] in the absence of the cation, whereas in the presence of one equivalent of Cu2+, a broadening of the peak at −145.69 ppm and a complete disappearance of the peak at −146.33 ppm was observed. The addition of five equivalents of the cation induced the appearance of a new peak at −150.68 ppm together with the loss of the peak at −145.69 ppm. This suggests the formation of a new species of boron and fluoride, not complexed by the N atom.
Furthermore, we performed the 19F NMR of BF3OEt2 to compare the fluorine chemical shifts of a BF species not complexed by N. As shown in Figure S2, two peaks appear at −150.44 ppm and −151.95 ppm which are similar to the new peak that appears at −150.68 ppm after the addition of five equivalents of the cation. These data suggest that the interaction of Cu2+ with the BODIPY core may change the environment around the F and could be explained by the formation of a BF species dissociated from one of the N or even from both N.
All these findings suggest the coordination of the cations with BODIPY 1 may be occurring through the nitrogen atom of the TPA moiety and simultaneously with the fluorine atoms of the BODIPY core [55], which is consistent with the formation of a 1:2 complex between ligand 1 and the metal proved by the Job’s plot experiment.

4. Conclusions

In this work, a meso-triphenylamine-BODIPY derivative was reported for the highly selective detection of Cu2+ and Fe3+. In the preliminary chemosensing study, this compound showed a significant color change from yellow to blue–green in the presence of Cu2+ and Fe3+. With only one equivalent of cation, a change in the absorption band of the compound and the appearance of a new band around 700 nm were observed. Furthermore, only 10 equivalents of Cu2+/Fe3+ were needed to reach the absorbance plateau in the UV-visible absorption titrations. Compound 1 showed an excellent sensitivity toward Cu2+ and Fe3+ detection with LODs of 0.63 µM and 1.06 µM, respectively. The binding constant calculation indicated a strong complexation between compound 1 and Cu2+/Fe3+ ions. The 1H and 19F NMR titrations suggested that the ligand-metal interaction may occur through the nitrogen atom of the TPA moiety and simultaneously with the fluorine atoms of the BODIPY core. Hence, BODIPY derivative 1 has demonstrated great potential as a chemosensor for the rapid, selective, and sensitive detection of Cu2+ and Fe3+.

Supplementary Materials

The following supporting information can be downloaded at: https://www.mdpi.com/article/10.3390/s23156995/s1, Figure S1: 1H NMR spectra of BODIPY 1 in the absence and presence of one equivalent of Cu2+ in ACN-d3; Figure S2: 19F NMR spectra of BF3OEt2 in ACN-d3.

Author Contributions

Conceptualization, S.C.S.P., R.C.R.G. and M.M.M.R.; methodology, S.C.S.P., R.C.R.G., S.P.G.C. and M.M.M.R.; validation, S.P.G.C. and M.M.M.R.; formal analysis, S.C.S.P., R.C.R.G., S.P.G.C. and M.M.M.R.; investigation, S.C.S.P. and R.C.R.G.; resources, S.P.G.C. and M.M.M.R.; writing—original draft preparation, S.C.S.P. and R.C.R.G.; writing—review and editing, S.C.S.P., R.C.R.G., S.P.G.C. and M.M.M.R.; supervision, S.P.G.C. and M.M.M.R.; project administration, S.P.G.C. and M.M.M.R.; funding acquisition, S.P.G.C. and M.M.M.R. All authors have read and agreed to the published version of the manuscript.

Funding

This research was funded by the Foundation for Science and Technology (FCT), with financial support provided to CQ-UM (UID/QUI/00686/2020) and PhD grants to S.C.S. Pinto (2022.12455.BD) and R.C.R. Gonçalves (2020.05278.BD). The NMR spectrometer Bruker Avance III 400 is part of the National NMR Network and was purchased within the framework of the National Program for Scientific Re-equipment, contract REDE/1517/RMN/2005, with funds from POCI 2010 (FEDER) and FCT.

Institutional Review Board Statement

Not applicable.

Informed Consent Statement

Not applicable.

Data Availability Statement

Not applicable.

Conflicts of Interest

The authors declare no conflict of interest.

References

  1. Mudgal, V.; Madaan, N.; Mudgal, A.; Singh, R.B.; Mishra, S. Effect of Toxic Metals on Human Health. Open Nutraceuticals J. 2010, 3, 94–99. [Google Scholar] [CrossRef] [Green Version]
  2. Kumar, V.; Parihar, R.D.; Sharma, A.; Bakshi, P.; Singh Sidhu, G.P.; Bali, A.S.; Karaouzas, I.; Bhardwaj, R.; Thukral, A.K.; Gyasi-Agyei, Y.; et al. Global Evaluation of Heavy Metal Content in Surface Water Bodies: A Meta-Analysis Using Heavy Metal Pollution Indices and Multivariate Statistical Analyses. Chemosphere 2019, 236, 124364. [Google Scholar] [CrossRef]
  3. Tchounwou, P.B.; Yedjou, C.G.; Patlolla, A.K.; Sutton, D.J. Heavy Metal Toxicity and the Environment. In Molecular, Clinical and Environmental Toxicology; Luch, A., Ed.; Experientia Supplementum; Springer: Basel, Switzerland, 2012; Volume 101. [Google Scholar] [CrossRef] [Green Version]
  4. Moustakas, M. The Role of Metal Ions in Biology, Biochemistry and Medicine. Materials 2021, 14, 549. [Google Scholar] [CrossRef]
  5. Tsang, T.; Davis, C.I.; Brady, D.C. Copper Biology. Curr. Biol. 2021, 31, R421–R427. [Google Scholar] [CrossRef]
  6. Jomova, K.; Valko, M. Advances in Metal-Induced Oxidative Stress and Human Disease. Toxicology 2011, 283, 65–87. [Google Scholar] [CrossRef] [PubMed]
  7. Gupte, A.; Mumper, R.J. Elevated Copper and Oxidative Stress in Cancer Cells as a Target for Cancer Treatment. Cancer Treat. Rev. 2009, 35, 32–46. [Google Scholar] [CrossRef]
  8. Sirabella, R.; Valsecchi, V.; Anzilotti, S.; Cuomo, O.; Vinciguerra, A.; Cepparulo, P.; Brancaccio, P.; Guida, N.; Blondeau, N.; Canzoniero, L.M.T.; et al. Ionic Homeostasis Maintenance in ALS: Focus on New Therapeutic Targets. Front. Neurosci. 2018, 12, 510. [Google Scholar] [CrossRef] [Green Version]
  9. El-Nahass, M.N.; Fayed, T.A.; El-Daly, H.A.; Youssif, M.M. Benzothiazole Azo Derivatives as Colorimetric Probes for Optical Recognition of Different Metal Ions and Anions. Appl. Organomet. Chem. 2022, 36, e6703. [Google Scholar] [CrossRef]
  10. Heo, J.S.; Suh, B.; Kim, C. Selective Detection of Cu2+ by Benzothiazole-Based Colorimetric Chemosensor: A DFT Study. J. Chem. Sci. 2022, 134, 43. [Google Scholar] [CrossRef]
  11. Chowdhury, S.; Rooj, B.; Dutta, A.; Mandal, U. Review on Recent Advances in Metal Ions Sensing Using Different Fluorescent Probes. J. Fluoresc. 2018, 28, 999–1021. [Google Scholar] [CrossRef] [PubMed]
  12. Chen, Z.E.; Zang, X.F.; Yang, M.; Zhang, H. A Simple Indolo[2,3-a]Carbazole Based Colorimetric Chemosensor for Simultaneous Detection of Cu2+ and Fe3+ Ions. Spectrochim. Acta A Mol. Biomol. Spectrosc. 2020, 234, 118236. [Google Scholar] [CrossRef]
  13. Cheng, P.F.; Xu, K.X.; Yao, W.; Xie, E.; Liu, J. Novel Fluorescent Chemosensors Based on Carbazole for Cu2+ and Fe3+ in Aqueous Media. J. Lumin. 2013, 143, 583–586. [Google Scholar] [CrossRef]
  14. Ghosh, D.; Rhodes, S.; Winder, D.; Atkinson, A.; Gibson, J.; Ming, W.; Padgett, C.; Landge, S.; Aiken, K. Spectroscopic Investigation of Bis-Appended 1,2,3-Triazole Probe for the Detection of Cu(II) Ion. J. Mol. Struct. 2017, 1134, 638–648. [Google Scholar] [CrossRef] [Green Version]
  15. Ma, Y.; Leng, T.; Qu, Y.; Wang, C.; Shen, Y.; Zhu, W. A Dual Chemosensor for Cu2+ and Fe3+ based on π-Extend Tetrathiafulvalene Derivative. Tetrahedron 2017, 73, 14–20. [Google Scholar] [CrossRef]
  16. You, G.R.; Park, G.J.; Lee, J.J.; Kim, C. A Colorimetric Sensor for the Sequential Detection of Cu2+ and CN in Fully Aqueous Media: Practical Performance of Cu2+. Dalton Trans. 2015, 44, 9120–9129. [Google Scholar] [CrossRef] [PubMed]
  17. He, Y.; Mei, J.; Zhou, M.; Zhang, Y.; Liang, Q.; Xu, S.; Li, Z. Colorimetric and Fluorescent Probe for Highly Selective and Sensitive Recognition of Cu2+ and Fe3+ Based on Asymmetric Squaraine Dye. Inorg. Chem. Commun. 2022, 142, 109592. [Google Scholar] [CrossRef]
  18. Alam, M.Z.; Alimuddin; Khan, S.A. A Review on Schiff Base as a Versatile Fluorescent Chemo-Sensors Tool for Detection of Cu2+ and Fe3+ Metal Ion. J. Fluoresc. 2023, 33, 1241–1272. [Google Scholar] [CrossRef]
  19. Pattaweepaiboon, S.; Foytong, W.; Phiromphu, N.; Nanok, T.; Kaewchangwat, N.; Suttisintong, K.; Sirisaksoontorn, W. Spirooxazine-Based Dual-Sensing Probe for Colorimetric Detection of Cu2+ and Fe3+ and Its Application in Drinking Water and Rice Quality Monitoring. ACS Omega 2022, 7, 18671–18680. [Google Scholar] [CrossRef]
  20. Liu, M.; Ma, S.; She, M.; Chen, J.; Wang, Z.; Liu, P.; Zhang, S.; Li, J. Structural Modification of BODIPY: Improve Its Applicability. Chin. Chem. Lett. 2019, 30, 1815–1824. [Google Scholar] [CrossRef]
  21. Li, F.Z.; Yin, J.F.; Kuang, G.C. BODIPY-Based Supramolecules: Construction, Properties and Functions. Coord. Chem. Rev. 2021, 448, 214157. [Google Scholar] [CrossRef]
  22. Nootem, J.; Sattayanon, C.; Daengngern, R.; Kamkaew, A.; Wattanathana, W.; Wannapaiboon, S.; Rashatasakhon, P.; Chansaenpak, K. Bodipy-Pyridylhydrazone Probe for Fluorescence Turn-on Detection of Fe3+ and Its Bioimaging Application. Chemosensors 2021, 9, 165. [Google Scholar] [CrossRef]
  23. Li, S.; Cao, D.; Hu, Z.; Li, Z.; Meng, X.; Han, X.; Ma, W. A Chemosensor with a Paddle Structure Based on a BODIPY Chromophore for Sequential Recognition of Cu2+ and HSO3. RSC Adv. 2019, 9, 34652–34657. [Google Scholar] [CrossRef] [PubMed]
  24. Saiyasombat, W.; Nuchpun, S.; Katewongsa, K.P.; Pornsuwan, S.; Weigand, J.J.; Kiatisevi, S. A Turn-on Bis-BODIPY Chemosensor for Copper Recognition Based on the in Situ Generation of a Benzimidazole-Triazole Receptor and Its Applications in Bioimaging. New J. Chem. 2022, 46, 22525–22532. [Google Scholar] [CrossRef]
  25. Wang, L.; Fang, G.; Cao, D. A Novel Phenol-Based BODIPY Chemosensor for Selective Detection Fe3+ with Colorimetric and Fluorometric Dual-Mode. Sens. Actuators B Chem. 2015, 207, 849–857. [Google Scholar] [CrossRef]
  26. Senthil Murugan, A.; Vidhyalakshmi, N.; Ramesh, U.; Annaraj, J. In Vivo Bio-Imaging Studies of Highly Selective, Sensitive Rhodamine Based Fluorescent Chemosensor for the Detection of Cu2+/Fe3+ Ions. Sens. Actuators B Chem. 2018, 274, 22–29. [Google Scholar] [CrossRef]
  27. Pinto, S.C.S.; Gonçalves, R.C.R.; Costa, S.P.G.; Raposo, M.M.M. Synthesis, Characterization and Evaluation of a Carbazolyl-BODIPY as a Fluorimetric Chemosensor for F. Chem. Proc. 2022, 8, 20. [Google Scholar] [CrossRef]
  28. Gonçalves, R.C.R.; Pinto, S.C.S.; Costa, S.P.G.; Raposo, M.M.M. Anion Colorimetric Chemosensor Based on a Benzimidazole-Functionalized BODIPY Derivative. Chem. Proc. 2022, 8, 90. [Google Scholar] [CrossRef]
  29. Gonçalves, R.C.R.; Belmonte-Reche, E.; Pina, J.; Costa da Silva, M.; Pinto, S.C.S.; Gallo, J.; Costa, S.P.G.; Raposo, M.M.M. Bioimaging of Lysosomes with a BODIPY pH-Dependent Fluorescent Probe. Molecules 2022, 27, 8065. [Google Scholar] [CrossRef]
  30. Gonçalves, R.C.R.; Pina, J.; Costa, S.P.G.; Raposo, M.M.M. Synthesis and Characterization of Aryl-Substituted BODIPY Dyes Displaying Distinct Solvatochromic Singlet Oxygen Photosensitization Efficiencies. Dyes Pigm. 2021, 196, 109784. [Google Scholar] [CrossRef]
  31. Gonçalves, R.C.R.; Nogueira, M.B.; Costa, S.P.G.; Raposo, M.M.M. Functionalized BODIPY Derivatives as Potential Fluorescent Labels. Proceedings 2019, 9, 36. [Google Scholar] [CrossRef]
  32. Gonçalves, R.C.R.; Pinto, S.C.S.; Costa, S.P.G.; Raposo, M.M.M. A Meso-Triphenylamine-BODIPY Derivative for the Optical Chemosensing of Metal Ions. Chem. Proc. 2021, 3, 65. [Google Scholar] [CrossRef]
  33. Demasa, J.N.; Crosby, G.A. The Measurement of Photoluminescence Quantum Yields A Review. J. Phys. Chem. 1971, 75, 991–1028. [Google Scholar] [CrossRef]
  34. Benesi, H.A.; Hildebrand, J.H. A Spectrophotometric Investigation of the Interaction of Iodine with Aromatic Hydrocarbons. J. Am. Chem. Soc. 1949, 71, 2703–2707. [Google Scholar] [CrossRef]
  35. Sengupta, P.; Ganguly, A.; Bose, A. A Phenolic Acid Based Colourimetric ‘Naked-Eye’ Chemosensor for the Rapid Detection of Cu(II) Ions. Spectrochim. Acta A Mol. Biomol. Spectrosc. 2018, 198, 204–211. [Google Scholar] [CrossRef]
  36. Huang, Q.; Peng, Z.; Xie, X.; Tang, Z.; Lei, M. Triarylamine-Bonded Binaphthyl Derivatives as Fluorescence Quenching Probes for Fe3+: An Insight into the Mechanism Based on A Single Binding Site. ChemistrySelect 2019, 4, 13490–13495. [Google Scholar] [CrossRef]
  37. Loudet, A.; Burgess, K. BODIPY Dyes and Their Derivatives: Syntheses and Spectroscopic Properties. Chem. Rev. 2007, 107, 4891–4932. [Google Scholar] [CrossRef]
  38. Liao, J.; Wang, Y.; Xu, Y.; Zhao, H.; Xiao, X.; Yang, X. Synthesis, Optical and Electrochemical Properties of Novel Meso-Triphenylamine-BODIPY Dyes with Aromatic Moieties at 3,5-Positions. Tetrahedron 2015, 71, 5078–5084. [Google Scholar] [CrossRef]
  39. Shen, B.X.; Qian, Y. Triphenylamine-BODIPY Fluorescent Dendron: Click Synthesis and Fluorometric Chemodosimeter for Hg2+, Fe3+ Based on the C=N Bond. ChemistrySelect 2017, 2, 2406–2413. [Google Scholar] [CrossRef]
  40. Li, H.; Li, L.; Yin, B. Highly Selective Fluorescent Chemosensor for Fe3+ Detection Based on Diaza-18-Crown-6 Ether Appended with Dual Coumarins. Inorg. Chem. Commun. 2014, 42, 1–4. [Google Scholar] [CrossRef]
  41. Pungut, N.A.S.; Tan, C.H.; Saad, H.M.; Sim, K.S.; Tiong, S.Y.X.; Ang, C.W.; Gan, C.H.; Kong, K.V.; Tan, K.W. A New Cinnamaldehyde-Rhodamine Based Dual Chemosensor for Cu2+ and Fe3+ and Its Applicability in Live Cell Imaging. J. Photochem. Photobiol. A Chem. 2023, 438, 114540. [Google Scholar] [CrossRef]
  42. Lee, Y.F.; Deng, T.W.; Chiu, W.J.; Wei, T.Y.; Roy, P.; Huang, C.C. Visual Detection of Copper(II) Ions in Blood Samples by Controlling the Leaching of Protein-Capped Gold Nanoparticles. Analyst 2012, 137, 1800–1806. [Google Scholar] [CrossRef] [PubMed]
  43. Sherwood, R.A. Haemoglobins (Hemoglobins). In Encyclopedia of Analytical Science; Worsfold, P., Townshend, A., Poole, C., Eds.; Elsevier: Amsterdam, The Netherlands, 2005; pp. 223–229. [Google Scholar]
  44. World Health Organization. Guidelines for Drinking-Water Quality: Second Addendum, 3rd ed.; World Health Organization: Geneva, Switzerland, 2008; Volume 1.
  45. Sasan, S.; Chopra, T.; Gupta, A.; Tsering, D.; Kapoor, K.K.; Parkesh, R. Fluorescence “Turn-Off” and Colorimetric Sensor for Fe2+, Fe3+, and Cu2+ Ions Based on a 2,5,7-Triarylimidazopyridine Scaffold. ACS Omega 2022, 7, 11114–11125. [Google Scholar] [CrossRef]
  46. Wang, J.; Wei, T.; Ma, F.; Li, T.; Niu, Q. A Novel Fluorescent and Colorimetric Dual-Channel Sensor for the Fast, Reversible and Simultaneous Detection of Fe3+ and Cu2+ Based on Terthiophene Derivative with High Sensitivity and Selectivity. J. Photochem. Photobiol. A Chem. 2019, 383, 111982. [Google Scholar] [CrossRef]
  47. Na, L.P.; Li, M.; La, Y.T.; Dong, W.K. A Novel Fluorometric and Colorimetric Dual-Channel Single-Armed Salamo-like Chemosensor for the Fast, Reversible and Simultaneous Detection of Fe3+ and Cu2+ Ions. Inorganica Chim. Acta 2022, 537, 120932. [Google Scholar] [CrossRef]
  48. Gahlyan, P.; Bawa, R.; Jain, H.; Dalela, M.; Joshi, A.; Ramachandran, C.N.; Prasad, A.K.; Kaur, A.; Kumar, R. Isatin-Triazole-Functionalized Rhodamine: A Dual Sensor for Cu2+ and Fe3+ Ions and Its Application to Cell Imaging. ChemistrySelect 2019, 4, 7532–7540. [Google Scholar] [CrossRef]
  49. Narayanaswamy, N.; Govindaraju, T. Aldazine-Based Colorimetric Sensors for Cu2+ and Fe3+. Sens. Actuators B Chem. 2012, 161, 304–310. [Google Scholar] [CrossRef]
  50. Ghule, N.V.; Bhosale, R.S.; Puyad, A.L.; Bhosale, S.V.; Bhosale, S.V. Naphthalenediimide Amphiphile Based Colorimetric Probe for Recognition of Cu2+ and Fe3+ Ions. Sens. Actuators B Chem. 2016, 227, 17–23. [Google Scholar] [CrossRef]
  51. Spangenberg, M.; Bryant, J.I.; Gibson, S.J.; Mousley, P.J.; Ramachers, Y.; Bell, G.R. Ultraviolet Absorption of Contaminants in Water. Sci. Rep. 2021, 11, 3682. [Google Scholar] [CrossRef]
  52. Paganin-Gioanni, A.; Bellard, E.; Paquereau, L.; Ecochard, V.; Golzio, M.; Teissié, J. Fluorescence Imaging Agents in Cancerology. Radiol. Oncol. 2010, 44, 142–148. [Google Scholar] [CrossRef] [Green Version]
  53. Jo, T.G.; Na, Y.J.; Lee, J.J.; Lee, M.M.; Lee, S.Y.; Kim, C. A Multifunctional Colorimetric Chemosensor for Cyanide and Copper(II) Ions. Sens. Actuators B Chem. 2015, 211, 498–506. [Google Scholar] [CrossRef]
  54. Farfán-Paredes, M.; González-Antonio, O.; Tahuilan-Anguiano, D.E.; Peón, J.; Ariza, A.; Lacroix, P.G.; Santillan, R.; Farfán, N. Physicochemical and Computational Insight of 19F NMR and Emission Properties of: Meso-(o-Aryl)-BODIPYs. New J. Chem 2020, 44, 19459–19471. [Google Scholar] [CrossRef]
  55. Kawakami, J.; Sasaki, Y.; Yanase, K.; Ito, S. Benzo-Fused BODIPY Derivative as a Fluorescent Chemosensor for Fe3+, Cu2+, and Al3+. Trans. Mat. Res. Soc. Jpn. 2019, 44, 69–73. [Google Scholar] [CrossRef] [Green Version]
Figure 1. Structure of BODIPY 1.
Sensors 23 06995 g001
Scheme 1. Synthesis of BODIPY derivative 1.
Sensors 23 06995 sch001
Figure 2. Preliminary chemosensory study of BODIPY 1 in ACN upon interaction with different cations under natural light (above), and UV radiation at λmax = 312 nm (below).
Sensors 23 06995 g002
Figure 3. (A) Absorption spectra of compound 1 with 10 equivalents of several ions in ACN (B) Absorbance data at 670 nm of the interest ions in a bar diagram.
Sensors 23 06995 g003
Figure 4. (A) Normalized UV-vis absorption titration of 1 (1 × 10⁻⁵ M) with Fe3+ (0–100 μM) in ACN. (The insert represents the normalized absorption at 492 nm as a function of Fe3+ equivalents). (B) The linear relationship between the Fe3+ concentration and the absorbance of 1 (at 697 nm).
Sensors 23 06995 g004
Figure 5. (A) Normalized UV-vis absorption titration of 1 (1 × 10⁻⁵ M) with Cu2+ (0–100 μM) in ACN. (The insert represents the normalized absorption at 492 nm as a function of Cu2+ equivalents). (B) The linear relationship between the Cu2+ concentration and the absorbance of 1 (at 700 nm).
Sensors 23 06995 g005
Figure 6. (A) A Job’s plot of 1-Fe3+ in ACN. The absorbance was recorded at 693 nm. (B) A Benesi-Hildebrand diagram based on a spectrophotometric titration of 1 with Fe3+ at 697 nm.
Sensors 23 06995 g006
Figure 7. (A) Job’s plot of 1-Cu2+ in ACN. The absorbance was recorded at 700 nm. (B) Benesi–Hildebrand diagram from spectrophotometric titration of 1 with Cu2+ at 700 nm.
Sensors 23 06995 g007
Figure 8. 1H NMR spectra of 1 in the presence of increased amounts of Fe3+ and Cu2+ in DMSO-d6.
Sensors 23 06995 g008
Figure 9. 19F NMR spectra of BODIPY 1 in the absence and presence of increase amount of Cu2+ in ACN-d3.
Sensors 23 06995 g009
Disclaimer/Publisher’s Note: The statements, opinions and data contained in all publications are solely those of the individual author(s) and contributor(s) and not of MDPI and/or the editor(s). MDPI and/or the editor(s) disclaim responsibility for any injury to people or property resulting from any ideas, methods, instructions or products referred to in the content.

