1. Introduction
After lower limb loss, individuals with amputation are involved in a prosthetic rehabilitation treatment which aims at maximizing the recovery of the lost functionality [
1]. The return to an active social life is largely dependent on the artificial limb, typically consisting of mass-produced components, such as a prosthetic foot and/or knee, and a custom-made socket [
2,
3].
The socket, with the possible interposition of a liner, is the interface between the residual limb and the prosthetic device. For this reason, a properly shaped and built socket must promote soft tissues’ integrity and allow the stump to act as the motor and controller of the artificial limb during daily life activities, by managing the load transfer between the body and device. These are key factors for determining the success of the prosthesis [
4]. A defective socket fit leads to poor biomechanical performances, discomfort, pain, inflammation and skin lesions [
5]. All these factors may contribute to reduced satisfaction with the prosthesis, a lower quality of life (QoL) and the potentially abandonment of the device [
6]. In [
7] the QoL of individuals with unilateral transfemoral amputation was studied using the SF-36 questionnaire. The most frequently reported problems associated with a reduced quality of life were heat/sweating in the prosthetic socket (72%) and sores/skin irritation from the socket (62%), factors that can cause the local inflammation of the skin and may lead to pain and suffering [
8].
The fitting of a prosthetic socket is an iterative process of trial and modification to optimize the socket volume and shape [
9]. The process typically requires the user’s feedback when donning the socket, standing and walking, and the assessment of the socket position and motion relative to the residual limb by a certified prosthetist, possibly with the support of qualitative clinical measurements [
10,
11,
12]. When one of these elements is unreliable or missing and cannot be compensated by the others, reaching a successful fitting can be an inefficient and stressful experience, with uncertain outcomes. This can be particularly critical for first-time prosthetic users, who are unaccustomed to providing specific feedback, or when the persons with amputation have a reduced, partial or absent sensation in the residual limb or are overwhelmed by allodynia, hyperalgesia, phantom pain or psychological distress.
When this is the case, objective measures can support decision-making. Among them, the assessment of temperature variation on the residual limb skin may provide valuable information for certified prosthetists about the user’s comfort with a newly developed socket which can, potentially, improve the optimization of the socket quality and performance.
Thermography allows us to measure the temperature pattern over the external surface of an object and has been already adopted in industrial [
13] and biomedical applications [
14]. For instance, temperature variation has been used to monitor patients with diabetes for the early detection of neuropathy and vascular disorders, such as diabetic foot disease [
15]. Some studies have analyzed the use of 2D thermography in the prosthetic field [
16]. The first quantitative study performed in 1984 [
17] demonstrated that thermography can be used to detect phantom or residual limb pain, which is often associated with typical thermal patterns. Specifically, circulation disturbance was associated with distinct lower temperatures in the distal portion of the residual limb, while an asymmetrical increase in temperature was found in areas corresponding to pressure points, infection or locally painful spots.
In [
18] the residual limb skin temperature during prosthesis use was monitored. The results showed that temperature variations over the limb surface were associated with prosthetic socket material and subject activity. In [
19], the authors investigated the application of 2D thermography to assess the stump–socket interface in transtibial prosthesis users by comparing the thermal maps induced by the mechanical stresses on the limb. By using thermography and temperature sensors fitted in the socket, five hot spots were identified before and after walking. In [
20], the biomechanical and thermographic analysis of the transtibial limb–socket interface was investigated. The study demonstrated that the use of thermal imaging for detecting pressure points in the socket is a suitable method for rapidly assessing the quality of the socket during its manufacturing process. In [
21], 16 subjects with transfemoral amputation were monitored through 2D thermography to investigate the effect of prosthesis misalignment on the skin temperature of the limb. The results showed that prosthesis misalignment induced a variation in the temperature distribution on the limb and that, therefore, thermography can be adopted to refine the prosthesis alignment.
In these studies, which represent the available literature about the application of thermography in the clinical practice with persons with lower limb amputation, the main limitation is represented by the intrinsic bi-dimensional nature of the thermal information acquired with thermal cameras. In fact, due to the variable, subject-specific conformation of the residual limb, it can be difficult to have a full and accurate understanding of the extension and location of the hot/cold spots on the real-life limb, and then proceed with localized socket adjustments. In addition, it can be cumbersome to examine several separated 2D views to examine the full residual limb shape, particularly when comparing different conditions (e.g., rest vs. walking).
This highlights the need for a 3D solution to integrate morphological and thermal information. Some authors investigated the combination of 2D thermal images and CT medical images to map temperature information on 3D anatomical targets and improve clinical diagnosis [
22], or to solve clinical issues related to the diabetic foot. In [
23], 2D thermal information was used as a feature to train a neural network for the segmentation of the diabetic foot. An algorithm for the 3D registration of 2D thermal maps on 3D reconstructions of diabetic feet was proposed in [
24]. The algorithm was face-validated, but no information about registration accuracy was provided. As the registration error is considerably affected by details of the volume object reconstruction [
25], algorithms based on high-resolution CT images were proposed. However, despite the high accuracy of CT images, which help improve registration performances, such an approach is not practical in clinical practice due to ethical, monetary and logistical burdens, especially for socket manufacturing.
Alternative approaches were reported in the literature to collect the 3D morphology with digital scanners or photogrammetry, in combination with thermal cameras, either in stationary or handheld systems [
26]. However, there is a lack of suitable protocol for subjects with lower limb amputations, (i) with the intrinsic capability of monitoring the 2D (thermal)-3D (spatial) registration error, (ii) and based on mostly freely available software (therefore, easy to reproduce in clinical centers).
The aim of this study was to address these open issues by proposing an original workflow to calculate 3D thermographic maps of the residual limb of transtibial amputees for monitoring the temperature variations induced by prosthesis use. The workflow comprises a data acquisition and a data processing technique, whose application is demonstrated in a representative case study, including a person with transtibial amputation.
2. Materials and Methods
First, the measurement instruments and 3D thermographic markers are described. Second, the workflow is presented to provide an overview of our approach. Third, we focus on data collection for thermal images, 3D surfaces and thermal camera optics calibration. Fourth, we report on the data processing technique, which is formed by three parts, namely the integration of the 2D set of thermal images and the 3D model, the calculation of the 3D differential thermographic map and the assessment of the process accuracy. Finally, the materials and methods relevant to the exemplary case study are reported.
2.1. Measurement Instruments and Rotating Platform
For the acquisition of the 2D thermal images, a commercial infrared camera FLIR A325 (Wilsonville, OR, USA) was used, with the possibility to export data in a table format. The sensor characteristics are reported in
Table 1. The FLIR proprietary software was used for real-time visualization and for the setup of the acquisition parameters. Specifically, the ambient parameters affecting infrared temperature estimation (ambient temperature, humidity) were measured through an Amprobe TR300 (Everett, WA, USA). The human skin emissivity coefficient was set to 0.98 [
27,
28].
The FLIR camera was mounted on a tripod, at a fixed distance of 120 cm from the central axis of a squared rotating platform, with the focal plane parallel to the platform’s side [
19]. The platform was surrounded by parallel bars on three sides, which were specifically designed to host the patient in an upright posture with the residual limb positioned vertically over the platform axis of rotation. By spinning the platform, it is possible to collect images in different views with no need for the patient to move voluntarily or for camera adjustments.
For the acquisition of the 3D mesh of the residual limb, a Microsoft Kinect (Microsoft, Redmond, WA, USA) was adopted in combination with the Skanect software (Occipital Inc., Boulder, CO, USA). The accuracy and resolution of the Kinect system as a 3D scanner has been already documented elsewhere [
29], and the device has a sampling frequency of 20 fps.
2.2. 3D Thermographic Markers
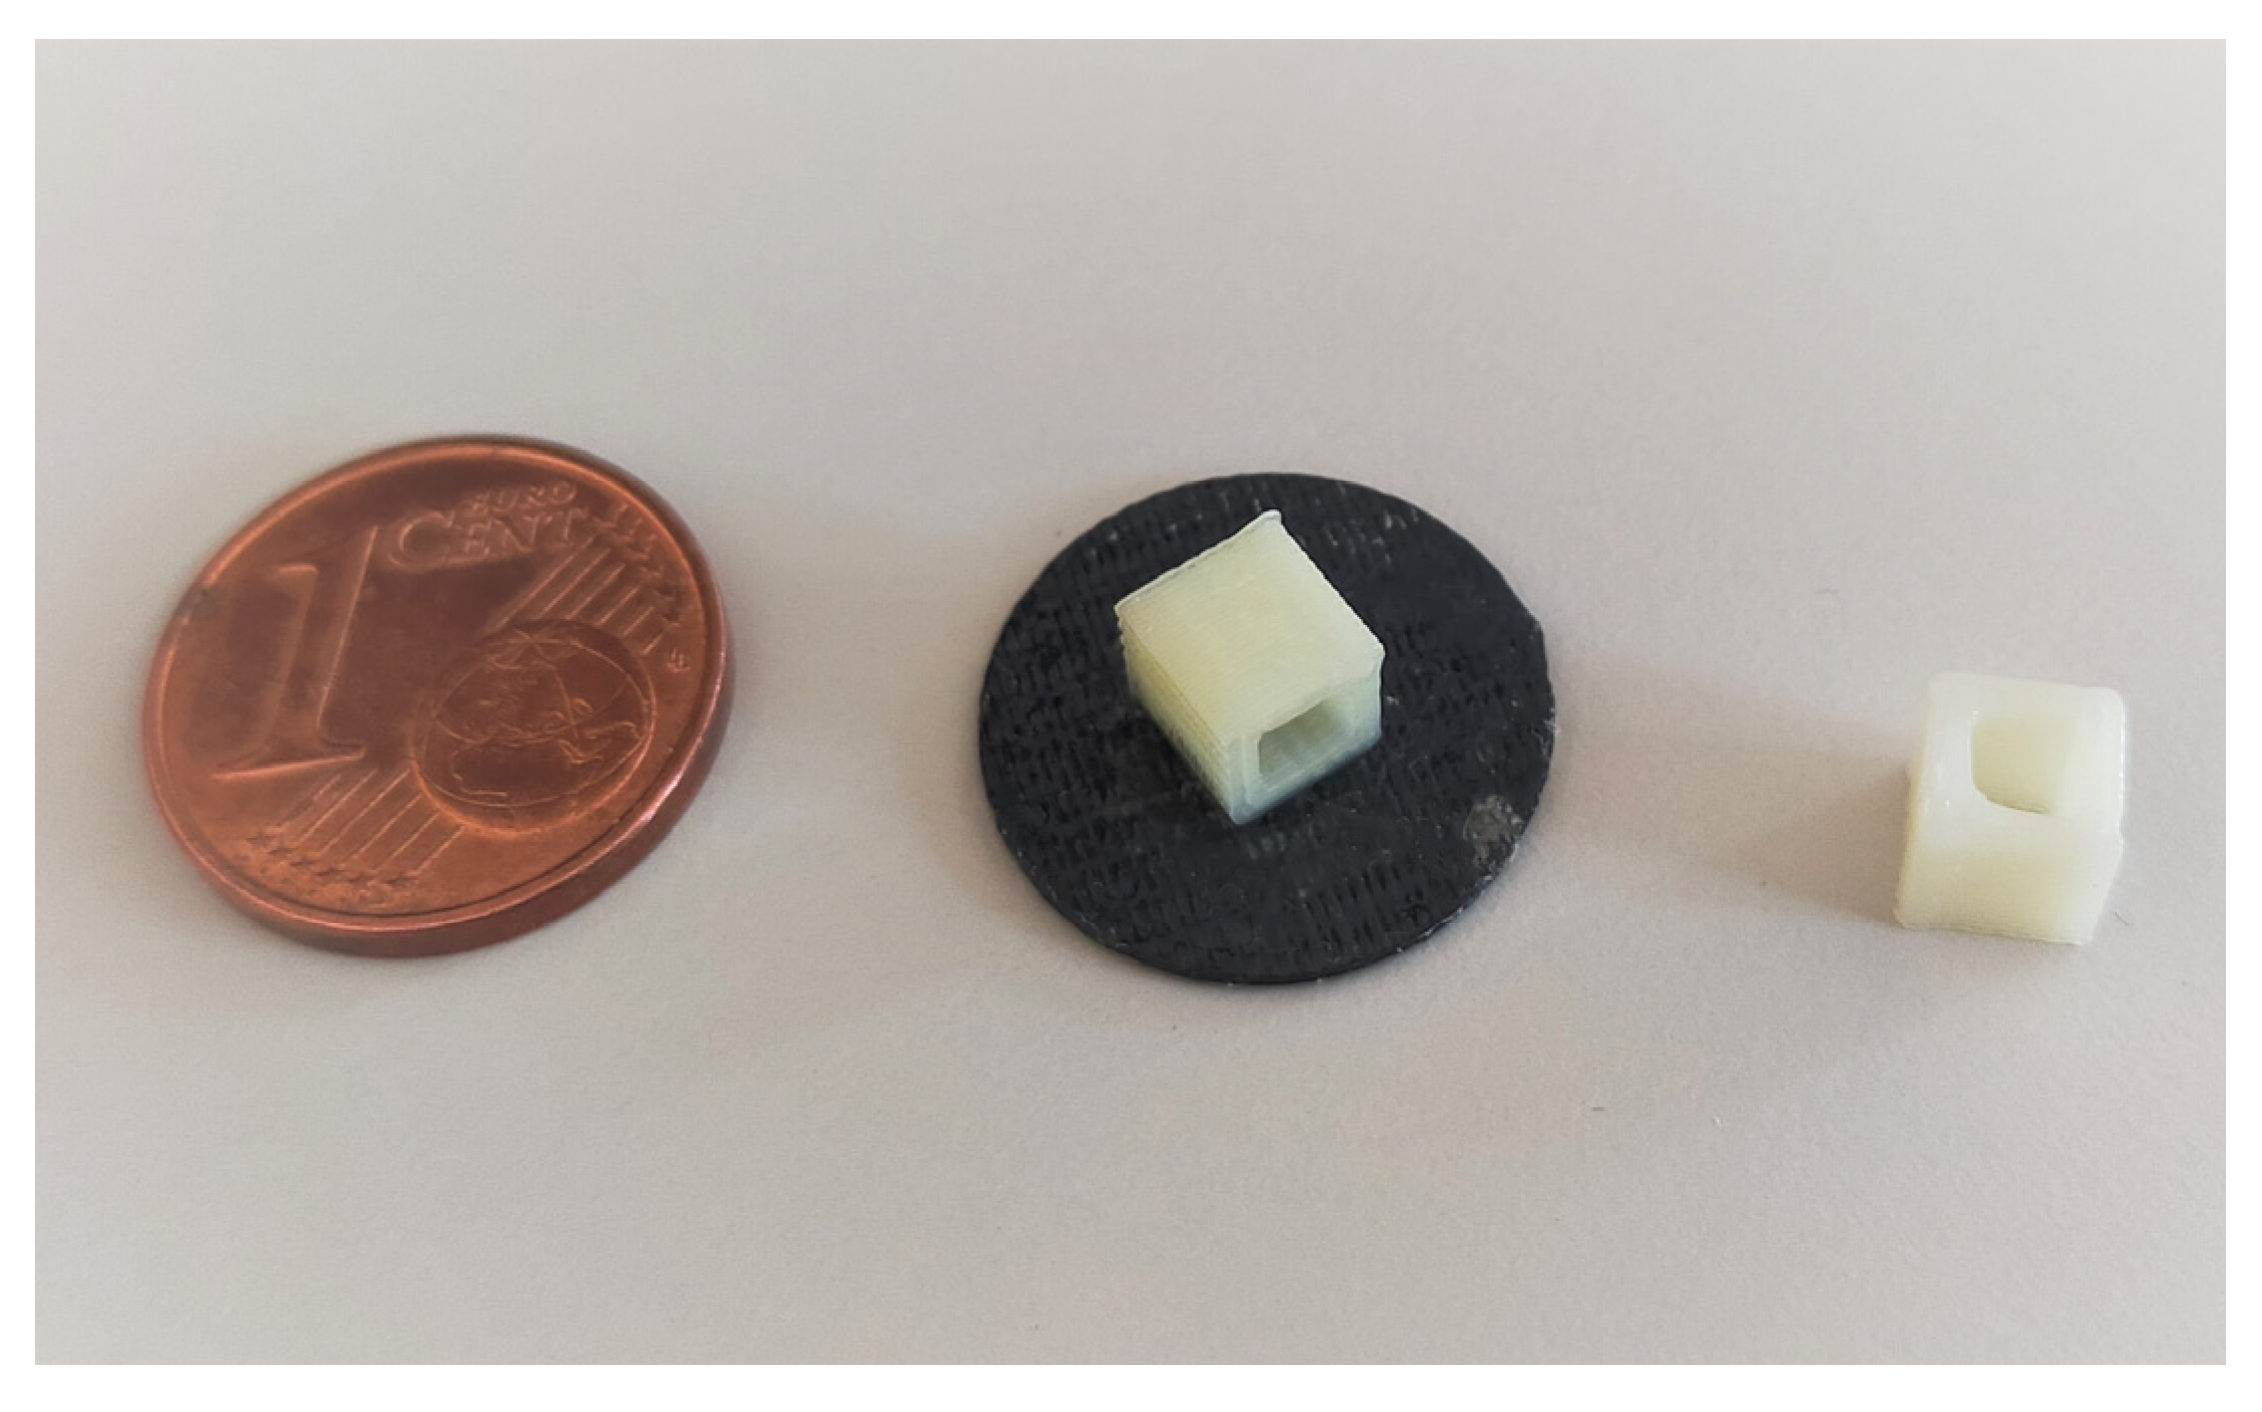
3D thermographic markers (3DTM) were conceived to facilitate and access the quality of the spatial registration of the thermal images on the 3D mesh. The 3DTM were developed to be small objects of known geometry that could be visible both in the 3D mesh and in the thermal image, and that could be positioned on the subject’s body without obstructing clinically relevant hot/cold spots on the residual limb [
19,
21]. To fulfill these constraints, we 3D-printed small hollow cubes in ABS, with only 4 lateral faces, with an edge length of 5 mm with a 0.5 mm think flat base of 14 mm in diameter (
Figure 1).
A preliminary test confirmed that markers of this size can be handled with confidence and that the ambient air passing through the cube ensures its visibility in the thermal image. Moreover, markers are detected by Kinect and are visible in the 3D mesh.
2.3. Workflow
The workflow was developed to collect the skin temperature of the residual limb of a person with transtibial amputation under two conditions, to superimpose the two temperatures dataset on a single 3D model of the residual limb and to calculate a 3D differential thermal map to highlight the temperature variations between the two conditions. For instance, the two conditions can be assumed to be the skin temperature after walking (TW) and at rest (TR). The 10-phases workflow is illustrated in
Figure 2. The steps are described in detail in the next sections.
2.4. Subject Examination and Collection of the Thermal Images
We report here about the details for phases 1 to 5 of the workflow.
Phase 1: the patient is invited to doff the prosthesis and the residual limb is examined by the prosthetist to identify areas of clinical interest where 3DTM should not be positioned. The patient is invited to familiarize themself with the rotating platform, taking advantage of the parallel bars for stability. The height of the camera tripod is adjusted to center the image plane at the middle of the residual limb. The views for image collection are established: at least 7 images are required, starting from a frontal plane roughly in steps of 45° around the limb long axis; the addition of an image of the distal end of the residual limb might be needed for some residual limbs, depending on their shape. Once the views are decided, the position of the 3DTM is set to ensure that at least three are visible in each view without obstructing the clinically relevant areas discussed with the prosthetist.
Phase 2: the patient is asked to walk with the prosthesis for 15 min as they desire, completing the activity in the measurement laboratory by sitting on a chair positioned on the rotating platform.
Phase 3: the patient doffs the prosthesis and 3DTM are quickly positioned on the residual limb. Then, the patient stands up with the residual limb positioned vertically over the platform rotation axis and thermal images are collected based on the pre-determined views, by adding additional images if deemed clinically important by viewing the thermal images in real-time. If the residual limb end is collected, the subject is asked to flex the knee. For medial views, the subject is asked to flex the hip to ensure good visibility (
Figure 3).
Phase 4: the subject rests comfortably for 20 min in the laboratory room, while the ambient temperature and humidity are monitored.
Phase 5: thermal images are collected again, without removing the 3DTM.
2.5. Data Acquisition: 3D Surface of the Residual Limb
Phase 6: the digitalization of the residual limb surface takes place after thermal image acquisition, without removing the markers or asking the subject to step down from the platform. The Kinect is hand-held and manually moved around the residual limb thanks to its small size [66 × 249 × 67 mm] and limited weight [1.4 kg]. During scanning, the operator is guided on the body parts yet to be digitalized by the real-time visual feedback of the reconstructed surface. For data collection on the residual limb, Skanect was set to “body mode” and “high” feedback quality. For optimal accuracy, all scans were completed at less than 1 m from the target. For cleaning and cropping the 3D mesh to the residual limb, the software MeshLab (ISTI-CNR, Pisa, Italy) was used.
2.6. Optics Calibration of the Thermal Camera
Phase 7: the calibration of the optics of the thermal camera is completed at the end of the measurement sessions. If the camera distance to the axis of rotation of the platform and the orientation of the image plane remain as prescribed (120 cm and parallel to the platform, respectively), there is no need to repeat the camera calibration at every patient assessment.
The Matlab Camera Calibration App (Mathworks, Natick, MA, USA) is used to calibrate the optics of the thermal camera. A rectangular chessboard composed of 30 × 30 mm black squares interconnected by thin crosses were 3D-printed in ABS to generate a bi-dimensional calibration pattern (
Figure 4, left). The chessboard has a size of 300 × 180 mm, with a thickness of 2 mm and was glued on a clear, rigid PETG board, which is easy to find in prosthetic and orthotic facilities. Once heated by hand rubbing, the ABS chessboard becomes clearly visible in the thermal images (
Figure 4, right).
Calibration consisted of collecting 20 images, each depicting the chessboard in a different orientation, but with a maximum inclination of 45° relative to the image plane. The focus was never changed during calibration. The calibration was considered acceptable if the reprojection error provided by the App was lower than 1 pixel.
2.7. Data Processing: Integration of a 2D Set of Thermal Images and 3D Model
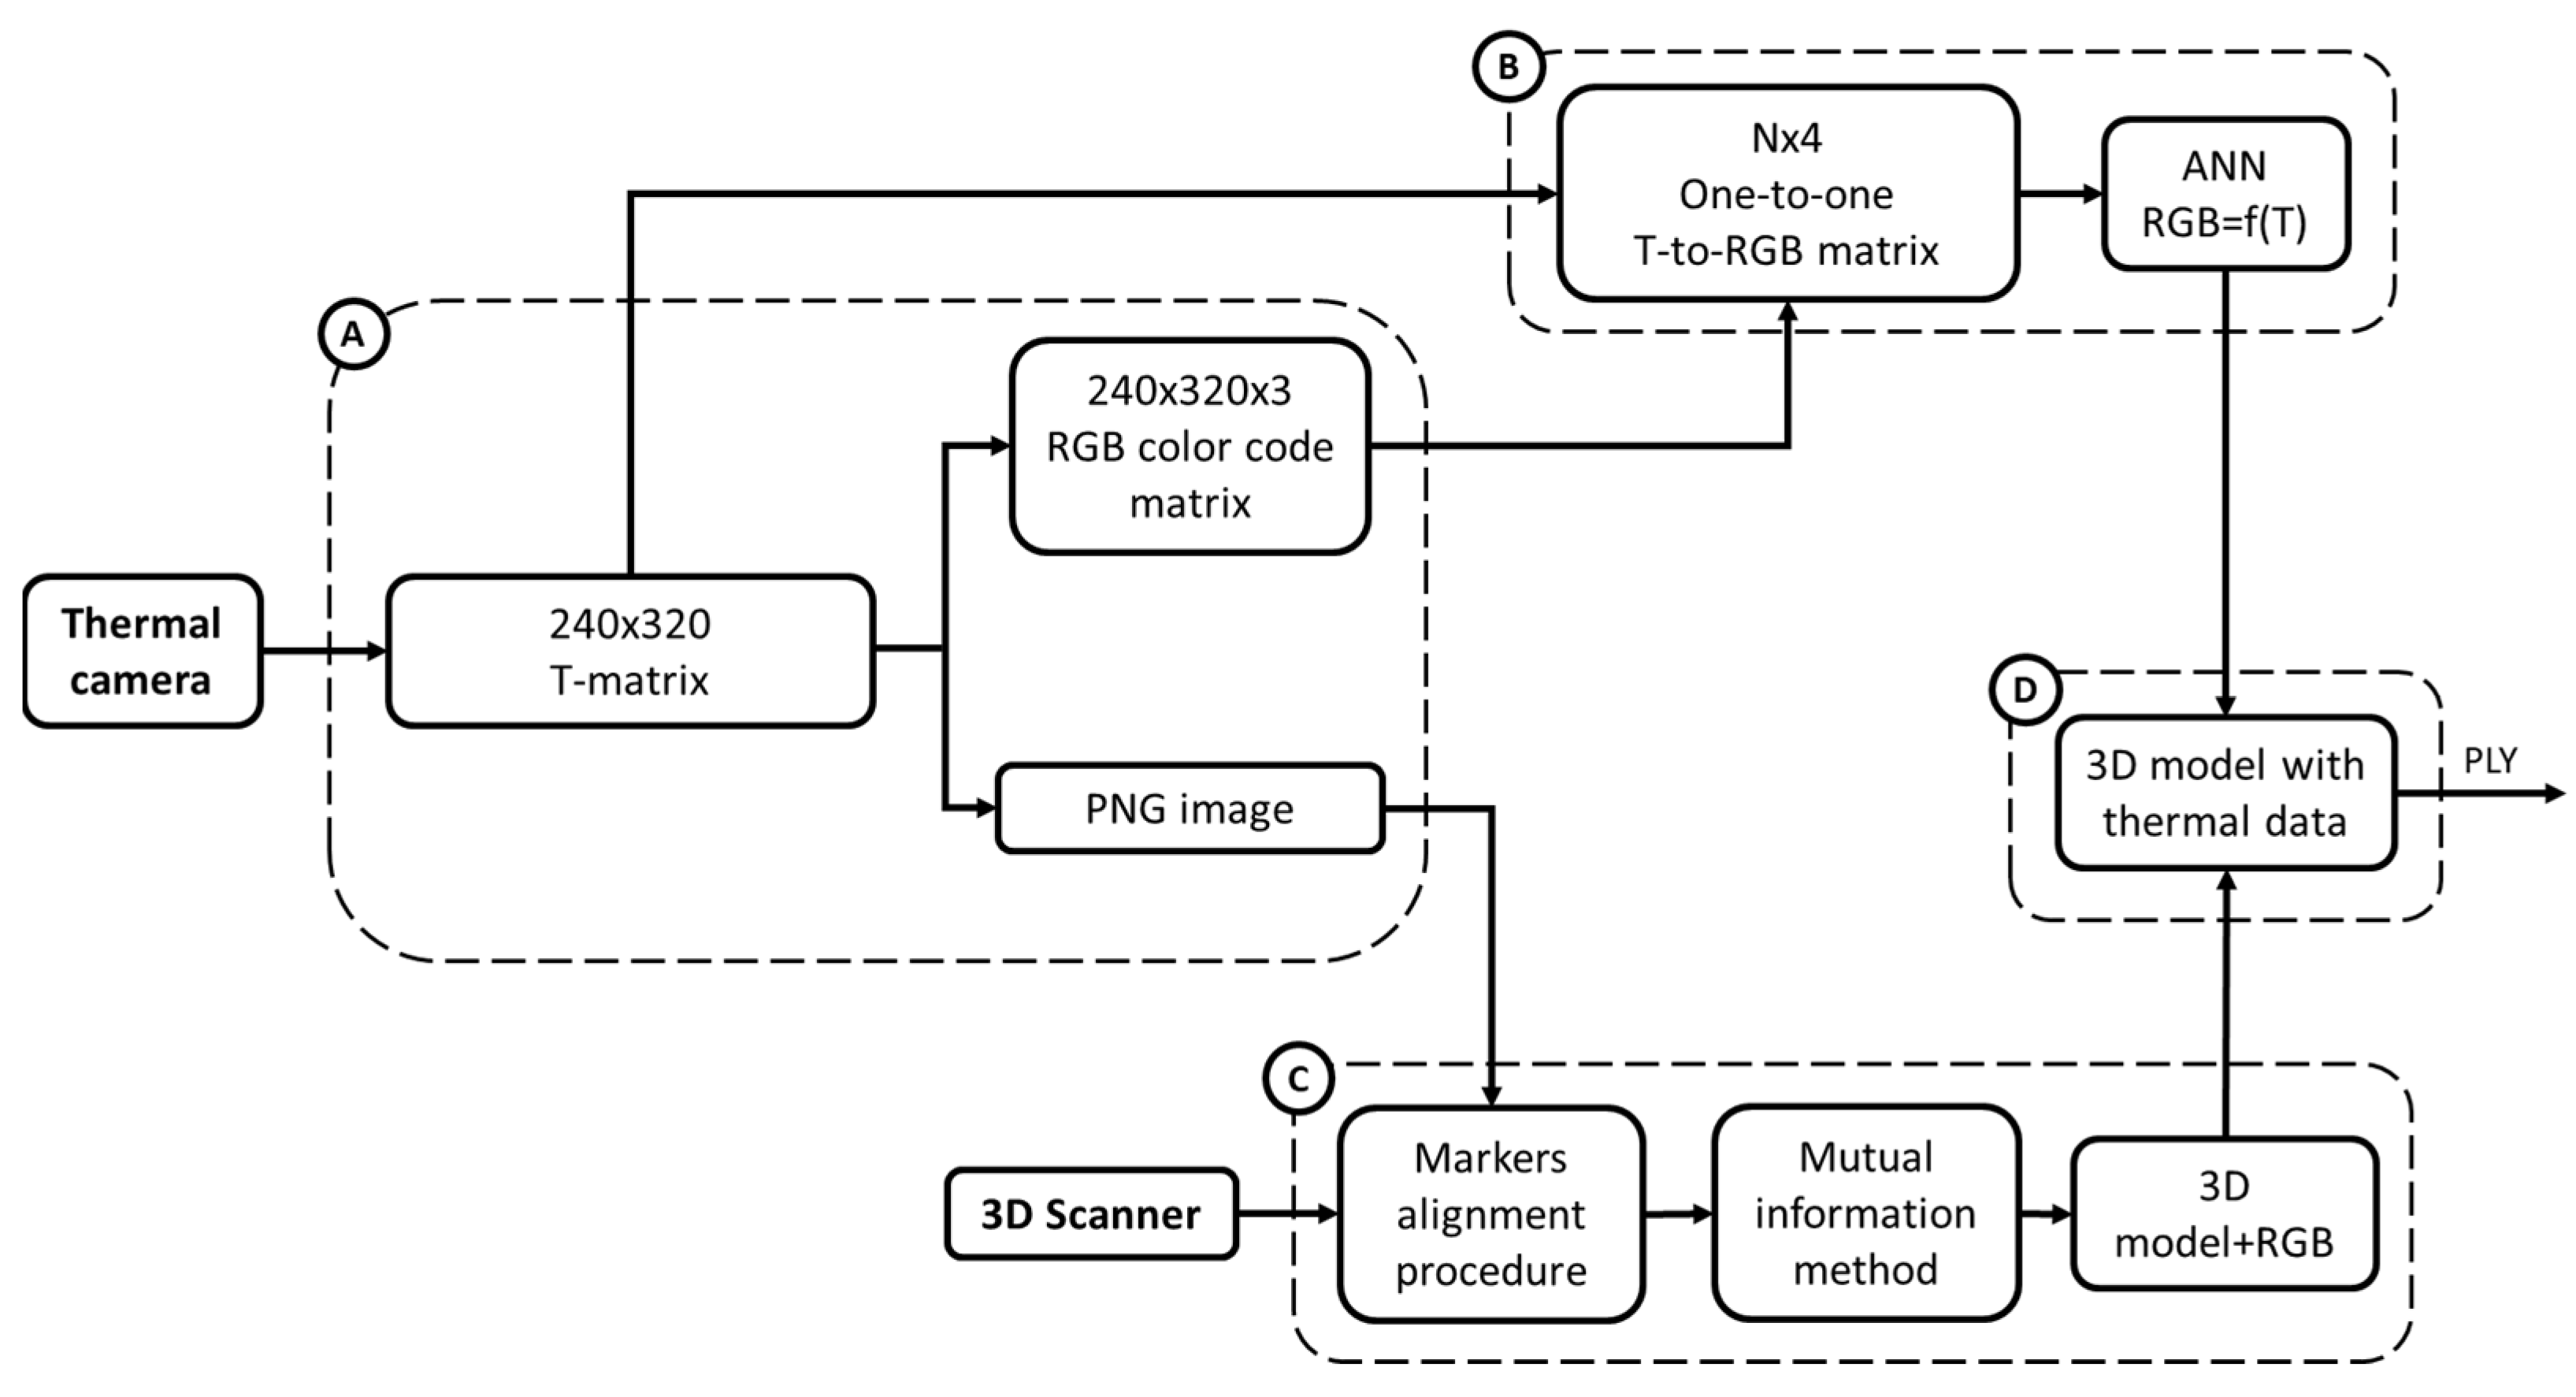
Phase 8: To integrate the thermal data into the 3D limb model, a process combining Matlab and MeshLab was developed based on the flowchart presented in
Figure 5, which consists of 4 branches, from A to D.
In branch A, the thermographic data of each thermal image were exported from the thermal camera and then imported in Matlab as a raster 240 × 320 pixel matrix containing the temperature values (
Figure 5, Box A), herein referred to as the temperature matrix.
The MATLAB’s Image Processing Toolbox was used to generate a color-coded image in a PNG format of each 240 × 320 temperature matrix (Matlab jet colormap) and the corresponding 240 × 320 × 3 RGB matrix, with lower and upper color saturation anchored to 28° and 37° degrees, respectively.
Once this step was completed, the process split in two branches, namely B and C, to then re-converge into the final branch D to generate the 3D thermographic map.
The first step of branch B consisted of reading each element of the temperature matrix and the associated RBG tripled to generating an association table between the temperature values and RGB codes. The second step consisted of ordering the table in ascending temperature values and removing duplicates. When multiple temperatures differing by cents of degrees were associated with the same RBG code, a single temperature value was calculated as the average of these temperatures and associated in the table with the RGB code. Therefore, at the end of this step, a 1:1 table was obtained, in which unique temperature values were associated with unique RBG codes. As a third step, half of the table rows were randomly selected and used to train an artificial neural network (ANN) in MATLAB (Radial Basis Networks newrb), to estimate the RGB code for temperature values not in the table. The other half of the rows were used to test the ANN predictions. Hidden nodes were added until a mean squared error of 10−4 was reached.
The first step of branch C consisted of importing the PNG images and the 3D mesh in MeshLab for texturing. To achieve this aim, each PNG image was aligned with the 3D model in its correct position and orientation, using a two-step process. Firstly, the 3DTM positioned on the residual limb, visible in both the raster images and the 3D mesh model, was used as a reference point for initial manual alignment. Then the image-to-geometry registration procedure described by [
30] was exploited, which is based on a mutual information method. Then, to project images on the 3D model, the MeshLab function parametrization and texturing from the raster was used, which requires a limited set of images (10 at most). Each portion of the surface is assigned to the “best” image based on various matrices, and the texture mapping helps preserve the fine color details [
31]. The texture was transferred to the vertices of the 3D model, which was saved as a PLY file with color attributes to its vertex.
In the final branch D, the ANN from branch B and the 3D model with color vertices from branch C were imported in MATLAB. For each vertex, the RGB code was converted in a temperature value and a new PLY 3D model with temperature values for each vertex was saved. This step is required because in branch C, new colors might be generated due to the smoothing of transitions, as defined by [
30]. These colors might not have a one-to-one correspondence in the temperature-to-RBG matrix available at the beginning of branch B.
2.8. Data Processing: Calculation of the Differential 3D Map
Phase 9: Given a subject, the workflow can be applied in images collected under changing conditions, e.g., to assess differences in skin temperature between rest and after walking. Since the temperature information is recorded at vertex level, it is straightforward to calculate, for each vertex, the difference between temperatures and associate them back to the vertices of the 3D model. The color coding added through the jet color map takes advantage of the full color range by setting the minimum difference to the first row of the color map, the maximum difference to the last row and linearly interpolating the other colors in the temperature range. The result can be saved in a PLY format for further visualization in Meshlab.
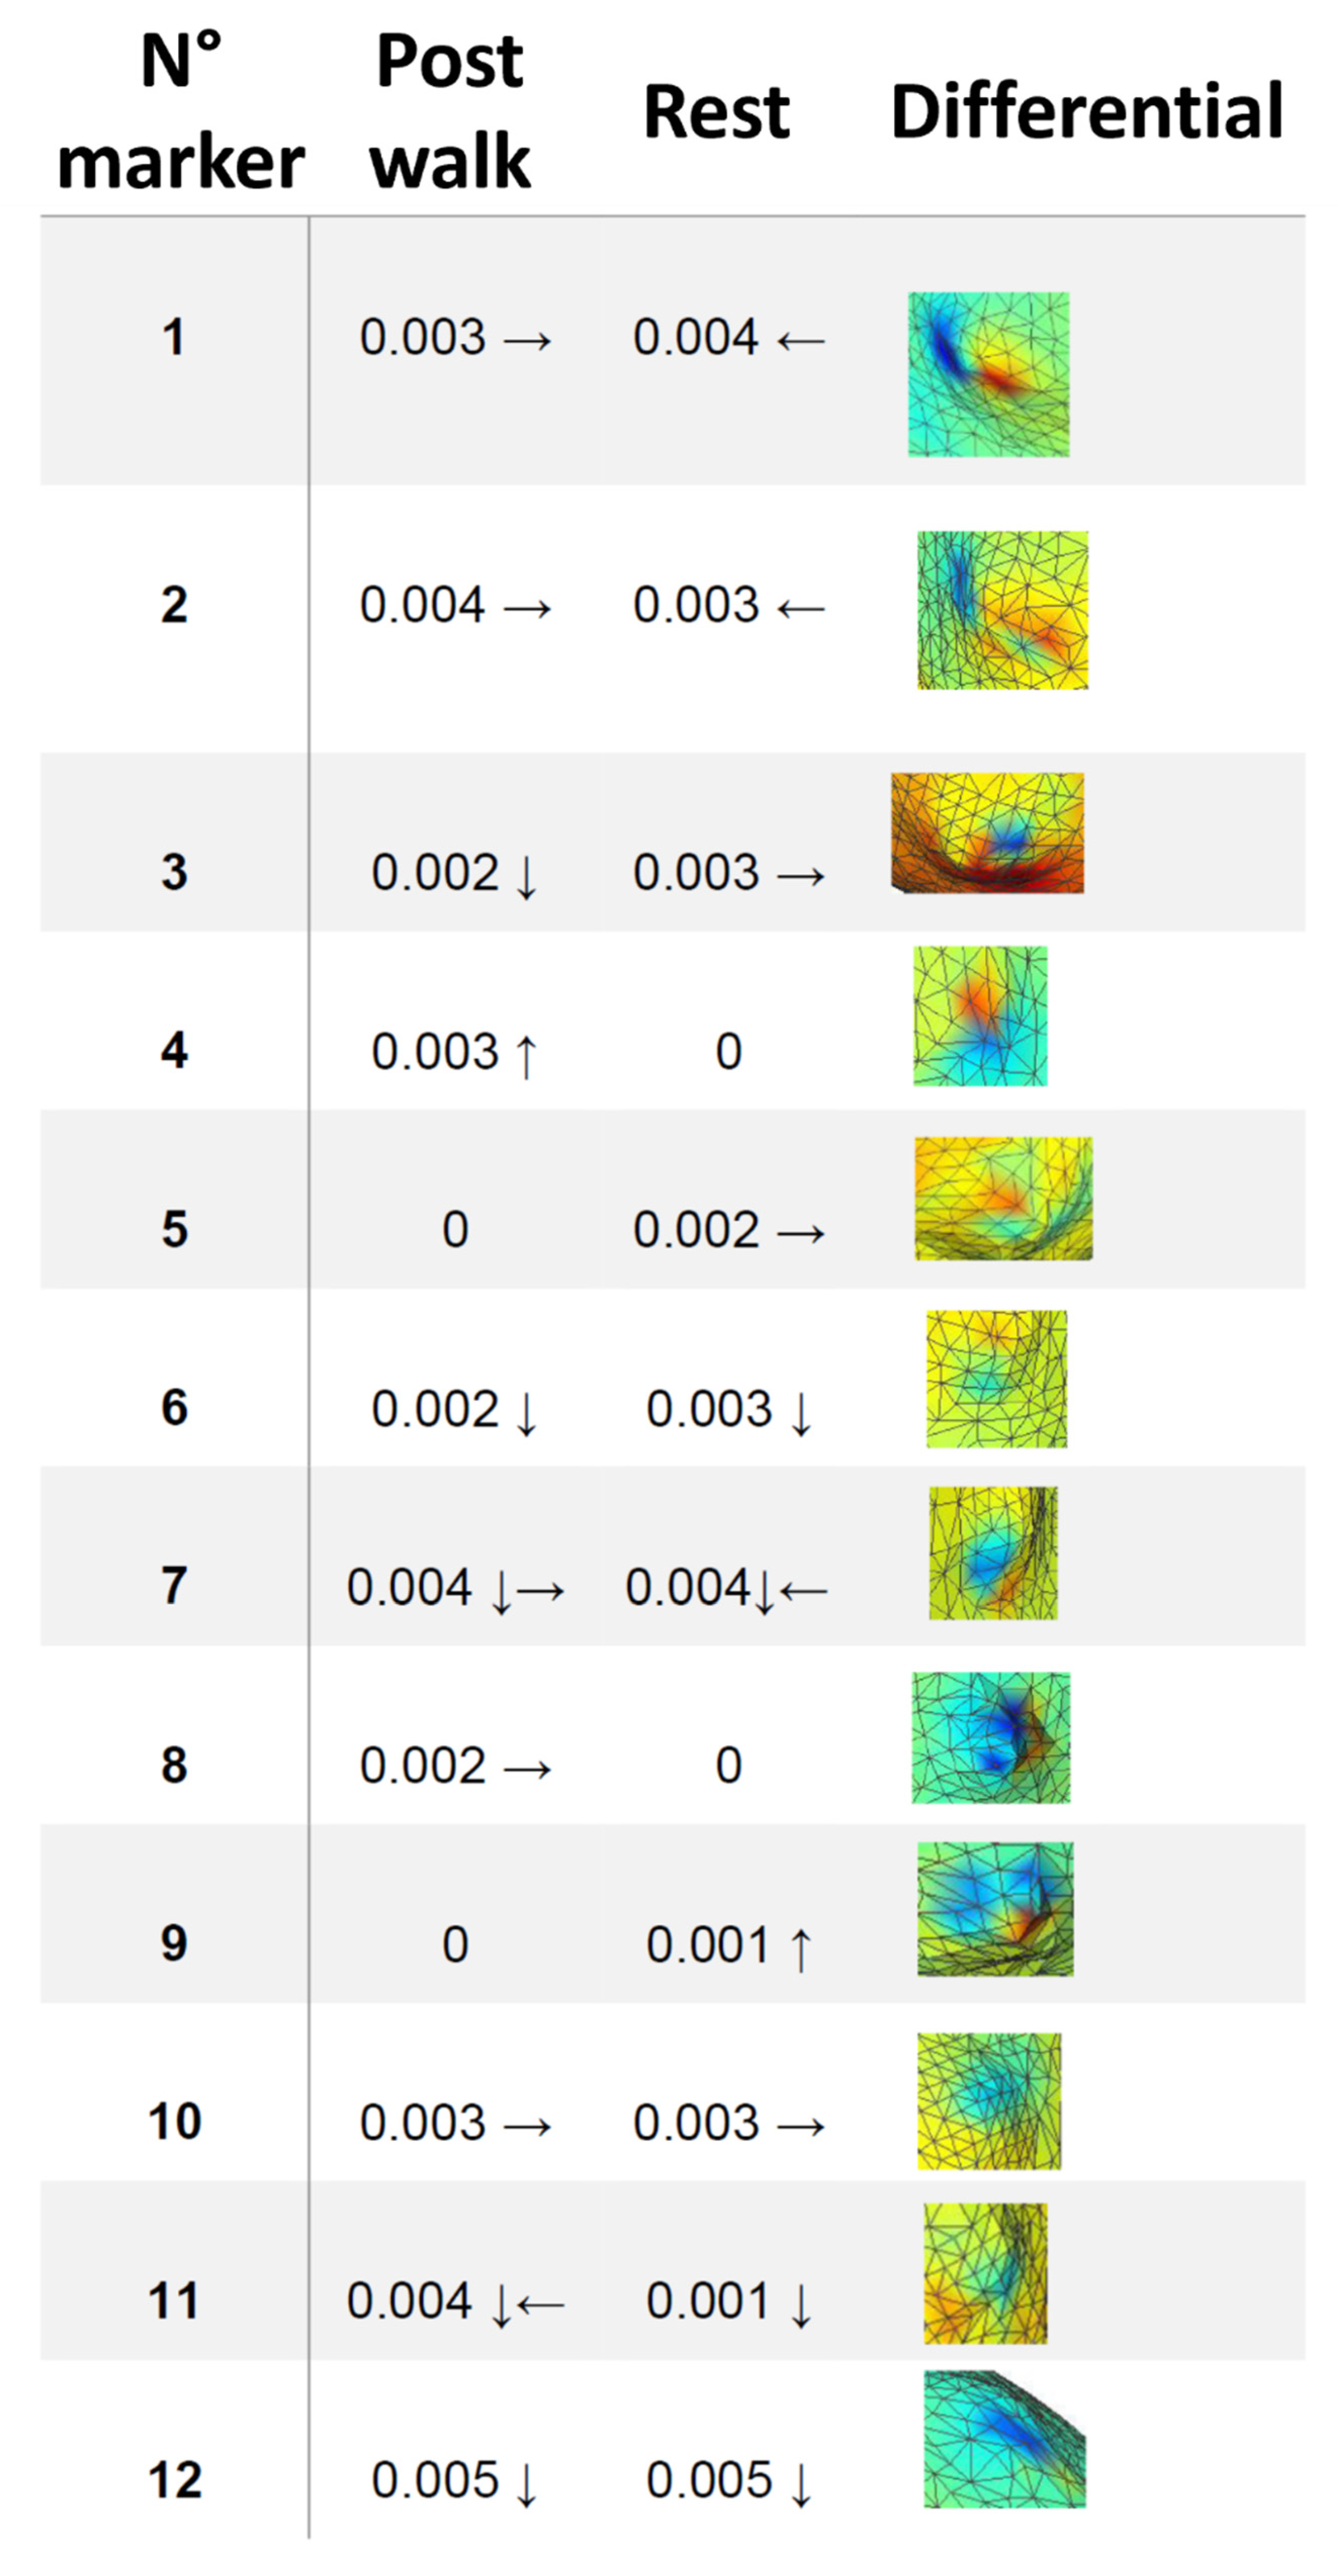
2.9. Data Processing: Accuracy Assessment
The accuracy of the registration process can be visually and quantitatively assessed when examining the differential map. The temperature of the 3DTM remains (almost) constant during the post-walking and resting conditions, leading to an area with a differential temperature close to zero degrees on top of the 3D mesh of the 3DTM. This temperature difference should appear as a deep blue coloration. Any deviation from this coloration indicates a misalignment between the post-walking and resting maps on top of the 3D model. To determine the extent of this misalignment, the MeshLab measuring tool can be used to calculate the distances between the vertices of the 3DTM center and the color marks. The accuracy assessment on the differential map provides the full estimation of the workflow error as it is the sum of the errors in registering the post-walking and resting thermal images on the same 3D model. The approach provides a more comprehensive assessment of the accuracy of the full process compared to individual assessments of the post-walk and rest conditions.
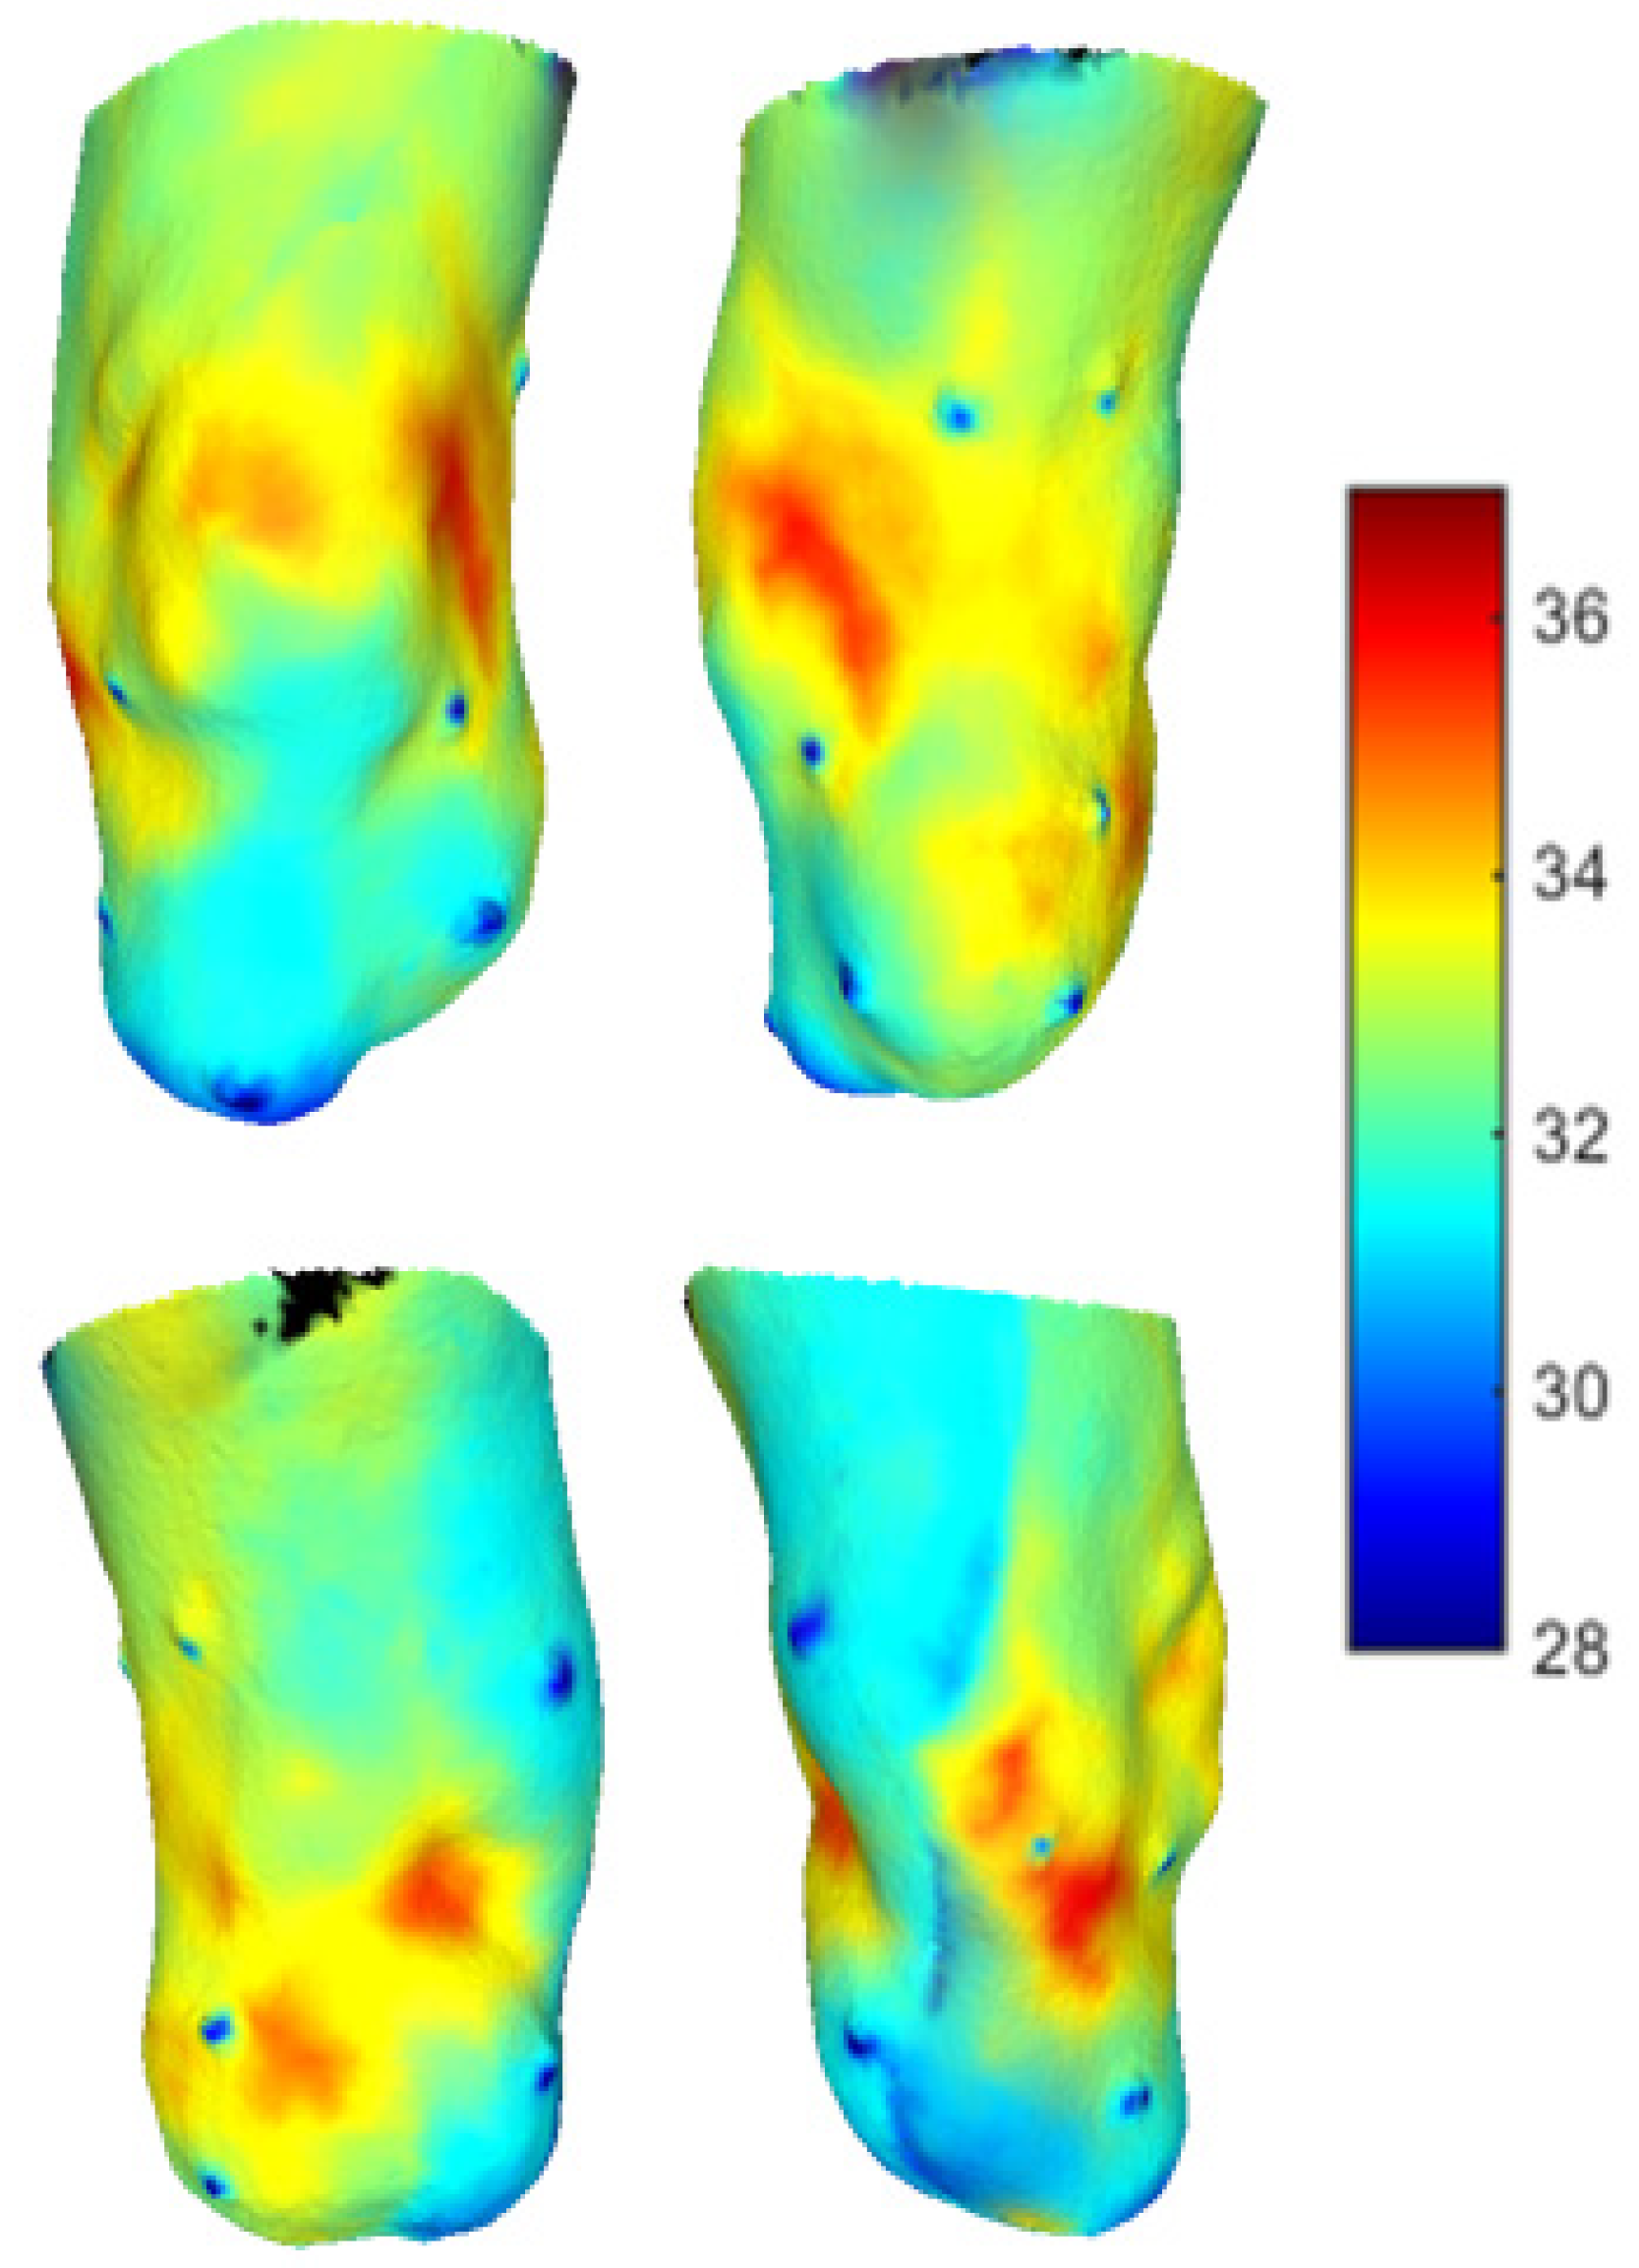
2.10. Case Study
The feasibility of the workflow was tested in a case study involving a 65-year-old man with a traumatic third-proximal transtibial amputation. Based on the residual limb conformation, seven 2D thermal images for both the post-walk and rest phases were deemed clinically necessary for the description of the residual limb. During the walk phase, the subject was instructed to wear his prosthesis, which included a liner as an interface with the socket. The study was conducted in a controlled environment with monitored temperature and humidity levels of 23 °C and 58.5%, respectively. The temperature and humidity values were maintained within a narrow range of ±1 °C and ±5%, respectively, throughout the experiment, to obtain reliable and consistent measurements without compromising the well-being of the subject or introducing any unwanted external factors that could impact the results [
32].
4. Discussion
The aim of the study was to advance an innovative workflow for the calculation of the 3D thermal maps of a residual limb of a person with transtibial amputation, e.g., to support the identification of areas of higher mechanical stress induced by socket use. Indeed, this information could be prospectively used to improve the fitting of prosthetic sockets when objective quantitative measures are needed to supplement uncertain or unavailable patient feedback or the limited experience of the patient or prosthetist.
In a previous work by [
19], 2D thermal mapping was used to assess the most stressed points of the skin surface of the residual limb after level walking at normal speed for an individual wearing his own socket. Notably, even without pain or discomfort reported by the subject, the activity generated hot spots on the limb, which were potentially a source of skin lesions. In the present work, we found hot spots in almost the same locations around the knee joint, i.e., in correspondence with bone protuberances and/or skin-socket contact points, even after a rest of 15 min. Even in our case, the hot spots were painless and tolerated by the user. At present, the capacity for the prolonged stimulation of identical skin spots to induce medical complications over an extended period remains uncertain. Such an issue may be critical for subjects with diabetic amputation, in whom peripheral sensitivities are reduced by the degradation of vascularization induced by the pathology [
33].
Thermal information was previously used in multiple medical applications, but details about the quality of the reconstruction are briefly reported. For example, the thermal information of the 3D reconstruction of a human head acquired with CT has been mapped in [
22], with a mean registration error of 1.77 mm. We found a comparable registration error using a non-invasive technique. This was probably achieved thanks to the markers applied on the residual limb, which were interpreted by the software as irregularities to exploit for the registration. Due to their hollowness, the markers were valuable features for integrating thermal and geometric information.
The registration errors registered on the differential map are clinically judged to be acceptable, since typical modifications during the fitting process use mechanical tools larger than the recorded errors.
Noticeably, when compared to the 2D examination of multiple images, the availability of 3D maps substantially eases the interpretation of the results.
Although a variety of techniques exist to produce 3D models textured with thermographic information, the novelty of the proposed method can be summarized as follows: first, the technique was conceived to specifically address an open clinical issue with the fitting of protheses in lower limb amputees; second, the introduction of “thermal markers” supports the 2D−3D registration process and gives the intrinsic capability to monitor the registration error; third, the overall protocol is easy to replicate in clinical testing centers, thanks to the use of largely available free software. On this last regard, the ANN developed in MATLAB can be implemented without changes in Python-based alternatives.
The major limitation of this study is the inclusion of a single subject. Indeed, our main aim was to propose a dedicated protocol and test its feasibility. Additional clinical trials are needed to test the reliability and reproducibility of the workflow, and to test its clinical effectiveness in terms of decision-making.


 ,
, 


