
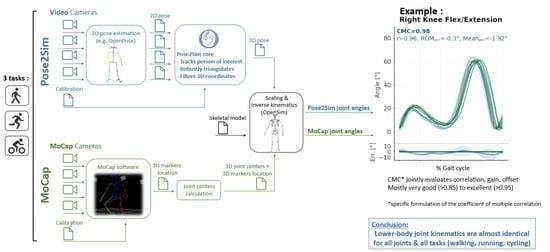
Pose2Sim: An End-to-End Workflow for 3D Markerless Sports Kinematics—Part 2: Accuracy


Abstract
:
1. Introduction
2. Materials and Methods
2.1. Participant and Protocol
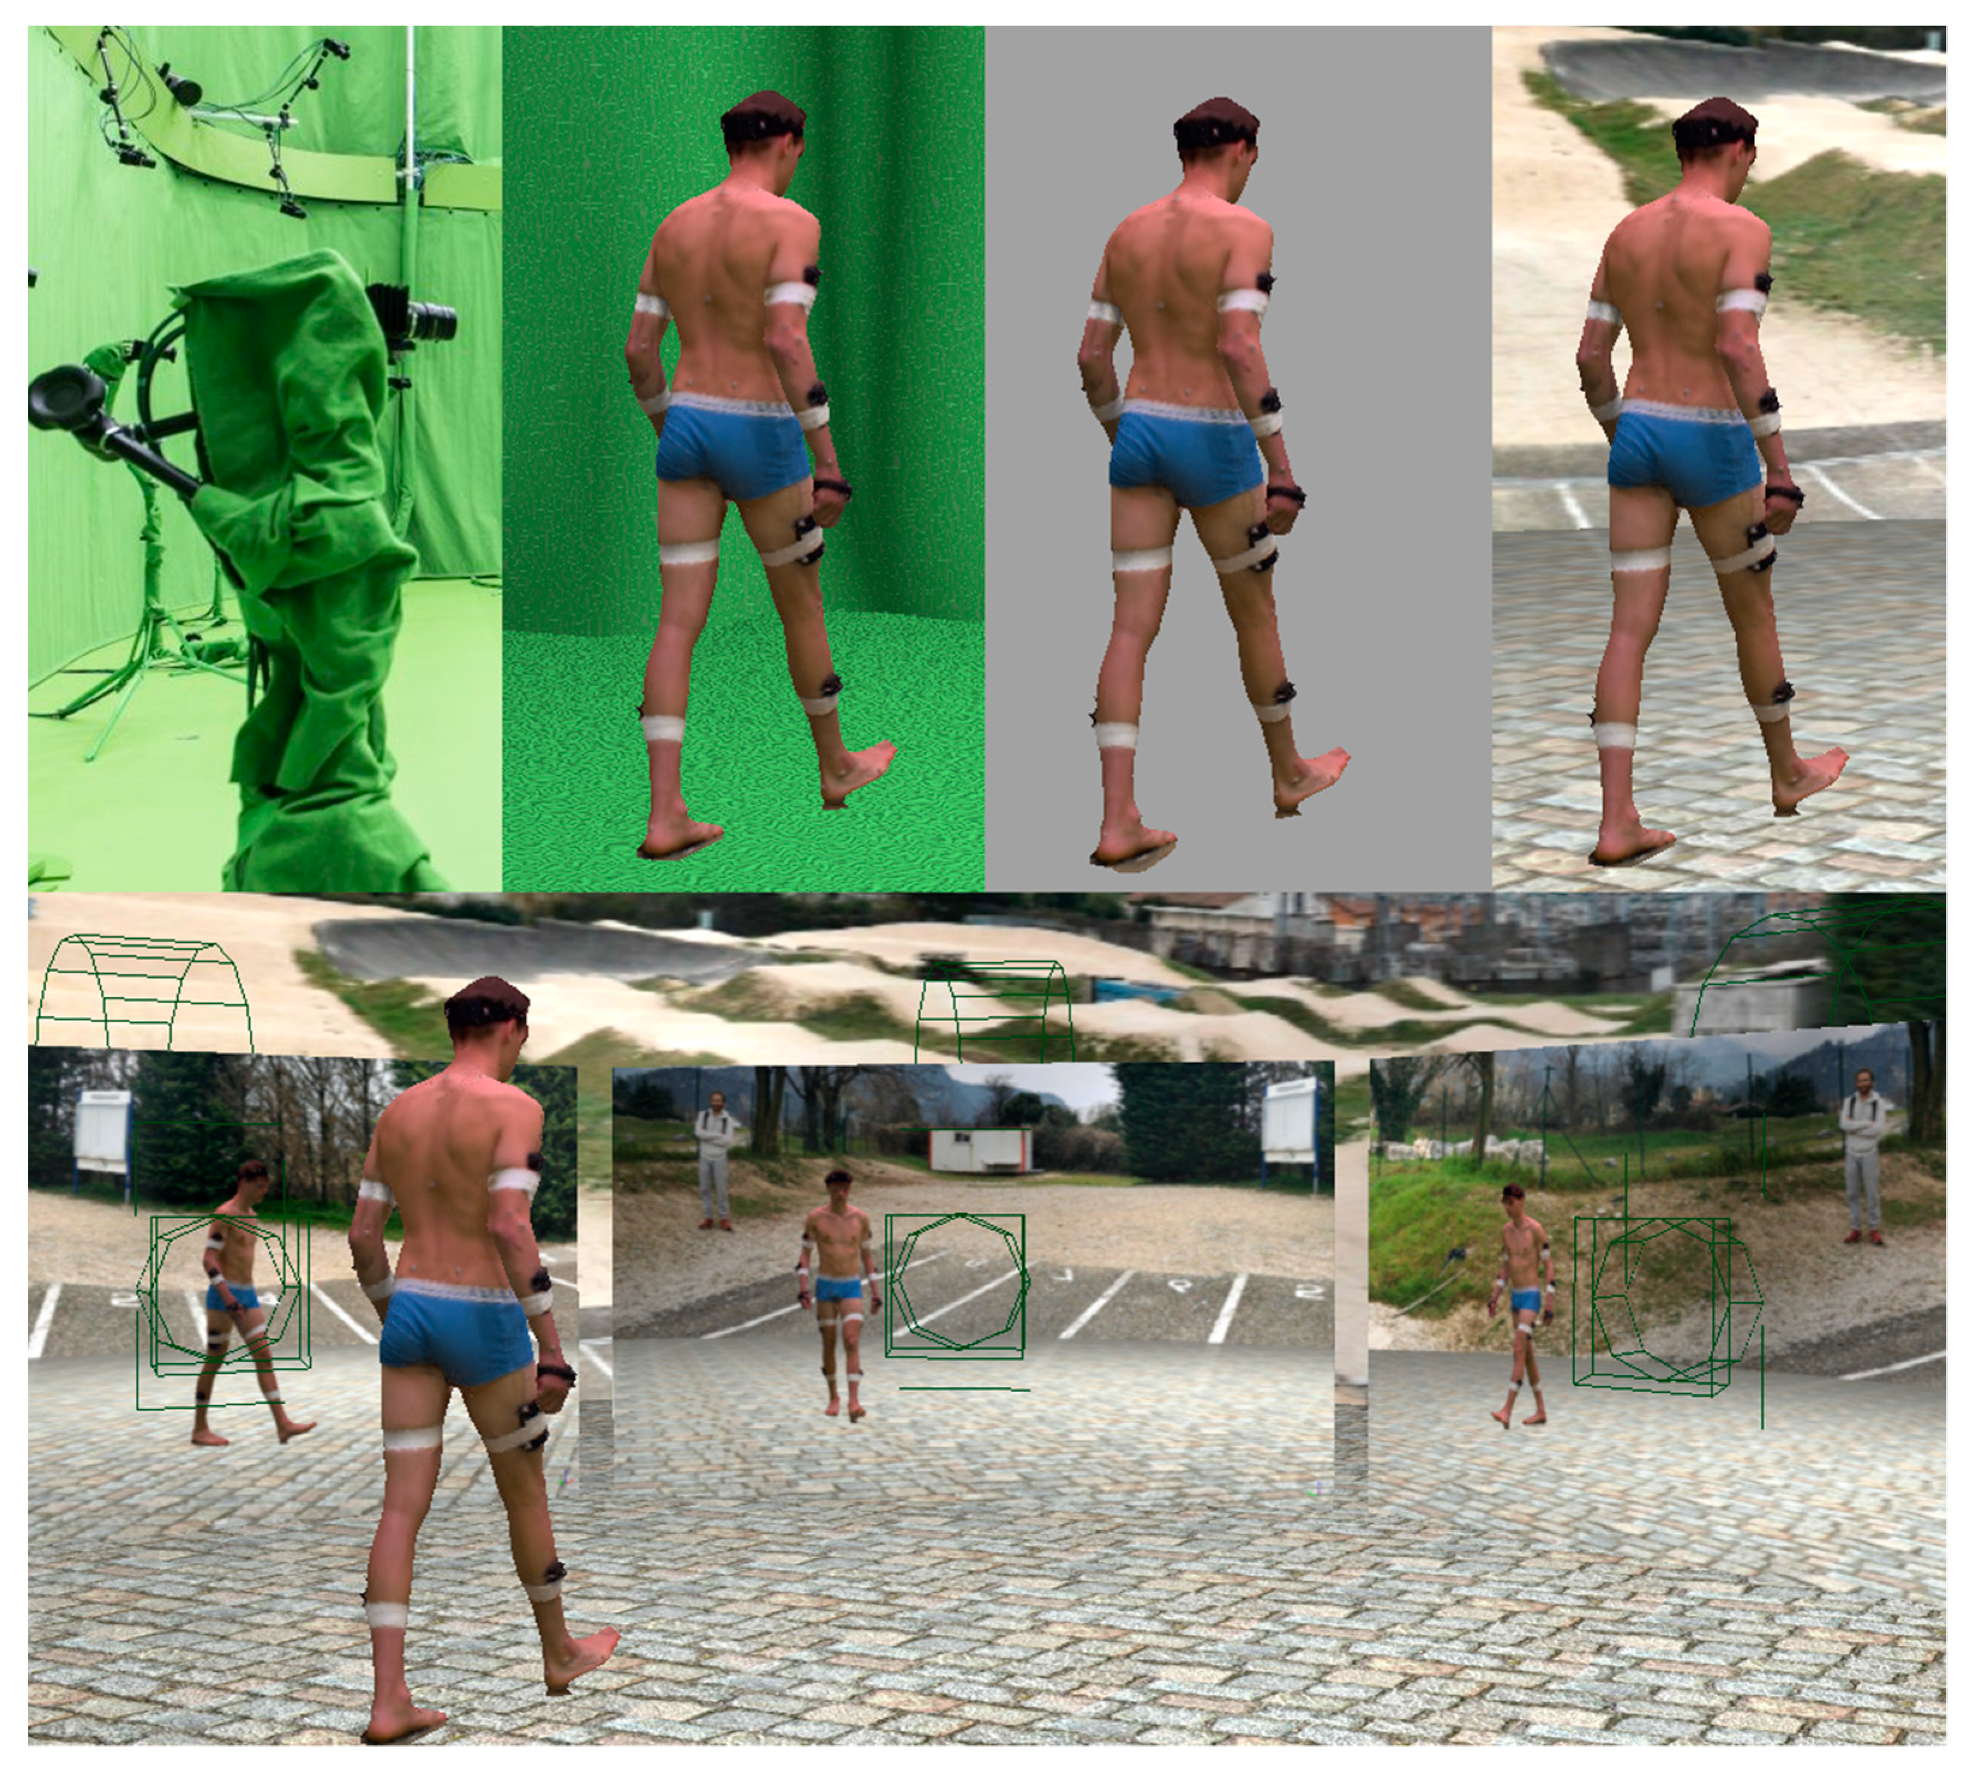
2.2. Data Collection
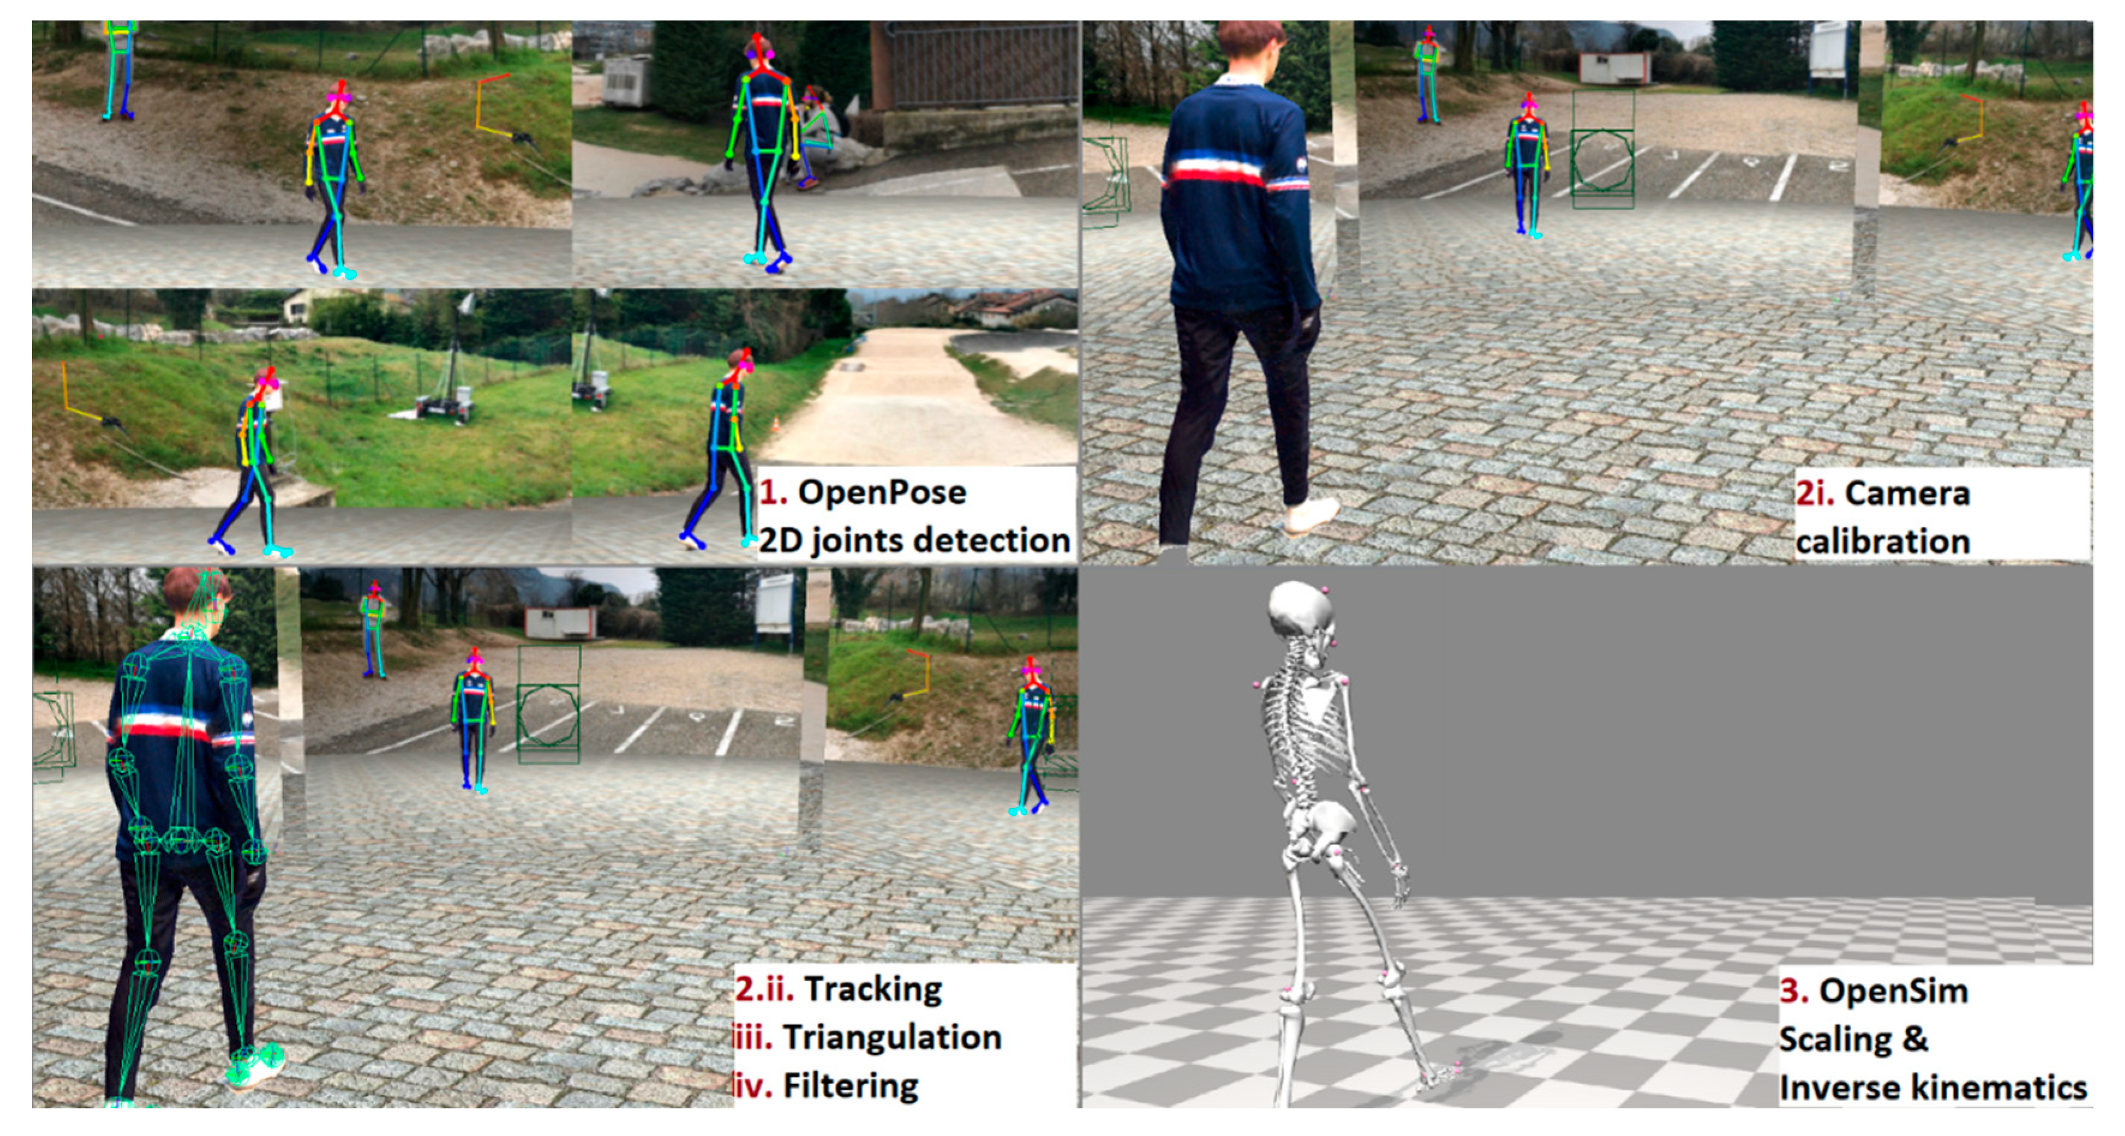
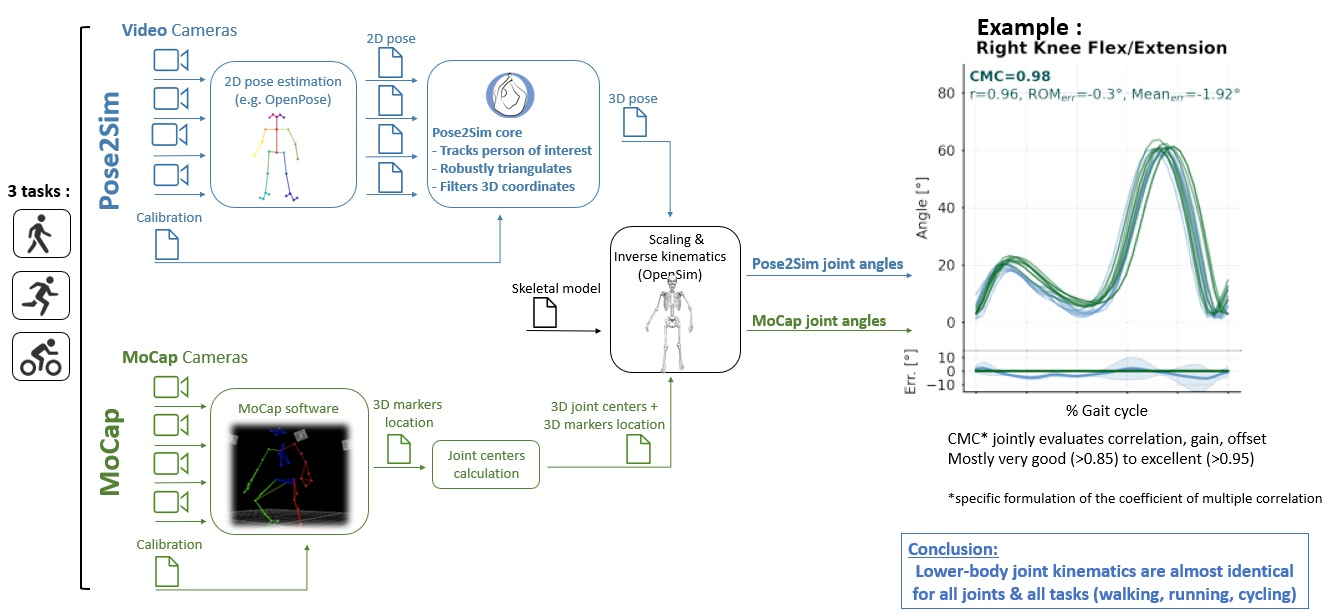
2.3. Pose2Sim Kinematics
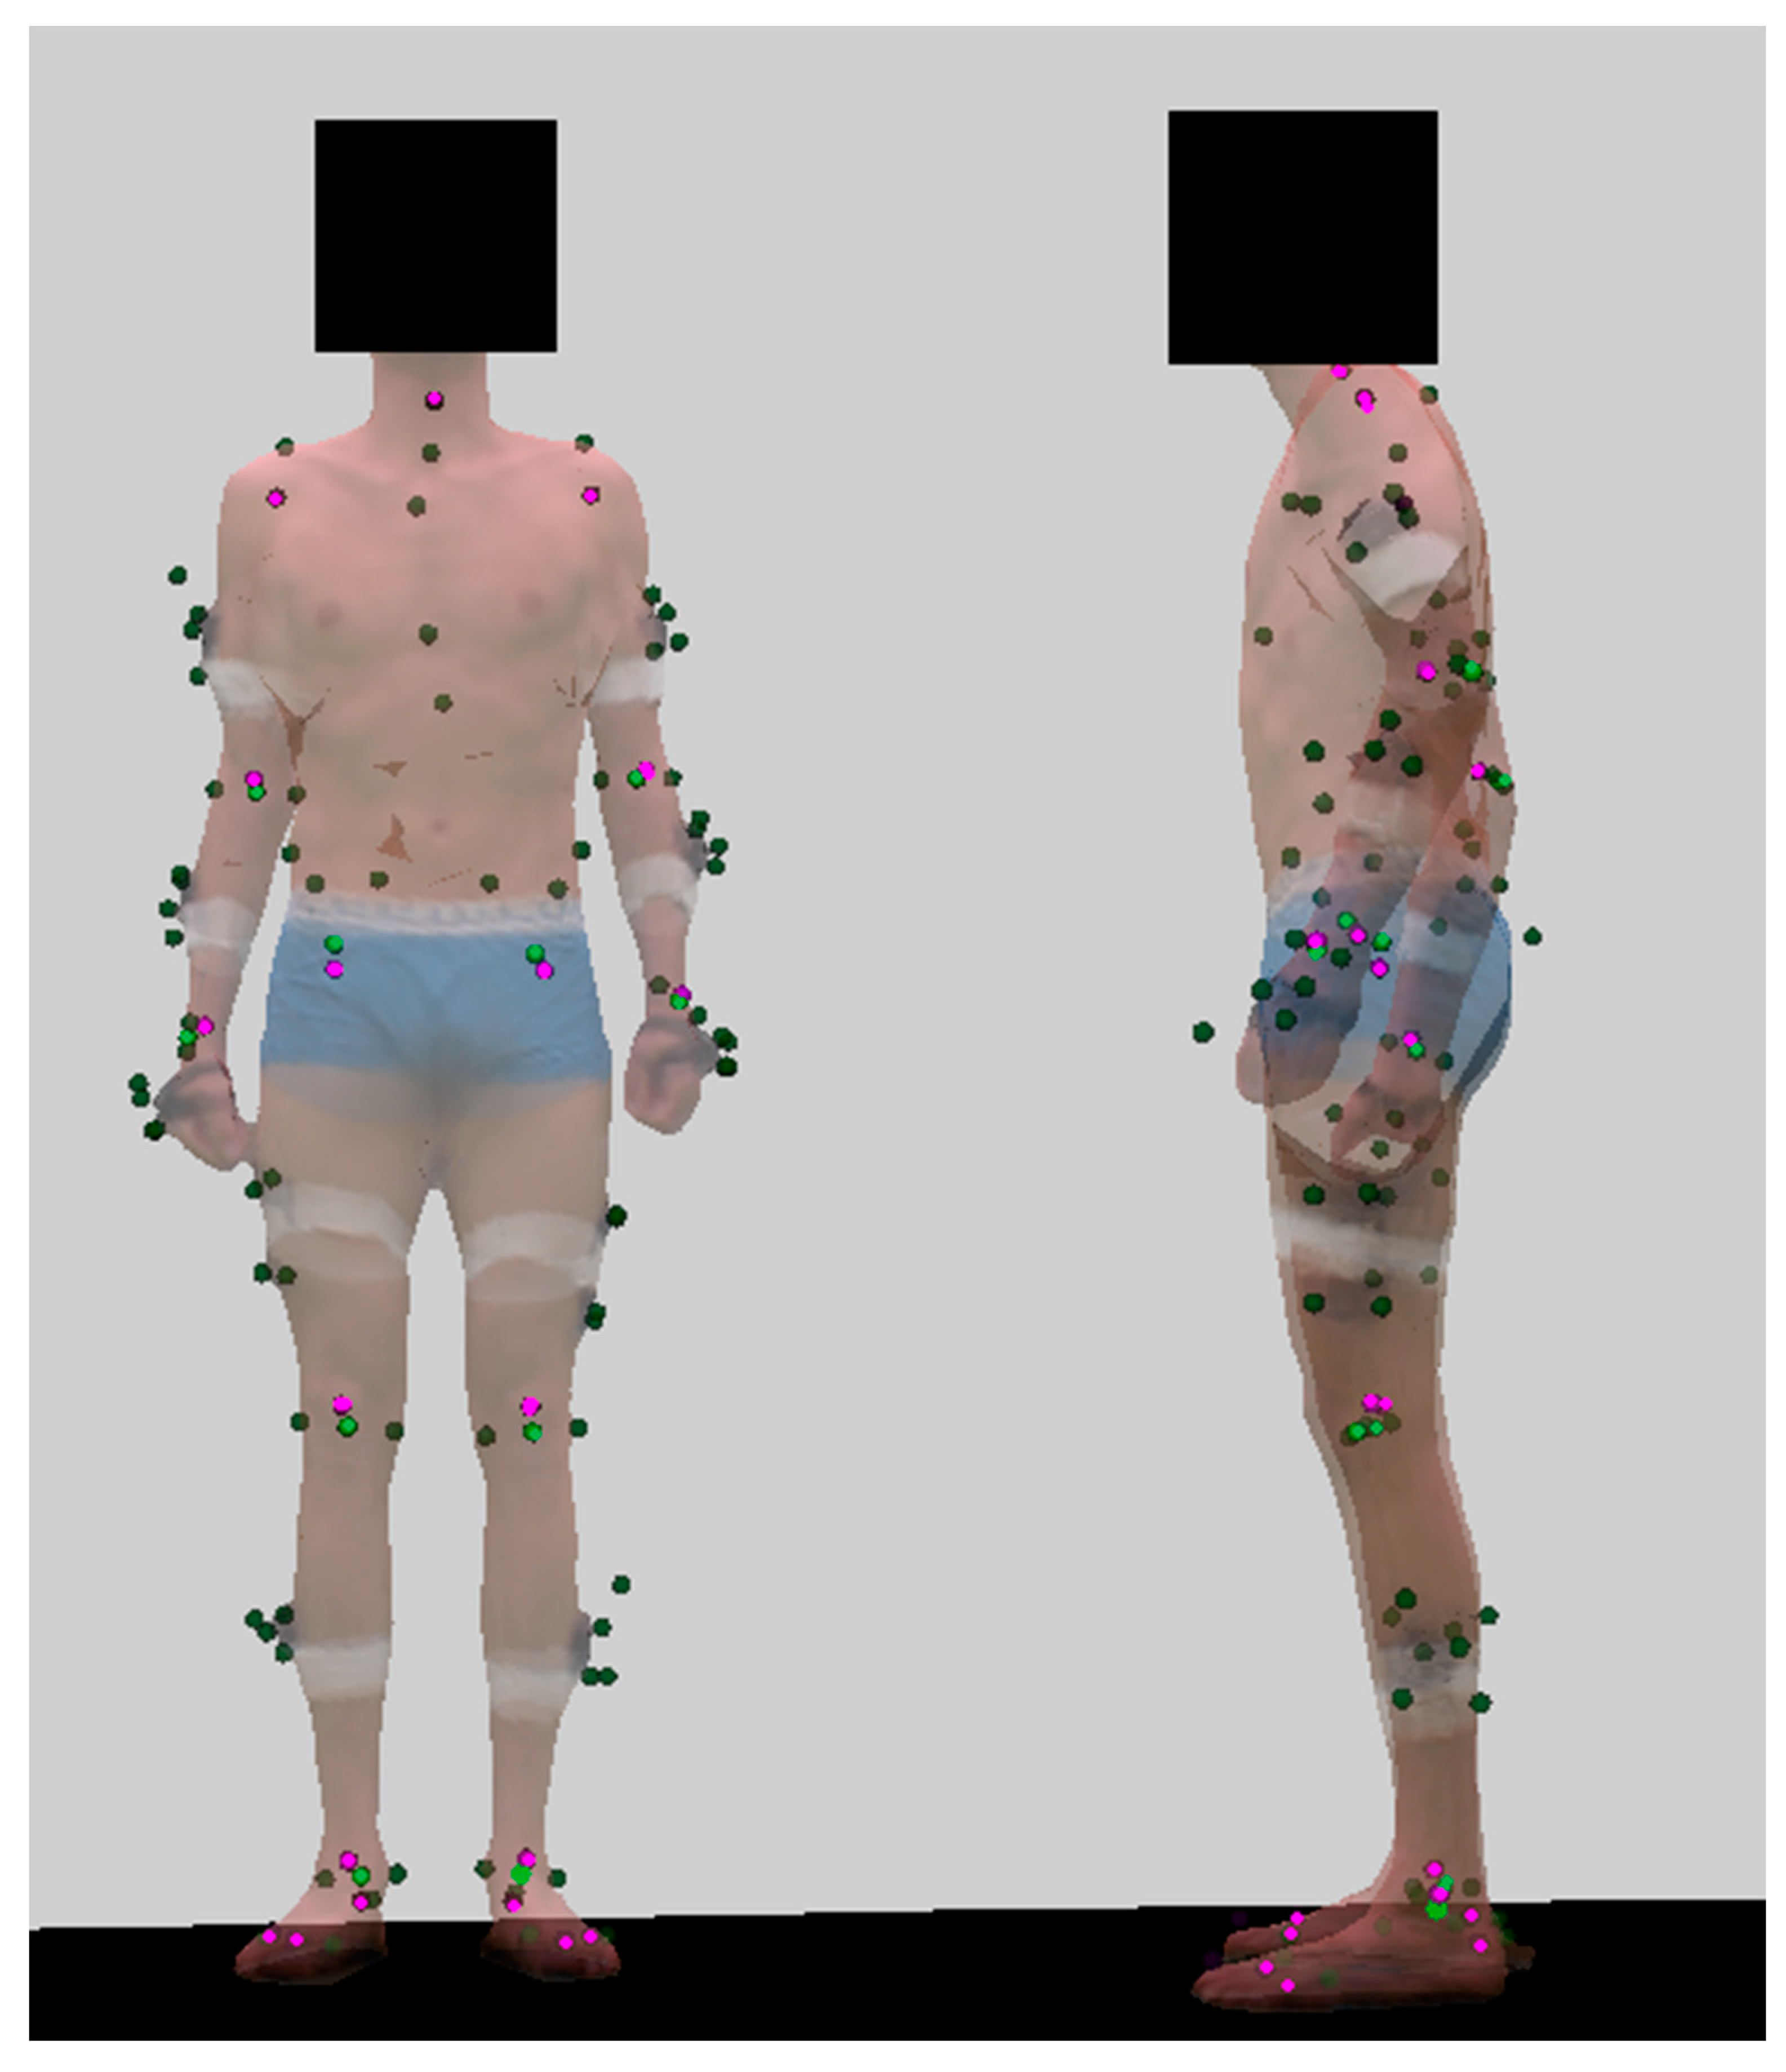
2.4. Marker-Based Kinematics
2.5. Statistical Analysis
3. Results
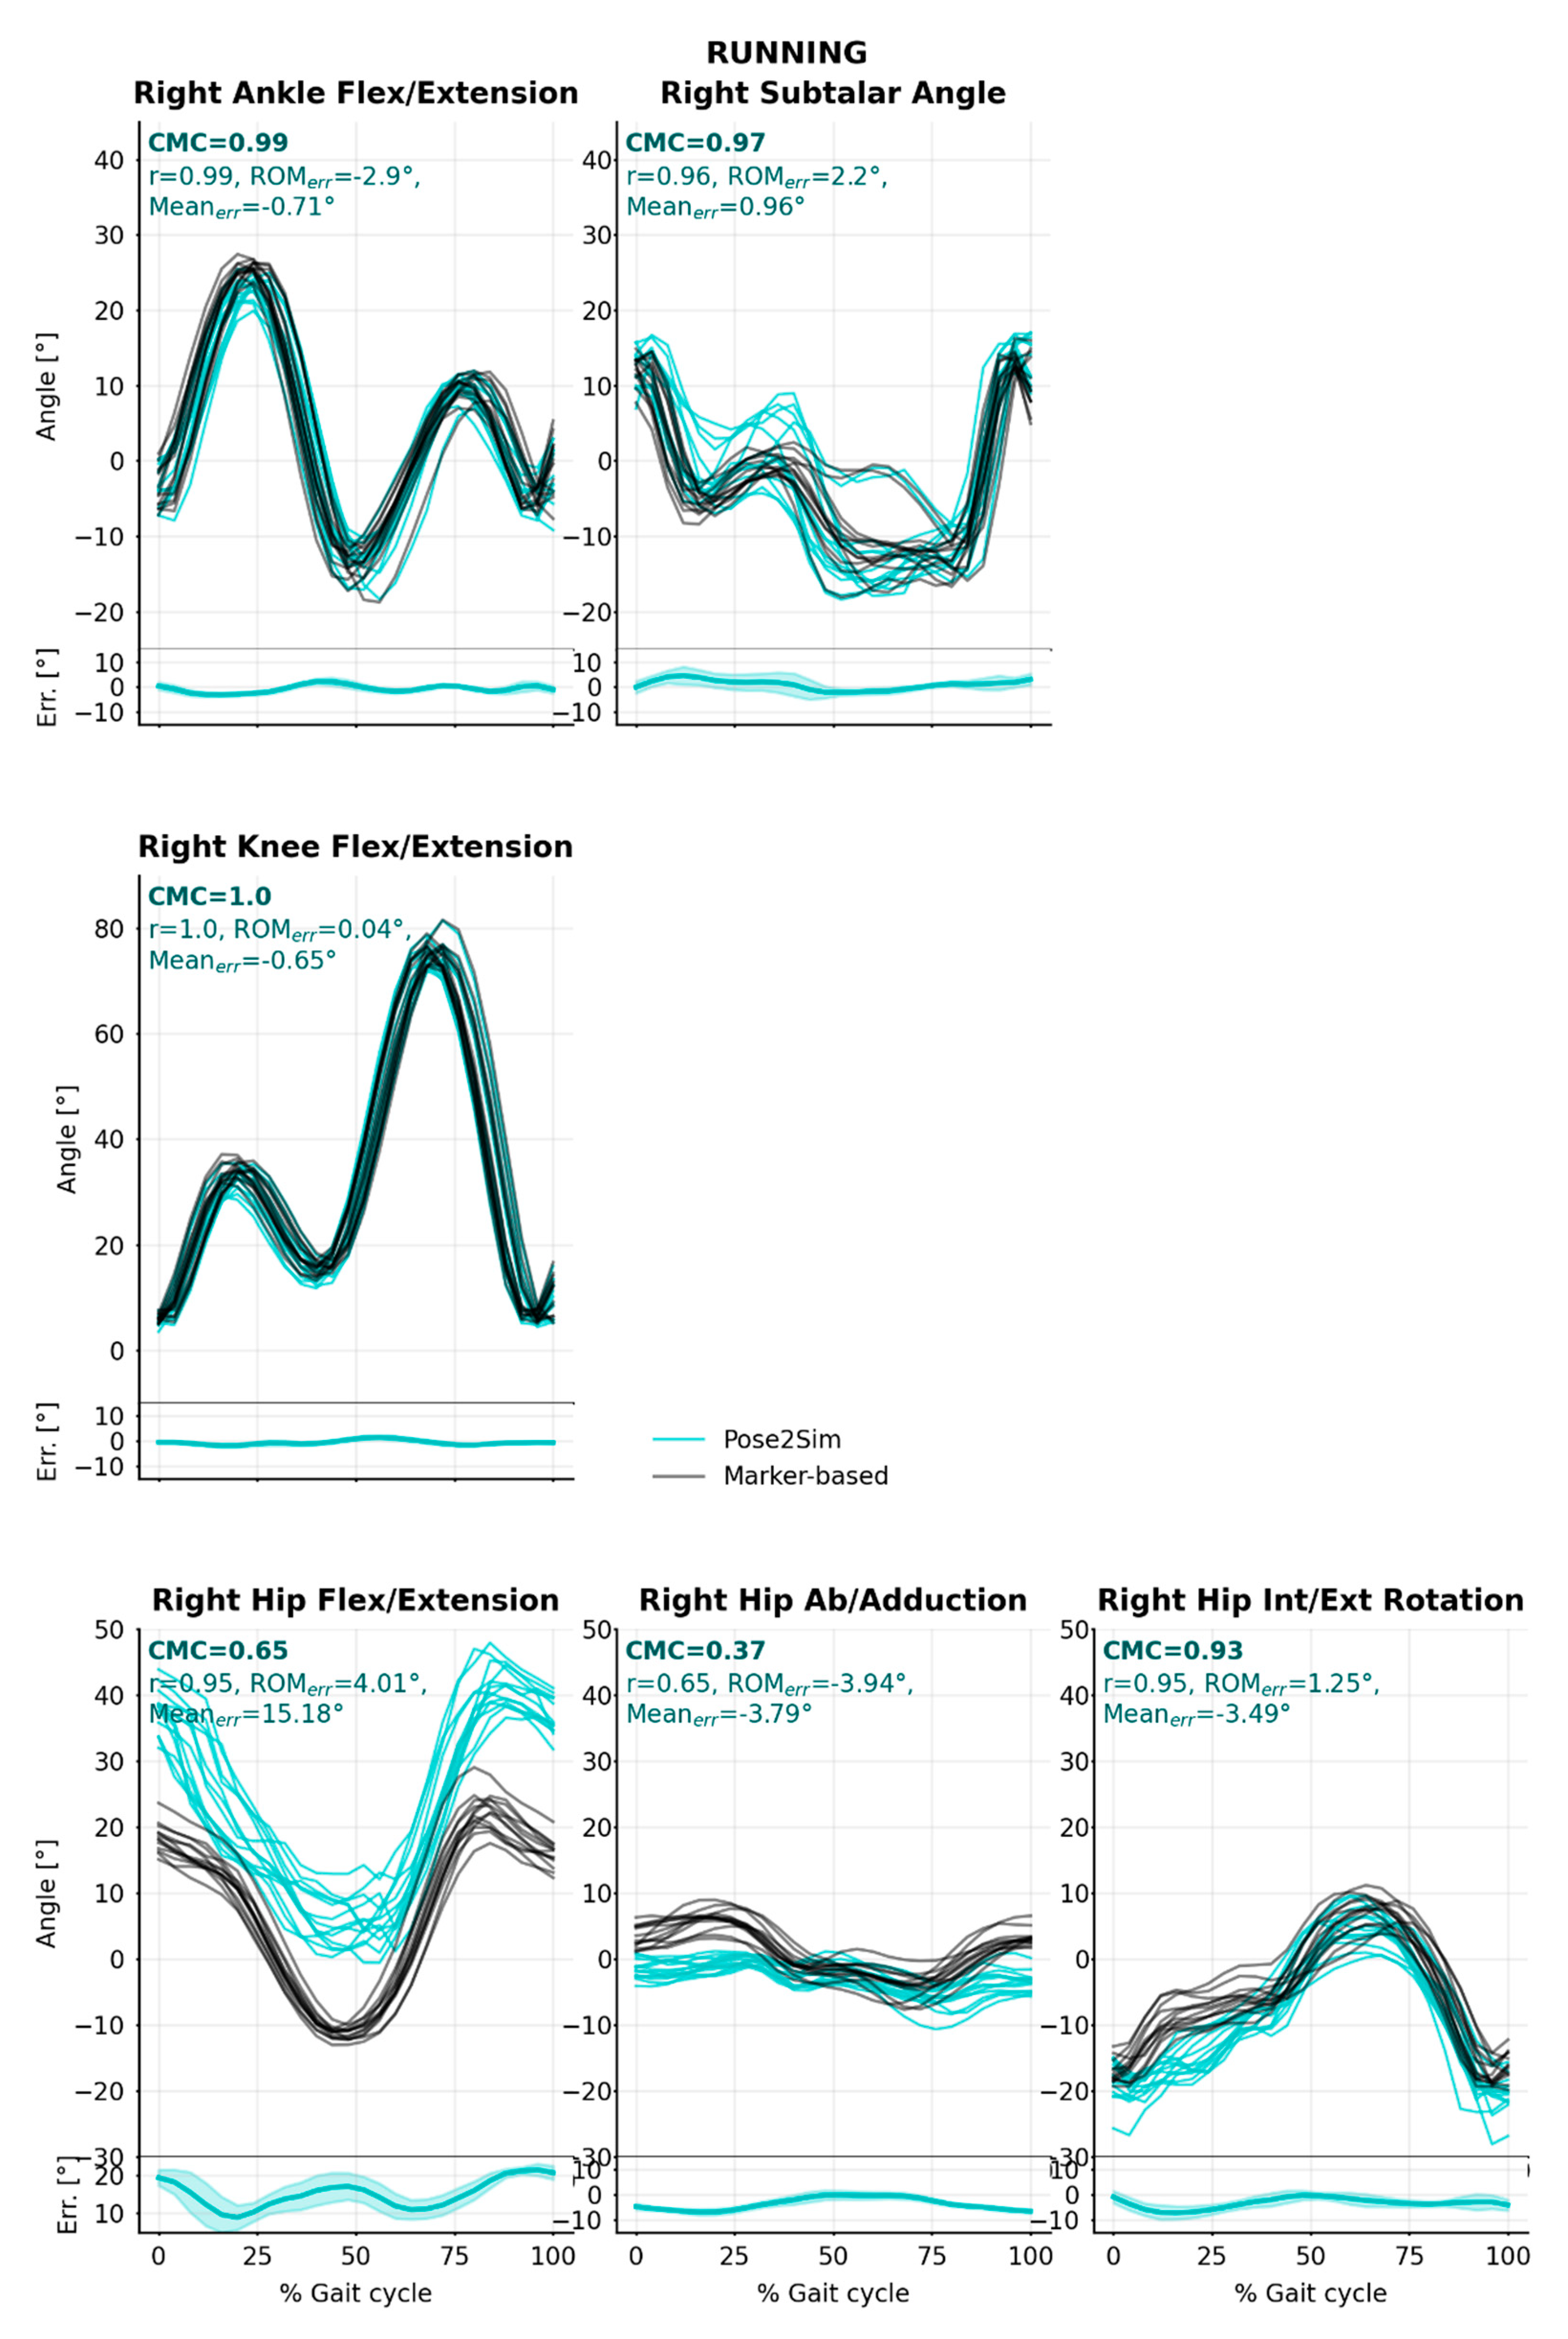
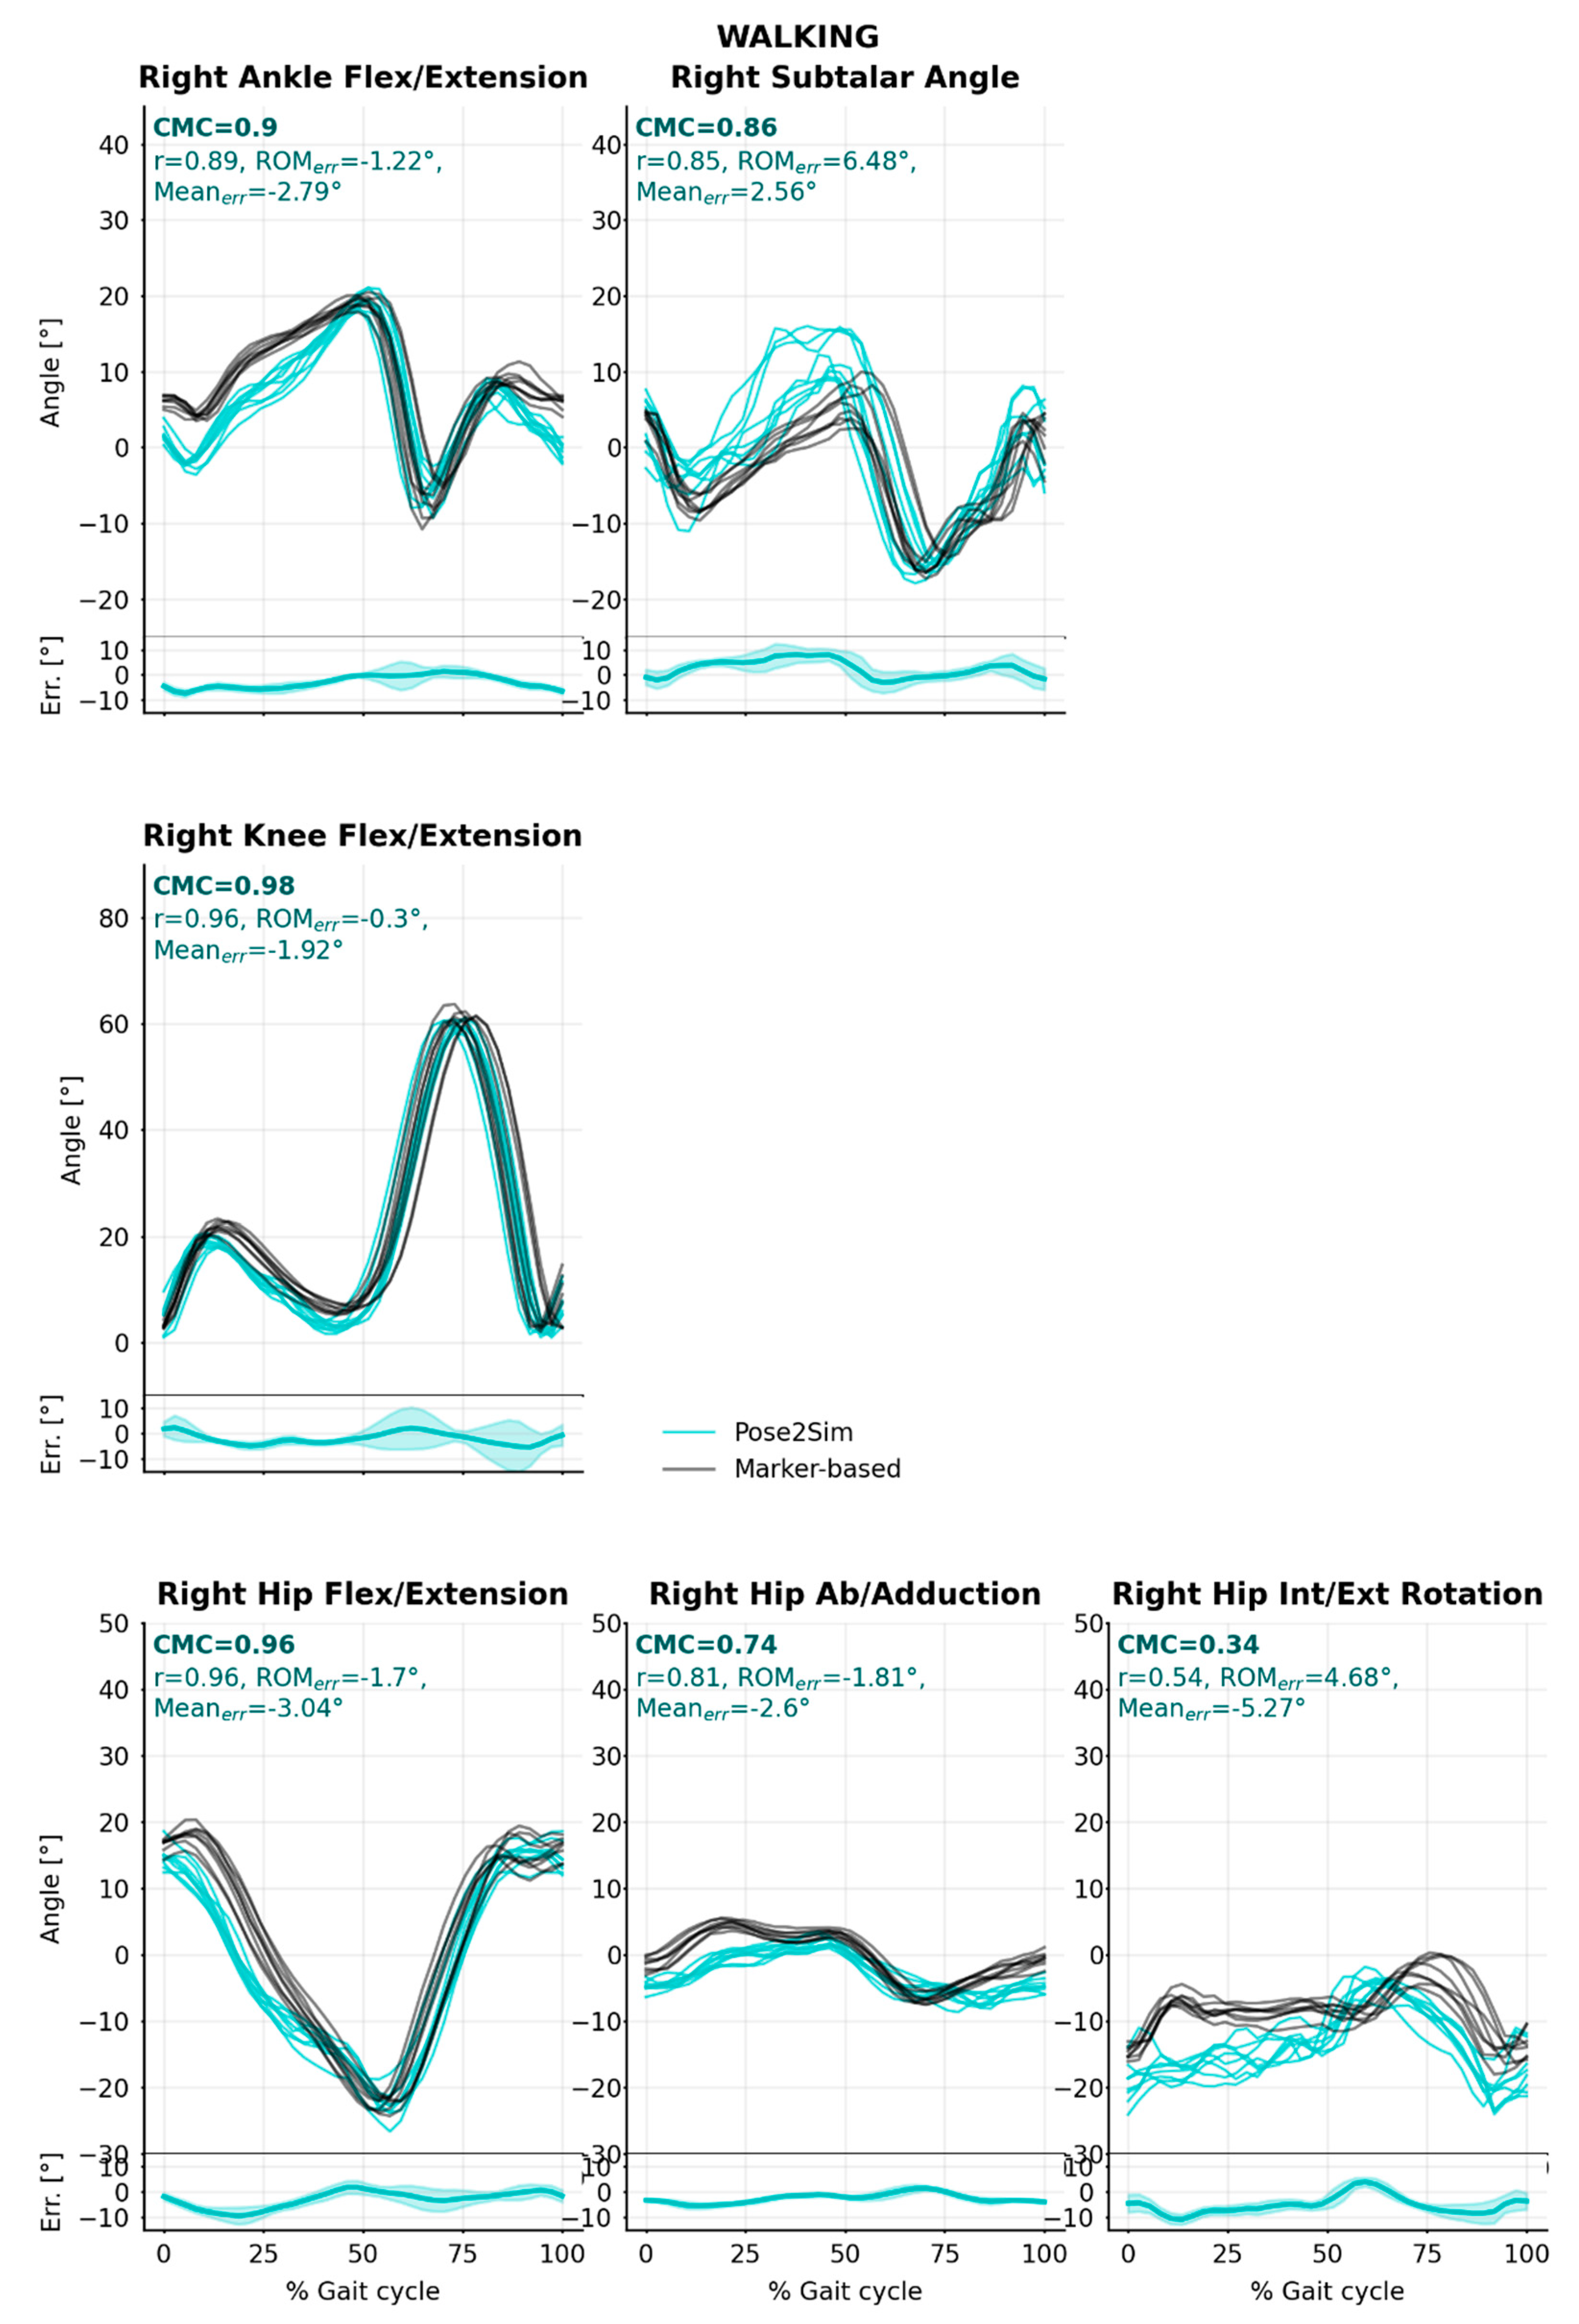
3.1. Inverse Kinematics: CMC, Correlation, Gain, Offset
3.2. Comparison with Other Systems
4. Discussion
4.1. Strengths of Pose2Sim and of Markerless Kinematics
4.2. Limits and Perspectives
5. Conclusions
Author Contributions
Funding
Institutional Review Board Statement
Informed Consent Statement
Data Availability Statement
Acknowledgments
Conflicts of Interest
Appendix A
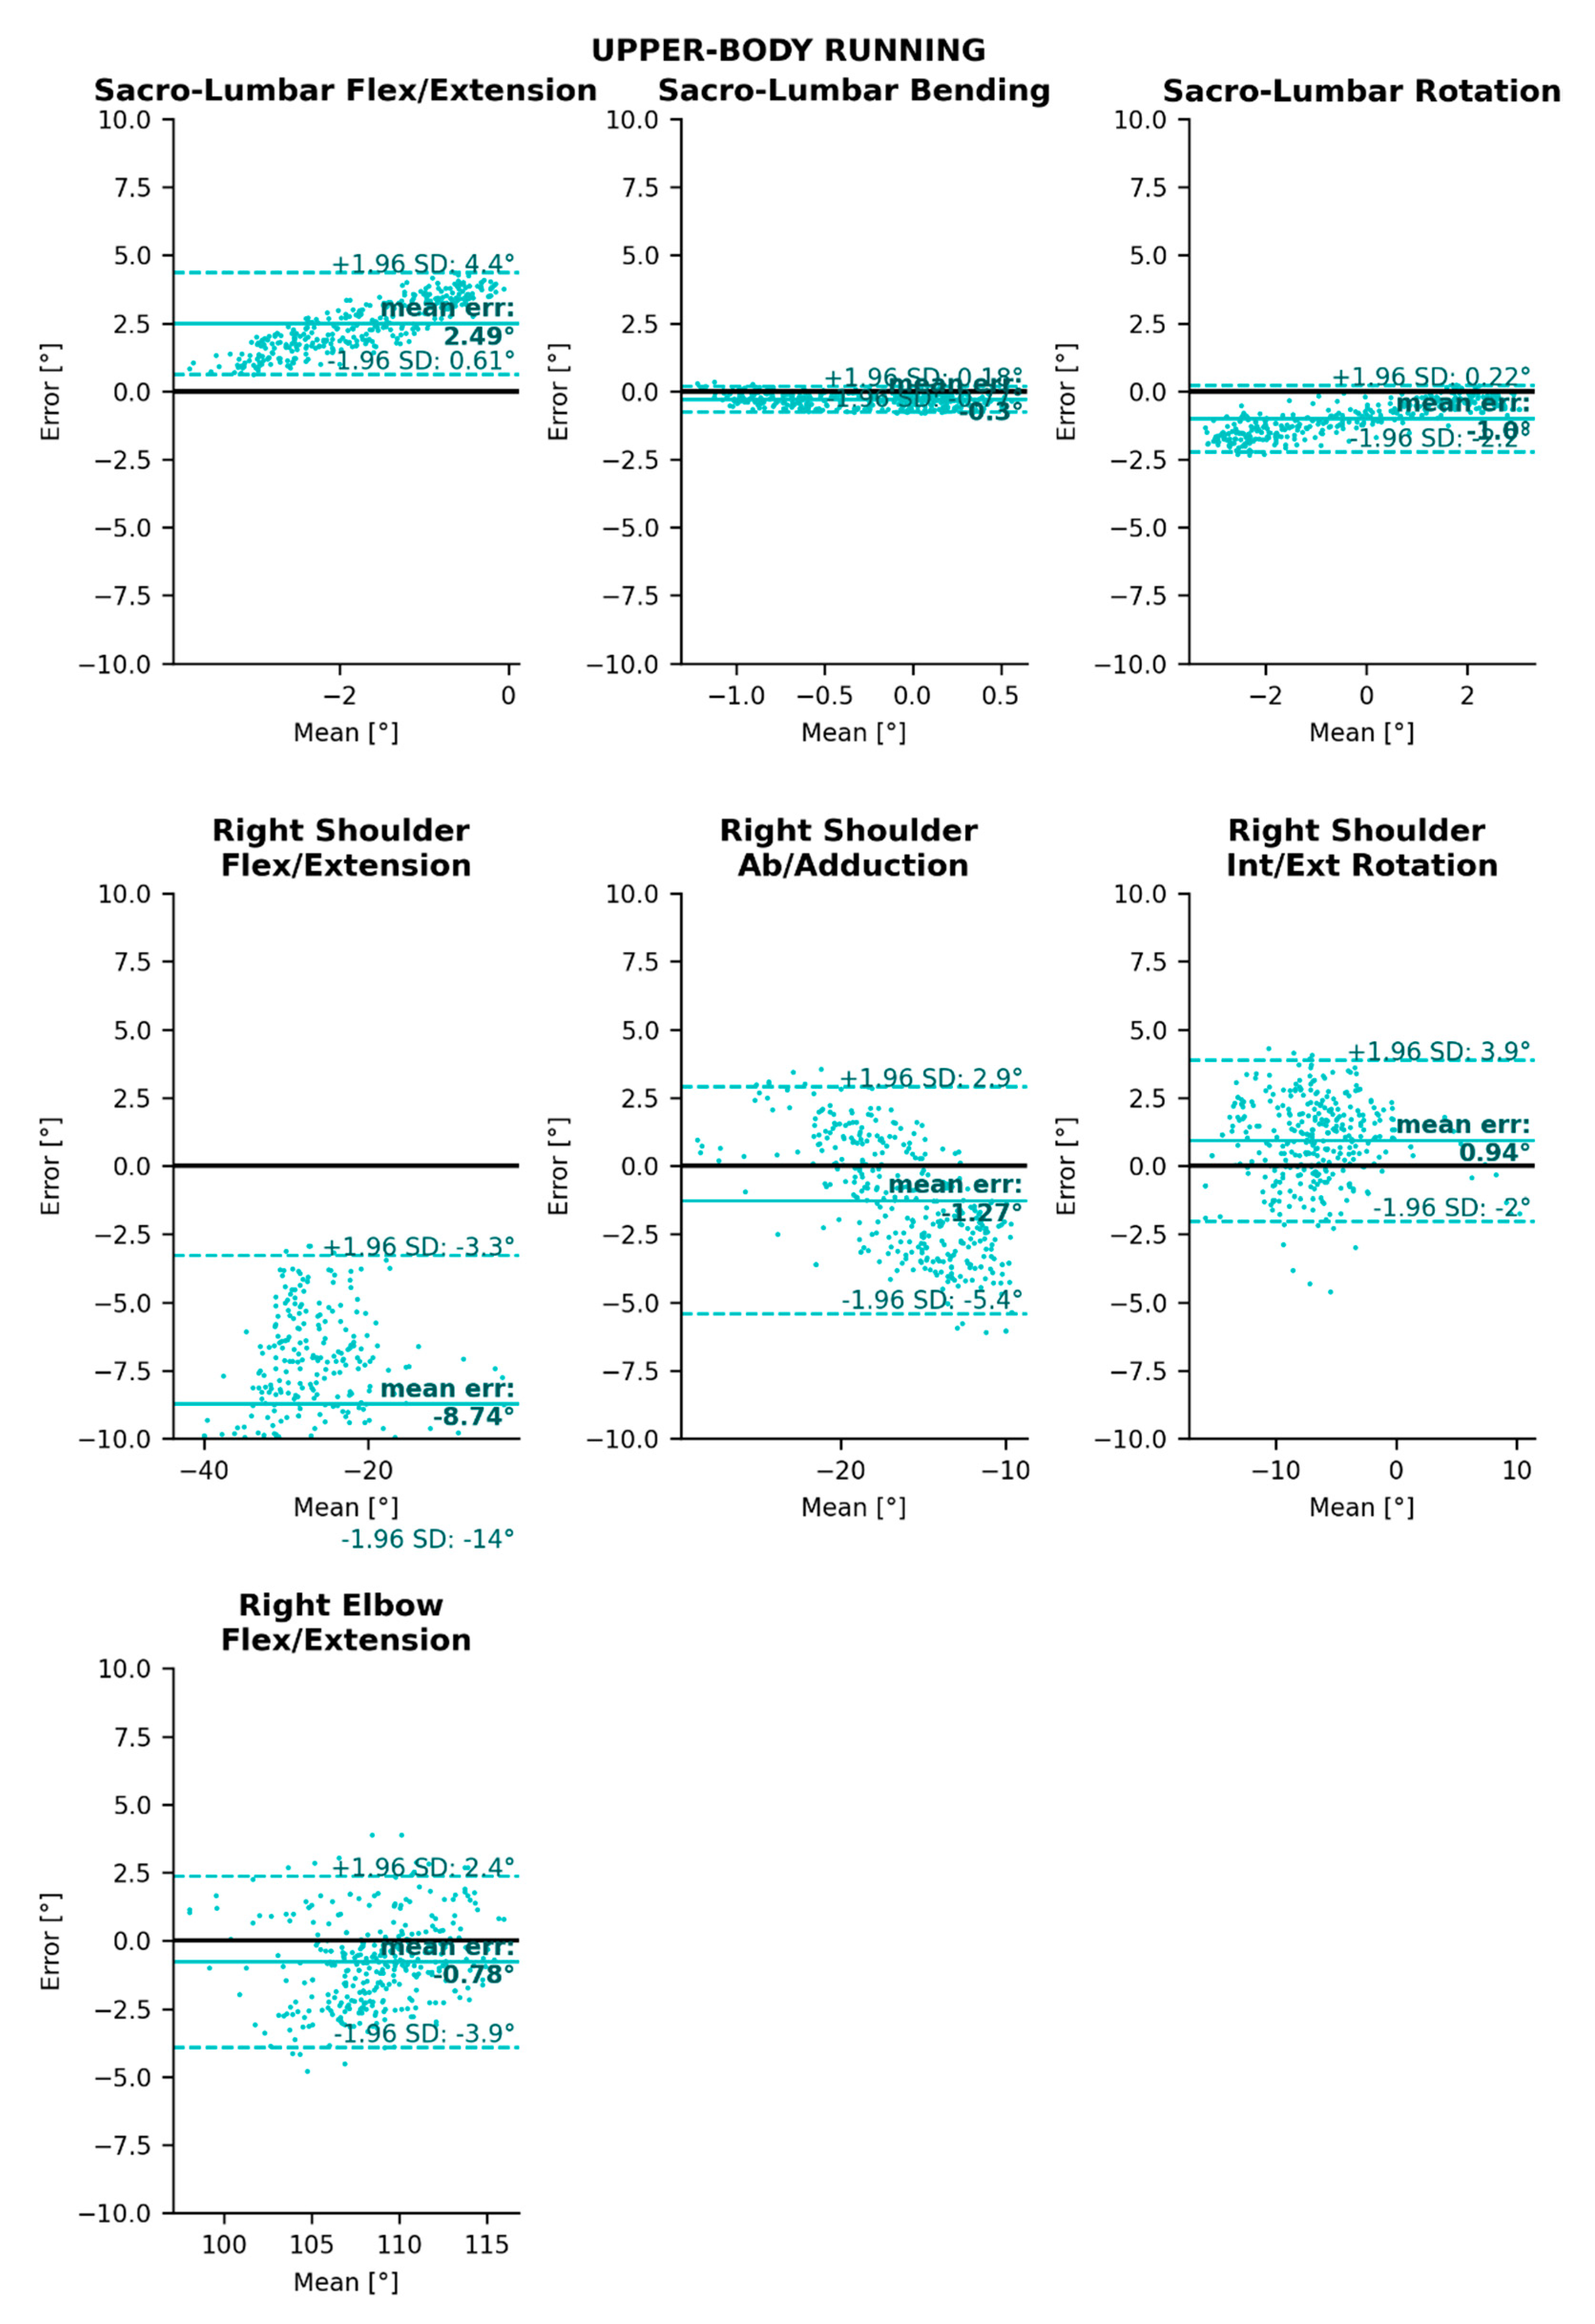
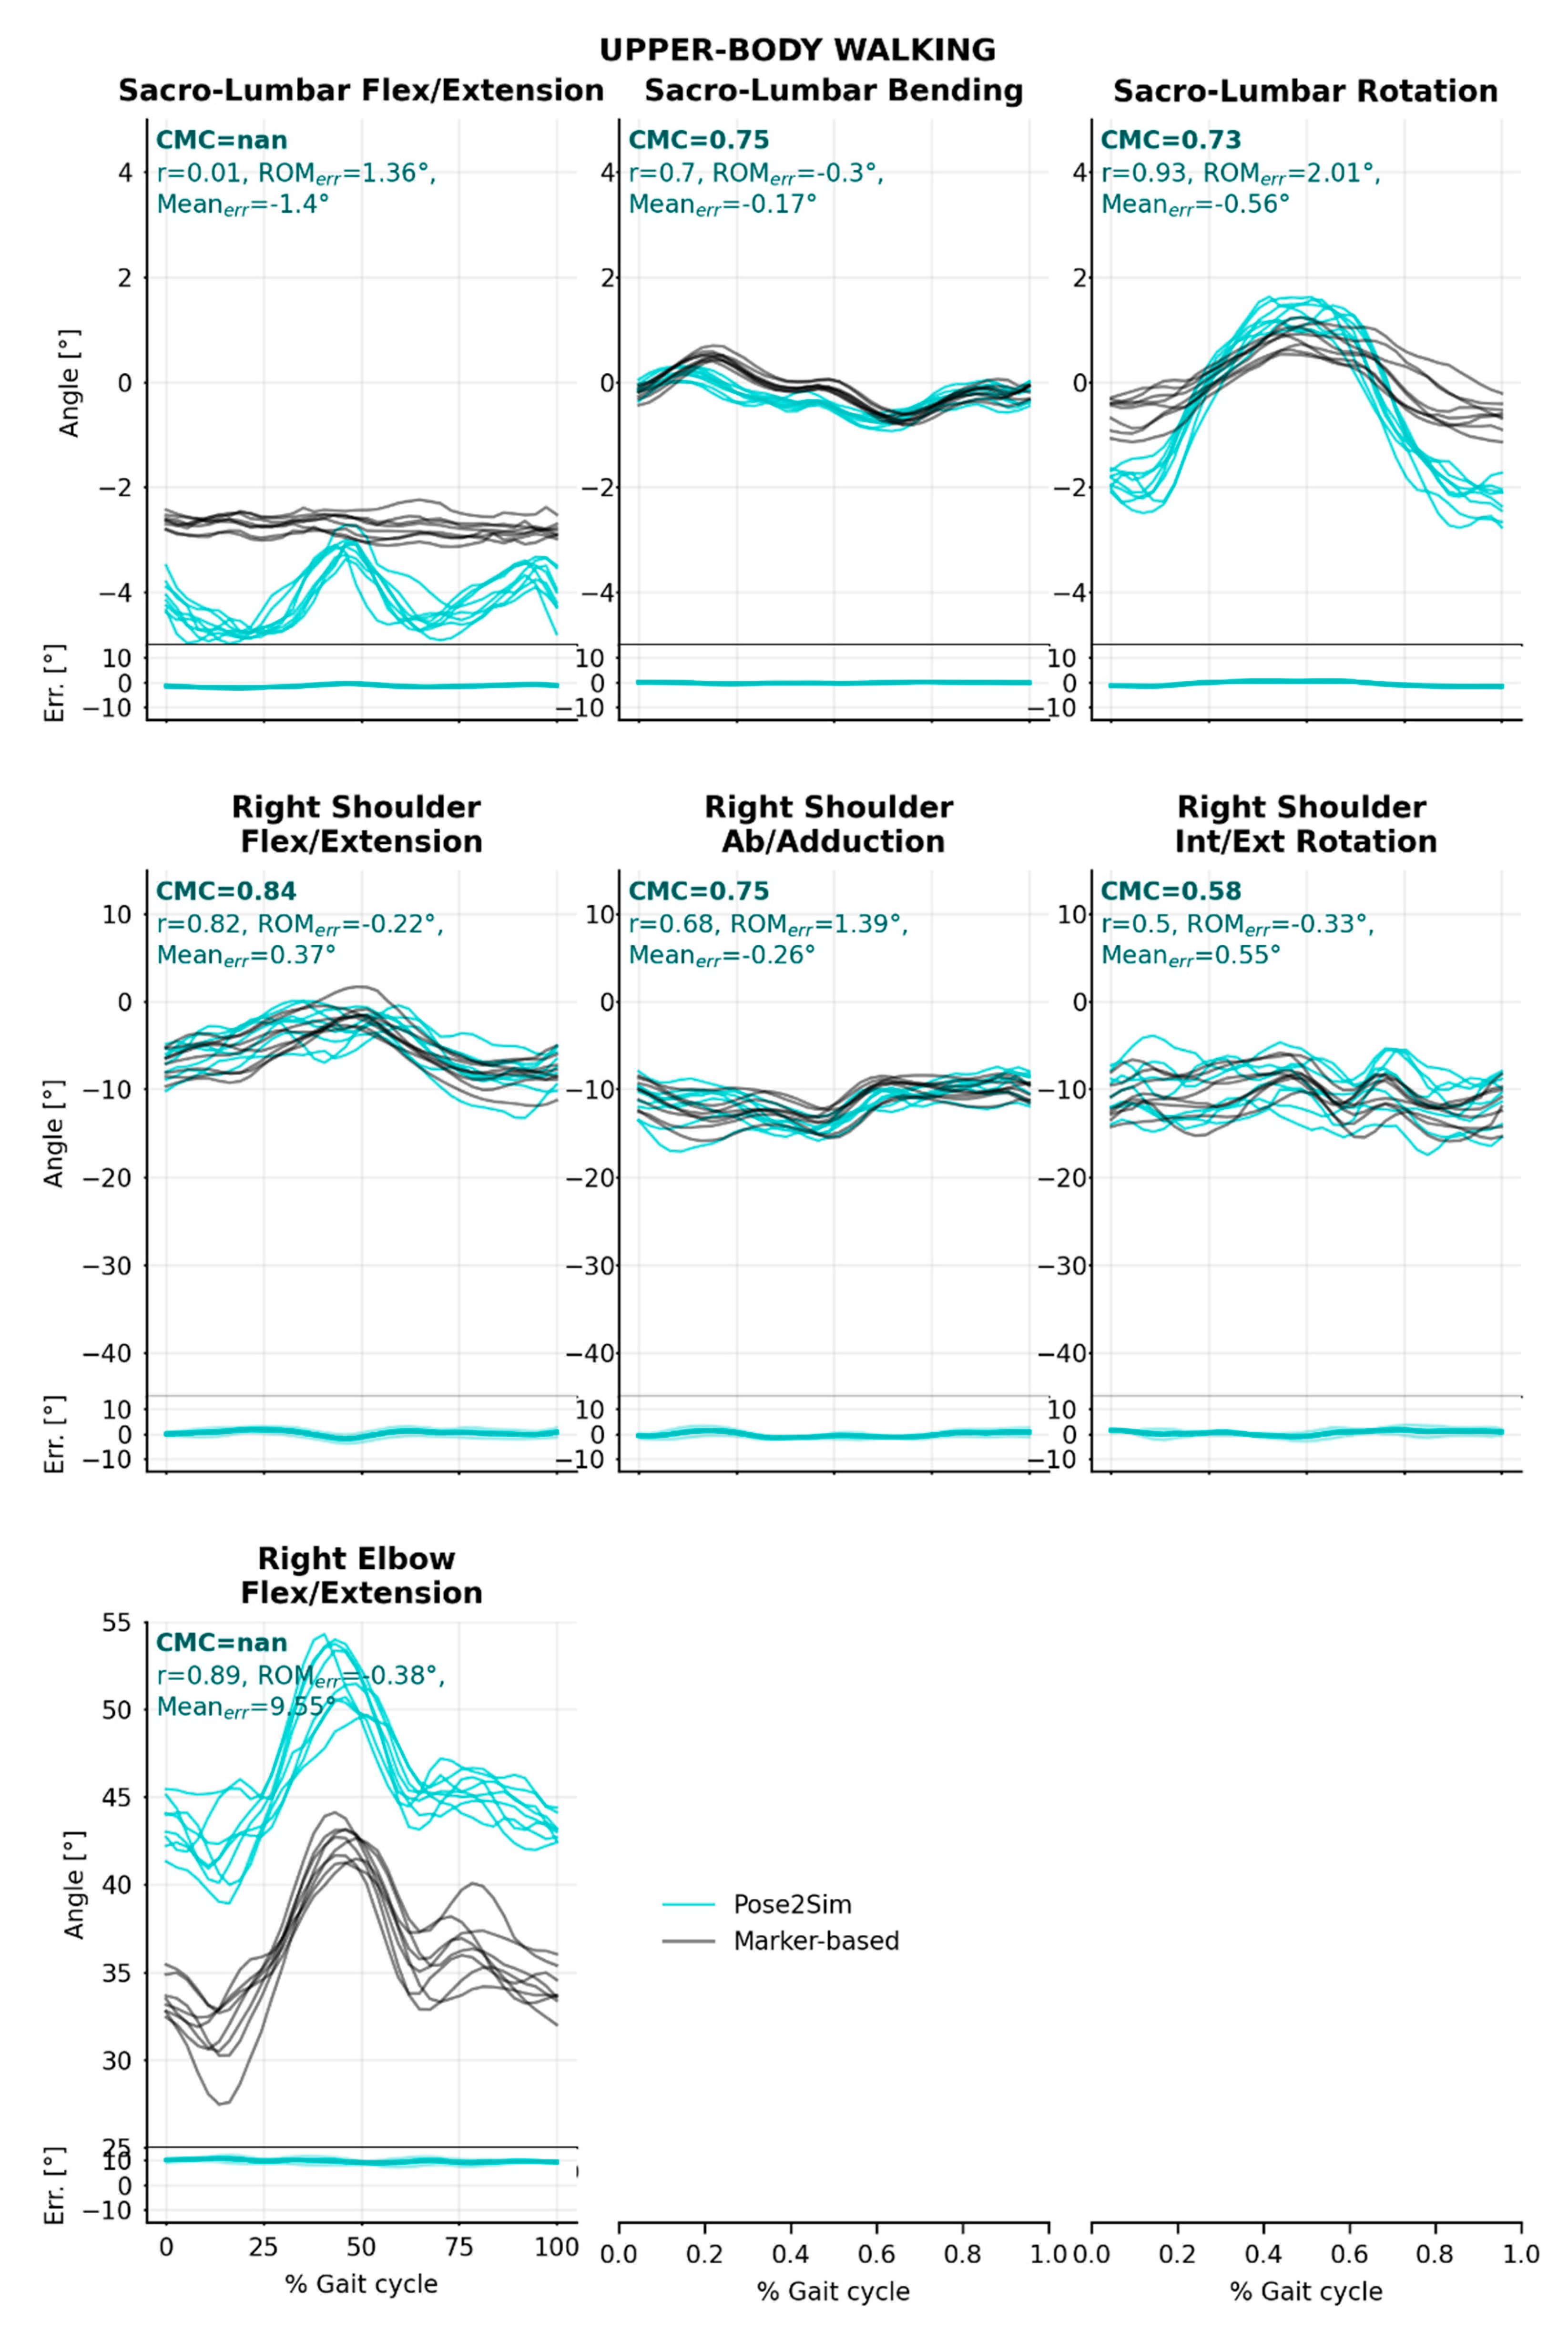
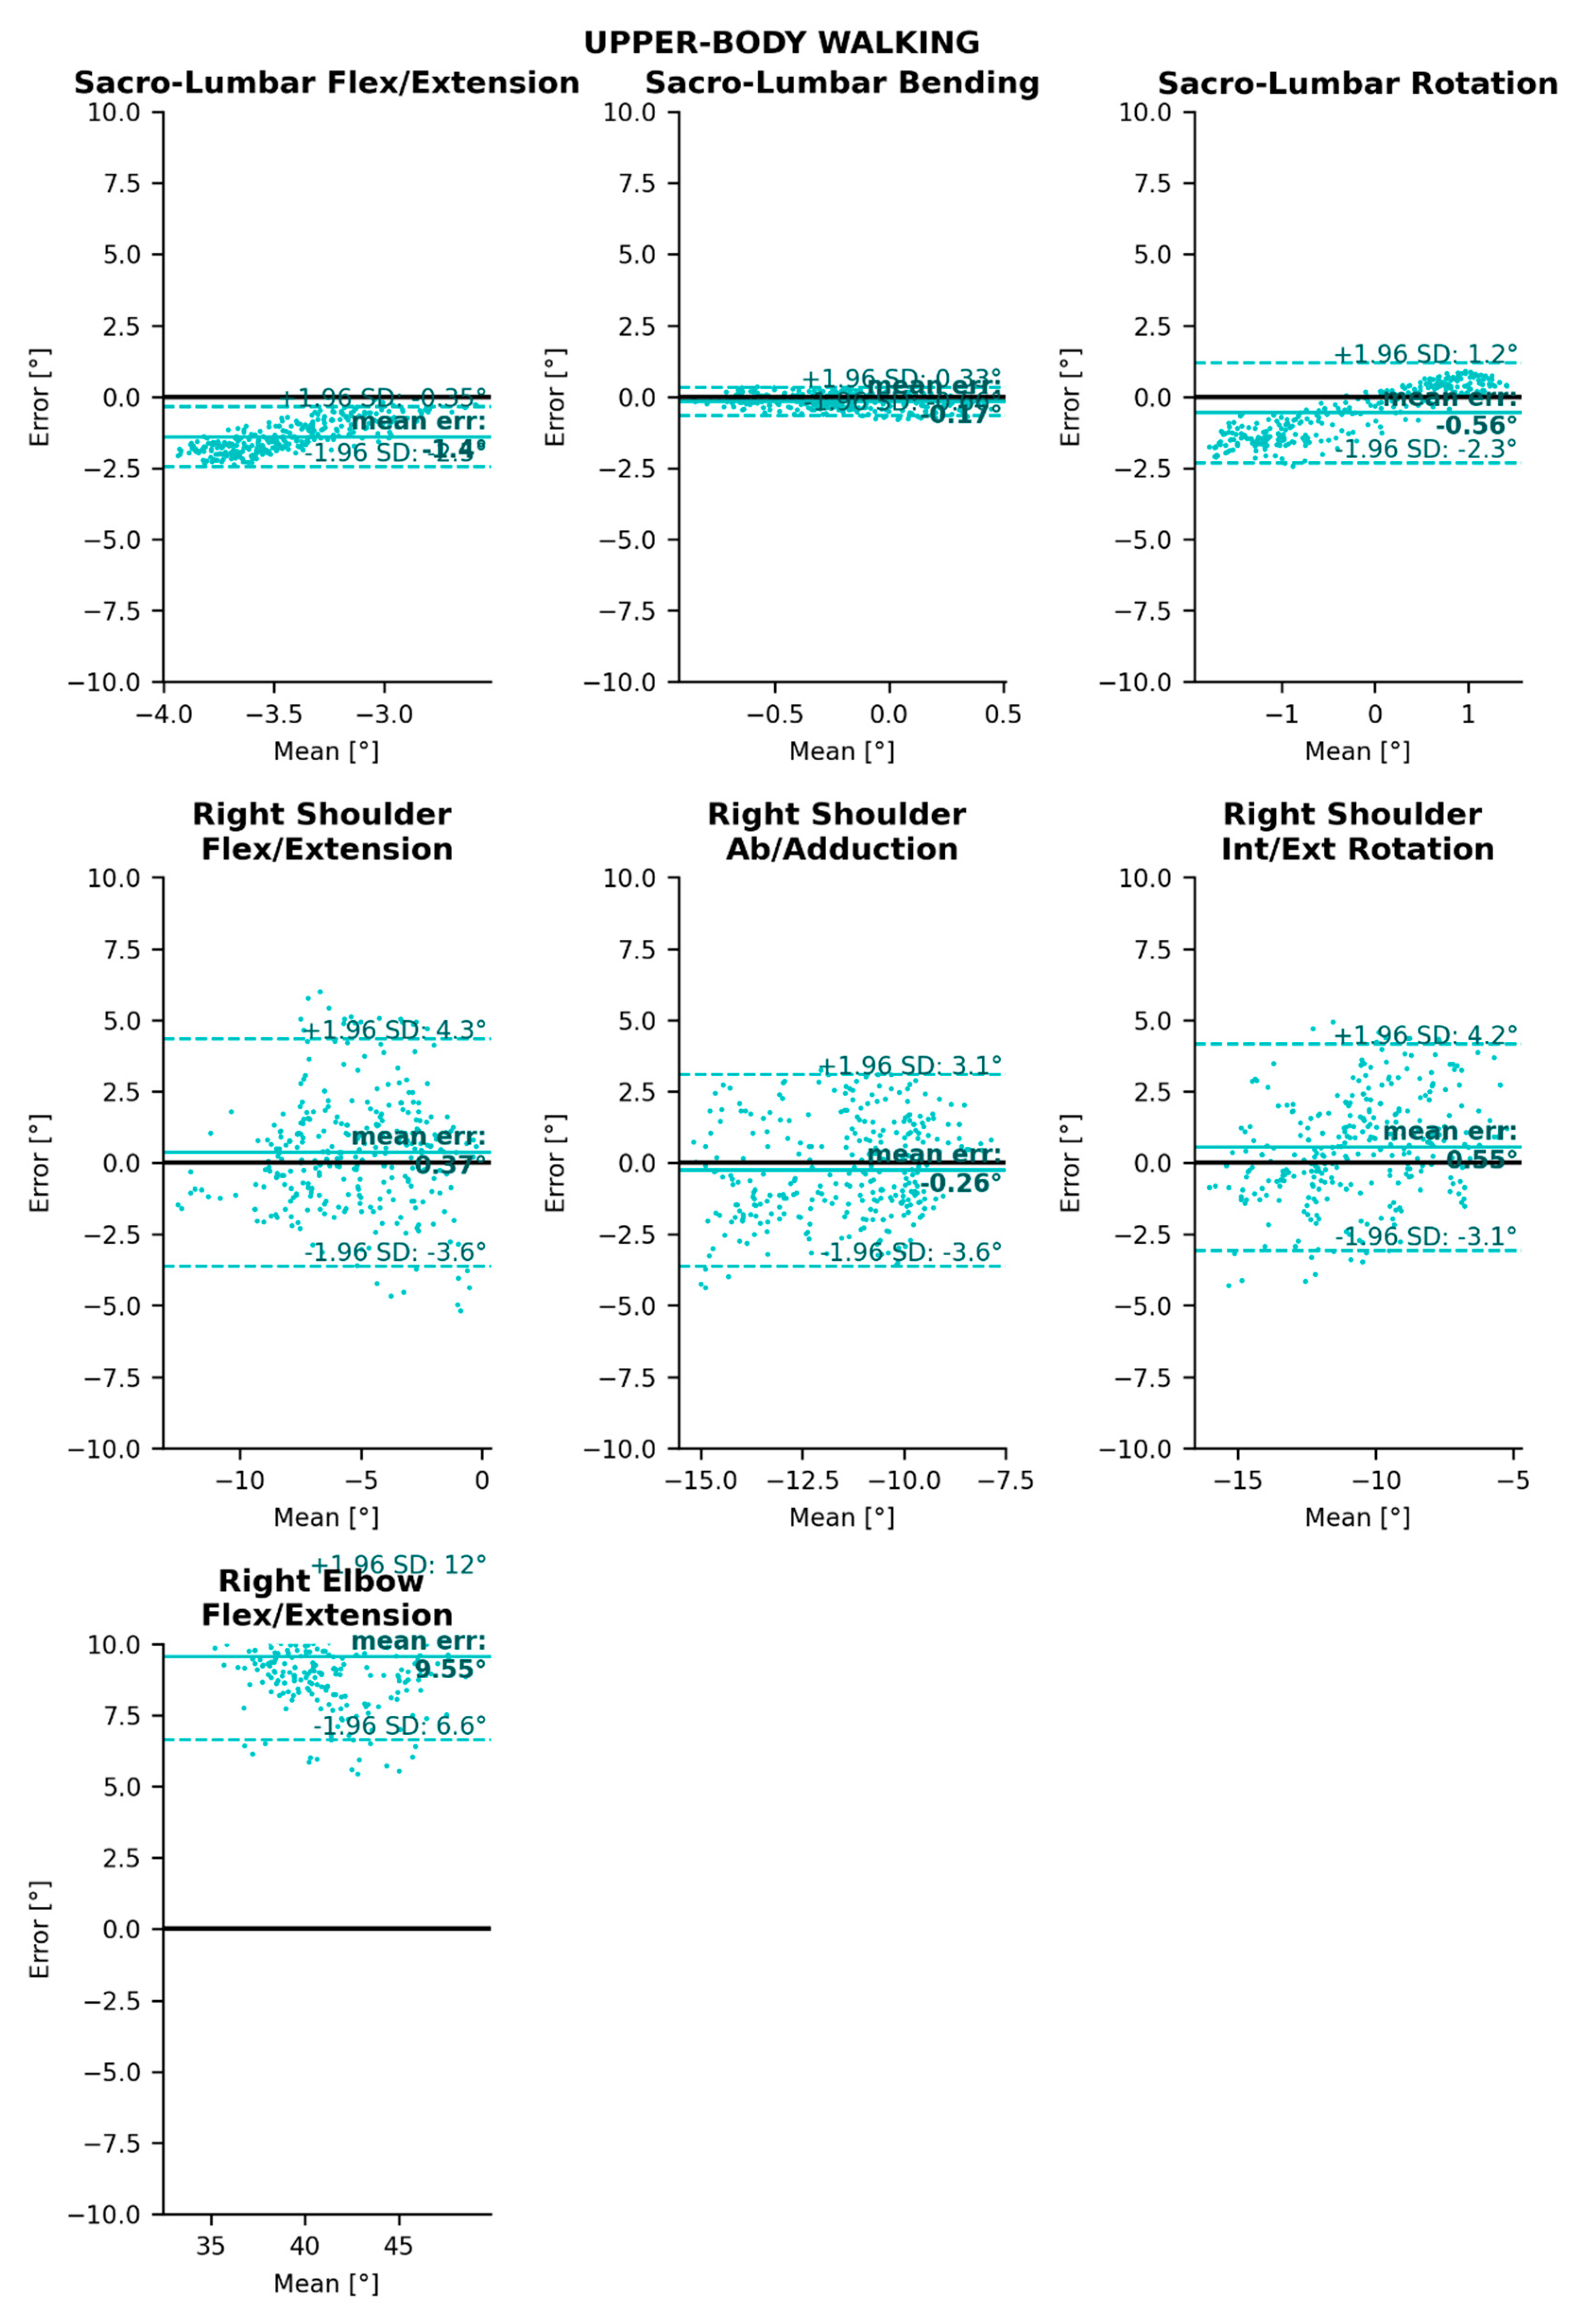
Appendix A.1. Sacro-Lumbar and Upper-Body Angle Comparisons and Bland–Altman Analysis in the Walking Task


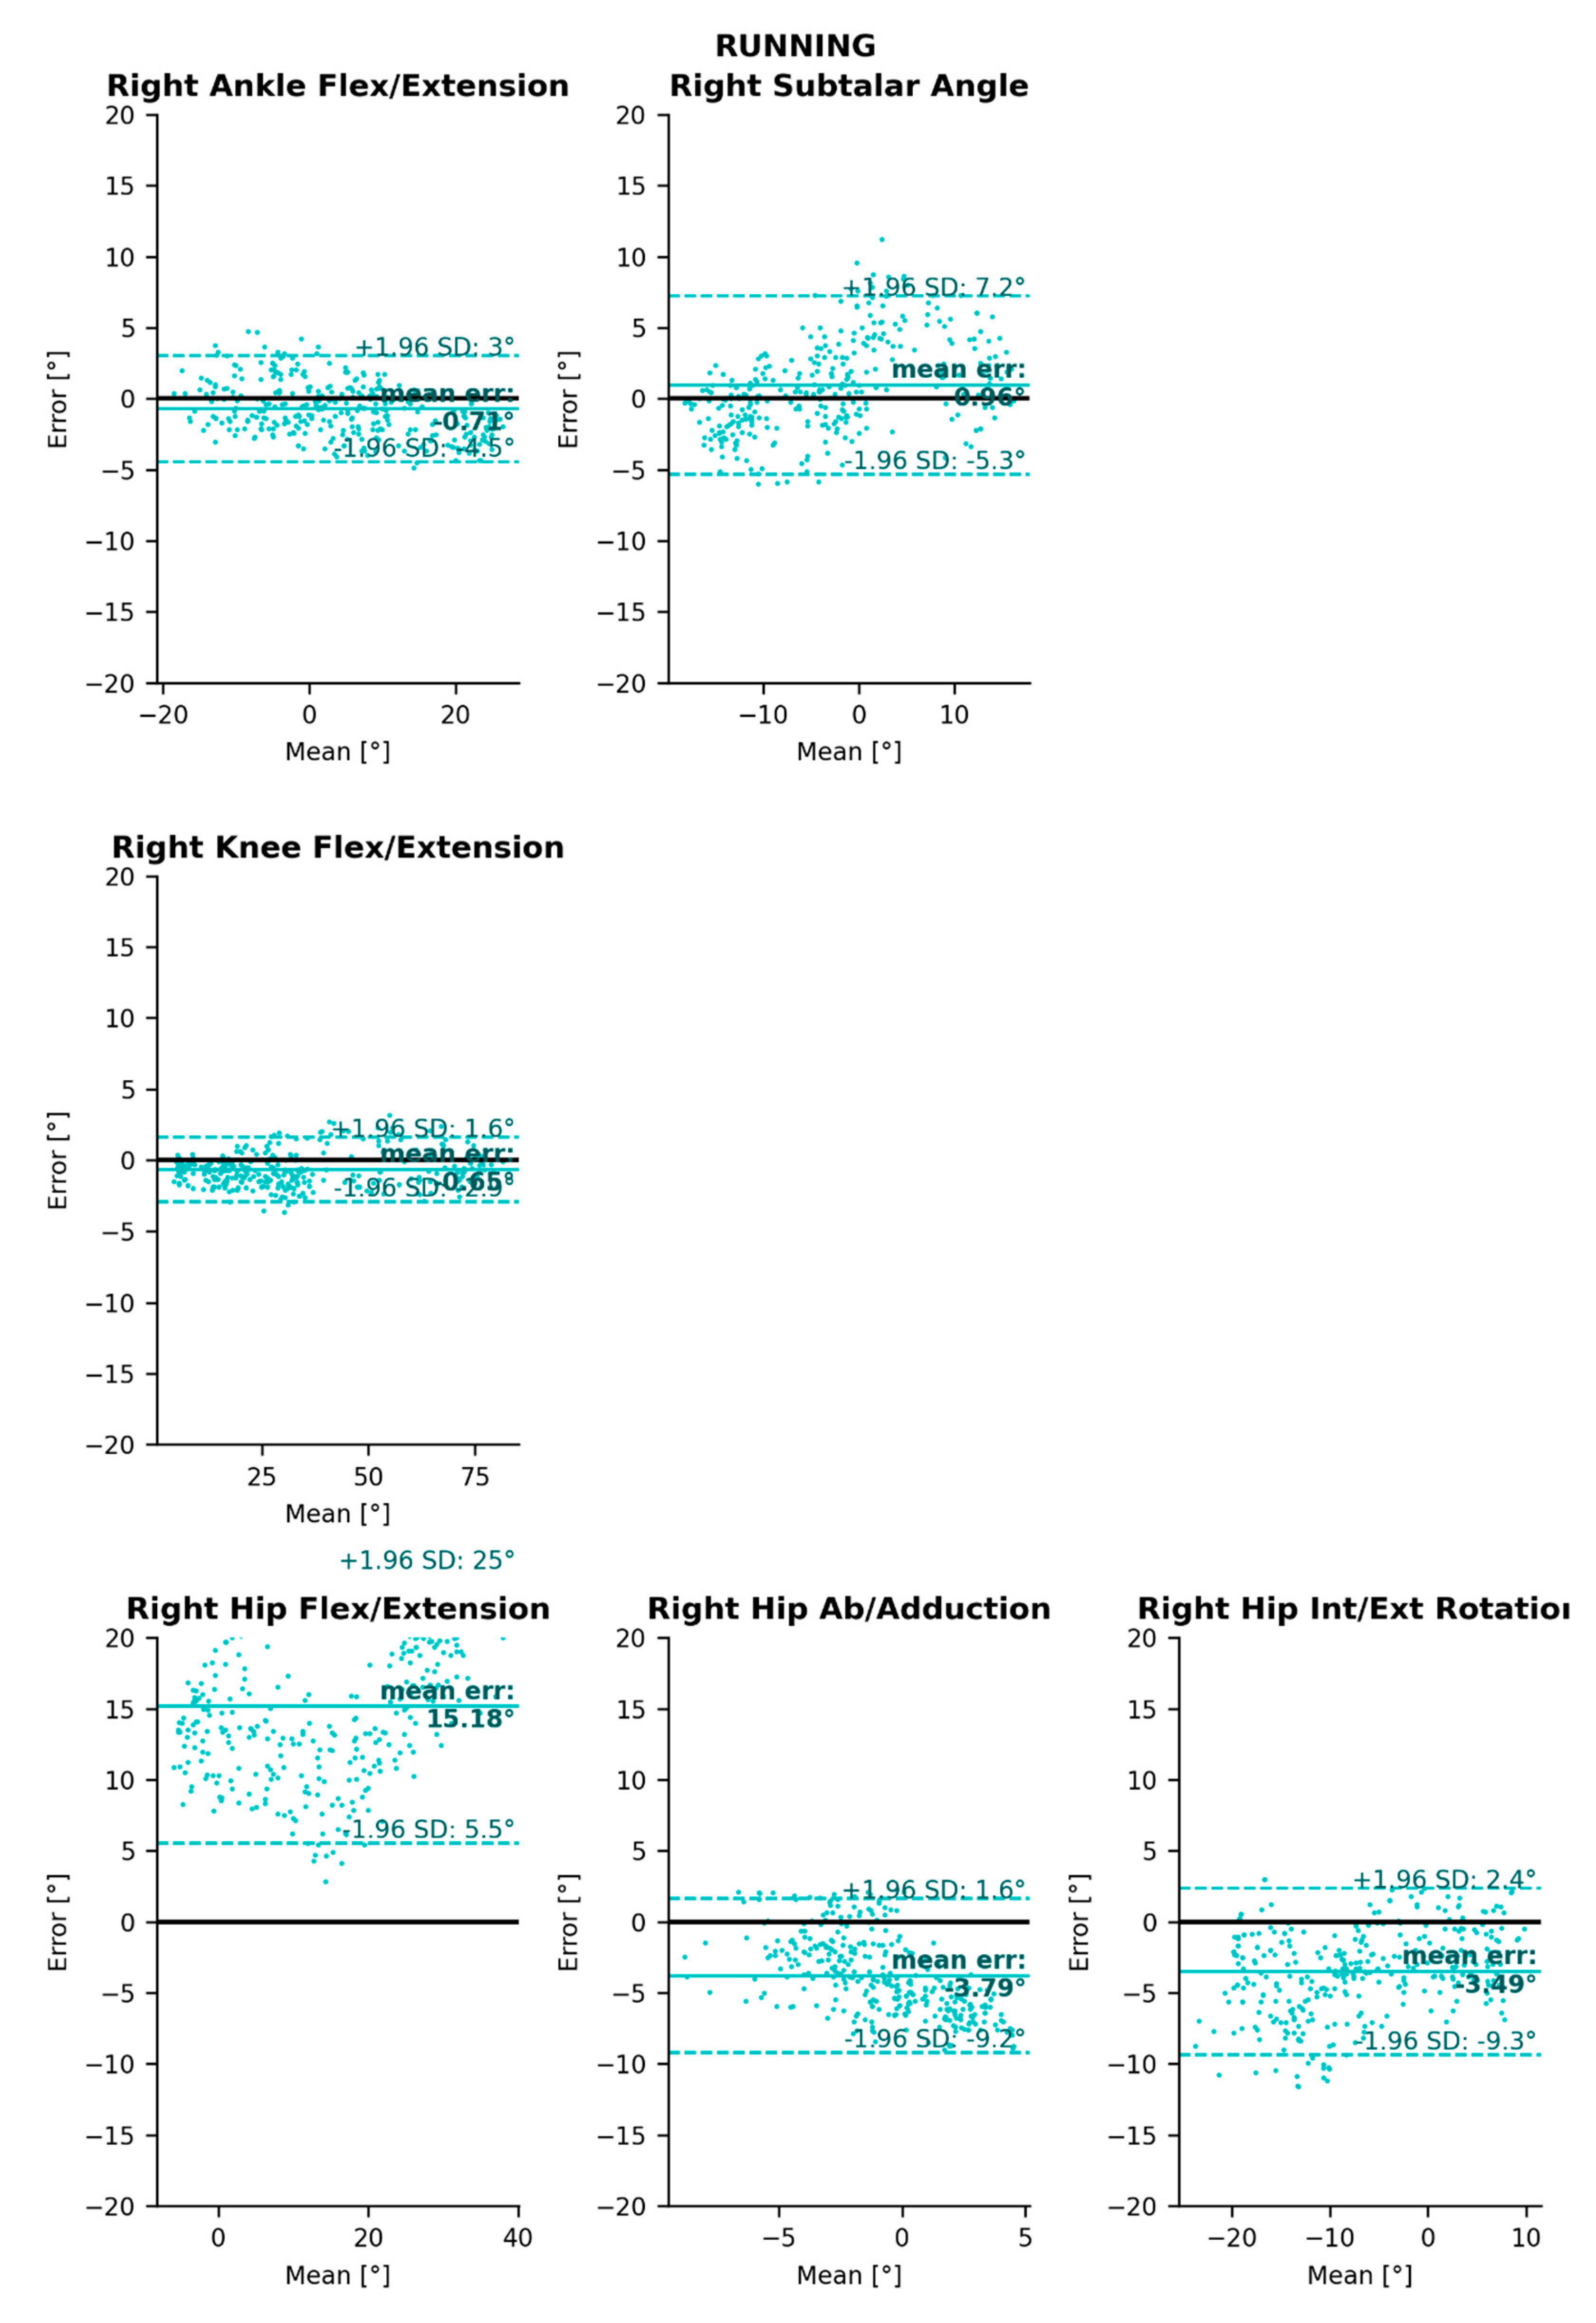
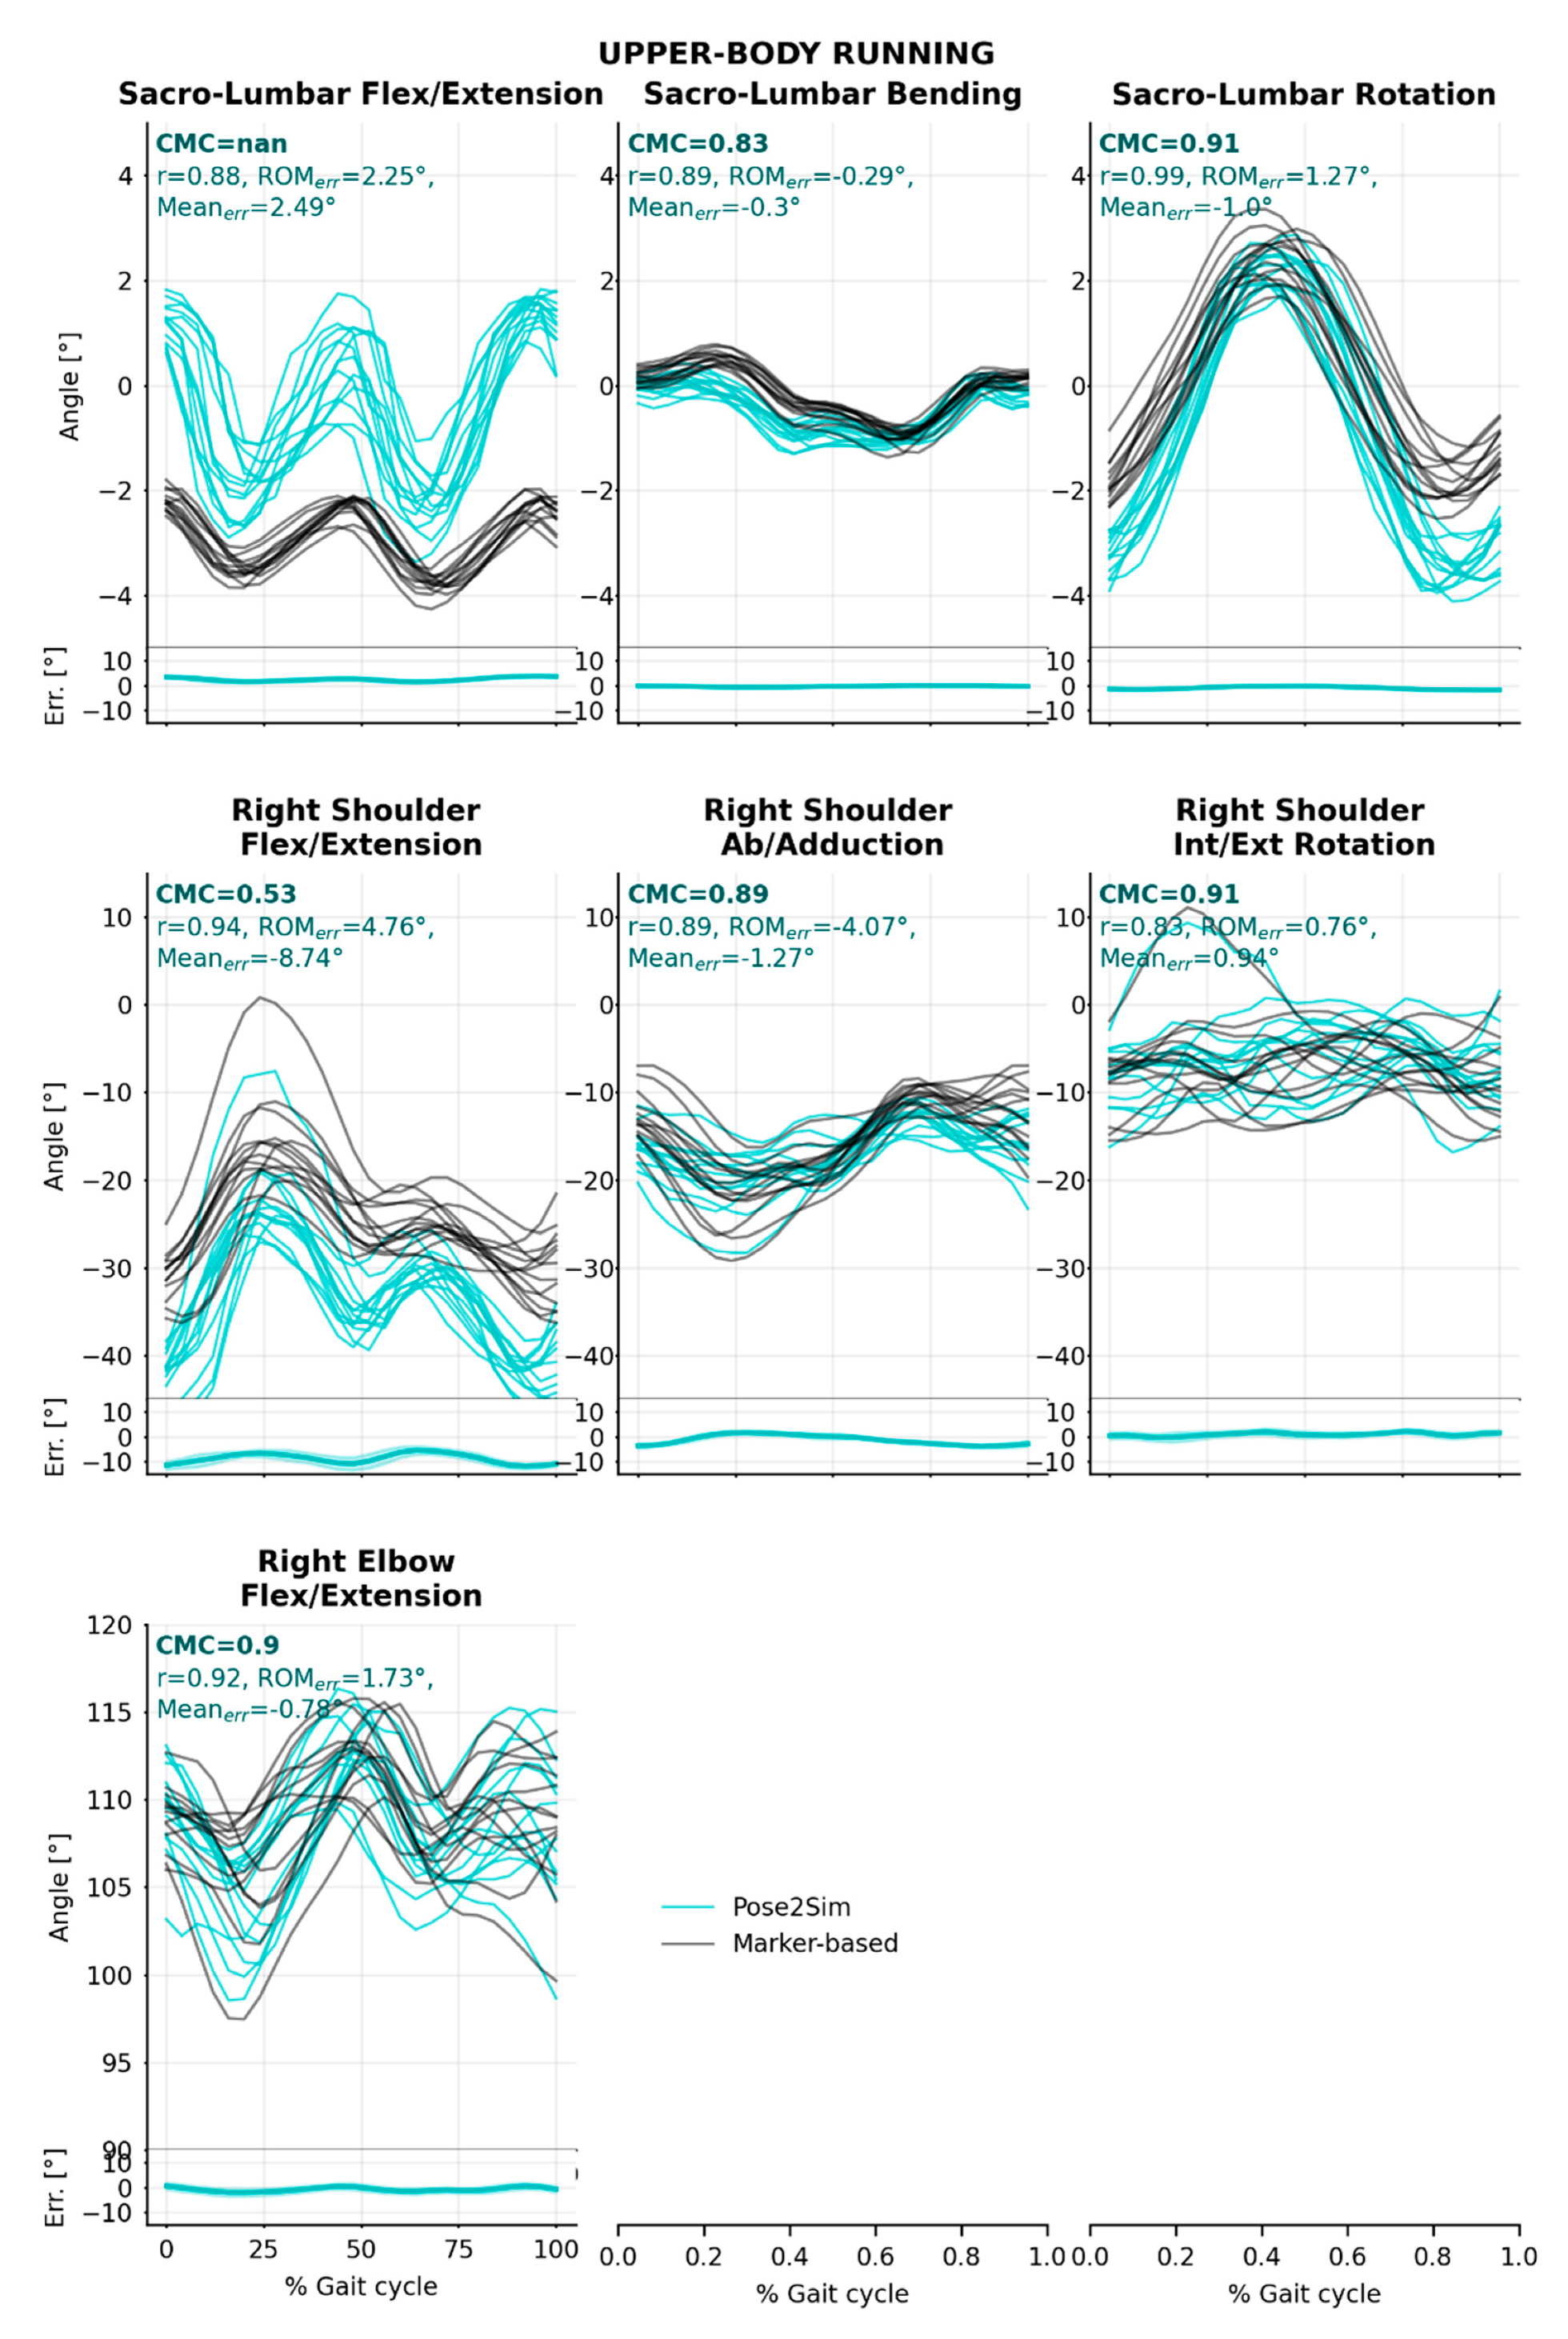
Appendix A.2. Angle Comparisons and Bland–Altman Analysis in the Running Task


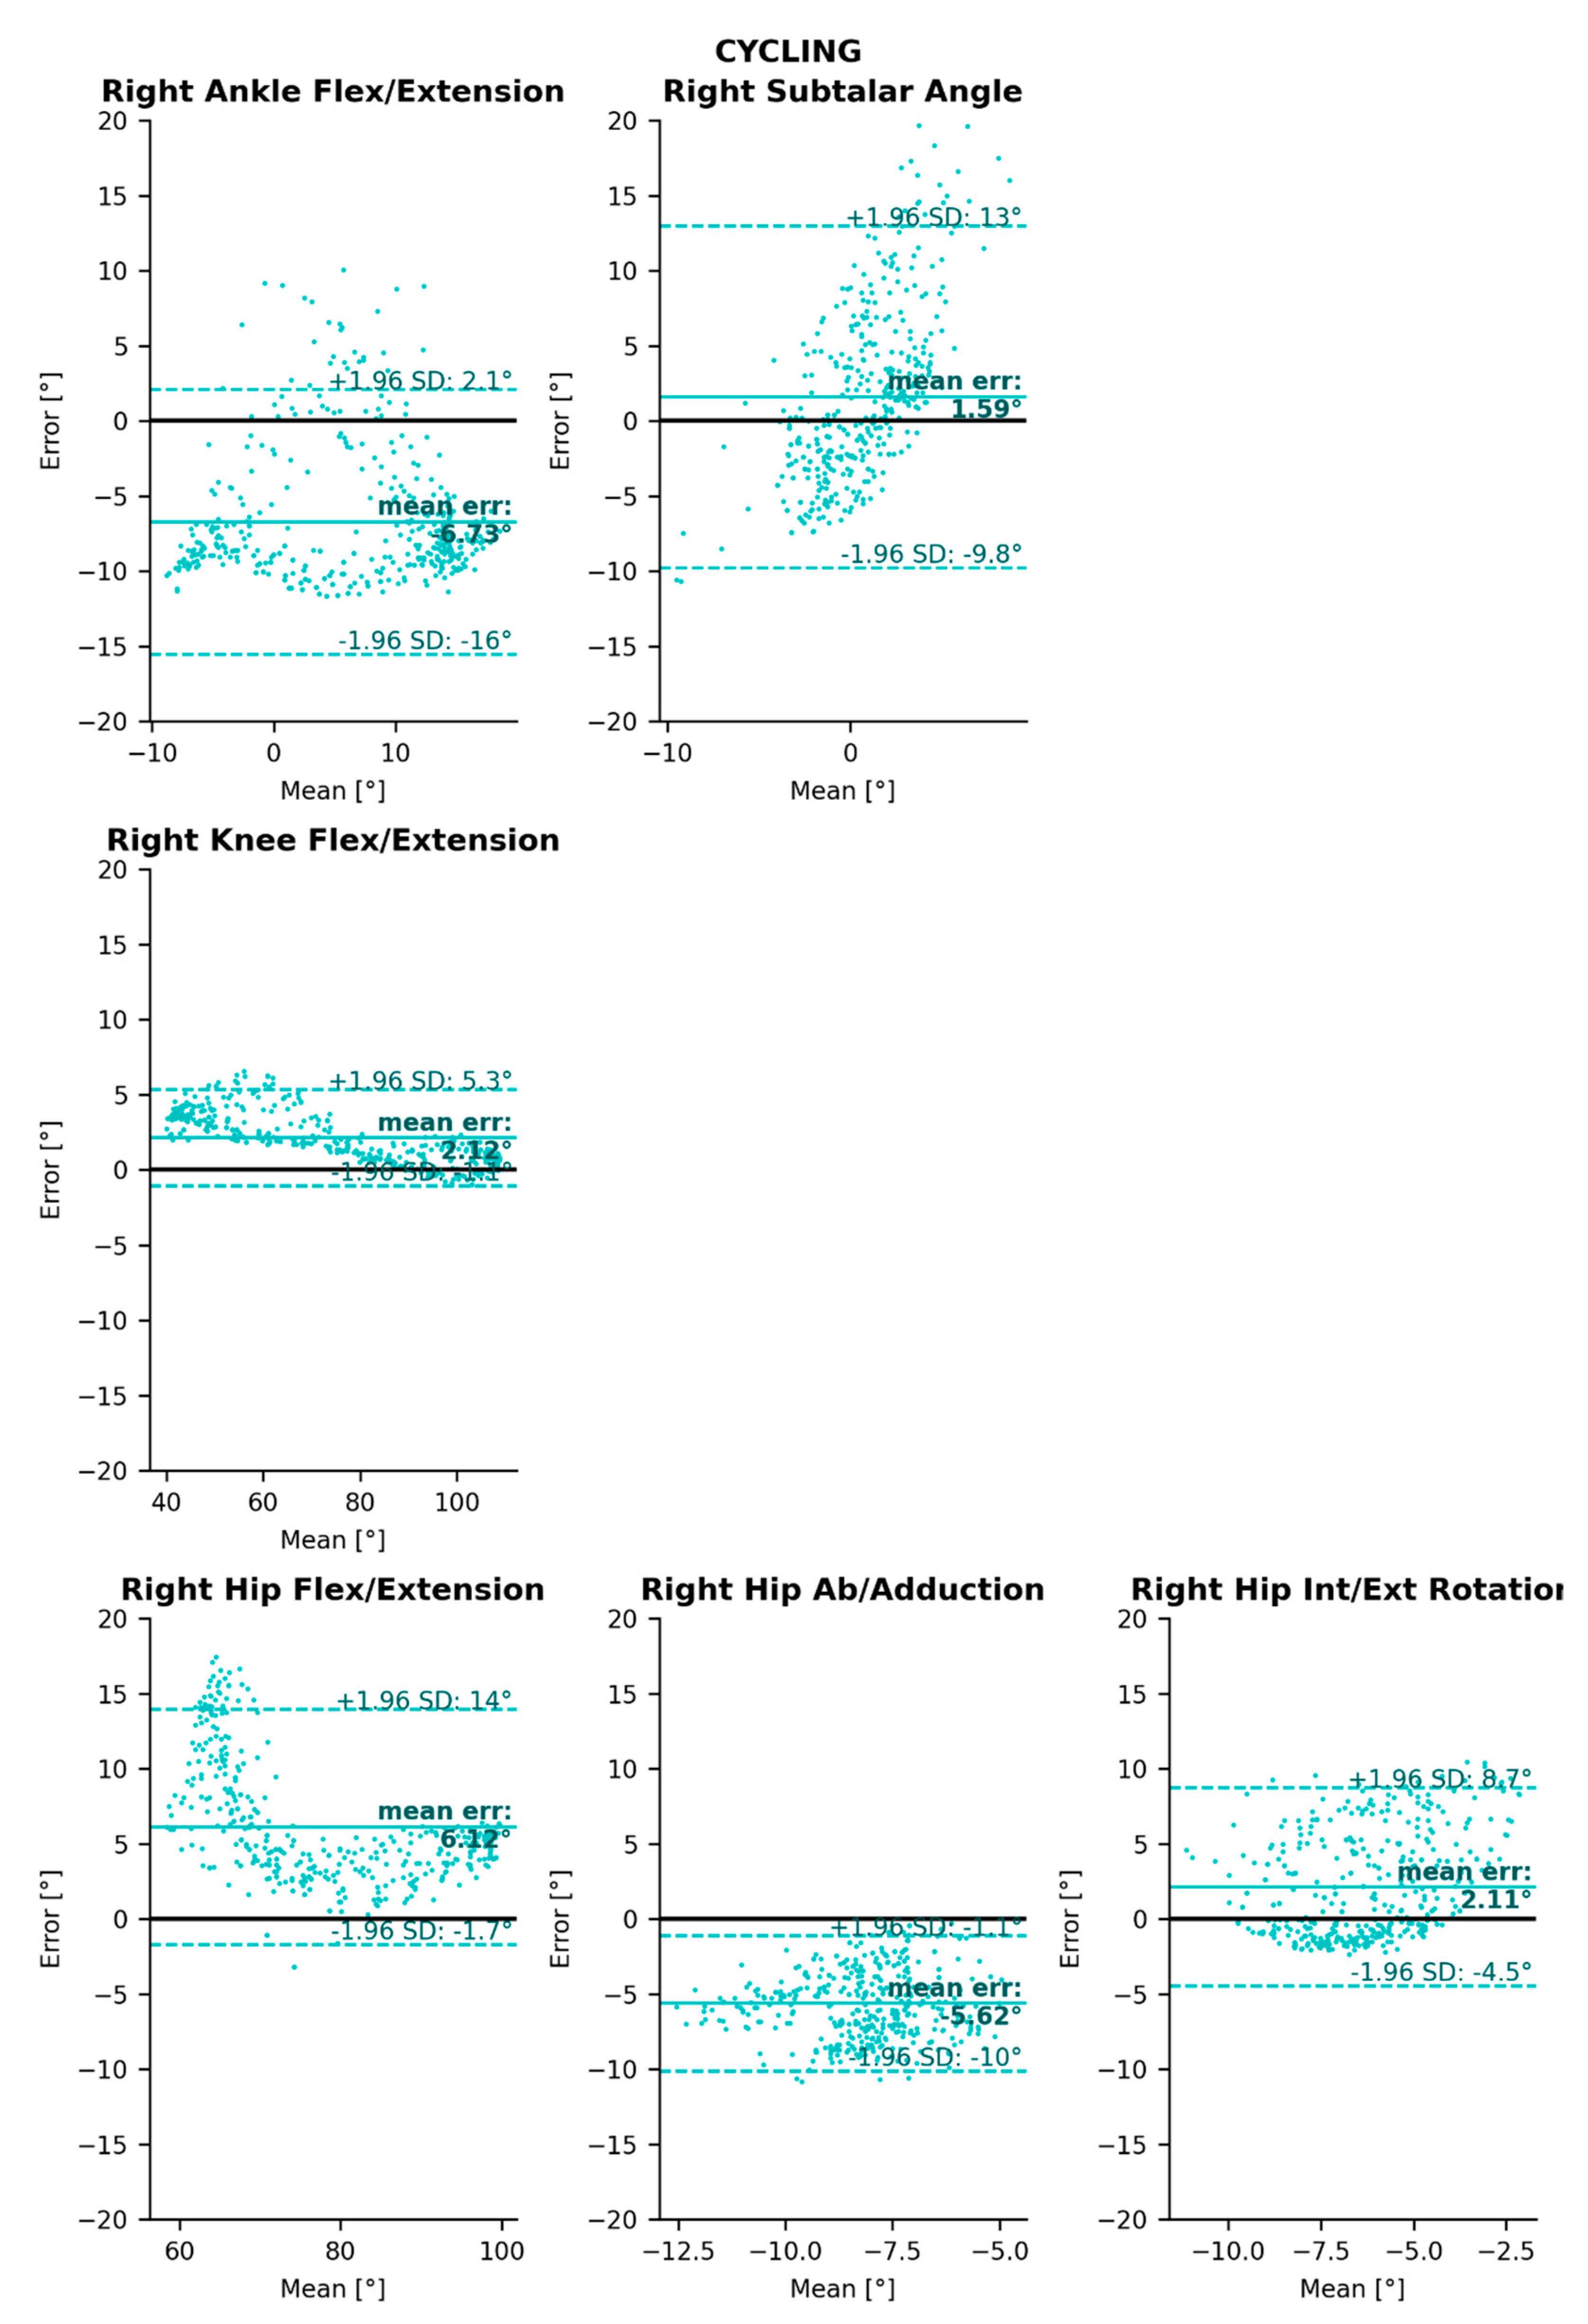
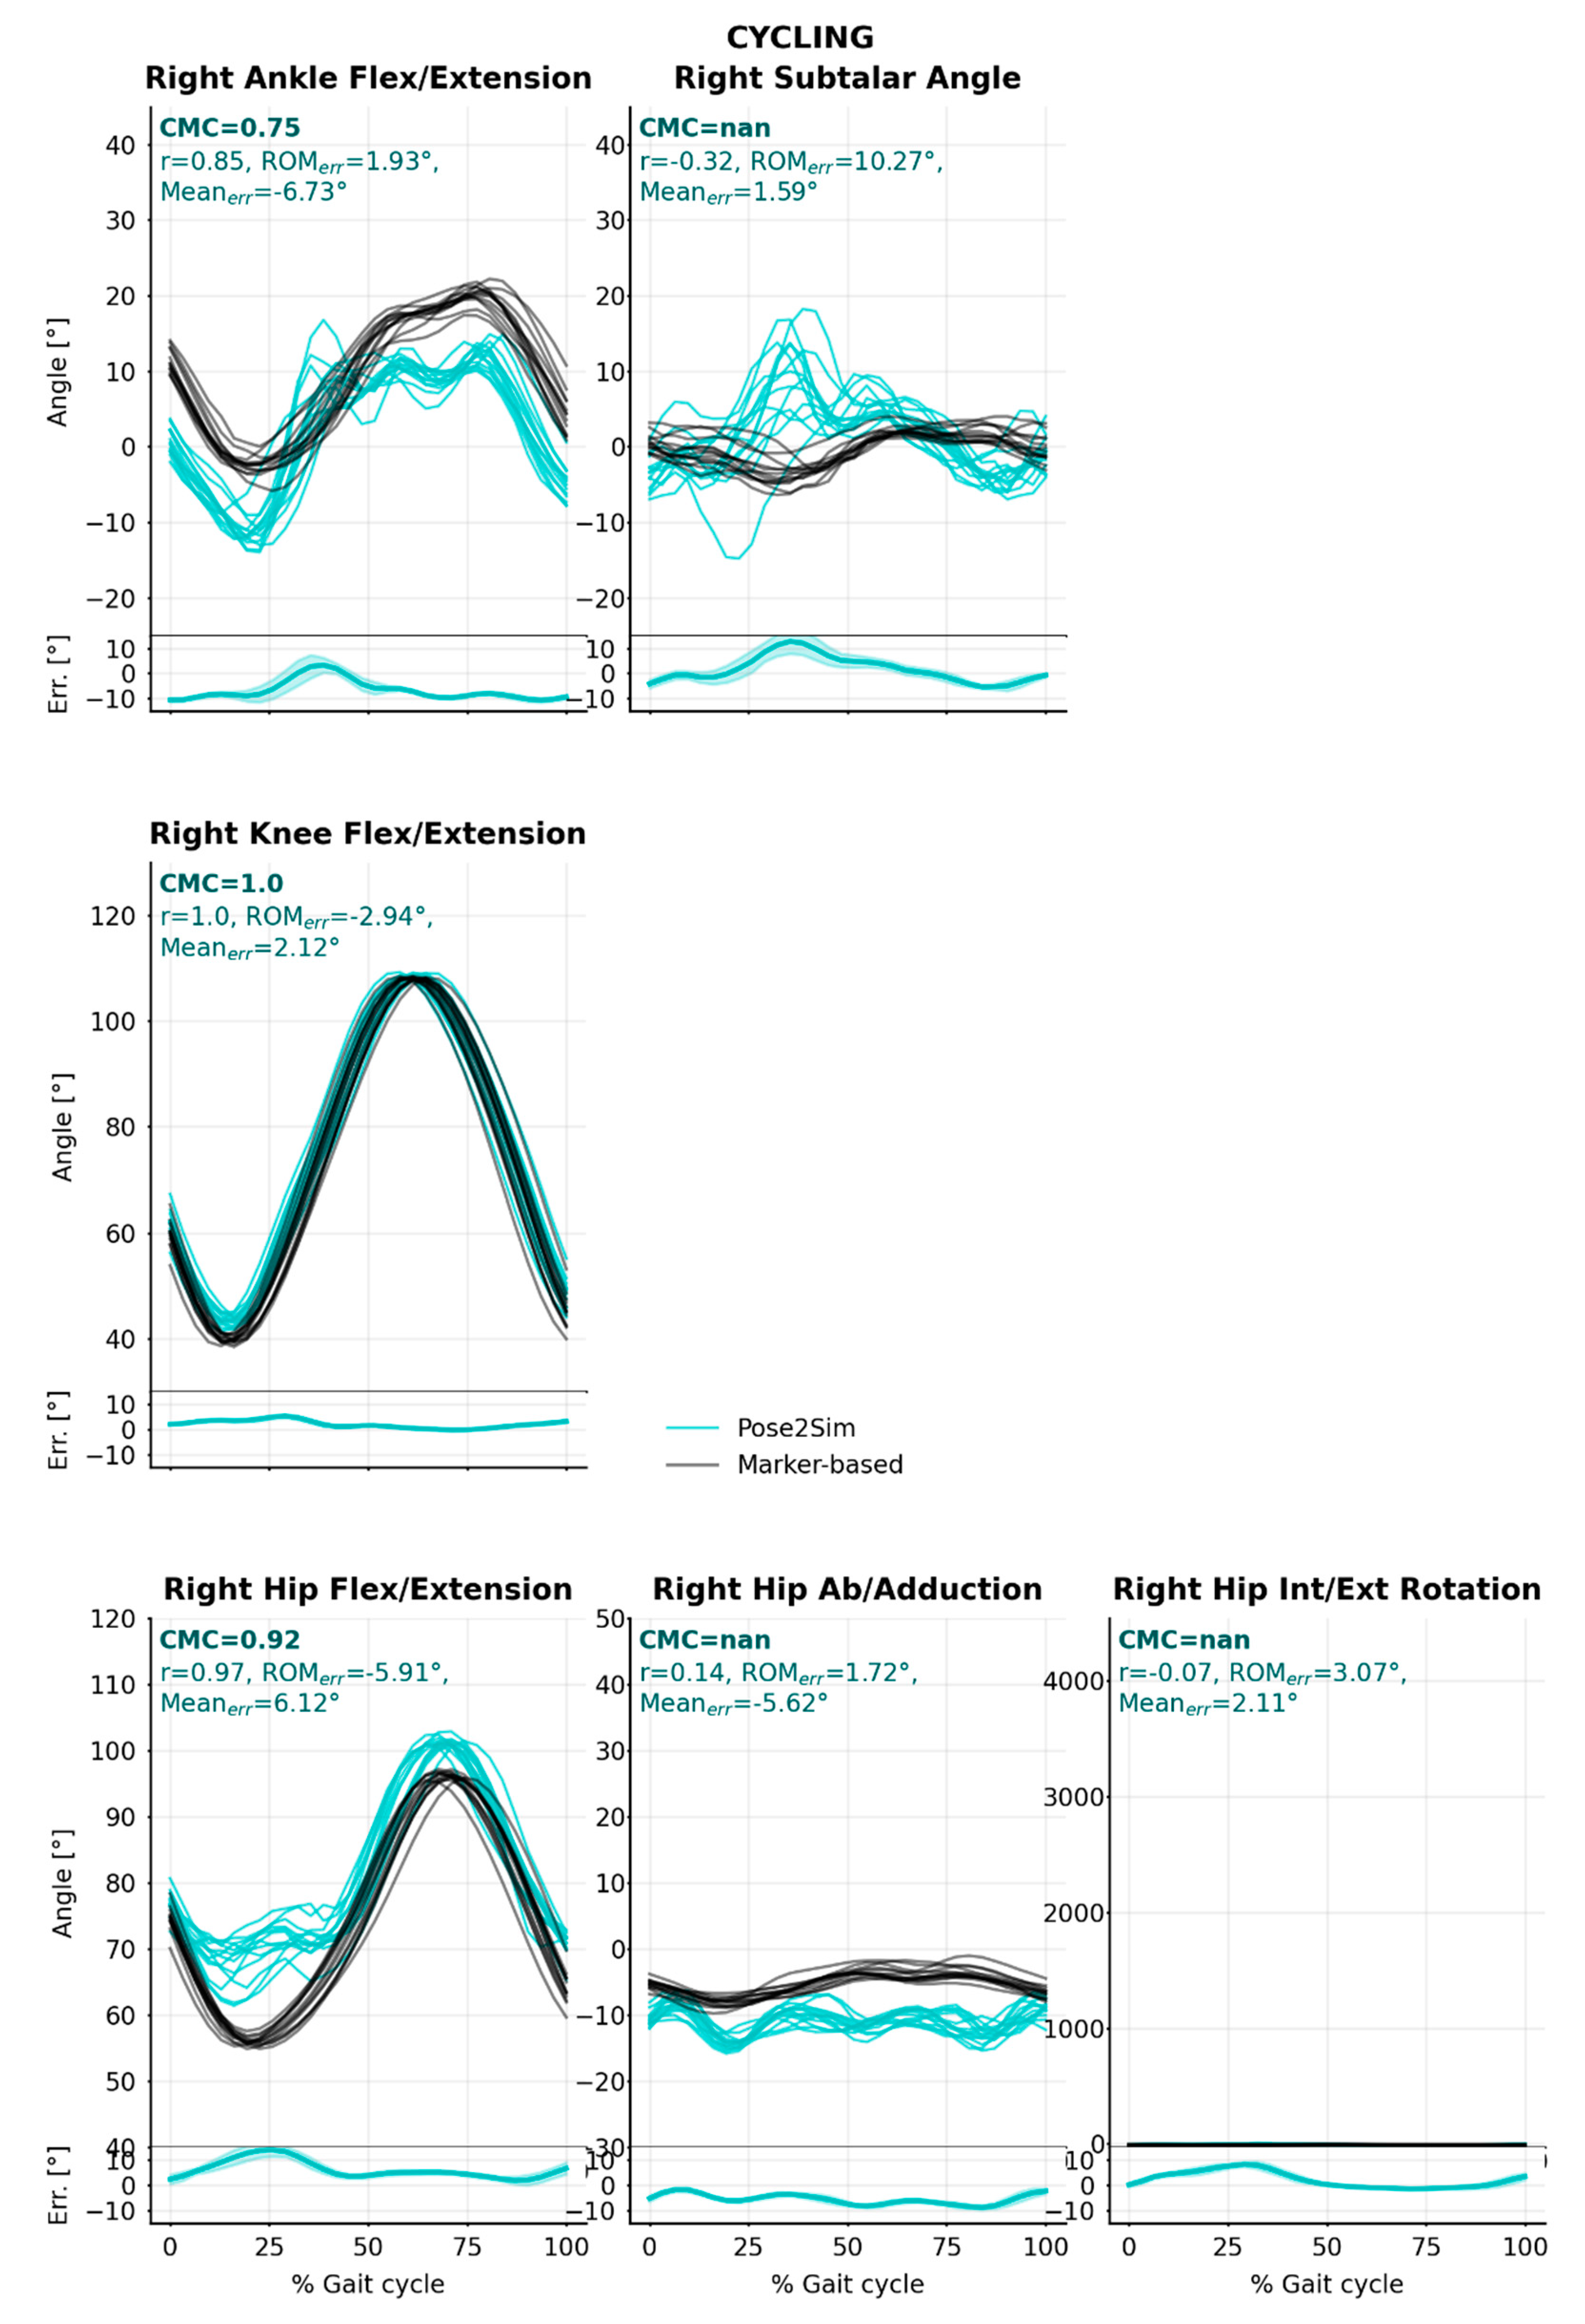
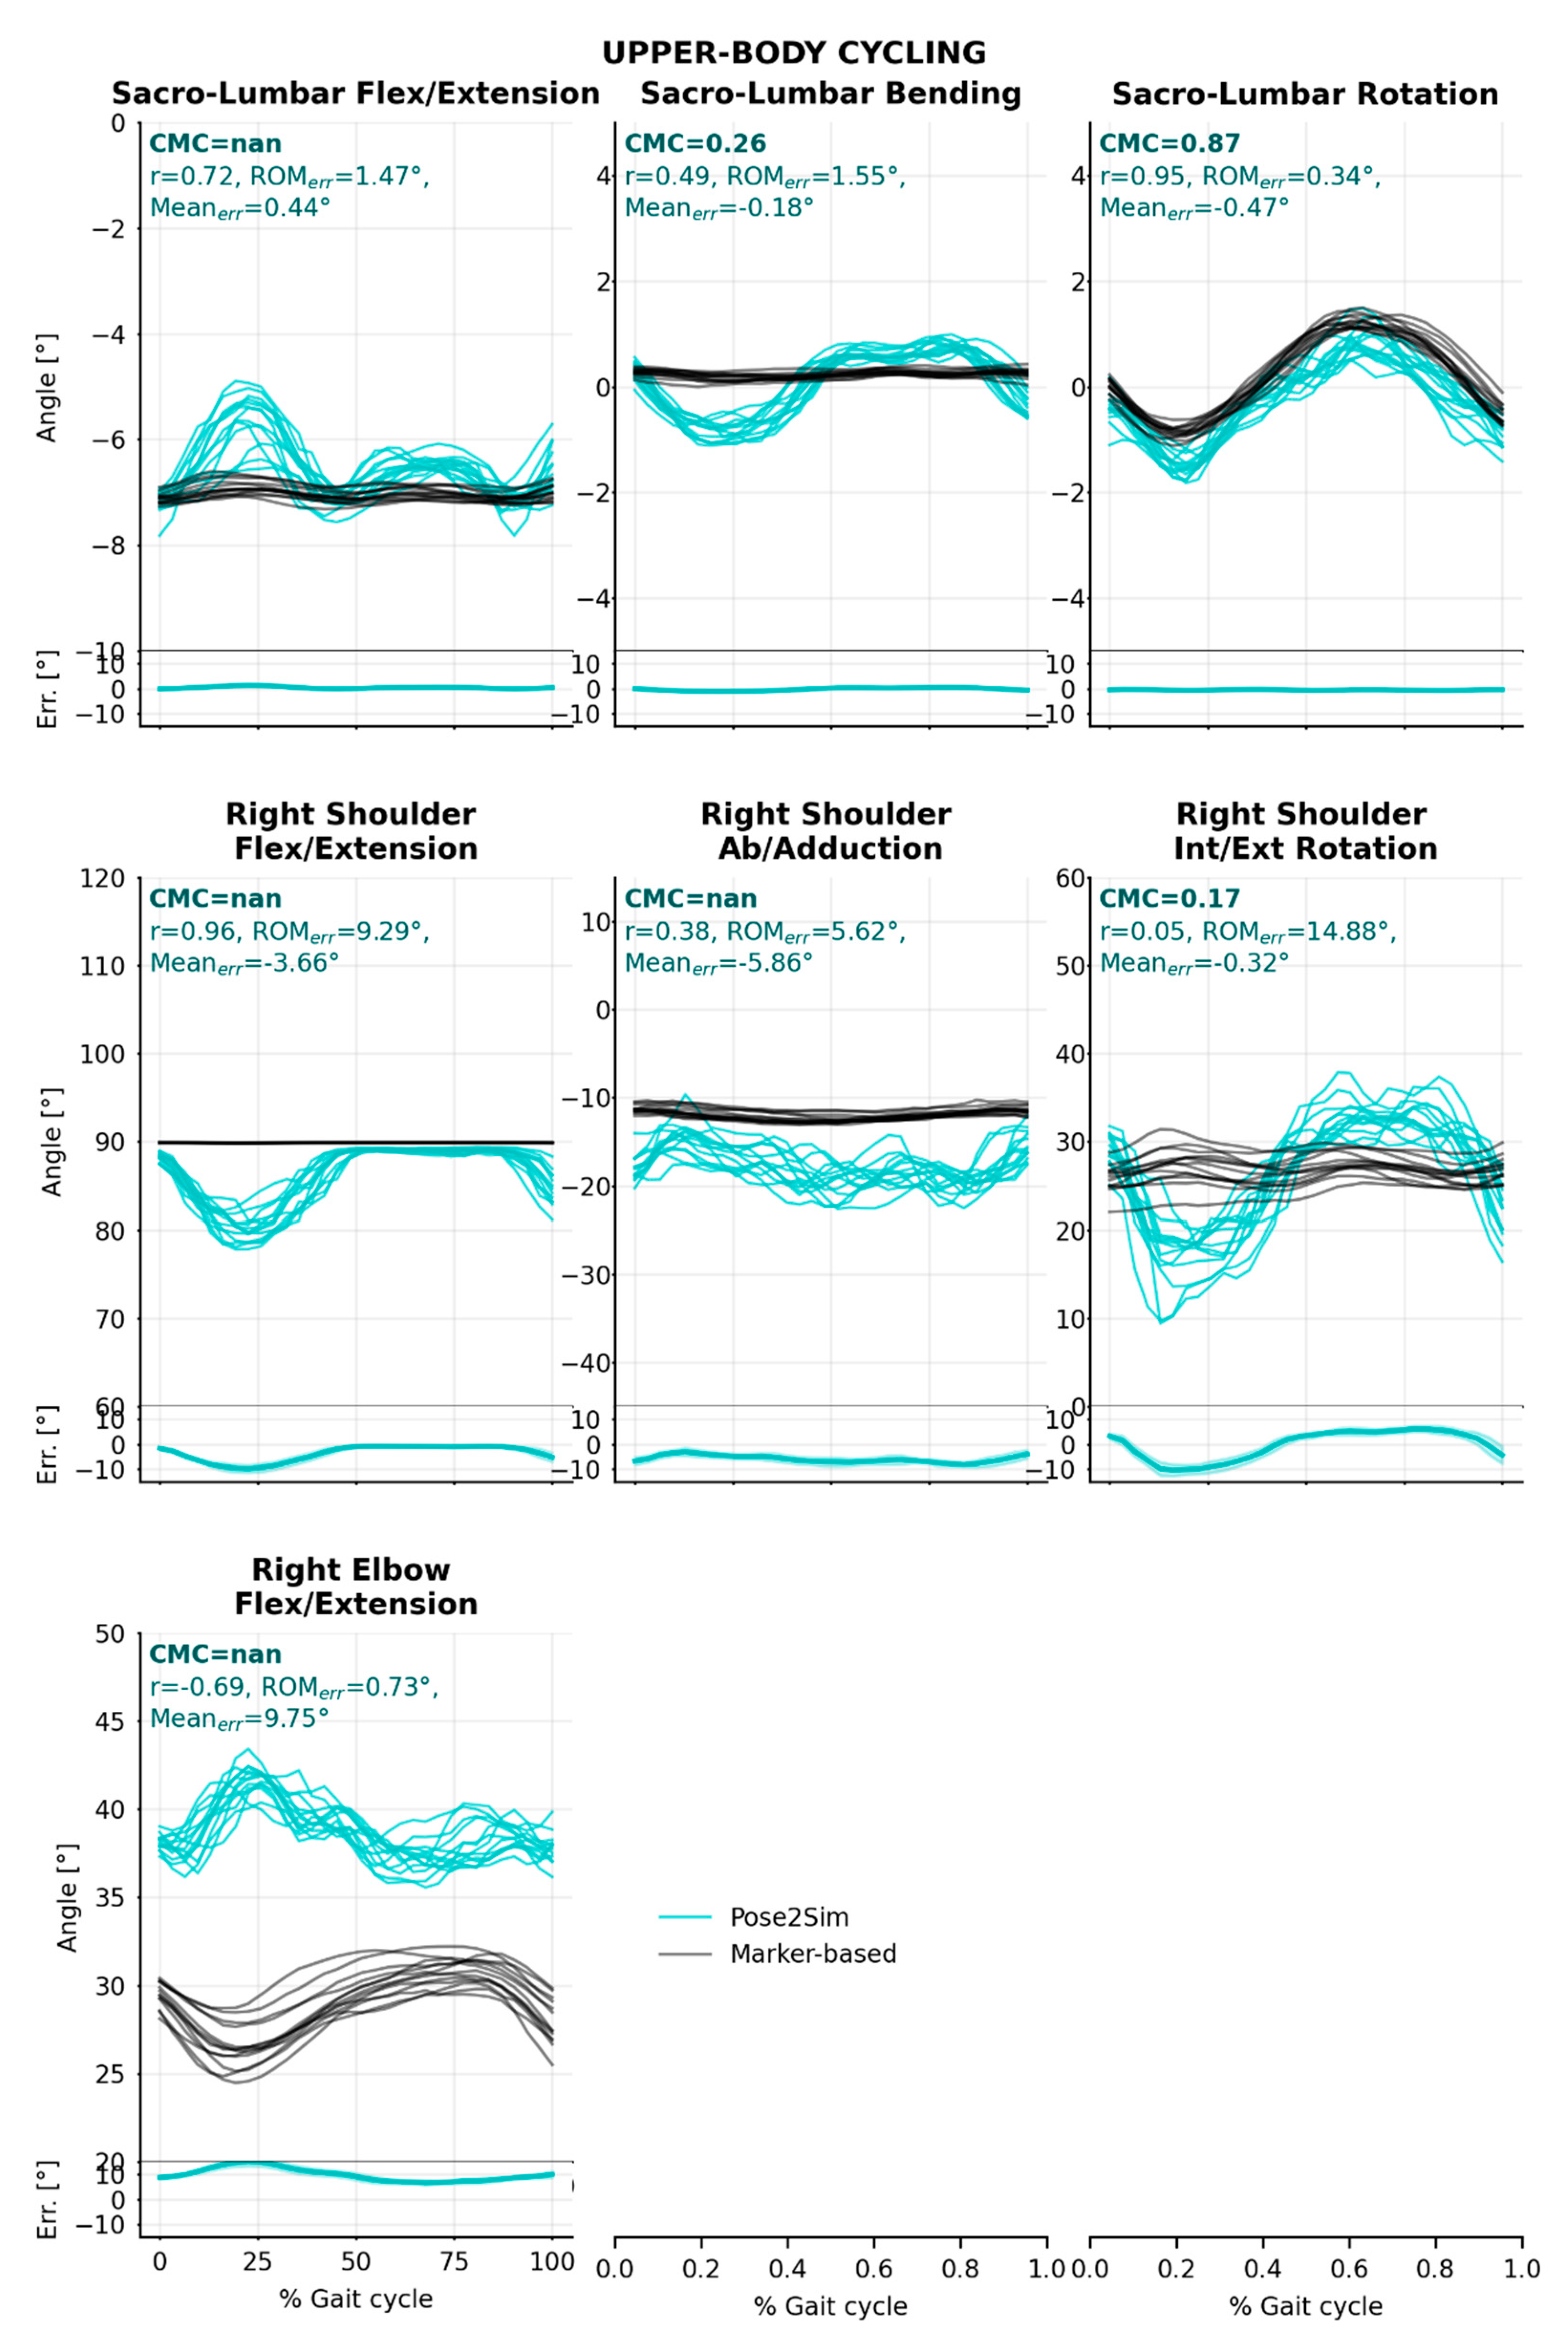
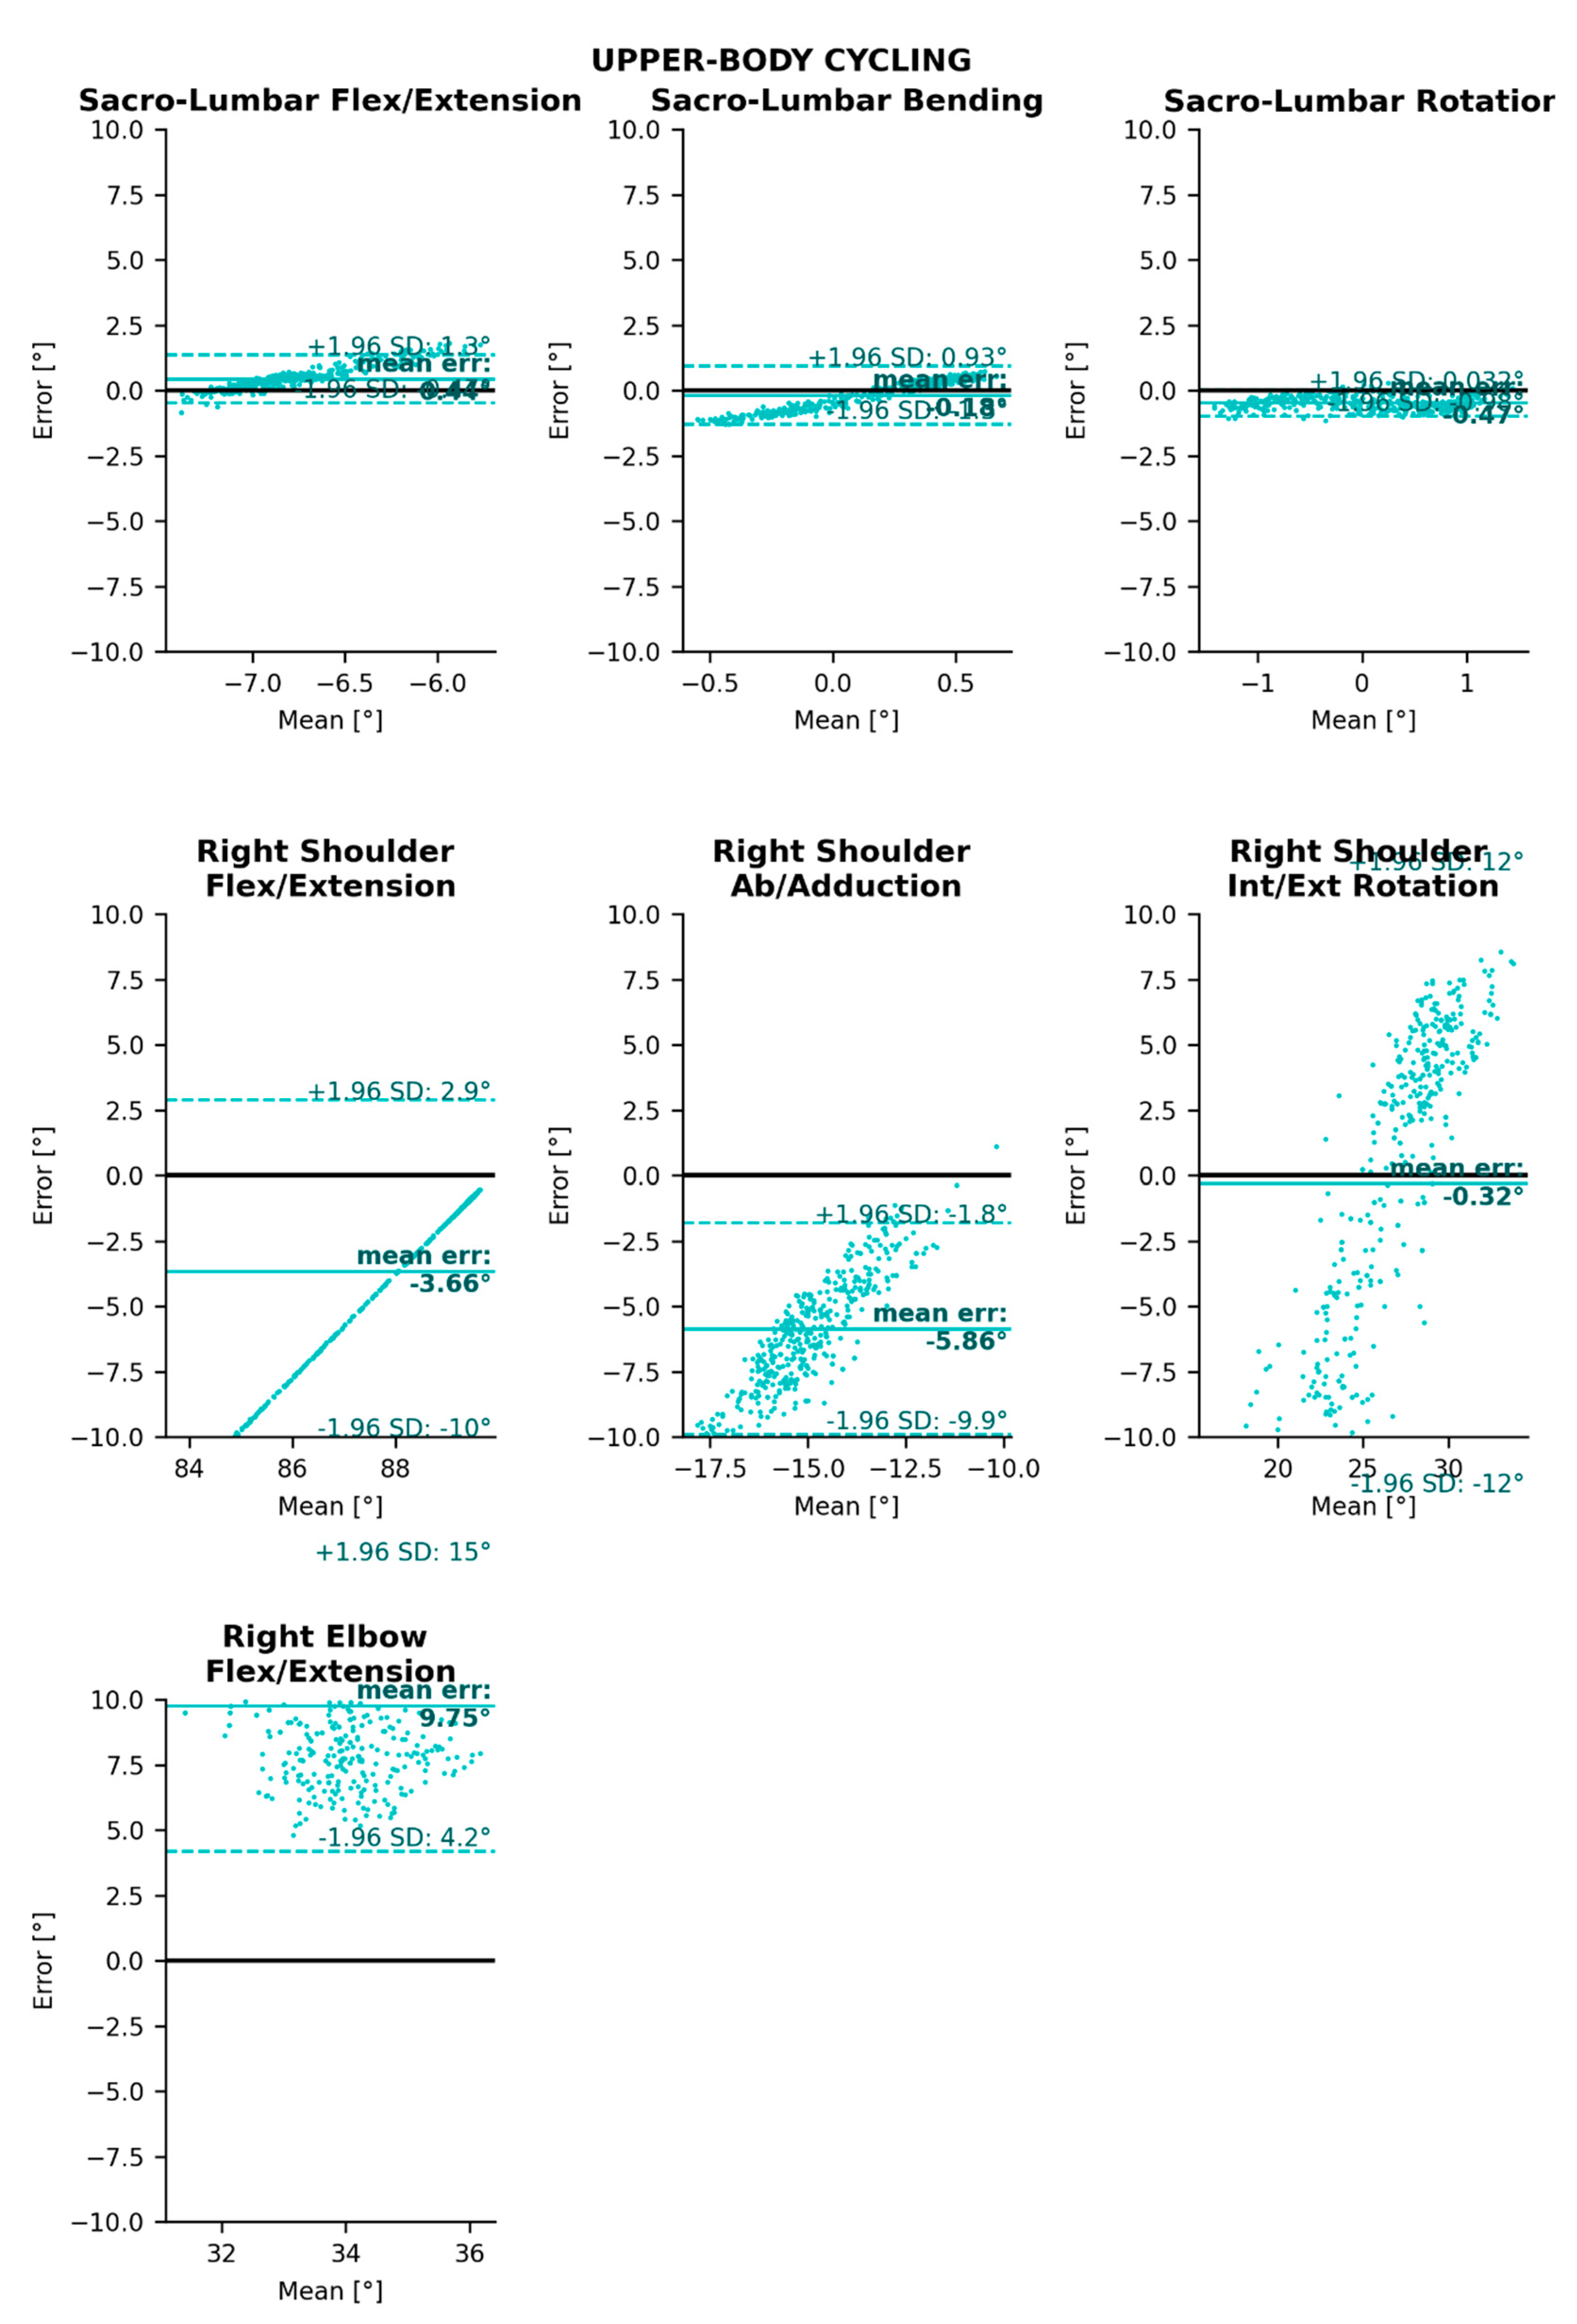
Appendix A.3. Angle Comparisons and Bland–Altman Analysis in the Cycling Task


References
- Atha, J. Current techniques for measuring motion. Appl. Ergonom. 1984, 15, 245–257. [Google Scholar] [CrossRef]
- Chambers, R.; Gabbett, T.J.; Cole, M.H.; Beard, A. IMU review—The Use of Wearable Microsensors to Quantify Sport-Specific Movements. Sports Med. 2015, 45, 1065–1081. [Google Scholar] [CrossRef] [PubMed]
- Johnston, W.; O’Reilly, M.; Argent, R.; Caulfield, B. IMU review-Reliability, Validity and Utility of Inertial Sensor Systems for Postural Control Assessment in Sport Science and Medicine Applications: A Systematic Review. Sports Med. 2019, 49, 783–818. [Google Scholar] [CrossRef] [PubMed] [Green Version]
- Choppin, S.; Wheat, J. The potential of the Microsoft Kinect in sports analysis and biomechanics. Sports Technol. 2013, 6, 78–85. [Google Scholar] [CrossRef]
- Guo, J.; Zhang, Q.; Chai, H.; Li, Y. Obtaining lower-body Euler angle time series in an accurate way using depth camera relying on Optimized Kinect, C.N.N. Measurement 2022, 188, 110461. [Google Scholar] [CrossRef]
- Carraro, M.; Munaro, M.; Burke, J.; Menegatti, E. Real-time marker-less multi-person 3D pose estimation in RGB-Depth camera networks. arXiv 2017, arXiv:171006235. Available online: http://arxiv.org/abs/1710.06235 (accessed on 26 March 2022).
- Wang, J.; Tan, S.; Zhen, X.; Xu, S.; Zheng, F.; He, Z.; Shao, L. Deep 3D human pose estimation: A review. Comput. Vis. Image Underst. 2021, 210, 103225. [Google Scholar] [CrossRef]
- Thomas, G.; Gade, R.; Moeslund, T.B.; Carr, P.; Hilton, A. Computer vision for sports: Current applications and research topics. Comput. Vis. Image Underst. 2017, 159, 3–18. [Google Scholar] [CrossRef]
- Bridgeman, L.; Volino, M.; Guillemaut, J.-Y.; Hilton, A. Multi-Person 3D Pose Estimation and Tracking in Sports. In Proceedings of the 2019 IEEE/CVF Conference on Computer Vision and Pattern Recognition Workshops (CVPRW), Long Beach, CA, USA, 16–17 June 2019. [Google Scholar]
- Pagliari, D.; Pinto, L. Calibration of Kinect for Xbox One and Comparison between the Two Generations of Microsoft Sensors. Sensors 2015, 15, 27569–27589. [Google Scholar] [CrossRef] [Green Version]
- Bazarevsky, V.; Grishchenko, I.; Raveendran, K.; Zhu, T.; Zhang, F.; Grundmann, M. BlazePose: On-device Real-time Body Pose tracking. arXiv 2020, arXiv:200610204. [Google Scholar]
- Wang, W.; Zhang, K.; Ren, H.; Wei, D.; Gao, Y.; Liu, J. UULPN: An Ultra-lightweight Network for Human Pose Estimation Based on Unbiased Data Processing. Neurocomputing. 2022. Available online: https://www.sciencedirect.com/science/article/pii/S092523122101938X (accessed on 26 March 2022).
- Cao, Z.; Hidalgo, G.; Simon, T.; Wei, S.-E.; Sheikh, Y. OpenPose: Realtime Multi-Person 2D Pose Estimation Using Part Affinity Fields. IEEE Trans. Pattern Anal. Mach. Intell. 2021, 43, 172–186. [Google Scholar] [CrossRef] [PubMed] [Green Version]
- Nakano, N.; Sakura, T.; Ueda, K.; Omura, L.; Kimura, A.; Iino, Y.; Fukashiro, S.; Yoshioka, S. Evaluation of 3D Markerless Motion Capture Accuracy Using OpenPose with Multiple Video Cameras. Front. Sports Act. Living 2020, 2, 50. [Google Scholar] [CrossRef] [PubMed]
- Slembrouck, M.; Luong, H.; Gerlo, J.; Schütte, K.; Van Cauwelaert, D.; De Clercq, D.; Vanwanseele, B.; Veelaert, P.; Philips, W. Multiview 3D Markerless Human Pose Estimation from OpenPose Skeletons. In Advanced Concepts for Intelligent Vision Systems; Blanc-Talon, J., Delmas, P., Philips, W., Popescu, D., Scheunders, P., Eds.; Springer International Publishing: Cham, Switzerland, 2020; p. 166. Available online: http://link.springer.com/10.1007/978–3-030–40605-9_15 (accessed on 9 March 2021).
- Labuguen, R.T.; Negrete, S.B.; Kogami, T.; Ingco, W.E.M.; Shibata, T. Performance Evaluation of Markerless 3D Skeleton Pose Estimates with Pop Dance Motion Sequence. In Proceedings of the 2020 Joint 9th International Conference on Informatics, Electronics Vision (ICIEV) and 2020 4th International Conference on Imaging, Vision Pattern Recognition (icIVPR), Kitakyushu, Japan, 26–29 August 2020; pp. 1–7. [Google Scholar]
- Needham, L.; Evans, M.; Cosker, D.P.; Wade, L.; McGuigan, P.M.; Bilzon, J.L.; Colyer, S.L. The accuracy of several pose estimation methods for 3D joint centre localisation. Sci. Rep. 2021, 11, 20673. [Google Scholar] [CrossRef] [PubMed]
- Fang, H.-S.; Xie, S.; Tai, Y.-W.; Lu, C. RMPE: Regional Multi-Person Pose Estimation. In Proceedings of the 2017 IEEE International Conference on Computer Vision (ICCV), Venice, Italy, 22–29 October 2017; p. 2353. Available online: http://ieeexplore.ieee.org/document/8237518/ (accessed on 6 August 2021).
- Mathis, A.; Mamidanna, P.; Cury, K.M.; Abe, T.; Murthy, V.N.; Mathis, M.W.; Bethge, M. DeepLabCut: Markerless pose estimation of user-defined body parts with deep learning. Nat. Neurosci. 2018, 21, 1281–1289. [Google Scholar] [CrossRef]
- D’Antonio, E.; Taborri, J.; Mileti, I.; Rossi, S.; Patane, F. Validation of a 3D Markerless System for Gait Analysis based on OpenPose and Two RGB Webcams. IEEE Sens. J. 2021, 21, 17064–17075. [Google Scholar] [CrossRef]
- Wade, L.; Needham, L.; Evans, M.; Colyer, S.; Cosker, D.; Bilzon, J.; McGuigan, P. Application of deep learning-based pose estimation methods for clinical gait outcome measures. In Proceedings of the Congress of the International Society of Biomechanics, Stockholm, Sweden, 25–29 July 2021. [Google Scholar]
- Karashchuk, P.; Rupp, K.L.; Dickinson, E.S.; Walling-Bell, S.; Sanders, E.; Azim, E.; Brunton, B.W.; Tuthill, J.C. Anipose: A Toolkit for Robust Markerless 3D Pose Estimation. Cell Reports. 2021. Available online: https://www.cell.com/cell-reports/abstract/S2211–1247(21)01179–7 (accessed on 27 October 2021).
- Geelen, J.E.; Branco, M.P.; Ramsey, N.F.; van der Helm, F.C.T.; Mugge, W.; Schouten, A.C. MarkerLess Motion Capture: ML-MoCap, a low-cost modular multi-camera setup. In Proceedings of the 2021 43rd Annual International Conference of the IEEE Engineering in Medicine Biology Society (EMBC), Guadalajara, Mexico, 1–5 November 2021; IEEE: Piscataway, NJ, USA, 2021; pp. 4859–4862. [Google Scholar]
- Kanko, R.M.; Laende, E.K.; Davis, E.M.; Selbie, W.S.; Deluzio, K.J. Concurrent assessment of gait kinematics using marker-based and markerless motion capture. J. Biomech. 2021, 127, 110665. [Google Scholar] [CrossRef]
- Pagnon, D.; Domalain, M.; Reveret, L. Pose2Sim: An End-to-End Workflow for 3D Markerless Sports Kinematics—Part 1: Robustness. Sensors 2021, 21, 6530. [Google Scholar] [CrossRef]
- Delp, S.L.; Anderson, F.C.; Arnold, A.S.; Loan, P.; Habib, A.; John, C.T.; Guendelman, E.; Thelen, D.G. OpenSim: Open-Source Software to Create and Analyze Dynamic Simulations of Movement. IEEE Trans. Biomed. Eng. 2007, 54, 1940–1950. [Google Scholar] [CrossRef] [Green Version]
- Seth, A.; Hicks, J.L.; Uchida, T.K.; Habib, A.; Dembia, C.L.; Dunne, J.J.; Ong, C.F.; Demers, M.S.; Rajagopal, A.; Millard, M.; et al. OpenSim: Simulating musculoskeletal dynamics and neuromuscular control to study human and animal movement. PLoS Comput. Biol. 2018, 14, e1006223. [Google Scholar] [CrossRef]
- Needham, L.; Evans, M.; Cosker, D.P.; Colyer, S.L. Can Markerless Pose Estimation Algorithms Estimate 3D Mass Centre Positions and Velocities during Linear Sprinting Activities? Sensors 2021, 21, 2889. [Google Scholar] [CrossRef]
- Cappozzo, A.; Catani, F.; Della Croce, U.; Leardini, A. Position and orientation in space of bones during movement: Anatomical frame definition and determination. Clin. Biomech. 1995, 10, 171–178. [Google Scholar] [CrossRef]
- Laurentini, A. The visual hull concept for silhouette-based image understanding. IEEE Trans. Pattern Anal. Mach. Intell. 1994, 16, 150–162. [Google Scholar] [CrossRef]
- Zeni, J.A.; Richards, J.G.; Higginson, J.S. Two simple methods for determining gait events during treadmill and overground walking using kinematic data. Gait Posture 2008, 27, 710–714. [Google Scholar] [CrossRef] [PubMed] [Green Version]
- OpenPose Experimental Models. GitHub. Available online: https://github.com/CMU-Perceptual-Computing-Lab/openpose_train (accessed on 21 July 2021).
- Rajagopal, A.; Dembia, C.L.; DeMers, M.S.; Delp, D.D.; Hicks, J.L.; Delp, S.L. Full-Body Musculoskeletal Model for Muscle-Driven Simulation of Human Gait. IEEE Trans. Biomed. Eng. 2016, 63, 2068–2079. [Google Scholar] [CrossRef] [PubMed]
- Beaucage-Gauvreau, E.; Robertson, W.S.P.; Brandon, S.C.E.; Fraser, R.; Freeman, B.J.C.; Graham, R.B.; Thewlis, D.; Jones, C.F. Validation of an OpenSim full-body model with detailed lumbar spine for estimating lower lumbar spine loads during symmetric and asymmetric lifting tasks. Comput. Methods Biomech. Biomed. Eng. 2019, 22, 451–464. [Google Scholar] [CrossRef]
- Pohl, M.B.; Lloyd, C.; Ferber, R. Can the reliability of three-dimensional running kinematics be improved using functional joint methodology? Gait Posture 2010, 32, 559–563. [Google Scholar] [CrossRef]
- Halvorsen, K. Bias compensated least squares estimate of the center of rotation. J. Biomech. 2003, 36, 999–1008. [Google Scholar] [CrossRef]
- Ferrari, A.; Cutti, A.G.; Cappello, A. A new formulation of the coefficient of multiple correlation to assess the similarity of waveforms measured synchronously by different motion analysis protocols. Gait Posture 2010, 31, 540–542. [Google Scholar] [CrossRef]
- Shapiro, S.S.; Wilk, M.B. An Analysis of Variance Test for Normality (Complete Samples). Biometrika 1965, 52, 591–611. [Google Scholar] [CrossRef]
- Bland, J.M.; Altman, D. Statistical methods for assessing agreement between two methods of clinical measurement. Lancet 1986, 327, 307–310. [Google Scholar] [CrossRef]
- Atkinson, G.; Nevill, A.M. Statistical methods for assessing measurement error (reliability) in variables relevant to sports medicine. Sports Med. 1998, 26, 217–238. [Google Scholar] [CrossRef] [PubMed]
- Zhang, J.-T.; Novak, A.C.; Brouwer, B.; Li, Q. Concurrent validation of Xsens MVN measurement of lower limb joint angular kinematics. Physiol. Meas. 2013, 34, N63–N69. [Google Scholar] [CrossRef]
- Della Croce, U.; Cappozzo, A.; Kerrigan, D.C. Pelvis and lower limb anatomical landmark calibration precision and its propagation to bone geometry and joint angles. Med. Biol. Eng. Comput. 1999, 37, 155–161. [Google Scholar] [CrossRef] [PubMed]
- Bini, R.; Serrancolí, G.; Santiago, P.; Moura, F. Assessment of A Markerless Motion Tracking Method to Determine Body Position on the Bicycle. 2021, p. 1. Available online: https://upcommons.upc.edu/handle/2117/352159 (accessed on 28 September 2021).
- Slater, A.A.; Hullfish, T.J.; Baxter, J.R. The impact of thigh and shank marker quantity on lower extremity kinematics using a constrained model. BMC Musculoskelet. Disord. 2018, 19, 399. [Google Scholar] [CrossRef] [PubMed] [Green Version]
- Joo, H.; Simon, T.; Li, X.; Liu, H.; Tan, L.; Gui, L.; Banerjee, S.; Godisart, T.S.; Nabbe, B.; Matthews, I.; et al. Panoptic Studio: A Massively Multiview System for Social Interaction Capture. arXiv 2016, arXiv:161203153. [Google Scholar] [CrossRef] [Green Version]
- Bernardina, G.R.D.; Monnet, T.; Pinto, H.T.; Barros, R.M.L.; de Cerveri, P.; Silvatti, A.P. Are Action Sport Cameras Accurate Enough for 3D Motion Analysis? A Comparison with a Commercial Motion Capture System. J. Appl. Biomech. 2018, 35, 80–86. [Google Scholar]
- Seethapathi, N.; Wang, S.; Saluja, R.; Blohm, G.; Kording, K.P. Movement science needs different pose tracking algorithms. arXiv 2019, arXiv:190710226. [Google Scholar]
- Kitamura, T.; Teshima, H.; Thomas, D.; Kawasaki, H. Refining OpenPose with a New Sports Dataset for Robust 2D Pose Estimation. In Proceedings of the IEEE/CVF Winter Conference on Applications of Computer Vision, Waikoloa, HI, USA, 4–8 January 2022. [Google Scholar]
- Raissi, M.; Perdikaris, P.; Karniadakis, G.E. Physics-informed neural networks: A deep learning framework for solving forward and inverse problems involving nonlinear partial differential equations. J. Comput. Phys. 2019, 378, 686–707. [Google Scholar] [CrossRef]
- Ghasemzadeh, S.A.; Van Zandycke, G.; Istasse, M.; Sayez, N.; Moshtaghpour, A.; De Vleeschouwer, C. DeepSportLab: A Unified Framework for Ball Detection, Player Instance Segmentation and Pose Estimation in Team Sports Scenes. arXiv 2021, arXiv:211200627. [Google Scholar]
- Ludwig, K.; Einfalt, M.; Lienhart, R. Robust Estimation of Flight Parameters for SKI Jumpers. In Proceedings of the 2020 IEEE International Conference on Multimedia Expo Workshops (ICMEW), London, UK, 6–10 July 2020; pp. 1–6. [Google Scholar]
- Fischler, M.A.; Bolles, R.C. Random sample consensus: A paradigm for model fitting with applications to image analysis and automated cartography. Commun. ACM 1981, 24, 381–395. [Google Scholar] [CrossRef]
- Rauch, H.E.; Tung, F.; Striebel, C.T. Maximum likelihood estimates of linear dynamic systems. AIAA J. 1965, 3, 1445–1450. [Google Scholar] [CrossRef]
- Desmarais, Y.; Mottet, D.; Slangen, P.; Montesinos, P. A review of 3D human pose estimation algorithms for markerless motion capture. arXiv 2020, arXiv:201006449. [Google Scholar] [CrossRef]
- Seth, A.; Matias, R.; Veloso, A.P.; Delp, S.L. A Biomechanical Model of the Scapulothoracic Joint to Accurately Capture Scapular Kinematics during Shoulder Movements. PLoS ONE 2016, 11, e0141028. [Google Scholar] [CrossRef] [PubMed]


| Task | Marker-Based RMSE (cm) | Pose2Sim RMSE (cm) |
|---|---|---|
| Walking | 1.1–1.2 | 1.4–1.9 |
| Running | 1.5–1.7 | 1.5–2.1 |
| Cycling | 3.5–3.5 | 3.0–3.6 |
| Flexion/Extension | Abduction/Adduction 1 | Internal/External Rotation | |||||||||||
|---|---|---|---|---|---|---|---|---|---|---|---|---|---|
| CMC | R | ROMerr | Meanerr | CMC | r | ROMerr | Meanerr | CMC | r | ROMerr | Meanerr | ||
| Walking | Ankle | 0.90 | 0.89 | −1.22 | −2.79 * | 0.86 | 0.85 | 6.48 * | 2.56 * | - | - | - | - |
| Knee | 0.98 | 0.96 | −0.30 | −1.92 * | - | - | - | - | - | - | - | - | |
| Hip | 0.96 | 0.96 | −1.70 | −3.04 * | 0.74 | 0.81 | −1.81 * | −2.6 * | 0.34 | 0.54 | 4.68 * | −5.27 * | |
| Running | Ankle | 0.99 | 0.99 | −2.9 * | −0.71 * | 0.97 | 0.96 | 2.20 | 0.96 | - | - | - | - |
| Knee | 1.00 | 1.00 | 0.04 | −0.65 * | - | - | - | - | - | - | - | - | |
| Hip | 0.65 | 0.95 | 4.01 * | 15.18 * | 0.37 | 0.65 | −3.94 * | −3.76 * | 0.93 | 0.95 | 1.25 | −3.49 * | |
| Cycling | Ankle | 0.75 | 0.85 | 1.93 * | −6.73 * | nan | −0.32 | 10.27 * | 1.59 * | - | - | - | - |
| Knee | 1.00 | 1.00 | −2.94 * | 2.12 * | - | - | - | - | - | - | - | - | |
| Hip | 0.92 | 0.97 | −5.91 * | 6.12 * | nan | 0.14 | 1.72 * | −5.62 * | nan | −0.07 | 3.07 * | 2.11 * | |
| Flexion/Extension | Abduction/Adduction * | Internal/External Rotation | |||||
|---|---|---|---|---|---|---|---|
| Meanerr (°) | 95% LoA (°) | Meanerr (°) | 95% LoA (°) | Meanerr (°) | 95% LoA (°) | ||
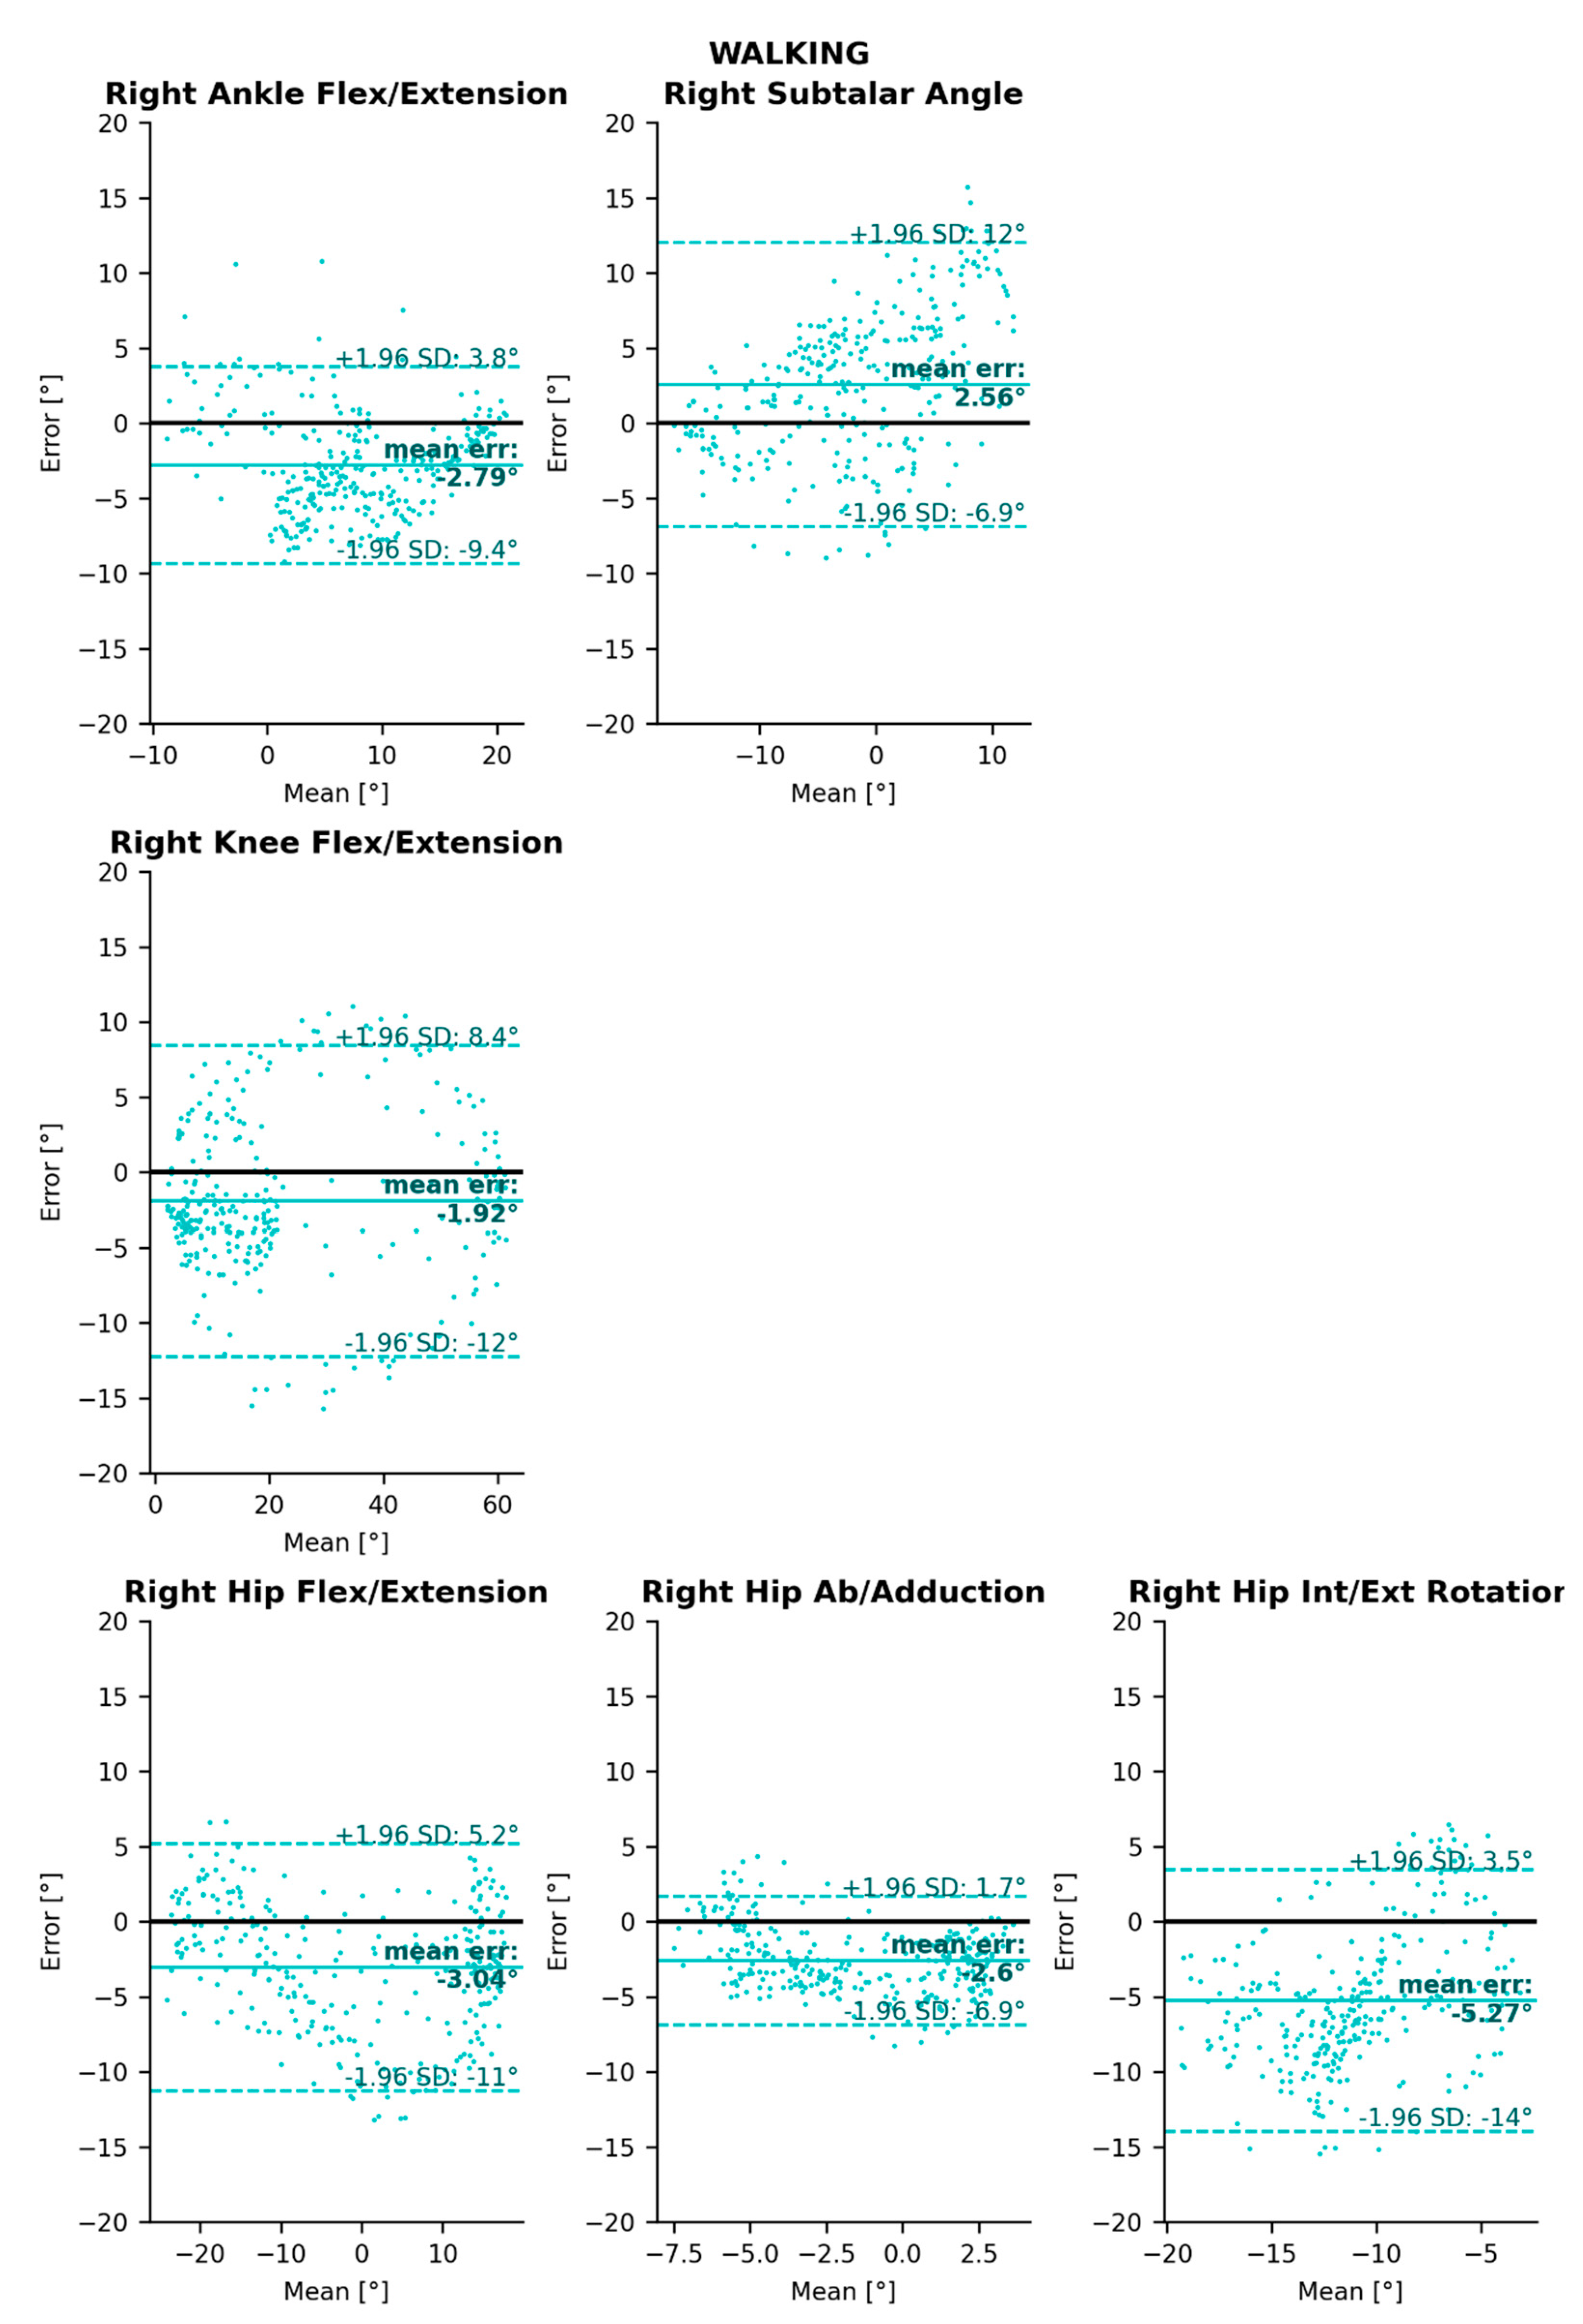
| Walking | Ankle | −2.79 | [−9.4, 3.8] | 2.56 | [−6.9, 12] | - | - |
| Knee | −1.92 | [−12, 8.4] | - | - | - | - | |
| Hip | −3.04 | [−11, 5.2] | −2.6 | [−6.9, 1.7] | −5.27 | [−14, 3.5] | |
| Running | Ankle | −0.71 | [−4.5, 3.0] | 0.96 | [−5.3, 7.2] | - | - |
| Knee | −0.65 | [−2.9, 1.6] | - | - | - | - | |
| Hip | 15.18 | [5.5, 25] | −3.76 | [−9.2, 1.6] | −3.49 | [−9.3, 2.4] | |
| Cycling | Ankle | −6.73 | [−16, 2.1] | 1.59 | [−9.8, 13] | - | - |
| Knee | 2.12 | [−1.1, 5.3] | - | - | - | - | |
| Hip | 6.12 | [−1.7, 14] | −5.62 | [−10, −1.1] | 2.11 | [−4.5, 8.7] | |
| Flexion/Extension | Abduction/Adduction * | Internal/External Rotation | ||||||||
|---|---|---|---|---|---|---|---|---|---|---|
| Pose2Sim | Theia3D [24] | Xsens [41] | Pose2Sim | Theia3D [24] | Xsens [41] | Pose2Sim | Theia3D [24] | Xsens [41] | ||
| RMSE (°) | Ankle | 4 | 6.7 | - | 5.1 | 8 | - | - | - | - |
| Knee | 5.1 | 3.3 | - | - | - | - | - | - | - | |
| Hip | 5.6 | 11 | - | 3.1 | 2.6 | - | 6.6 | 6.9 | - | |
| Meanerr (°) | Ankle | 2.79 | - | 2.15 | 2.56 | - | 1.81 | - | - | - |
| Knee | 1.92 | - | 1.87 | - | - | - | - | - | - | |
| Hip | 3.04 | - | 2.47 | 2.60 | - | 4.83 | 5.27 | - | 3.02 | |
| ROMerr (°) | Ankle | −1.22 | ≈−10 | 0.40 | 6.48 | - | 1.38 | - | - | - |
| Knee | −0.30 | ≈−1 | 0.80 | - | - | - | - | - | - | |
| Hip | −1.70 | ≈−10 | 2.42 | −1.81 | - | 5.37 | 4.68 | - | 0.04 | |
Publisher’s Note: MDPI stays neutral with regard to jurisdictional claims in published maps and institutional affiliations. |
© 2022 by the authors. Licensee MDPI, Basel, Switzerland. This article is an open access article distributed under the terms and conditions of the Creative Commons Attribution (CC BY) license (https://creativecommons.org/licenses/by/4.0/).
Share and Cite
Pagnon, D.; Domalain, M.; Reveret, L. Pose2Sim: An End-to-End Workflow for 3D Markerless Sports Kinematics—Part 2: Accuracy. Sensors 2022, 22, 2712. https://doi.org/10.3390/s22072712
Pagnon D, Domalain M, Reveret L. Pose2Sim: An End-to-End Workflow for 3D Markerless Sports Kinematics—Part 2: Accuracy. Sensors. 2022; 22(7):2712. https://doi.org/10.3390/s22072712
Chicago/Turabian StylePagnon, David, Mathieu Domalain, and Lionel Reveret. 2022. "Pose2Sim: An End-to-End Workflow for 3D Markerless Sports Kinematics—Part 2: Accuracy" Sensors 22, no. 7: 2712. https://doi.org/10.3390/s22072712
APA StylePagnon, D., Domalain, M., & Reveret, L. (2022). Pose2Sim: An End-to-End Workflow for 3D Markerless Sports Kinematics—Part 2: Accuracy. Sensors, 22(7), 2712. https://doi.org/10.3390/s22072712