
Ground-Reaction-Force-Based Gait Analysis and Its Application to Gait Disorder Assessment: New Indices for Quantifying Walking Behavior


Abstract
1. Introduction
2. Materials and Methods
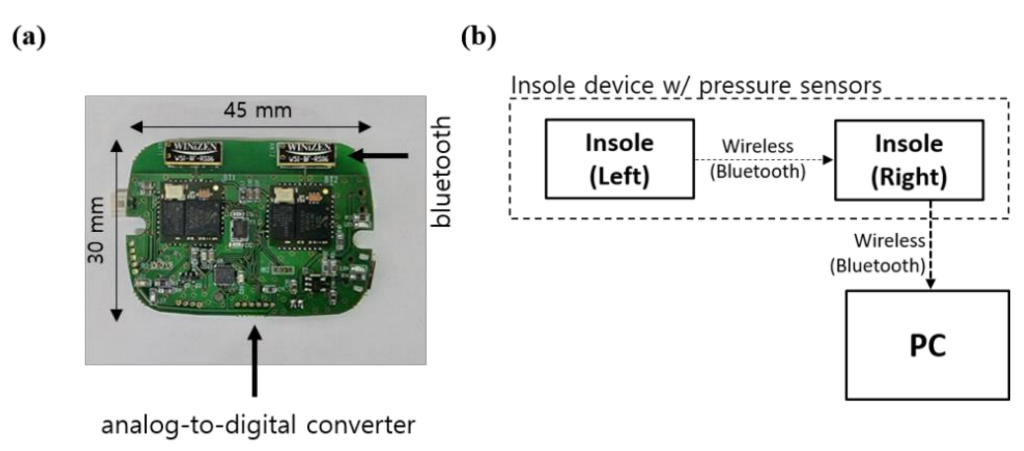
2.1. System Setup
2.2. Subjects and Test Method
2.3. Indices for Analysis of Gait Characteristics
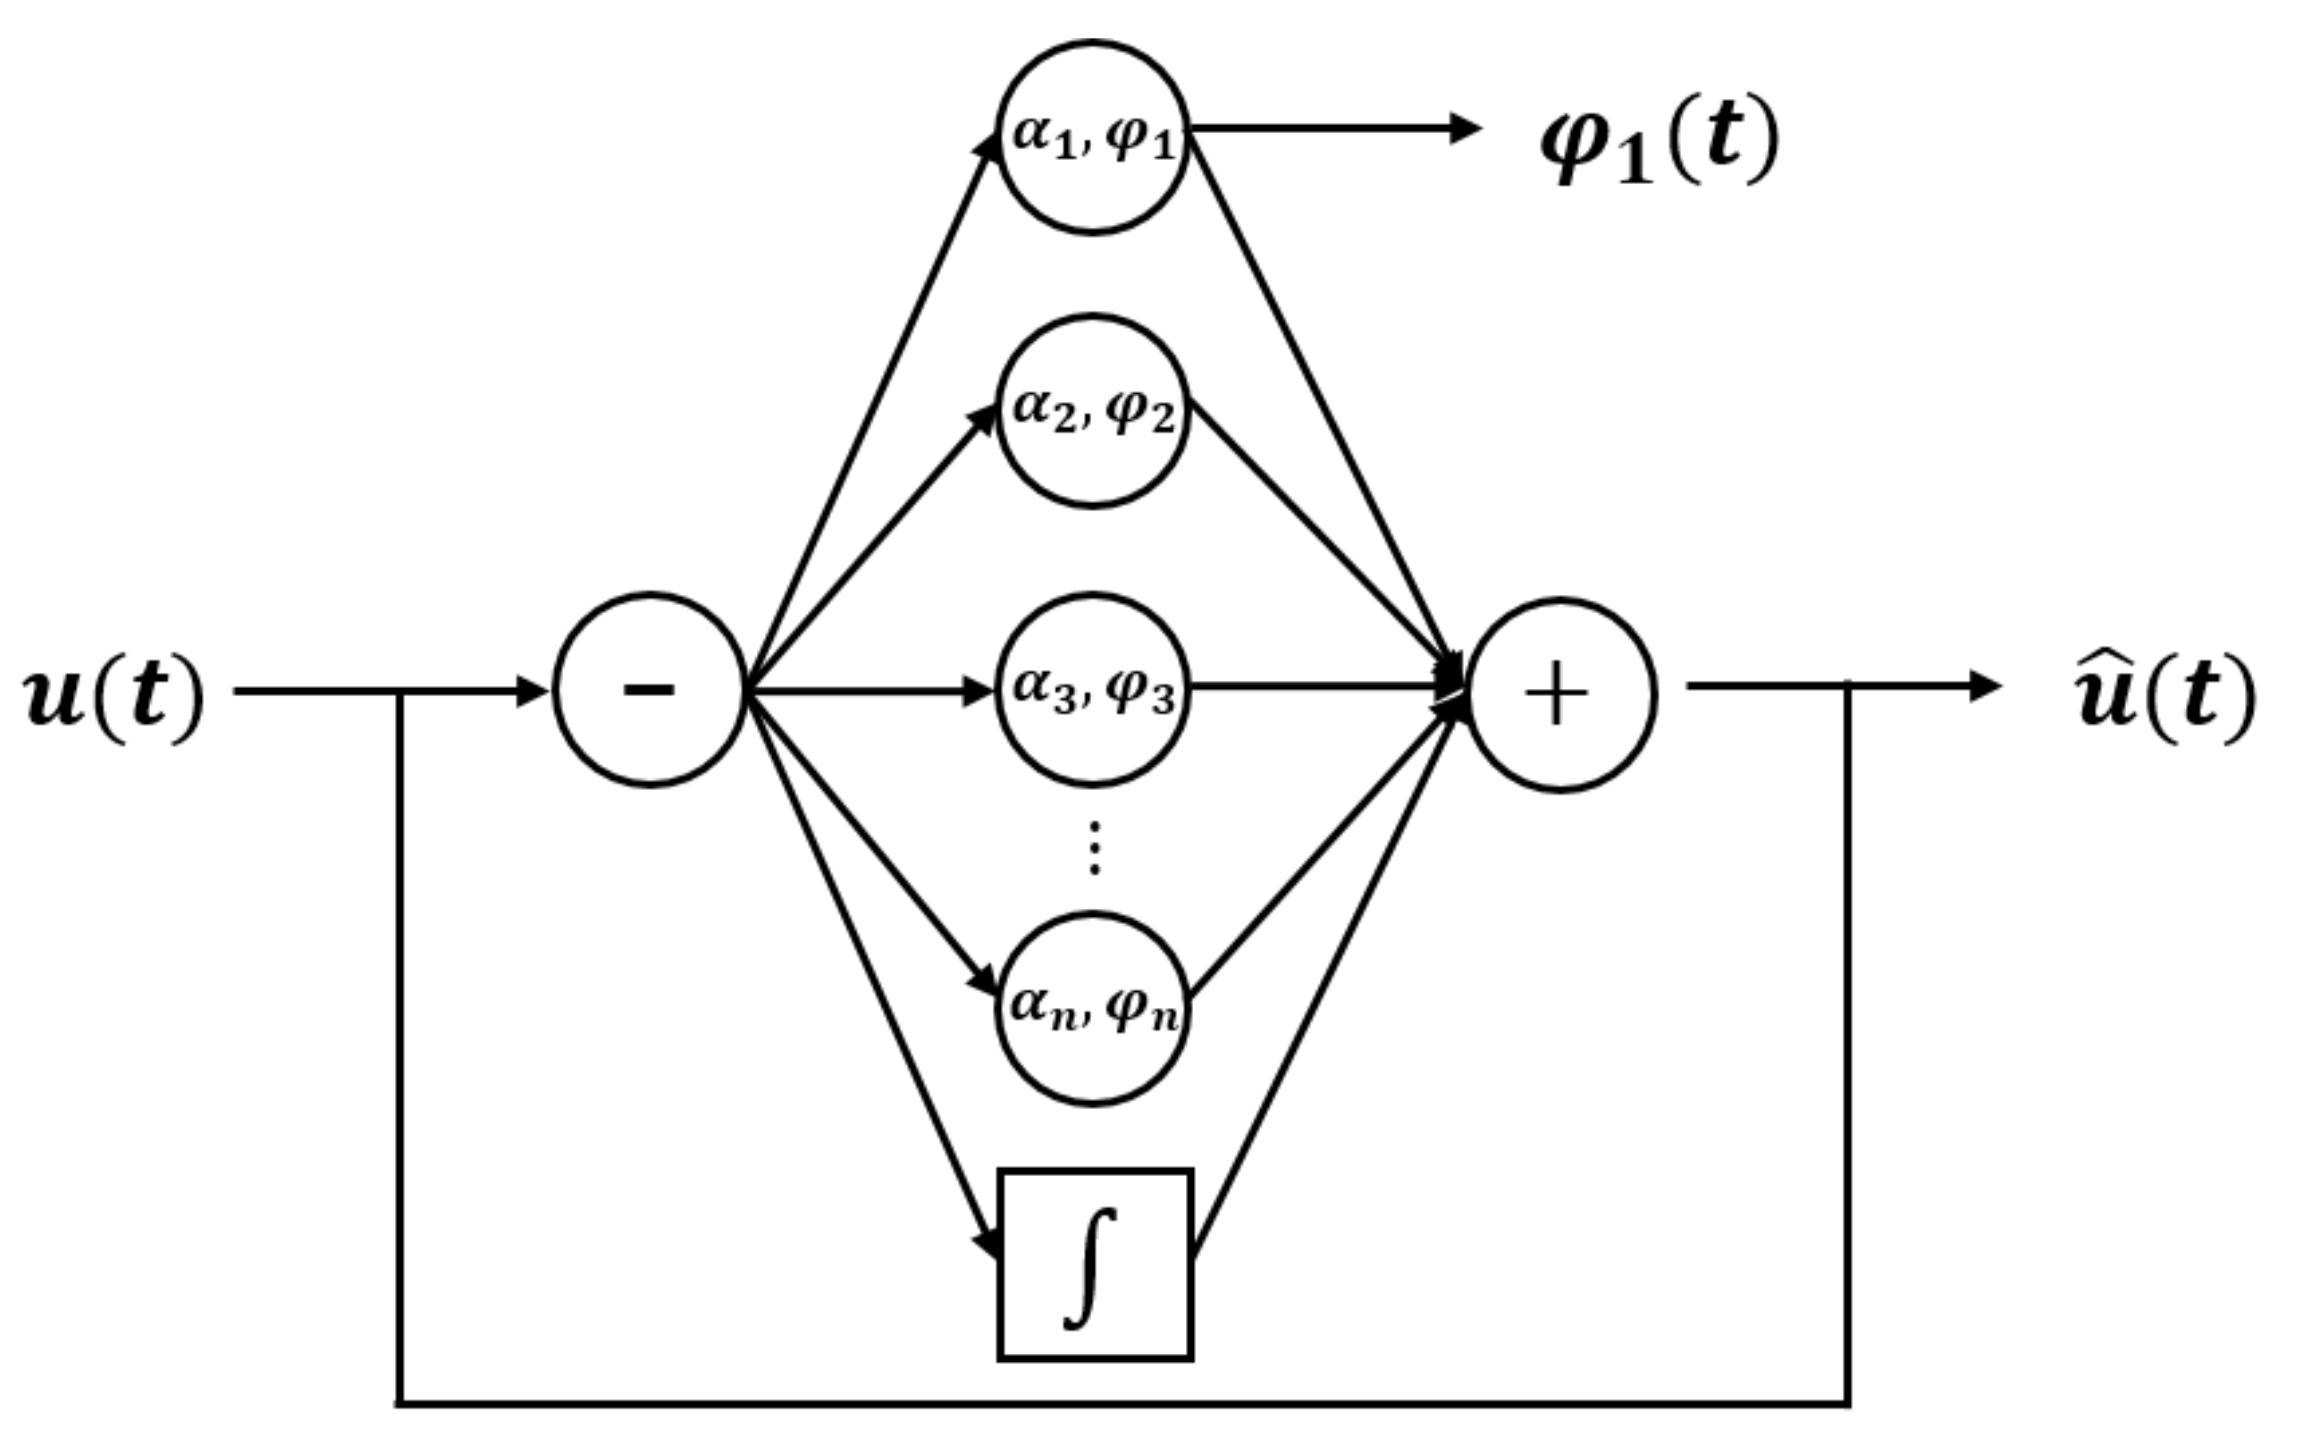
2.3.1. Continuous Gait Phase Analysis
2.3.2. Area Ratio Index (ARI)
2.3.3. Slope of Tangential Line of Closed Curves
2.3.4. PPD
2.3.5. PCI
3. Results
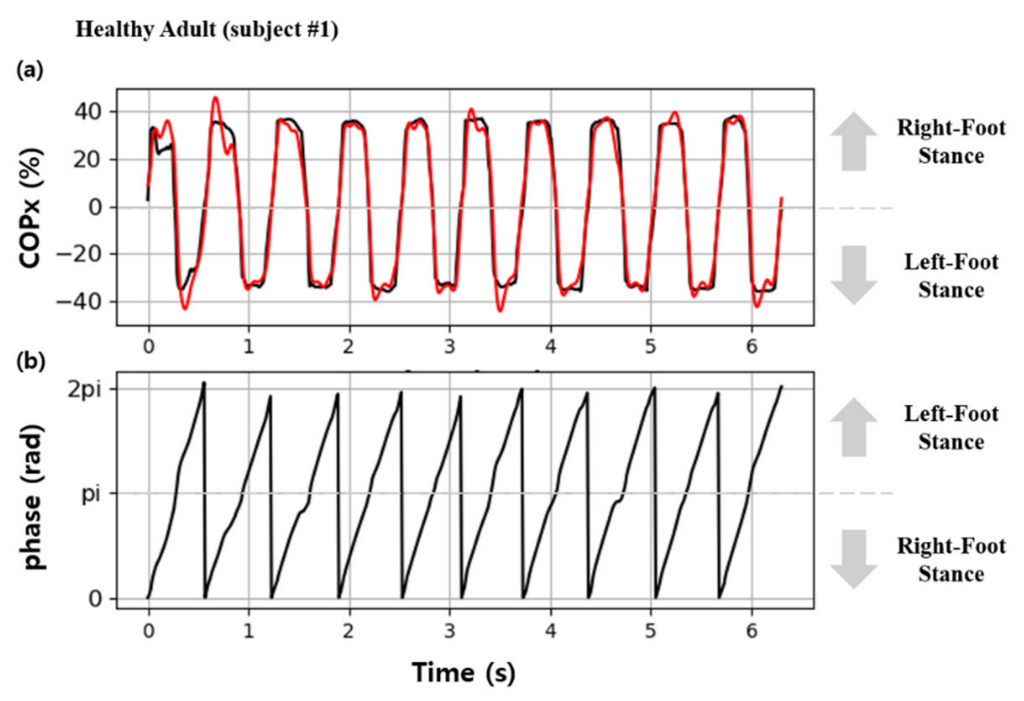
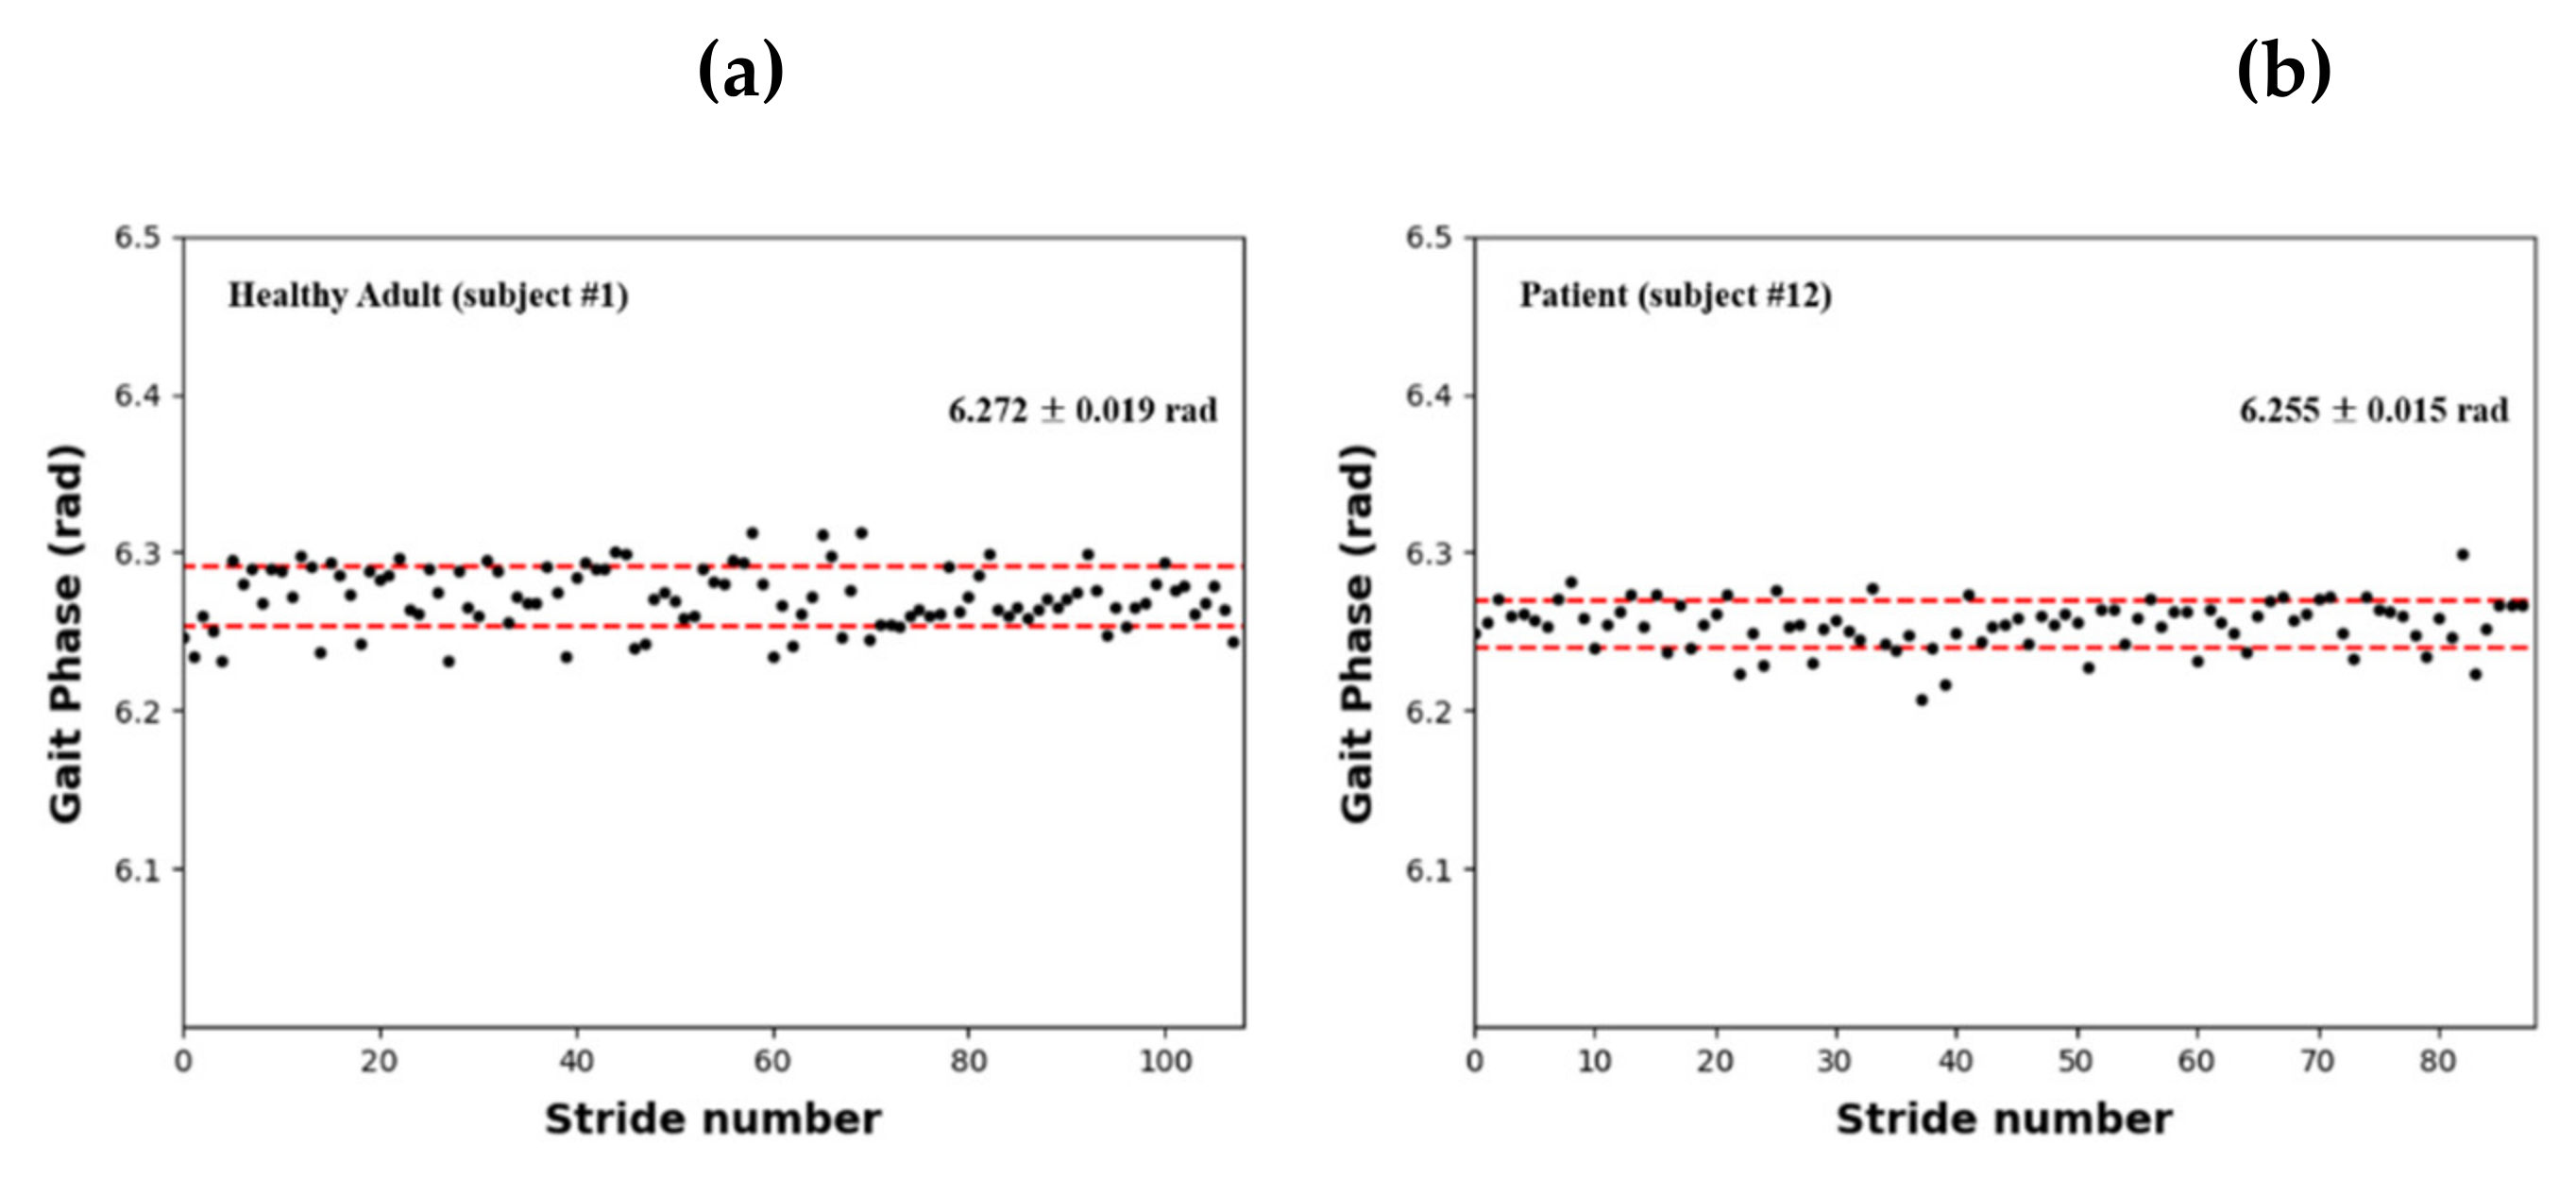
3.1. Continuous Gait Phase
3.2. Results for Gait Parameters
3.3. Comparison with Other Parameters
4. Discussion
5. Conclusions
Author Contributions
Funding
Institutional Review Board Statement
Informed Consent Statement
Data Availability Statement
Conflicts of Interest
Appendix A

| Acronym | Long Form | Definition |
|---|---|---|
| AO | adaptive frequency oscillator | the algorithm can output in synchronization with the frequency and amplitude of the input signal |
| ARI | area ratio index | an index to evaluate gait asymmetry using the area ratio of the polar gaitogram |
| COP | center of pressure | the body’s center of gravity projected onto the ground |
| CV | coefficient of variation | the statistical measurement of the relative dispersion of data points in a data series around the mean value |
| FSR | force sensing resistor | the sensor whose resistance changes when a force or pressure is applied |
| GRF | ground reaction force | the force exerted by the ground on a body in contact with it |
| PCI | phase coordination index | an index for measuring gait variability represents motion balance using stride time |
| PPD | percentage of plantar pressure difference | an index for measuring the difference in the plantar pressure in two feet |
References
- Ikai, T.; Kamikubo, T.; Takehara, I.; Nishi, M.; Miyano, S. Dynamic postural control in patients with hemiparesis. Am. J. Phys. Med. Rehabil. 2003, 82, 463–469. [Google Scholar] [CrossRef] [PubMed]
- Tyson, S.F.; Hanley, M.; Chilala, J.; Selley, A.; Rallis, R.C. Balance disability after stroke. Phys. Ther. 2006, 86, 30–38. [Google Scholar] [CrossRef] [PubMed]
- Shin, H.K.; Kim, J.; Lee, S.; Park, M.S.; Park, S.; Huh, S. Cause-of-death statistics in 2018 in the Republic of Korea. J. Korean Med. Assoc. 2020, 63, 286–297. [Google Scholar] [CrossRef]
- Hardie, K.; Hankey, G.J.; Jamrozik, K.; Broadhurst, R.J.; Anderson, C. Ten-year risk of first recurrent stroke and disability after first-ever stroke in the Perth Community Stroke Study. Stroke 2004, 35, 731–735. [Google Scholar] [CrossRef]
- Goldie, P.A.; Matyas, T.A.; Evans, O.M.; Galea, M.; Bach, T.M. Maximum voluntary weight-bearing by the affected and unaffected and legs in standing following stroke. Clin. Biomech. 1996, 11, 333–342. [Google Scholar] [CrossRef]
- Belgen, B.; Beninato, M.; Sullivan, P.E.; Narielwalla, K. The association of balance capacity and falls self-efficacy with history of falling in community-dwelling people with chronic stroke. Arch. Phys. Med. Rehabil. 2006, 87, 554–561. [Google Scholar] [CrossRef]
- Dean, C.M.; Rissel, C.; Sharkey, M.; Sherrington, C.; Cumming, R.G.; Barker, R.N.; Kirkham, C. Exercise intervention to prevent falls and enhance mobility in community dwellers after stroke: A protocol for a randomised controlled trial. BMC Neurol. 2009, 9, 38. [Google Scholar] [CrossRef]
- Prajapati, S.K.; Gage, W.H.; Brooks, D.; Black, S.E.; McIlroy, W.E. A novel approach to ambulatory monitoring: Investigation into the quantity and control of everyday walking in patients with subacute stroke. Neurorehabil. Neural Repair. 2011, 25, 6–14. [Google Scholar] [CrossRef]
- Qiu, S.; Wang, H.; Li, J.; Zhao, H.; Wang, Z.; Wang, J.; Wang, Q.; Plettemeier, D.; Bärhold, M.; Bauer, T. Towards wearable-inertial-sensor-based gait posture evaluation for subjects with unbalanced gaits. Sensors 2020, 20, 1193. [Google Scholar] [CrossRef]
- Qiu, S.; Wang, Z.; Zhao, H.; Liu, L.; Jiang, Y. Using body-worn sensors for preliminary rehabilitation assessment in stroke victims with gait impairment. IEEE Access. 2018, 6, 31249–31258. [Google Scholar] [CrossRef]
- Androwis, G.J.; Pilkar, R.; Ramanujam, A.; Nolan, K.J. Electromyography assessment during gait in a robotic exoskeleton for acute stroke. Front. Neurol. 2018, 9, 630. [Google Scholar] [CrossRef] [PubMed]
- Huang, H.; Kuiken, T.A.; Lipschutz, R.D. A strategy for identifying locomotion modes using surface electromyography. IEEE Trans. Biomed. Eng. 2008, 56, 65–73. [Google Scholar] [CrossRef] [PubMed]
- Huang, H.; Zhang, F.; Hargrove, L.J.; Dou, Z.; Rogers, D.R.; Englehart, K.B. Continuous locomotion-mode identification for prosthetic legs based on neuromuscular-mechanical fusion. IEEE Trans. Biomed. Eng. 2011, 58, 2867–2875. [Google Scholar] [CrossRef] [PubMed]
- Zhang, Q.; Fragnito, N.; Franz, J.R.; Sharma, N. Fused ultrasound and electromyography-driven neuromuscular model to improve plantarflextion moment prediction across walking speed. J. Neuroeng. Rehabil. 2022, 19, 86. [Google Scholar] [CrossRef] [PubMed]
- Truong, P.H.; You, S.; Ji, S.H.; Jeong, G.M. Wearable system for daily activity recognition using inertial and pressure sensors of a smart band and smart shoes. Int J. Comput. Commun. Control. 2020, 14, 726–742. [Google Scholar] [CrossRef]
- Hong, S.; Kim, D.; Park, H.; Seo, Y.; Hussain, I.; Park, S.J. Gait feature vector for post-stroke prediction using wearable sensor. Sci. Emot. Sensib. 2019, 22, 55–64. [Google Scholar] [CrossRef]
- Wang, C.; Kim, Y.; Shin, H.; Min, S.D. Preliminary clinical application of textile insole sensor for hemiparetic gait pattern analysis. Sensors 2019, 19, 3950. [Google Scholar] [CrossRef]
- Seo, M.; Shin, M.J.; Park, T.S.; Park, J.H. Clinometric gait analysis using smart insoles in patients with hemiplegia after stroke: Pilot study. JMIR mHealth uHealth 2020, 8, e22208. [Google Scholar] [CrossRef]
- Sanghan, S.; Leelasamran, W.; Chatpun, S. Imbalanced gait characteristics based on plantar pressure assessment in patients with hemiplegia. Walaiak J. Sci. Technol. 2015, 12, 595–603. [Google Scholar]
- Wall, J.C.; Crosbie, J. Accuracy and reliability of temporal gait measurement. Gait Posture 1996, 4, 293–296. [Google Scholar] [CrossRef]
- Hanlon, M.; Anderson, R. Real-time gait event detection using wearable sensors. Gait Posture 2009, 30, 523–527. [Google Scholar] [CrossRef] [PubMed]
- Smith, B.T.; Coiro, D.J.; Finson, R.; Betz, R.R.; McCarthy, J. Evaluation of force-sensing resistors for gait event detection to trigger electrical stimulation to improve walking in the child with cerebral palsy. IEEE Trans. Neural. Syst. Rehabil. Eng. 2002, 10, 22–29. [Google Scholar] [CrossRef] [PubMed]
- Brandell, B.R. Development of a universal control unit for functional electrical stimulation (FES). Am. J. Phys. Med. 1982, 61, 279–301. [Google Scholar] [CrossRef] [PubMed]
- Aminian, K.; Rezakhanlou, K.; De Andres, E.; Fritsch, C.; Leyvraz, P.F.; Robert, P. Temporal feature estimation during walking using miniature accelerometers: An analysis of gait improvement after hip arthroplasty. Med. Biol. Eng. Comput. 1999, 37, 686–691. [Google Scholar] [CrossRef]
- Sanghan, S.; Chatpun, S.; Leelasamran, W. Gait characterizations under dynamic load during walking in hemiplegic patients. In Proceedings of the 2011 IEEE Conference on Biomedical Engineering International Conference (BMEiCon), Chiang Mai, Thailand, 29–31 January 2012. [Google Scholar] [CrossRef]
- Tang, J.; Zheng, J.; Wang, Y.; Yu, L.; Zhan, E.; Song, Q. Self-tuning threshold method for real-time gait phase detection based on ground contact forces using FSRs. Sensors 2018, 18, 481. [Google Scholar] [CrossRef]
- Lim, D.H.; Kim, W.S.; Kim, H.J.; Han, C.S. Development of real-time gait phase detection system for a lower extremity exoskeleton robot. Int. J. Precis. Eng. Manuf. 2017, 18, 681–687. [Google Scholar] [CrossRef]
- Duong, T.T.; Uher, D.; Young, S.D.; Duong, T.; Sangco, M.; Cornett, K.; Zanotoo, D. Gaussian process regression for COP trajectory estimation in healthy and pathological gait using instrumented insoles. In Proceedings of the 2021 IEEE conference on International Conference on Intelligent Robots and Systems (IROS), Prague, Czech Republic, 27 September–1 October 2021. [Google Scholar] [CrossRef]
- Armand, S.; Mercier, M.; Watelain, E.; Patte, K.; Pelissier, J.; Rivier, F. A comparison of gait in spinal muscular atrophy, type II and Duchenne muscular dystrophy. Gait Posture 2005, 21, 369–378. [Google Scholar] [CrossRef]
- Jung, J.H.; Veneman, J.F. Preliminary comparison study on CoM and CoP paths between healthy subject and stroke patient while straight walking. In Proceedings of the International Conference on NeuroRehabilitation, Pisa, Italy, 16–20 October 2018. [Google Scholar] [CrossRef]
- Park, J.S.; Lee, C.M.; Koo, S.M.; Kim, C.H. Gait phase detection using force sensing resistors. IEEE Sens. J. 2020, 20, 6516–6523. [Google Scholar] [CrossRef]
- Murray, S.A.; Ha, K.H.; Hartigan, C.; Goldfarb, M. An assistive control approach for a lower-limb exoskeleton to facilitate recovery of walking following stroke. IEEE Trans. Neural Syst. Rehabil. Eng. 2014, 23, 441–449. [Google Scholar] [CrossRef]
- Jung, J.Y.; Heo, W.; Yang, H.; Park, H. A neural network-based gait phase classification method using sensors equipped on lower limb exoskeleton robots. Sensors 2015, 15, 27738–27759. [Google Scholar] [CrossRef]
- Park, J.S.; Koo, S.M.; Kim, C.H. Classification of standing and walking states using ground reaction forces. Sensors 2021, 21, 2145. [Google Scholar] [CrossRef] [PubMed]
- Yu, L.; Zheng, J.; Wang, Y.; Song, Z.; Zhan, E. Adaptive method for real-time gait phase detection based on ground contact forces. Gait Posture 2015, 41, 269–275. [Google Scholar] [CrossRef] [PubMed]
- Lewis, C.L.; Ferris, D.P. Invariant hip moment pattern while walking with a robotic hip exoskeleton. J. Biomech. 2011, 44, 789–793. [Google Scholar] [CrossRef] [PubMed]
- Villarreal, D.J.; Poonawala, H.A.; Gregg, R.D. A robust parameterization of human gait patterns across phase-shifting perturbations. IEEE Trans. Neural Syst. Rehabil. Eng. 2017, 25, 265–278. [Google Scholar] [CrossRef]
- Quintero, D.; Lambert, D.J.; Villarreal, D.J.; Gregg, R.D. Real-time continuous gait phase and speed estimation from a single sensor. In Proceedings of the 2017 IEEE Conference on Control Technology and Application (CCTA), San Diego, CA, USA, 27–30 August 2017; pp. 847–852. [Google Scholar] [CrossRef]
- Lee, J.; Hong, W.; Hur, P. Continuous gait phase estimation using LSTM for robotic transfemoral prosthesis across walking speeds. IEEE Trans. Neural Syst. Rehabil. Eng. 2021, 29, 1470–1477. [Google Scholar] [CrossRef]
- Seo, K.; Hyung, S.; Choi, B.K.; Lee, Y.; Shim, Y. A new adaptive frequency oscillator for gait assistance. In Proceedings of the 2015 IEEE International Conference on Robotics and Automation (ICRA), Rio de Janeiro, Brazil, 26–30 May 2015. [Google Scholar]
- Seo, K.; Lee, J.; Lee, Y.; Ha, T.; Shim, Y. Fully autonomous hip exoskeleton saves metabolic cost of walking. In Proceedings of the 2016 IEEE International Conference on Robotics and Automation (ICRA), Stockholm, Sweden, 16–21 May 2016. [Google Scholar]
- Yan, T.; Parri, A.; Ruiz Garate, V.; Cempini, M.; Ronsse, R.; Vitiello, N. An oscillator-based smooth real-time estimate of gait phase for wearable robotics. Auton. Robot. 2017, 41, 759–774. [Google Scholar] [CrossRef]
- Warden, P.; Situnayake, D. TinyML; O’Reilly Media, Incorporated: Sebastopol, CA, USA, 2019. [Google Scholar]
- Ronsse, R.; De Rossi, S.M.M.; Vitiello, N.; Lenzi, T.; Carrozza, M.C.; Ijspeert, A.J. Real-time estimate of velocity and acceleration of quasi-periodic signals using adaptive oscillators. IEEE Trans. Robot. 2013, 29, 783–791. [Google Scholar] [CrossRef]
- Rampp, A.; Barth, J.; Schülein, S.; Gaßmann, K.G.; Klucken, J.; Eskofier, B.M. Inertial sensor-based stride parameter calculation from gait sequences in geriatric patients. IEEE Trans. Bio Med. Eng. 2015, 62, 1089–1097. [Google Scholar] [CrossRef]
- Plotnik, M.; Giladi, N.; Hausdorff, J.M. A new measure for quantifying the bilateral coordination of human gait: Effects of aging and Parkinson’s disease. Exp. Brain Res. 2007, 181, 561–570. [Google Scholar] [CrossRef]


| Healthy Adults | Patients | |
|---|---|---|
| Number of persons | 8 | 4 |
| Age (years) | 33 ± 3 | 56 ± 10 |
| Height (m) | 1.76 ± 0.05 | 1.67 ± 0.05 |
| Weight (kg) | 70 ± 12 | 68 ± 6 |
| Healthy Adult | Gait Phase (Rad) | Patient | Gait Phase (Rad) |
|---|---|---|---|
| Subject 1 | 6.272 ± 0.019 | Subject 9 | 6.273 ± 0.017 |
| Subject 2 | 6.265 ± 0.016 | Subject 10 | 6.255 ± 0.016 |
| Subject 3 | 6.279 ± 0.025 | Subject 11 | 6.263 ± 0.016 |
| Subject 4 | 6.275 ± 0.022 | Subject 12 | 6.255 ± 0.015 |
| Subject 5 | 6.276 ± 0.016 | - | - |
| Subject 6 | 6.275 ± 0.016 | - | - |
| Subject 7 | 6.277 ± 0.018 | - | - |
| Subject 8 | 6.278 ± 0.019 | - | - |
| Average (S.D.) | 6.275 ± 0.004 | 6.262 ± 0.009 | |
| Difference with 2π | 0.008 | 0.021 |
| Healthy Adult Subject No. | (%) | (%) | ARI (%) | (rad) | PPD (%) | PCI (%) |
|---|---|---|---|---|---|---|
| Subject 1 | 49.9 | 50.1 | 0.2 | 0.03 | 5.86 | 7.93 |
| Subject 2 | 53.1 | 46.9 | 6.1 | 0.11 | 5.50 | 13.18 |
| Subject 3 | 48.8 | 51.2 | 2.5 | 0.02 | 9.09 | 6.95 |
| Subject 4 | 46.5 | 53.5 | 6.9 | 0.14 | 8.84 | 8.18 |
| Subject 5 | 52.1 | 47.9 | 4.2 | 0.00 | 8.89 | 11.23 |
| Subject 6 | 48.9 | 51.1 | 2.1 | 0.05 | 8.89 | 12.71 |
| Subject 7 | 50.2 | 49.8 | 0.3 | 0.08 | 8.44 | 6.71 |
| Subject 8 | 50.5 | 49.5 | 1.1 | 0.11 | 6.65 | 7.20 |
| Average (S.D.) | 50.0 ± 2.0 | 50.0 ± 2.0 | 2.9 ± 2.6 | 0.07 ± 0.05 | 7.77 ± 1.51 | 9.26 ± 2.68 |
| Stroke Patient Subject No. | (%) | (%) | ARI (%) | (rad) | PPD (%) | PCI (%) |
|---|---|---|---|---|---|---|
| Subject 9 | 60.9 | 39.1 | 21.8 | 0.21 | 18.97 | 12.97 |
| Subject 10 | 63.2 | 36.8 | 26.4 | 0.42 | 11.05 | 14.35 |
| Subject 11 | 56.1 | 43.9 | 12.2 | 0.24 | 25.89 | 13.85 |
| Subject 12 | 36.0 | 64.0 | 28.0 | 0.17 | 34.92 | 14.05 |
| Average (S.D.) | 54.0 ± 12.4 | 46.0 ± 12.4 | 22.1 ± 7.1 | 0.26 ± 0.11 | 22.71 ± 10.15 | 13.81 ± 0.59 |
Publisher’s Note: MDPI stays neutral with regard to jurisdictional claims in published maps and institutional affiliations. |
© 2022 by the authors. Licensee MDPI, Basel, Switzerland. This article is an open access article distributed under the terms and conditions of the Creative Commons Attribution (CC BY) license (https://creativecommons.org/licenses/by/4.0/).
Share and Cite
Park, J.S.; Kim, C.H. Ground-Reaction-Force-Based Gait Analysis and Its Application to Gait Disorder Assessment: New Indices for Quantifying Walking Behavior. Sensors 2022, 22, 7558. https://doi.org/10.3390/s22197558
Park JS, Kim CH. Ground-Reaction-Force-Based Gait Analysis and Its Application to Gait Disorder Assessment: New Indices for Quantifying Walking Behavior. Sensors. 2022; 22(19):7558. https://doi.org/10.3390/s22197558
Chicago/Turabian StylePark, Ji Su, and Choong Hyun Kim. 2022. "Ground-Reaction-Force-Based Gait Analysis and Its Application to Gait Disorder Assessment: New Indices for Quantifying Walking Behavior" Sensors 22, no. 19: 7558. https://doi.org/10.3390/s22197558
APA StylePark, J. S., & Kim, C. H. (2022). Ground-Reaction-Force-Based Gait Analysis and Its Application to Gait Disorder Assessment: New Indices for Quantifying Walking Behavior. Sensors, 22(19), 7558. https://doi.org/10.3390/s22197558