Abstract
The teeth are the most challenging material to work with in the human body. Existing methods for detecting teeth problems are characterised by low efficiency, the complexity of the experiential operation, and a higher level of user intervention. Older oral disease detection approaches were manual, time-consuming, and required a dentist to examine and evaluate the disease. To address these concerns, we propose a novel approach for detecting and classifying the four most common teeth problems: cavities, root canals, dental crowns, and broken-down root canals, based on the deep learning model. In this study, we apply the YOLOv3 deep learning model to develop an automated tool capable of diagnosing and classifying dental abnormalities, such as dental panoramic X-ray images (OPG). Due to the lack of dental disease datasets, we created the Dental X-rays dataset to detect and classify these diseases. The size of datasets used after augmentation was 1200 images. The dataset comprises dental panoramic images with dental disorders such as cavities, root canals, BDR, dental crowns, and so on. The dataset was divided into 70% training and 30% testing images. The trained model YOLOv3 was evaluated on test images after training. The experiments demonstrated that the proposed model achieved 99.33% accuracy and performed better than the existing state-of-the-art models in terms of accuracy and universality if we used our datasets on other models.
1. Introduction
Dental informatics is a new field in dentistry that helps and improves dental practice diagnosis procedures, saves time, and reduces stress in people’s daily lives [1]. The main areas of dentistry are restorative dentistry, endodontics, orthodontics, dental surgery, and periodontology. Restorative dentistry refers to any dental procedure that repairs or replaces a tooth. Dental work and root canals are examples of restorative procedures. Endodontics is the branch of dentistry that deals with the dental pulp and the cells surrounding tooth roots. Orthodontics is a branch of dentistry that deals with tooth abnormalities and how to correct them. Dental surgery encompasses a wide range of medical treatments that involve the intentional modification of dentition, that is, surgery on the teeth, jaw bones, and gums. Periodontology is a branch of dentistry that deals with diseases of the teeth’s supporting and investing tissues, such as cementum, periodontal ligaments, gums, and alveolar bone [2]. The following are the most common dental illnesses: cavities are permanently damaged areas of the tooth’s hard surface that develop into small gaps or holes. Dental crowns are caps that go over damaged teeth. Crowns are used to protect, cover, and restore the form of teeth when fillings fail to solve the problem. A root canal is a treatment that removes tooth infection by diagnosing and treating a tooth’s diseased pulp.
Dentists are now responsible for diagnosing tooth problems. They can detect potential dental problems by inspecting and gently moving the teeth. There has been little progress in the automatic detection of dental problems. For disease classification and detection, manual analysis of teeth problems necessitates time and expertise. In manual analysis, human error can lead to incorrect predictions. The automatic dental problem detection and classification system will aid in early disease diagnosis and may prevent tooth loss. It will aid in eliminating manual clinical examination, which is time-consuming, tedious, and labour-intensive. In the past, medical imaging technologies such as CT and X-rays have greatly aided in treating and diagnosing various diseases [2].
An X-ray generator can generate radiographic X-rays passing through the mouth as tissues absorb radiation. The procedure known as projective-radiography produces two-dimensional (2D) images of the human body’s internal architecture [3]. The introduction of high-resolution biosensors and sensor images has resulted in massive amounts of data that can be analysed using computer programmes to assist dental professionals in making prevention, treatment planning, and diagnosis decisions [4]. Dental radiographs are classified as intraoral (the film is placed within the buccal space) or extraoral (the patient is placed between the X-ray source and the radiographic film). A panoramic dental radiograph displays the entire area of the mouth, including all of the teeth. Preferred medical image-processing solutions, such as CNN, have been used in various clinical settings [5,6]. A convolutional neural network has been developed as a strong machine learning technique, capable of tackling tasks such as image identification, segmentation, and classification with high accuracy. Deep CNN techniques were developed to detect deterioration, periapical periodontitis, and periodontal diseases of mild, moderate, and severe severity on clinical dental periapical radiographs. The CNN model investigated automatic periapical radiograph feature recognition, segmentation, and quantification. In every metric, the U-Net design and its version outscored Xnet and SegNet [7]. A deep learning algorithm was developed to detect and locate dental lesions in infrared transillumination images [8] and ultrasound image detection of hepatocellular carcinoma regions [9]. CNNs have been used in dentistry [10], caries detection [11], and apical lesions detection [12] to detect PBL. CNNs can also detect, classify, and segment different structures [13]. In this work, we describe a deep learning-based solution for supporting dentists in correctly identifying patients’ dental problems using panoramic dental X-ray pictures.
The proposed oral health care system can be used as a clinical assistant for discovering dental problems. It is a cost-effective, robust, and efficient system that will significantly contribute to oral healthcare. Manual analysis of teeth problems requires time and expertise for disease classification and detection. Furthermore, in manual analysis, there is a chance of wrong predictions due to human error/misunderstanding. However, the automated dental problem detection and classification system will help in early diagnosis and may prevent significant problems such as tooth loss. It will also help eliminate manual, time-consuming, tedious, and extensive examinations. For these reasons, we propose a deep learning model, YOLOv3, which we trained and tested on our data set (no public teeth data set was available). The process of dataset collection and making our own custom dataset is a prominent strength of the proposed tooth abnormality classifier system. The dataset contains 800 panoramic X-rays of teeth with various tooth diseases. After image enhancement, also known as augmentation, various image variations such as horizontal flip, vertical flip, shear range, and zoom range meant that the number of images is increased to 1200. The limitation of this method is that the sample size for only four types of disorders restricted hospital data and was not representative of the overall population. The proposed methodology obtained the highest accuracy, 99.33%. The following are the primary contributions of the proposed work:
- The first step was to prepare and enhance the dataset. A limited dataset with 116 images is available on Kaggle for dental disease detection. For the study of dental diseases, a unique dataset was created. An expert BDS doctor performed data labelling for this domain’s data set processing. The datasets contain four different types of classes. During this phase, an OPG dataset of various patients was collected from three clinics. The dataset contains 800 panoramic X-rays of teeth with various tooth diseases. We performed the augmentation process, which includes various image variations such as horizontal flip, vertical flip, shear range, and zoom range. Finally, image annotation was performed with the LabelImg tool, which generated an annotated file in.txt format for each image.
- The second phase entailed training the dataset with the deep learning model YOLO (you only look once) version 3. We utilised this model by using sets of 800 images, 1000 images, and 1200 images. The best results were achieved after augmentation to 1200 images.
- The remainder of the paper is structured as follows. Section 2 examines previous research on dental diseases, Section 3 covers the study methodology and architecture of the proposed strategy, and Section 4 describes the experimental setup and outcomes. The final portion reviews the findings and prospects for further study.
2. Related Work
Dental informatics has developed many teeth segmentation strategies using contrary radiography images such as panoramic imaging, bitewing, and periapical images [14]. In [15], the authors compare ten segmentation algorithms used in dental imaging. To achieve instance segmentation, the authors of the work presented in [16] offer a method for tooth instance segmentation in panoramic pictures utilising a “mask region-based convolution neural network (CNN)”. The bounding box is drawn around the teeth, and the teeth are segmented in the last phase. The disadvantage of this procedure is that it concentrates solely on tooth detection, ignoring other issues like dentures and areas from where teeth are missing. DeNTNet, a deep neural transfer network that identifies the tooth disease named periodontal bone loss, or PBL, using panoramic dental radiographs, was proposed in [17]. Several convolutional neural networks were trained as part of the detecting procedure. To begin, training was done to extract teeth from the region of targeted interest with the help of a segmentation network; after that, forecasting periodontal bone loss lesions was done via a segmentation network. DeNTNet has the advantage of providing information about corresponding teeth numbers impacted by PBL according to the notation of the dental federation. Still, the disadvantage of this approach was detecting only this dental disease. For identifying and recognising a certain person after death, the authors of [18] offer a method by comparing a database of dental radiographs based on a set of unique traits with the postmortem of dental radiograph. For a modest image database, the results of this technique are promising, but human intervention is essential for configuring the algorithm settings and repairing any errors that may emerge. Zhang et al. [19] employed deep learning using the methodology for recognising and identifying teeth in dental periapical radiographs. Tooth loss, rotting teeth, and filled teeth, typical dental disorders in patients, were identified by combining fully convolutional neural networks based on the region (R-FCN) and faster R-CNN. The authors of [20] presented another technique that involves feeding and building features into a perceptron neural network which would be multi-layer with the goal of dental caries detection. The authors of [21] use two models of multi-sized CNN to recognise and classify teeth present in the dental panoramic radiographs to automatically structure the filing of dental charts. The testing data set achieved good object detection network accuracy by using a four-fold cross-validation procedure.
However, these approaches are simply concerned with teeth detection, not with the issues of classifying each of their faces. In their study, Fukuda et al. use CNNs to detect vertical root fracture (VRF) in panoramic radiographs [22]. The CNN used was created with Detect Net five-fold cross-validation, and DIGITS version 5.0 was employed to improve model dependability.
Lee et al. [23] used a deep convolutional neural network to analyse the radiographs and calculate each tooth’s radiographic bone loss (RBL). The RBL%, staging, and presumptive diagnosis of the revised CNN periodontitis classification were compared to the findings of independent examiners
The neural network achieved an accuracy rate of 85%. Neural networks may be valuable for evaluating radiographic bone loss and generating image-based periodontal diagnostics [24].
Artificial intelligence may be used to reveal dental restorations. AI may be applied in restorative dentistry to identify and categorise dental restorations, as demonstrated in a study from 2020 by Abdalla-Aslan R et al. On 83 panoramic photos, the algorithms utilised in their research identified 93.6% of dental restorations. In addition, restorations were categorised into 11 groups using the distribution and form of the grey values [25].
Convolutional neural networks were used by Krois et al. to analyse panoramic radiographs and identify periodontal bone loss as a proportion of the length of the tooth root. The outcomes were contrasted with the findings of six skilled dentists’ measurements. When it came to identifying periodontal bone loss, the CNN performed better than dentists (83%) in terms of accuracy and reliability (80%) [26].
Chang et al. [27] used panoramic images and convolutional neural networks to detect periodontal bone level (PBL), cementoenamel junction level (CEJL), and teeth in order to produce a periodontitis stage diagnosis.
The bone loss percentage was estimated and categorised by an automated system in the study by Jun-Young Cha et al. This technique can be used to gauge how severe peri-implantitis is [28].
Convolutional neural networks were utilised in a study by Byung Su Kim et al. to forecast if third molar extraction could result in inferior alveolar nerve paresthesia. Lower third molar extraction is one of the most common dental surgical procedures. Following the removal of a mandible wisdom tooth, the nerve may experience paresthesia. Prior to the extraction, panoramic pictures were taken, and CNN used the relationship between the nerve canal and tooth roots to forecast the likelihood of nerve paresthesia. Future research is required since, according to scientists, using two-dimensional pictures as panoramic radiography may produce more false positive and false negative outcomes [29]. All existing techniques for the dental diseases are discussed in Table 1.

Table 1.
Existing models for dental diseases.
3. Proposed Methodology
This research proposes a deep neural network model YOLOv3 for dental issue classification. The proposed method uses the orthopantomography panoramic teeth X-ray dataset to identify different dental disorders. The proposed architecture’s work is described as follows.
The Proposed Architecture
This section explains the flow of our proposed system. The first step in our research was to collect the dataset we needed. After obtaining the dataset, it went through the preprocessing phase. It was further filtered where augmented and annotated, and images containing useless data are excluded. After preprocessing, it was divided into training and test segments and compressed before being uploaded to the drive. The Google Collab notebook was set to GPU, and the Dark Net repository was imported. Google Drive was mounted with Collab. A special folder called ‘YOLOv3′ was created in Google Drive, containing all necessary data. Other files that are required for coding were created. These files were called train.txt and were generated by Python code for a list of training images. For the test images, the same file was created. Another file was created with the names of all teeth classes. Another file was created that contains the links to all the files required for our work. All of these files, as well as the processed dataset, were imported into Google Collab. The training phase started, containing 8000 iterations. After 1000 iterations, a weight file was saved in Google Drive’s backup folder. The best result in the weight file and the final weight files were also stored for later evaluation. Weights were obtained and evaluated using performance evaluation metrics. These are the mean average precision (mAP), F1-score, recall, and IOU parameters (intersection over union). The proposed architecture’s workflow is illustrated in Figure 1.
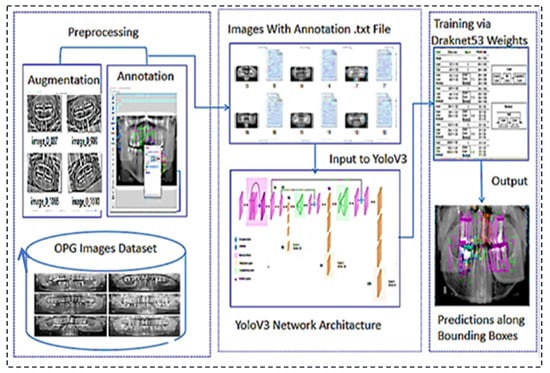
Figure 1.
Proposed architecture’s workflow for the teeth diseases classification.
4. Materials and Methods
In this section, all the steps are explained in detail. The first step is dataset collection, the second step is image augmentation, the third step is image annotation with the help of a labelling tool and lastly, training of the proposed mode with the help of YOLOv3.
4.1. Dataset Collection
The dataset contains OPG dental panoramic X-rays collected from clinics. Some OPGs were taken with a DSLR camera, whereas others were obtained from clinics in soft form. All the images are high resolution. The custom dataset contains 1200 images of patients ranging in age and teeth problems. The Figure 2 show our custom dataset:
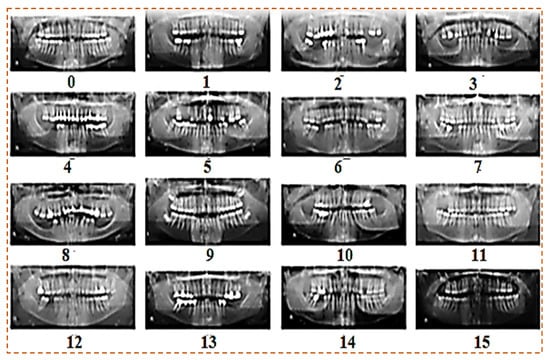
Figure 2.
Custom dataset of panoramic X-rays.
4.2. Image Augmentation
Augmentation is the process of increasing the size of a dataset to meet our needs. We collected approximately 800 images from various clinics. Following that, we used some augmentation functions to increase the number of images. We ended up with 1200 images in total. Custom dataset after augmentation are shown in Figure 3. We used the image data generator function for augmentation with the following parameters:
- Rotation range
- Zoom range
- Shear range
- Horizontal flip
- Vertical flip

Figure 3.
Custom dataset after augmentation.
4.3. Image Annotation
One of the significant concepts in deep learning is image annotation, by which we labelled specific parts of images for training the model. The YOLOv3 model, which accepts annotation files in “txt” format, was used. The image and the annotation file must be saved in the same archive. Each row in the annotation file represents a single bounding box in the image and includes the information listed below.
“<Object-class-id> <center-x> <center-y> <width> <height>”
These parameters are explained as follows:
- Objects-Class-Id: an int-type value that shows a class. The range of object-class-id is 0 to the number of classes−1. We have a total of 4 classes, so the range of object-class-id is 0 to 3.
- Center-x & Center-y: the center-x and center-y are the “center coordinates” of the bounding box.
- Width and Height: these are the dimensions of the bounding box.4.4 LabelImg.
LabelImg is a free open-source tool for graphically labelling images. It is written in Python and has a QT-based graphical user interface. It is a quick and simple method for labelling a few hundred images for object detection. Labeling process with LabelImg is shown in Figure 4.
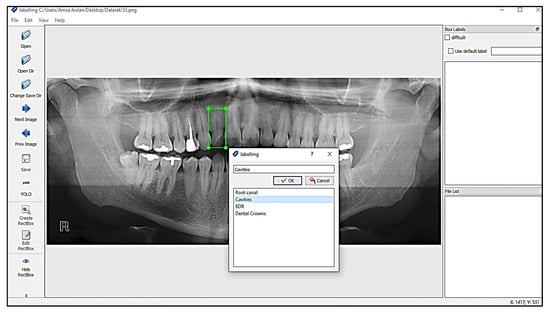
Figure 4.
Labeling process with LabelImg.
Annotations were stored in the PASCAL VOC format as XML files which ImageNet uses [30]. It also supports the YOLO and Create ML formats. The annotation file for YOLO in .txt format is shown in the Figure 5:
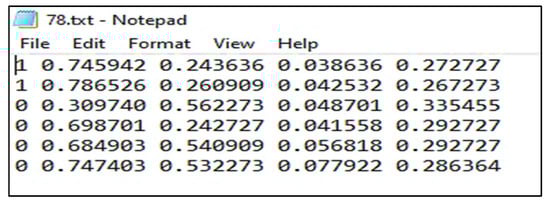
Figure 5.
Annotation file in .txt format.
4.4. Yolo (You Only Look Once)
J. Redmon et al. were the first to use YOLO in 2015. YOLOv1, YOLOv2, and YOLOv3 are three types of object detectors and classifiers. YOLOv1 has a problem with localisation and recall values that are not as good as the other models. YOLOv2 is entirely based on the CPU and requires more time to train. YOLOv3 was implemented in May 2018 [31]. It is a cutting-edge detector that produces better results in terms of speed and accuracy and is intended for GPU use. We used YOLOv3, by implementing its dark net framework, because of its performance and better results. YOLOv3′s detection procedure differs from that of other models. It only takes an image and sends it to the network once for further processing. The image is divided into S × S grid cells. Every grid cell’s responsibility is to predict the object centred in that grid cell and its bounding boxes, using their confidence scores. Confidence scores look at how likely objects are to exist and how confident they are in their prediction. In each grid cell, the conditional class probabilities should be observed. It is made up of 24 Conv layers and two fully connected layers. Some layers assemble the initial module, beginning with 1 × 1 reduction layers and progressing to 3 × 3 convolutional layers [32]. We used the dark net framework to put YOLO together. There are 53 network layers in the dark net. The residual block is a new type of block used by Darknet-53. Deep neural networks are difficult to train. As the network’s depth increases, the network’s accuracy can become saturated, resulting in increasing training error. The residual block was created to alleviate this issue. In terms of architecture, the insertion of a skip connection distinguishes the conventional convolution block from the residual block. The skip connection moves the input to higher layers. To avoid diminishing gradient issues as assistant activations spread across deeper layers, the Reset introduced the concept of skip connection. Overlapping layers will not impact network performance thanks to ResNet’s residual blocks. The structure of the dark net is elaborated in the following Table 2:
Table 2.
Structure of the Darknet 53.
4.5. Custom Configuration File
Training requires the configuration file. Convolutional layers, YOLO masks, and other parameters are included. It was obtained from a darknet website. The configuration file must meet our specifications.
- Batch: the batch parameter specifies the batch size used in training. There are 1200 images in our dataset. During the training process, the neural network is iteratively updated. It is impossible to update weight in training using all images at once. As a result, the set of images is used in a single iteration known as batch size.
- Subdivisions: if the batch size is set to 64 and the GPU does not have enough memory for training, Darknet allows you to set off the subdivision’s parameters by multiples of two, such as 2, 4, 8, 16, 32 until the training process is complete.
- Width, Height, Channel: the input image is resized in width and height before training. The resized image’s default size is 416 × 416. The results will be better if we increase the size, but training will take longer. The channel specifies whether the input image for training is grayscale or RGB.
- Learning rate, Steps: the learning rate governs how quickly the model adapts to the problem. The learning rate ranges from 0.01 to 0.0001. The learning rate is high at first, but it should gradually decrease. Decreasing of learning rate is specified in steps.
- Max batches, Classes: this defines the number of iterations that will be done on the training dataset. The number of iterations is set by the following formula 2000 * Classes. In our case, we have four classes, so we should train the dataset in at least 8000 batches.
- Filters: the filters of convolutional layers following the YOLO mask are set according to formula 3 * (5 + Classes). In our case, we have 30 filters.
- We made some changes to the configuration file parameters shown in Table 3.
Table 3. Parameters of the custom configuration file.
5. Results and Discussion
In this section, we will evaluate the performance of our intended model, YOLOv3. The model will be tested on a panoramic X-ray dataset, as described in the document’s first section. Now, however, we will only discuss the experimental results obtained after applying the YOLOv3 model to a dataset of tooth OPGs. The model’s setup is explained in this section. The dataset was annotated on Windows using Python and the LabelImg module. We used Google Collab with Python and Open CV for testing and training. The specification of the Google Collab in Table 4 is given below:
Table 4.
Google Collab Parameters.
We divided the dataset into sections of 70 and 30%. To begin, 70% of the dataset was used for training, while the other 30% of the dataset was used for testing. It was gathered in a folder and then compressed into a zip file. The file was uploaded to Google Drive for training and testing purposes.
The following section contains information about training outcomes. We use graphs and tables to display results for mAP, F1-Score, precision, recall, and IOU metrics. The total number of training iterations is 8000. After 1000 iterations, we displayed the values of all parameters. The proposed method outperforms existing state-of-the-art methods in terms of accuracy and universality. It has a wide range of applications in computer-assisted tooth treatment and diagnosis. Following training, the trained model YOLOv3 was tested on test images and achieved 99.33%.
5.1. Performance Evaluation
Criteria regression models are evaluated based on the mean average percentage. Precision, recall, accuracy, and F1 score are used to evaluate classification model performance. The object detection model’s goal is to classify and localise an object in an image. In our case, we must estimate the classification and localization performance. We will evaluate our model using the following parameters: mAP, recall, precision, F1- Score, and IOU.
- Training mAP (mean average precision): “Taking the mean AP of all classes or overall IOU thresholds” yields the mAP.
- F1-Score: The F1 score is calculated as given below. The different values by using different iterations are shown in Figure 6.
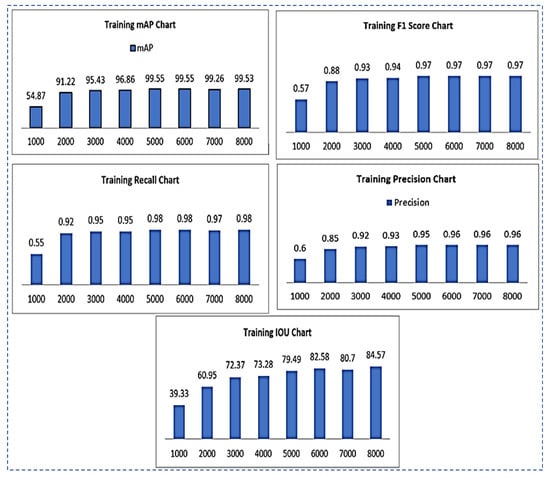 Figure 6. Training results chart representation for mAP, F1-Score, recall, precision, IOU.
 - Sensitivity/Recall: The recall can be calculated as in Equation (3). The recall values of using different iterations are shown in Figure 6.
- IOU (intersection over union): IOU is used to assess the accuracy of object detectors on a given dataset. It computes the intersection of two bounding boxes’ union. The actual and predicted bounding boxes are:
- Precision: The precision metric displays “the positive class’s accuracy.” It assesses the likelihood that the positive class’s prediction is correct.”
Results of all the training parameters such as F1-score, recall, IOU, precision, and map on the total of 8000 iterations are given in Table 5.
Table 5.
Training results of F1-score, recall, IOU, precision, mAP.
5.2. Testing Results
In this section, we used weight files for testing our dataset. We have a total of 8 weight files that were generated during the training of the dataset every 1000 iterations.
- Testing mAP (mean average precision): the mAP is calculated by “averaging the AP of all classes or overall IOU thresholds”
- Testing F1-Score: the different values of the F1-score of testing using different iterations are shown in Figure 7.
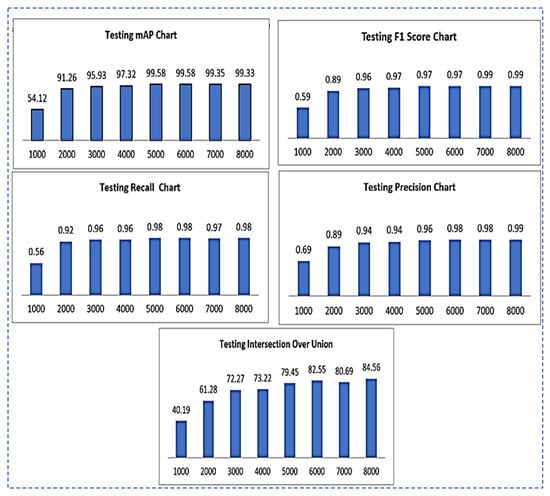 Figure 7. Testing results chart representation for mAP, F1-Score, recall, precision, IOU.
 - TestingRecall: the different values of testing recall by using different iterations are shown in Figure 7.
- Testing Intersection over Union(IOU): IOU values for testing using different iterations are shown in Figure 7.
- Testing Precision: testing precision values using different iterations are shown in Figure 7.
Results of all the testing parameters such as F1-score, recall, IOU, precision and map on the total of 8000 iterations are summarized in the following Table 6.
Table 6.
Testing results of F1-score, recall, IOU, precision, mAP.
- Output Images using the best weight obtained for all teeth diseases are shown in Figure 8.
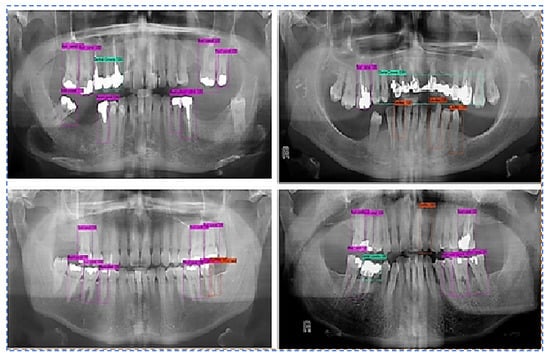 Figure 8. Predictions along bounding boxes using the best weight.
We augmented the data with image rotation and shear range, among other things, to reduce the overtraining effect. The average classification accuracy when using augmented training data was 99.33%. Compared to the result without data augmentation, data augmentation showed a noticeable improvement in classification accuracy. This suggests that expanding the dataset will result in further improvements. Unlike the previous methods, the proposed method achieves high classification accuracy. The comparative study of the proposed model with recent DL models is shown in Table 7.
Table 7.
Comparative study of the proposed model with recent DL models.
6. Conclusions
The most common dental issues from poor oral health care practices are cavities, root canals, dental crowns, and BDR. A dentist can detect potential dental problems by inspecting and gently moving the teeth. Automatic classification of dental conditions based on panoramic X-ray images can assist doctors in making accurate diagnoses. Panoramic dental radiographs are used to detect such tooth problems. To address poor efficiency, the complexity of the experiential operation, and high level of user intervention in existing methods of tooth problem detection, we propose a novel approach based on the deep learning model YOLOv3 for detecting and classifying the four most common tooth problems, namely cavities, root canal, dental crowns, and broken-down root. The availability of labelled medical datasets is a significant challenge in many automated tooth problem detection and classification applications; dental disease datasets are no exception. In this study, we used deep learning to create an automated tool capable of identifying and classifying dental problems on dental panoramic X-ray images (OPG). We created a custom dataset of dental X-rays due to a lack of a dataset. The dataset consists of dental panoramic images from various clinics with dental problems such as cavities, root canals, BDR, and dental crowns, among others. The dataset comprises 70% training images and 30% testing images. The implemented solution was evaluated using several metrics, including intersection over union, precision, recall, and F1-score for generated bounding box detections. The proposed method outperforms existing state-of-the-art methods in terms of accuracy, and has a wide range of applications in computer-assisted tooth treatment and diagnosis. The trained model YOLOv3 was tested on test images after training and achieved an accuracy of 99.33%. In the future, the proposed methodology will be real-time for teeth abnormalities detection. One can create a larger data set containing more teeth disease classes. In addition, the latest version of YOLO or other deep learning and machine learning models would be applied for great results.
Author Contributions
Conceptualization, evaluation, analysis, comparisons, resources, project administration, technical editing, and visualization, Y.E.A., M.I., S.R., H.A.A., G.A., A.A. and S.A.; methodology, A.I.D. and M.R.; software, K.M.A.; validation, K.M.A., investigation, K.M.A. and M.R. All authors have read and agreed to the published version of the manuscript.
Funding
The APC of the journal was paid through the National Research Priorities project sponsored by the Deanship of Scientific Research, Najran University, Kingdom of Saudi Arabia (NU/NRP/MRC/11/21).
Institutional Review Board Statement
Not applicable.
Informed Consent Statement
Not applicable.
Data Availability Statement
The data could be available on request.
Acknowledgments
The authors acknowledge the support from the Deanship of Scientific Research, Najran University, Kingdom of Saudi Arabia, for funding this work under the National Research Priorities funding program grant code number (NU/NRP/MRC/11/21).
Conflicts of Interest
The authors declare no conflict of interest.
References
- Oprea, S.; Marinescu, C.; Lita, I.; Jurianu, M.; Visan, D.A.; Cioc, I.B. Image processing techniques used for dental X-ray image analysis. In Proceedings of the 2008 31st International Spring Seminar on Electronics Technology, Budapest, Hungary, 7–11 May 2008; pp. 125–129. [Google Scholar]
- Ossowska, A.; Kusiak, A.; Świetlik, D. Artificial Intelligence in Dentistry—Narrative Review. Int. J. Environ. Res. Public Health 2022, 19, 3449. [Google Scholar] [CrossRef] [PubMed]
- Yu, Y.J. Machine learning for dental image analysis. arXiv 2016, arXiv:1611.09958. [Google Scholar]
- Tuzoff, D.V.; Tuzova, L.N.; Bornstein, M.M.; Krasnov, A.S.; Kharchenko, M.A.; Nikolenko, S.I.; Sveshnikov, M.M.; Bednenko, G.B. Tooth detection and numbering in panoramic radiographs using convolutional neural networks. Dentomaxillofac. Radiol. 2019, 48, 20180051. [Google Scholar] [CrossRef] [PubMed]
- Imangaliyev, S.; Veen, M.H.; Volgenant, C.; Keijser, B.J.; Crielaard, W.; Levin, E. Deep learning for classification of dental plaque images. In International Workshop on Machine Learning, Optimization, and Big Data; Springer: Cham, Switzerland, 2016; pp. 407–410. [Google Scholar]
- Liu, L.; Xu, J.; Huan, Y.; Zou, Z.; Yeh, S.C.; Zheng, L.R. A smart dental health-IoT platform based on intelligent hardware, deep learning, and mobile terminal. IEEE J. Biomed. Health Inform. 2019, 24, 898–906. [Google Scholar] [CrossRef] [PubMed]
- Khan, H.A.; Haider, M.A.; Ansari, H.A.; Ishaq, H.; Kiyani, A.; Sohail, K.; Muhammad, M.; Khurram, S.A. Automated feature detection in dental periapical radiographs by using deep learning. Oral Surg. Oral Med. Oral Pathol. Oral Radiol. 2021, 131, 711–720. [Google Scholar] [CrossRef] [PubMed]
- Tian, S.; Dai, N.; Zhang, B.; Yuan, F.; Yu, Q.; Cheng, X. Automatic classification and segmentation of teeth on 3D dental model using hierarchical deep learning networks. IEEE Access 2019, 7, 84817–84828. [Google Scholar] [CrossRef]
- Casalegno, F.; Newton, T.; Daher, R.; Abdelaziz, M.; Lodi-Rizzini, A.; Schürmann, F.; Krejci, I.; Markram, H. Caries detection with near-infrared transillumination using deep learning. J. Dent. Res. 2019, 98, 1227–1233. [Google Scholar] [CrossRef]
- Prajapati, S.A.; Nagaraj, R.; Mitra, S. Classification of dental diseases using CNN and transfer learning. In Proceedings of the 2017 5th International Symposium on Computational and Business Intelligence (ISCBI), Dubai, United Arab Emirates, 11–14 August 2017; pp. 70–74. [Google Scholar]
- Chen, H.; Zhang, K.; Lyu, P.; Li, H.; Zhang, L.; Wu, J.; Lee, C.H. A deep learning approach to automatic teeth detection and numbering based on object detection in dental periapical films. Sci. Rep. 2019, 9, 3840. [Google Scholar] [CrossRef]
- Silva, G.; Oliveira, L.; Pithon, M. Automatic segmenting teeth in X-ray images: Trends, a novel data set, benchmarking and future perspectives. Expert Syst. Appl. 2018, 107, 15–31. [Google Scholar] [CrossRef]
- Muresan, M.P.; Barbura, A.R.; Nedevschi, S. Teeth Detection and Dental Problem Classification in Panoramic X-ray Images using Deep Learning and Image Processing Techniques. In Proceedings of the 2020 IEEE 16th International Conference on Intelligent Computer Communication and Processing (ICCP), Cluj-Napoca, Romania, 3–5 September 2020; pp. 457–463. [Google Scholar]
- Lee, J.-H.; Han, S.-S.; Kim, Y.H.; Lee, C.; Kim, I. Application of a fully deep convolutional neural network to the automation of tooth segmentation on panoramic radiographs. Oral Surg. Oral Med. Oral Pathol. Oral Radiol. 2019, 129, 635–642. [Google Scholar] [CrossRef]
- Jader, G.; Fontineli, J.; Ruiz, M.; Abdalla, K.; Pithon, M.; Oliveira, L. Deep instance segmentation of teeth in panoramic X-ray images. In Proceedings of the 2018 31st SIBGRAPI Conference on Graphics, Patterns and Images (SIBGRAPI), Parana, Brazil, 29 October–1 November 2018; pp. 400–407. [Google Scholar]
- Kim, J.; Lee, H.S.; Song, I.S.; Jung, K.H. DeNTNet: Deep Neural Transfer Network for the detection of periodontal bone loss using panoramic dental radiographs. Sci. Rep. 2019, 9, 17615. [Google Scholar] [CrossRef]
- Jain, A.K.; Chen, H. Matching of dental X-ray images for human identification. Pattern Recognit. 2004, 37, 1519–1532. [Google Scholar] [CrossRef]
- Liu, X.; Faes, L.; Kale, A.U.; Wagner, S.K.; Fu, D.J.; Bruynseels, A.; Mahendiran, T.; Moraes, G.; Shamdas, M.; Kern, C.; et al. A comparison of deep learning performance against healthcare professionals in detecting diseases from medical imaging: A systematic review and meta-analysis. Lancet Digit. Health 2019, 1, e271–e297. [Google Scholar] [CrossRef]
- Zhang, K.; Wu, J.; Chen, H.; Lyu, P. An effective teeth recognition method using label tree with cascade network structure. Comput. Med. Imaging Graph. 2018, 68, 61–70. [Google Scholar] [CrossRef]
- Schwendicke, F.; Golla, T.; Dreher, M.; Krois, J. Convolutional neural networks for dental image diagnostics: A scoping review. J. Dent. 2019, 91, 103226. [Google Scholar] [CrossRef]
- Johari, M.; Esmaeili, F.; Andalib, A.; Garjani, S.; Saberkari, H. Detection of vertical root fractures in intact and endodontically treated premolar teeth by designing a probabilistic neural network: An ex vivo study. Dentomaxillofac. Radiol. 2017, 46, 20160107. [Google Scholar] [CrossRef]
- Fukuda, M.; Inamoto, K.; Shibata, N.; Ariji, Y.; Yanashita, Y.; Kutsuna, S.; Nakata, K.; Katsumata, A.; Fujita, H.; Ariji, E. Evaluation of an artificial intelligence system for detecting vertical root fracture on panoramic radiography. Oral Radiol. 2020, 36, 337–343. [Google Scholar] [CrossRef]
- Lee, C.T.; Kabir, T.; Nelson, J.; Sheng, S.; Meng, H.W.; Van Dyke, T.E.; Walji, M.F.; Jiang, X.; Shams, S. Use of the deep learning approach to measure alveolar bone level. J. Clin. Periodontol. 2022, 49, 260–269. [Google Scholar] [CrossRef]
- Pakbaznejad Esmaeili, E.; Pakkala, T.; Haukka, J.; Siukosaari, P. Low reproducibility between oral radiologists and general dentists with regards to radiographic diagnosis of caries. Acta Odontol. Scand. 2018, 76, 346–350. [Google Scholar] [CrossRef]
- Abdalla-Aslan, R.; Yeshua, T.; Kabla, D.; Leichter, I.; Nadler, C. An artificial intelligence system using machine-learning for automatic detection and classification of dental restorations in panoramic radiography. Oral Surg. Oral Med. Oral Pathol. Oral Radiol. 2020, 130, 593–602. [Google Scholar] [CrossRef]
- Krois, J.; Ekert, T.; Meinhold, L.; Golla, T.; Kharbot, B.; Wittemeier, A.; Dörfer, C.; Schwendicke, F. Deep Learning for the Radiographic Detection of Periodontal Bone Loss. Sci. Rep. 2019, 9, 8495. [Google Scholar] [CrossRef]
- Chang, H.-J.; Lee, S.-J.; Yong, T.-H.; Shin, N.-Y.; Jang, B.-G.; Kim, J.-E.; Huh, K.-H.; Lee, S.-S.; Heo, M.-S.; Choi, S.-C.; et al. Deep Learning Hybrid Method to Automatically Diagnose Periodontal Bone Loss and Stage Periodontitis. Sci. Rep. 2020, 10, 7531. [Google Scholar] [CrossRef]
- Cha, J.-Y.; Yoon, H.-I.; Yeo, I.-S.; Huh, K.-H.; Han, J.-S. Peri-Implant Bone Loss Measurement Using a Region-Based Convolutional Neural Network on Dental Periapical Radiographs. J. Clin. Med. 2021, 10, 1009. [Google Scholar] [CrossRef]
- Kim, B.S.; Yeom, H.G.; Lee, J.H.; Shin, W.S.; Yun, J.P.; Jeong, S.H.; Kang, J.H.; Kim, S.W.; Kim, B.C. Deep Learning-Based Prediction of Paresthesia after Third Molar Extraction: A Preliminary Study. Diagnostics 2021, 11, 1572. [Google Scholar] [CrossRef] [PubMed]
- Krizhevsky, A.; Sutskever, I.; Hinton, G.E. Imagenet classification with deep convolutional neural networks. Adv. Neural Inf. Process. Syst. 2017, 84–90. [Google Scholar] [CrossRef]
- Redmon, J.; Farhadi, A. Yolov3: An incremental improvement. arXiv 2018, arXiv:1804.02767. [Google Scholar]
- Geetha, V.; Aprameya, K.S.; Hinduja, D.M. Dental caries diagnosis in digital radiographs using back-propagation neural network. Health Inf. Sci. Syst. 2020, 8, 8. [Google Scholar] [CrossRef] [PubMed]
- Muramatsu, C.; Morishita, T.; Takahashi, R.; Hayashi, T.; Nishiyama, W.; Ariji, Y.; Zhou, X.; Hara, T.; Katsumata, A.; Ariji, E.; et al. Tooth detection and classification on panoramic radiographs for automatic dental chart filing: Improved classification by multi-sized input data. Oral Radiol. 2021, 37, 13–19. [Google Scholar] [CrossRef]


Publisher’s Note: MDPI stays neutral with regard to jurisdictional claims in published maps and institutional affiliations. |
© 2022 by the authors. Licensee MDPI, Basel, Switzerland. This article is an open access article distributed under the terms and conditions of the Creative Commons Attribution (CC BY) license (https://creativecommons.org/licenses/by/4.0/).