Abstract
A large number of power meters have become commercially available during the last decades to provide power output (PO) measurement. Some of these power meters were evaluated for validity in the literature. This study aimed to perform a review of the available literature on the validity of cycling power meters. PubMed, SPORTDiscus, and Google Scholar have been explored with PRISMA methodology. A total of 74 studies have been extracted for the reviewing process. Validity is a general quality of the measurement determined by the assessment of different metrological properties: Accuracy, sensitivity, repeatability, reproducibility, and robustness. Accuracy was most often studied from the metrological property (74 studies). Reproducibility was the second most studied (40 studies) property. Finally, repeatability, sensitivity, and robustness were considerably less studied with only 7, 5, and 5 studies, respectively. The SRM power meter is the most used as a gold standard in the studies. Moreover, the number of participants was very different among them, from 0 (when using a calibration rig) to 56 participants. The PO tested was up to 1700 W, whereas the pedalling cadence ranged between 40 and 180 rpm, including submaximal and maximal exercises. Other exercise conditions were tested, such as torque, position, temperature, and vibrations. This review provides some caveats and recommendations when testing the validity of a cycling power meter, including all of the metrological properties (accuracy, sensitivity, repeatability, reproducibility, and robustness) and some exercise conditions (PO range, sprint, pedalling cadence, torque, position, participant, temperature, vibration, and field test).
1. Introduction
Power output (PO) [1] measurement during riding is an interesting method to quantify the intensity of exercise produced by cyclists or patients. This measurement is widely used in cycling during training and monitoring [2,3,4,5,6,7] to test or validate mathematical models [8,9,10,11,12,13,14,15,16,17,18], assess the physical potential of cyclists [19,20,21,22,23,24] or measure performance requirements in competitions [25,26,27,28,29,30,31]. In addition, the PO measurement can be used for many research purposes to quantify the effects of rehabilitation programmes [32] or evaluate the fitness level improvement induced by medical treatments, recovery techniques, and many other approaches [33,34,35].
Recently, many systems have become commercially available to provide the PO measurement based on ergometers, home-trainers or mobile systems mounted on personal bikes. Due to the large interest in measuring PO, the list of systems available for this purpose is very exhaustive (including the SRM crankset or pedales, Monark ergometer, PowerTap hub, pedals and chainring, Garmin Vector or Rally pedals, Stages crank arm, Lode Excalibur ergometer, CycleOps-Saris trainer, Cyclus ergometer, Verve Crankset, Shimano Power crankset, 4iiii, Favero pedales, Tacs trainer, Elite Trainer, Rotor INpower cranckset, Look KeoPower Pedales, Quarq crankset, etc.). The validity of power meters is of interest to different potential users. For example, mobile power meters were mainly used by professional cyclists for nearly 25 years. Today, we can observe that all of the WorldTour men’s teams are using power meters, 10 use Shimano power meters, whereas six different power meters (SRM, Power2max, 4iiii, Stages, Quarq, and Rotor) were used by the remaining nine teams. In addition, based on the popularity in the highest level, mobile power meters are actually used by many recreational cyclists. Due to the large number of potential users, manufacturers developed systems and established claims regarding their system’s validity. The validity of power meters has also been tested in scientific research to provide more details regarding their metrological properties (i.e., accuracy, sensitivity, repeatability, reproducibility, and robustness). However, a major problem is that not all of the metrological properties are investigated in most of the studies. Indeed, the studies included only some properties of the power meters and did not provide very relevant information for the end user. Moreover, it is not always easy to make the link between the statistical analyses and the metrological properties studied.
Some misunderstandings are notable from the technological description of systems leading to inappropriate protocols or mistakes during measurement. It is important to clearly understand what is really measured by these systems and the technology used to stress these systems, as well as incorporate all of the recommendations from the manufacturer as calibration and/or offset processes to obtain meaningful data. For example, the SRM system has become the gold standard for power meters to assess the validity of other mobile power meters [36,37,38] or home-trainers [39,40]. Regarding articles focusing on ergometers, various systems are considered to be gold standard systems, such as the calibration rig (Tom, Stanef, SASI, Australia) [41,42], homemade systems [43,44] or metabolic measurement devices [45]. All of these testing processes induce various results that do not result in similar information from each system. In addition, the data analysis of all the studies is not similar regarding periods of measurement, averaging or statistical methods used to compare the results to the gold standard technique. Data analysis and statistical analysis are very important for comparing two systems and directly influence conclusions regarding the validity of the system. Even if the methods of Bland and Altman [46] are perfectly adapted for these issues, many different ways to perform this data analysis have been discussed in the literature.
Previous studies have proposed several conditions to assess the validity of power meters by studying different metrological properties implementing different protocols, data analysis, and testing the responses of the systems according to different exercise conditions (i.e., PO range, sprint, pedalling cadence, torque, position, participant, temperature, vibration or field test) that can directly affect the results and conclusions. No study provides a clear overview regarding the validity of the power meters in all of these conditions. Our own experience over the last decade in power meter testing pointed out that testing situations, methods or environmental conditions, such as temperature or vibration can lead to misinterpretation of confidence that we can get from the devices. Therefore, this review aims to provide caveats and recommendations to assess the validity of cycling power meters, while taking into account all of the metrological properties that should be studied.
2. Methods
When performing measurements with power meters, it is legitimate to question the validity of the meters. Validity is commonly defined as the degree to which the devices measure what they are expected to measure [47,48,49]. Applied to cycling, validity is the general quality of the measurement determined by the assessment of different metrological properties, including accuracy, sensitivity, repeatability, reproducibility, and robustness [50]. Accuracy is the ability of power meters to reflect what it is designed to measure [49] or how close the values that are obtained are to the true value. It can be assessed by comparing measurements obtained using a given power meter with measurements obtained using a gold standard power meter. The expected PO and its accuracy can vary according to the location of the power meter on the bicycle. According to the standard instructions of calibration recommended by the manufacturers, the highest PO would be measured at the pedals (e.g., Garmin Vector, PowerTap P1), whereas the lowest PO would be measured at the rear hub (e.g., PowerTap G3, Max One) considering the mechanical losses in the bicycle components (Figure 1) [51]. Frictional losses from the drive train dissipate some of the PO. Indeed, a difference in simultaneous PO measurements should be found before and after the drive train since the data were not compensated during the signal processing. Drive train frictional losses are proportional to the PO and have been suggested to be ~2.4% [8,52].
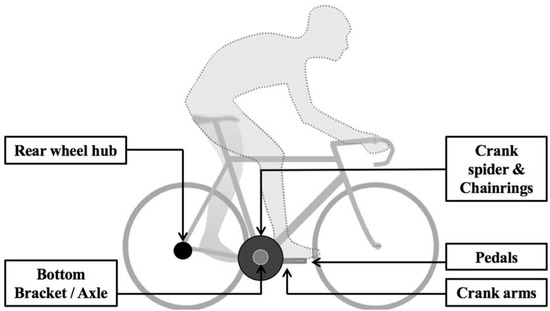
Figure 1.
Schematic illustration of power meters’ location on the bicycle.
Sensitivity can be determined as the smallest measurement change that can be detected by the power meter. It is also the ability to detect changes in performance, which may be very small but still meaningful to athletic performance [49]. Sensitivity is a parameter expressing the variation between input and output signals measured by the power meter that can be improved by increasing (1) the number of strain gauges and their location [53] and (2) the sampling frequency. The relationship between both input and output signals is represented by a linear regression most of the time. Moreover, most of the commercially available power meters measure pedalling cadence simply by detecting the complete hub or crank rotations. As a result, when pedalling cadence is low or changes notably within a single rotation (as for a sprint), the power meter’s sensitivity may be affected [2], considering that the pedalling cadence variation is not measured accurately.
Repeatability refers to the variation in repeating measurements with the same power meter under similar conditions [54]. Repeatability implies that the measurements are made under similar conditions with the same equipment, the same place, the same technician, and the same day. In addition, the measurements are made over a short period of time [55], in which the underlying PO can be considered constant. The measurement variations obtained by the same power meter can be ascribed to the measurement process itself.
Reproducibility refers to the variation in measurements made on a power meter under changing conditions [51,54]. The changing conditions may be due to different methodologies (e.g., variations in technicians, equipment, time of day, place, ambient temperature, and innumerable other factors that are not known or cannot easily be controlled) or measurements that are made over a long period of time, within which the PO could undergo a non-negligible change. Reproducibility will be larger than repeatability since it includes components of variance that repeatability does not. A prior estimate of reproducibility is essential when the primary outcome of a study is a quantitative measurement.
Both reproducibility and reliability can also be described in the literature by “reliability”. We can find this terminology in different situations in order to present with-in session reliability as repeatability or with-in device reliability as reproducibility and many other conditions as cadence, ageing, etc.
Finally, robustness is the ability of power meters to remain unaffected by small variations in experimental factors [51]. Therefore, the power meters can be used without failure for a period of time of at least one competitive season (reliability, which can be defined as the consistency of measurements or “the absence of measurement error” [49,56]. In addition, it is the ability to be reliable over time. Many studies assess the validity of cycling power meters at a single moment, usually when the products are new.
In order to identify the articles that are focused on the validity of power meters and to manage this review, we used the Preferred Reporting Items for Systematic reviews and Meta-Analyses (PRISMA) methodology [57,58]. This present review was not pre-registered.
2.1. Eligibility Criteria
The main eligibility criteria include all of the studies or conference papers that aim to investigate the metrological proprieties (accuracy, sensitivity, repeatability, reproducibility or robustness) of cycling power meters or ergometers measuring PO for sport, medical or research purposes. Studies were included if (1) they are written in English; (2) they provide a clear methodological content with statistical approaches and gold standard device or method; (3) the full text was obtained to permit effective screening.
2.2. Literature Search
A Boolean/phrase search mode was used in the search engine in all of the fields with the following keywords: “Cycling power meter” OR “ergocycle” OR “ergometer” AND “validity” OR “reliability” OR “accuracy” OR “sensitivity” OR “repeatability” OR “reproducibility” OR “robustness” in three different search engines: PubMed, SPORTDiscus, and Google Scholar. The research ended on 10 November 2021.
2.3. Studies Filtering and Screening Process
The data extraction process was performed in duplicate on a Microsoft Excel spreadsheet (Microsoft, Redmond, DC, USA) and 4111 items were collected. All of the duplicated references were removed to obtain 2939 items. Based on the criteria described previously, two reviewers (A.B. and J.C.) pre-screened the title and summary in order to obtain a list of the full texts that should be included in the screen list. The screening, which was operated by J.C. and A.B., yielded six additional references from the reference list of screened full texts.
3. Results
An important review of the literature listed many studies (74) that were aimed at assessing the validity of PO measurement devices (Table 1). This review provides an exhaustive list of where manufacturers perform PO measurements, including the pedal(s) (e.g., Garmin Vector, PowerTap P1), crank arm(s) (e.g., Stages), spider crank (SRM), chainrings (e.g., PowerTap C1), chain (e.g., Polar S710), bottom bracket axle (e.g., Rotor, InPower), rear hub (e.g., PowerTap G3, MaxOne), home-trainers (e.g., CycleOps, Powerbeam, Wahoo, Elite), and ergometers (e.g., Monark, Lode). All of the systems included their own technology regarding the PO measurement. Moreover, the protocols were very heterogeneous and included different metrological properties, gold standard systems, statistical analyses or exercise conditions. Among the five metrological properties defined in the Methods Section, accuracy was the most studied property (74 studies). Reproducibility was the second-most studied metrological property (43 studies). Finally, repeatability, sensitivity, and robustness were studied considerably less with only 7, 5, and 5 studies, respectively, published in the literature. From our point of view, it is important to investigate the validity of power meters by assessing five essential metrological properties. Unfortunately, we can observe that this recommendation was not followed in the majority of studies. Regarding the gold standard systems, the most common power meter was the SRM. Indeed, the SRM was the reference device in 31 studies. Eleven studies were conducted in the field, whereas all of the remaining studies were performed in a laboratory. Among these 11 studies, five combined both field and laboratory protocols to increase the number of measurements. In addition, the number of participants was very different between all of the studies, from 0 (when using a calibration rig) to 56 participants. In all of the studies that were reviewed, the PO tested was up to 1700 W, whereas the pedalling cadence ranged between 40 and 180 rpm, including the submaximal and maximal exercises. Other exercise conditions have been tested, such as torque, position, temperature or vibrations that will be described later in this article. Finally, the approach for averaging data was also different between the studies, which made the comparisons between the studies difficult. In addition, the 1-s peak PO were often used during the sprint tests.

Table 1.
Overview of the studies included in this review.
Among the 74 studies listed, 33 examined the validity of ergometers. The majority of medical bikes measured PO based on the flying wheel resistance, pedalling cadence, and gear. Friction-braked (e.g., Monark), air-braked (e.g., Kingcycle) or electromagnetically braked ergometers (e.g., Lode) can apply theoretical brakes computed from the rotation speed of the flying wheel. The angular velocity of the wheel is different from the pedalling cadence depending on the gear, which is why manufacturers integrate this element into the calculations. For those kinds of bikes, mechanical brakes with a friction belt on the flywheel (e.g., Monark) are very popular, but suffer from many limitations due to the frictional loss as well as the pendulum error of measurement. Ergometers with electromagnetic brakes are probably the best represented category with many medical brands, such as Shiller, Ergoline, Custo, Lode, General Electric, etc. In addition, very few studies report information regarding the validity of these bikes for several reasons. First, it was not easy to install a gold standard system on these ergometers in order to perform simultaneous measurements. Second, these bikes were designed to assess patients and do not fit a cyclist’s requirements for the rider position, saddle, and pedals.
4. Discussion
The main findings of this review show that various technology and heterogeneous protocols were reported among the studies, including different metrological properties, gold standard systems, statistical analyses, and exercise conditions. The following sections will discuss the technological description of power meters, protocols, and data analysis, as well as exercise conditions.
4.1. Technological Description of Power Meters
Mobile power meters can use different technological components to obtain PO. Regarding force, the systems available on the market mainly use strain gauges, and also resonant string gauges. Regarding angular velocity, manufacturers mainly use magnetic sensors to count the number of passages in front of magnet(s). According to the design of systems, various numbers of magnets are used to obtain a higher sampling frequency on a single revolution (e.g., SRM: 1; Cyclus: 4; PowerTap P1: 20). Finally, several devices measure angular velocity with accelerometers (e.g., Garmin vector, G-Cog). Technological conception is very important since each element will be affected by exercise conditions.
Strain gauges can transform micro-strains into electric resistance variation [122]. Those sensors are pasted on the mechanical part where force is applied. Generally, they are installed in pairs perpendicularly to obtain deformations in two axes. The number of strain gauges on a power meter can be different considering the design of the mechanical part and the accuracy that is expected [53] (e.g., 4–20 strain gauges are used in SRM, depending on the model). From those sensors, an electric signal is filtered and processed to obtain force, while considering the characteristics of the mechanical part. To obtain accurate measurements, several parameters, such as temperature, have to be integrated to adjust calculations. Moreover, calibration (slope adjustment + offset) must be done regularly to adjust the initial deformation of the material over time. The number of strain gauges, the design of the mechanical parts, data processing, and dynamic calculation adjustment play a major role in the accuracy of torque measurements provided by this kind of technology. Alternatively, resonant string gauges can be found in power meters to measure the force at the pedal (e.g., Garmin vectors). This technology is different from strain gauges, even if it provides the same information. Measurements are performed by considering the vibration induced by strain from the mechanical parts. In the same manner as strain gauges, this technology will be affected by signal filtering and processing, as well as temperature.
Regarding angular velocity, the majority of systems measure the time elapsed during a revolution or part of a revolution if several magnets are used. The number of magnets affects the sampling rate of angular velocity and can be a limiting factor during a low rate. In addition, several manufacturers use multi-pole magnets (North–South) to obtain double-point measurements (e.g., PowerTap P1). A higher number of magnets permits the detection of the angular position of sensors to provide a pedalling pattern when computed with the torque. Then, the angular velocity can be determined with an accelerometer (e.g., Garmin Vector and G-Cog). This technology makes it possible to obtain an angular velocity on each point of the revolution. Manufacturers use this advanced technology less due to data filtering. In addition, processing is very important and leads to some limitations. Finally, for a very important pedalling cadence or vibration, systems can be saturated and produce erroneous data.
4.2. Protocols and Data Analysis
4.2.1. Simultaneous and Averaging PO Measurement
In this review, 74 studies compare PO measurement systems with gold standard systems to investigate system accuracy (Table 1). Nevertheless, 41 and seven studies investigated reproducibility and repeatability in several consecutive trials. In this situation, the measurement variability cannot be fully attributed to power meters, but it can be attributed to the test and retest variation of participants. This kind of protocol can provide perspectives on using the system, but will not lead to relevant information regarding reproducibility and repeatability.
In addition, some studies compared different ergometers using metabolic measurement devices [45,61,82]. Given that potential PO measurements were obtained with different medical bikes, this kind of protocol could be very helpful for rescaling the training programme according to our goal [123]. Nevertheless, the indirect comparison with another value, such as the oxygen consumption (VO2) measurement, could not clearly indicate the level of validity. In those situations, the differences are related to the PO measurement system, participants or metabolic measurements. Using a large sample, overestimation or underestimation can be described if the difference is large enough.
From our point of view, only the simultaneous PO measurement with a system and a gold standard can permit the evaluation of the accuracy of a power meter. In this situation, it is possible to provide quantitative information regarding accuracy. Regarding statistical methods, the Bland and Altman [46,124] method is the most appropriate method to assess accuracy between two measurement systems measuring the same variables. Nevertheless, the simultaneous measurement of PO is not easy regarding synchronization. Studies rarely explain how the synchronization is performed or how data are captured and stored. In this way, it can be imagined that PO data are exported to a spreadsheet with the same sampling rate and are visually synchronized, while maintaining the shape of the data curve. In order to achieve a more reliable signal superposition and avoid human subjective synchronization, we highly encourage the use of the least square method to rescale both signals in the most adequate position. This leads to a reduction at the minimum shift between both signals, as proposed by Hermand et al. [125] for a comparison of heart rate signal and as recently promoted by a recommendation for the evaluation of the heart rate measurement system [126].
Moreover, instantaneous PO values are cyclic due to the different force moments and effectiveness during the pedalling cycle [127]. Even during the constant PO measurement, instantaneous PO follows a “sinusoid trend” around an average value (Figure 2). Therefore, synchronization is very important in the comparison of small timing periods. Many users believe that pressing the record button simultaneously would be sufficient to obtain an acceptable synchronization. In fact, this part does not totally fix the synchronization problem. Bike computers are only a passive recorder of sensor data and capture data when they are available. This indicates that the PO measurement systems must be started simultaneously without any button or possibility of triggering those systems. The PO measurement system started sending PO data after the initialization process (unknown time) and movement detection. For example, the SRM system starts the initialization process and then the measurement follows after the crank rotation is detected by a reed switch.
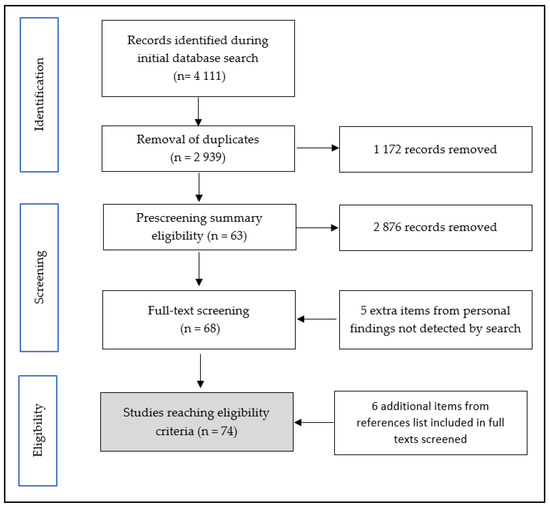
Figure 2.
Flowchart of inclusion and screening process for studies’ eligibility.
These elements led to an inability to perfectly synchronize many systems and placed important limitations on a statistical approach when analyzing the 1-s peak PO. PO values follow a sinusoidal curve. A shift in synchronization automatically leads to the average PO for different periods and finally produces different average values. For example, Figure 3 highlights a PO value of approximately 220 W with two different average time periods of 1 s. Even if the PO curve is the same, both 1-s periods had an average difference of 10 W. This indicates a caveat in PO measurement comparison and leads to a statistical analysis that had very large limits of agreement (LoA) and poorer accuracy than expected.
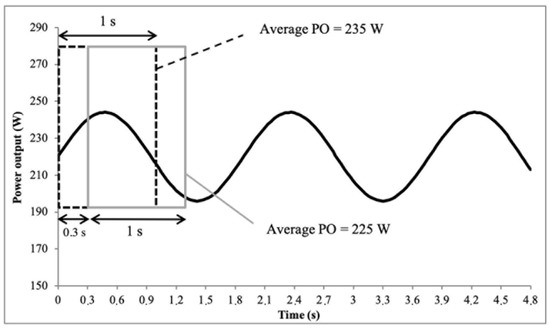
Figure 3.
Representation of power output (PO) values with two different periods of 1 s shifted by 0.3 s.
At the same time, many studies compared the PO measurement with average values delivered by two sensors. The duration of the averaging period can be very different from one study to another. The period length ranged from 1 s, 5 s [40], 10 s [85], 15 s [37], 30 s [71], and 1 min [99] up to several minutes [102,103]. This very large difference in data processing will directly modify the LoA highlighted by the Bland and Altman [124] analysis. A comparison between Stages and SRM power meters has been made to illustrate the effect of averaging periods on the LoA (Figure 4). Based on the same samples, data processing was performed using averaging periods of 1, 2, 3, 5, 10, 20, 30, 60, 90 and 120 s. A short averaging period provided a larger LoA compared to the longer periods. Therefore, the 1-s duration cannot be used to provide a comparison during the measurement due to the uncontrollable synchronization process. Conversely, periods over 30 s reduce the difference and lead to a smaller LoA. Given that instantaneous values measured by systems can be lower or higher than real measurements, the average of both negative and positive differences cancels the observed discrepancy. This process does not modify bias, but increases the random error.
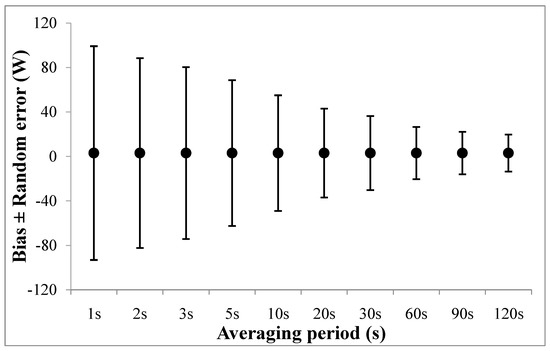
Figure 4.
Bias ± random error of Stages power meter compared to SRM power meter during the 3 h field training session (personal data). Each point corresponds to a specific averaging period in order to analyze the same data samples.
To standardize studies regarding the PO measurement, the averaging period seems to be a very important method that permits the comparison of power meters. A small averaged period can be interesting to compare systems and obtain information regarding the sensitivity of PO variations. Nevertheless, a systematic bias due to a synchronization shift should be avoided when comparing data. In this context, a 5-s duration appeared to be a relevant period for sub-maximal intensities since users often use smoothing to display the PO data on a bike computer (the average was 3 or 5 s). This duration provides less variation in the power control display that allows for the target PO to be maintained more easily during the effort.
Averaging periods longer than 5 s lead to a smaller LoA (Figure 4). This approach will ensure the validity for each point of the record power profile (RPP) [24] except for a 1-s period. Indeed, it is not possible to use this period to compare measurements since it enlarges LoA. However, the explosive capability of an athlete or patient is a very important parameter to consider [128,129]. To investigate that characteristic (maximal PO or time to peak PO), it will be very important to specifically investigate it through different protocols [130,131]. The first recommendation is to perform a test to reduce the random error related to the time shift [132]. This can be achieved by increasing the number of participants and performing several trials for each participant (ranging from 5 to 10 s). Second, to obtain the maximal PO from participants, it is very important to use the PO measurement system with an accurate measurement in a high value with higher sampling rates from a gold standard system and power control. For example, an SRM system provides PO at 4 Hz, but only the bike power control provided by the SRM Company (power control 7 and 8) records those values. If the recording was made by another brand (Garmin, Bryton, Suunto), the recording is conducted only at 1 Hz. These two recommendations reduce error in data processing and facilitate the comparison of maximal PO values with gold standard systems.
4.2.2. Statistical Methods for Assessing the Validity of Power Meters
All of the metrological properties of the power meters have been analyzed using many statistical methods in the literature. It should be noted that the studies reviewed in Table 1 did not always describe the statistical methods in detail, according to metrological properties.
Different methods are used in validity studies of power meters (Table 2). The circumstances in which these methods can be applied vary, and some are never appropriate for assessing validity. All of the methods are reviewed briefly regarding their use for evaluating power meters.
Table 2.
The various statistical methods used in validity studies regarding power meters are presented in Table 1.
The paired t-test would be used to compare the mean values between two different power meters (i.e., accuracy, sensitivity, and robustness) or between test and retest sessions (repeatability and reproducibility) to analyze whether there is any statistically significant bias between the power meters or tests. Although the paired t-test is useful, it should not be employed on its own as an assessment of all the metrological properties. Bland and Altman [133] stressed caution in the interpretation of a paired t-test for assessing accuracy, since the detection of a significant difference is actually dependent on the amount of random variation. For conducting more measurement sessions, the analysis of variance (ANOVA) is needed. ANOVA with repeated measures has been used to assess systematic bias between several measurements with appropriate post hoc comparisons. However, the limit of this statistical analysis is similar to the limits of the paired t-test. The systematic bias is affected by a large random variation.
Altman and Bland [134] introduced a method to assess accuracy between two methods. For each pair of values, this method uses the difference between two measurements along with the mean. The mean of the difference estimates the bias, which is a tendency for one of the methods to provide consistently higher or lower values than the reference method. Then, the LoA analysis presents and explores the data of the two methods with a Bland-Altman plot, which represents the differences between means [46]. It is important to observe whether there is any heteroscedasticity in the data. If the heteroscedasticity correlation is close to zero and the differences are normally distributed, a researcher could calculate the limits of agreement as follows: Mean of the two methods ±1.96 × SD of the differences between the two methods. The ninety-five percent confidence interval (95% CI) is formed by low and high limits of agreement. If heteroscedasticity is suspected, Bland and Altman [124] recommend the logarithmic transformation of the data before the calculation of the LoA. The final step would be to antilog the data. Regarding the interpretation of the LoA, it is a scientist’s task to judge whether the LoA are narrow enough for the test to be of practical use. The greater the random error, the larger the minimal detectable change would be for a given power meter.
The correlation coefficient is used by some authors for assessing the accuracy between two power meters [36,39,60,66,67,70]. A power meter is sufficiently accurate when a high (>0.9) statistically significant correlation coefficient and linearity are obtained [135]. However, Bland and Altman [133] and Sale and Norman [136] considered the use of the correlation coefficient to be inappropriate, since it cannot assess systematic bias. The linear regression analysis is another useful method for analyzing the agreement between two methods and enables a visual inspection of the strength of agreement. Similar to hypothesis tests for bias and correlation methods, regression analysis may be misleading in some accuracy assessments [133,137]. Sample heterogeneity is, again, a possible problem for extrapolation of the statistical analysis. For systematic bias, the null hypothesis that the intercept of the regression line equals zero would be tested. As for the paired t-test, a wide range of individual differences may lead to false acceptance of this hypothesis.
The coefficient of variation (CV) is also used to determine if the measurements are repeatable and reproducible [135]. It is important to take into account the magnitude of the smallest worthwhile change and the uncertainty or noise in the test results. The detectable change in performance represents a magnitude of less than 2% in elite athletes. Indeed, in sport sciences, Paton and Hopkins [138] reported a variation in performance from ~0.5% in road races up to ~2.5% in mountain biking events. In a recent study, the mean CVs obtained with the PowerTap, Stages and Garmin Vector devices are slightly higher than 2%, but the statistical analysis indicates that the four power meters provide reproducible PO during submaximal tests in the laboratory [51]. Van Praagh et al. [139] proposed a 5% margin of error to consider power meters as repeatable or reproducible, but this margin is too wide to detect a small change in performance. When considering an elite athlete with a maximal aerobic power of 400 W, that margin of error represents 20 W. Assuming that the accuracy claim of the SRM is correct, the results indicate that the PowerTap, Stages and Garmin Vector power meters have an accuracy of ± 2–3% for PO between 150 and 350 W. In other studies, the CVs were similar for the PowerTap hub system (CV = 2.1%), Polar S710 (CV = 2.2%), and the Ergomo Pro (CV = 4.1%) [36,77,103]. Hurst, Atkins, Sinclair, and Metcalfe [88] reported higher CVs for both the Stages (CV = 5.5%) and SRM (CV = 5.1%) power meters, but this result was biased by trail vibrations and a small variation in pacing in the different trials. Higher CVs were also reported for the G-Cog BMX [67,70] and the Look Keo Power [38] power meters.
Intraclass correlation coefficient (ICC) is also a common method for assessing repeatability and reproducibility [38,41,60,71,109,140]. It is based on the terms used in the calculation of the F-value from repeated measures ANOVA. The main advantages of this statistical analysis is that the ICC is univariate and it can be used when more than one retest (or power meter) is compared with a test (or gold standard) [56]. The ICC can be calculated in a way that is sensitive to the presence of systematic bias in the data. A more detailed approach would be to calculate confidence intervals for a given ICC, as shown by Morrow and Jackson [141]. The ICC includes variance for individuals and is therefore affected by sample heterogeneity to a degree that a high correlation may still lead to an unacceptable measurement error for some analytical goals [142,143].
Finally, in studies that compare different power meters to assess accuracy, the effect size (ES) represents the magnitude of the difference between power meters. The absolute ES is the difference between the average or mean outcomes between the two different power meters [144]. While the P-value can inform the reader whether an effect exists, the P-value will not report the size of the effect. Both of the substantive significance (ES) and statistical significance (P-value) are essential results that should be reported. ES can refer to the raw difference between a power meter’s means, as well as standardized measures of exercise conditions. ES can also quantitatively compare results from different studies and thus can be used in meta-analyses. The most commonly used ES is Cohen’s d, which represents the ratio of the mean difference over the pooled variance to estimate the magnitude of the difference. As Cohen [145] proposed, the difference was considered trivial when ES ≤ 0.2, small when ES ≤ 0.5, moderate when ES ≤ 0.8, and large when ES > 0.8.
4.3. Exercise Conditions
Due to technological differences, integrated components or measurement location, many exercise conditions can alter the PO measurement, including PO range, sprint, pedalling cadence, torque, position, participant, temperature, vibration or field test. The following paragraphs aim to describe some of the problems that occur with those exercise conditions and explain why it is necessary to assess them.
4.3.1. Power Output Range
The range measurement is the area determined by minimal or maximal values of the variable to be measured (PO, in this case). For example, the SRM power meter has a range measurement between 10 and 2500 W, which allows the valid measurement of PO during low-intensity (e.g., rehabilitation protocols) and high-intensity (e.g., sprint ability in world class track or BMX cyclists) exercises. This paragraph does not take care of the maximum PO during sprints, since those cases will be managed separately in another paragraph.
Testing many PO ranges is necessary to confirm that a system can provide valid data in a PO range, in which the system is supposed to be used according to the population and need. As an example of rehabilitation, tools or medical devices should be tested from 0 to 300 W and systems aiming to test elite athletes should be tested from 0 to 600 W during a steady state of at least 1 min. Higher values are not supposed to arise during the steady state measurement and will be managed in the sprint section. Many studies aimed to investigate PO systems using an incremental protocol to obtain comparisons of different PO values [42,51,77]. When a study is performed with a calibration rig system or other systems driven by an engine, it is very easy to perform a large PO range over 450–500 W. In other cases, it could be difficult to find participants that are able to maintain this intensity for least 2 min. It is only possible to perform different steps at a high intensity with a recovery phase.
Several studies reported problems in the linearity of measured PO with drifts in validity and larger LoA in higher values [51,63,77,86,140]. Nevertheless, some studies did not provide a very clear overview of validity functions to a PO range. When the Bland-Altman analysis is performed for all of the PO data, the shape of the plot provides an idea of the trend, but not relevant data to confirm the agreement. To provide relevant information, each PO range should be analyzed separately with the methods of Bland and Altman, after log transforming the data where heteroscedasticity is observed, in order to provide the bias ± random error for each range (Figure 5). This information permitted us to clearly observe if the PO system had a different bias with a higher value as an example that indicates drift in the measurement process. In other cases, this method highlights a larger interval between LoA that indicates the modification of sensibility function throughout the PO range.
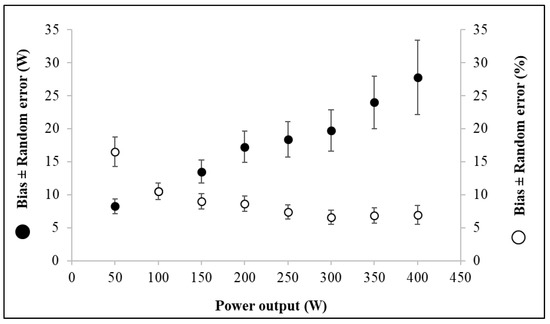
Figure 5.
Comparison between two power meters (personal data). The graph represents the absolute bias ± random error expressed in Watt (black markers) and the relative bias ± random error expressed in % (white markers) for each power output (PO) level tested.
4.3.2. Sprint
Sprint tests are widely used in cycling to assess the anaerobic capacities of athletes [146,147], and the Wingate test [148,149] and force-velocity test are the most popular approaches [150,151,152]. Those kinds of evaluations are characterized by a brief all-out period of cycling (from 5 to 30 s), in which maximal values are carefully collected. These tests provide 1-s peak PO, time to peak PO, and some other parameters, such as the 5-s average peak PO and PO decrease [146]. During those very intense PO phases, the power meter has to be very reactive to perform measurements accurately and be able to measure very high values (up to 2000 W for elite track riders). In the past, several studies noted the limitations of the friction belt system to assess PO during sprints due to the inertia of the flying wheel [95,99,153,154]. More recently, Rodger, Plews, McQuillan, and Driller [113] reported an unacceptable level of agreement during high PO (>650 W) with Cyclus and Stages power meters. Bertucci, Duc, Villerius, Pernin, and Grappe [36] also reported a decrease in accuracy during sprints with PowerTap hub SL+. Considering the measurement conditions, several authors noted that the sampling rate of measurement had a major role in accuracy for maximal PO during sprints [132,155]. A higher sampling rate allows for better accuracy in 1-s peak PO determination, but no difference was found for the 5-s average peak PO. For this reason, it is very important to perform a comparison during sprints with a gold standard system at the best sampling rate as possible. Sprints or intermittent exercises with an accurate measurement of PO are performance issues, since these exercises can be integrated into therapy for pathologies, such as obesity [156], artery disease [157] or for cardio-respiratory benefits [158]. Sprint assessment is a specific evaluation in which the technical requirements from the equipment must be adequate for this purpose. If a system aims to perform measurements at a high level of PO (over 600 W) or during explosive exercise bouts, it is highly recommended to assess the system in those situations to verify their capabilities.
4.3.3. Pedalling Cadence
PO is commonly obtained by measuring both angular velocity and torque. For each PO range, an athlete or patient can vary these two parameters to adjust their PO with cadence or resistance. Pedalling cadence during a constant PO exercise bout can be very different for rehabilitation purposes (15–100) [159,160] or performance cycling (70–120) [161,162]. Due to technical differences in angular velocity measurement solutions (single magnet, multi-magnets or accelerometer(s)), several studies reported alterations in accuracy after changing the pedalling cadence. Bouillod, Pinot, Soto-Romero, Bertucci, and Grappe [51] or Duc, Villerius, Bertucci, and Grappe [77] reported alterations of PO measurement using different cadences. If the PO measurement is performed on pedals, the crank arm or bottom bracket axle, the pedalling cadence will be directly integrated into the PO calculation. In addition, if the PO measurement is performed on the rear wheel (hub or axle), the angular velocity of the wheel is integrated into the calculation. Technically, most of the commercially available power meters measure the angular velocity simply by detecting the complete hub or crank revolution with one or several magnet systems. In those cases, system measurements on the rear wheel obtain a higher number of revolutions for one single pedalling revolution according to the gear ratio. Those systems have the advantage of measurements that are made with a very low pedalling cadence and that obtain more angular velocity values. Some systems can also use several magnets on the wheel (Monark 894 E, Cyclus 2) or inside the pedals (PowerTap P1) to obtain more data and improve the accuracy of the pedalling cadence measurement. In addition, some systems measure angular velocity based on accelerometers (e.g., Garmin Vector and G-Cog). It has been established that accelerometers can be less accurate with a very low speed movement and can saturate at a very high velocity [163]. Given the relationship between PO, cadence, and torque, it is not certain that PO measurement modifications are due to changes in cadence or are directly affected by angular velocity or torque measurements. For the same PO range, an increase in pedalling cadence will lead to a decrease in torque and vice versa.
4.3.4. Torque
Torque measurement is one part of the calculation. Unlike pedalling cadence, torque is a little more difficult to manage for the same PO range, given that it depends on the sensor sensitivity and location. Nevertheless, several authors created protocols that induce different ranges of torque. Bertucci, Duc, Villerius, Pernin, and Grappe [36] created a protocol on a treadmill with various gear ratios, slopes, and speeds to test the influence of torque on the PowerTap hub’s accuracy. Furthermore, Bernard, Decatoire, and Lacouture [65] used an engine system to produce various torque values on an SRM power meter and investigate the impact of torque variations on accuracy. Regarding torque testing, tests of several PO ranges with different pedalling cadences, gears or slopes could be sufficient to assess various torque ranges.
4.3.5. Position
The effects of position on PO measurements have been tested in several studies [36,51,69,77,89,94,106] to assess the sensitivity of power meters. Bertucci, Duc, Villerius, Pernin, and Grappe [36] reported that the PowerTap rear hub was not significantly affected by the position change (standing vs. seated) when compared to the SRM power meter. Duc, Villerius, Bertucci, and Grappe [77] observed a significant decrease in PO measured in the standing vs. seated position by the Ergomo pro at 15 km/h and 6% on a treadmill, while the PO measured by the SRM was unchanged. Finally, Bouillod et al. [51,69] also showed an effect of cycling position on the PO measured by SRM, PowerTap G3, and Stages. For the same velocity on a treadmill, the PO was higher in the standing position for both the SRM (+2.1%) and the PowerTap G3 (+2.4%) power meters. This increase in PO is due to the mechanical deformation in both of the tires and the bike frame. Indeed, the increase in peak pedal force during the downstroke phase [164] occurs according to Newton’s second law (F = m × a) and induces an uneven work rate generation that enhances the acceleration and deceleration periods during the crank cycle. The force variations during the overall cycle could explain the mechanical losses measured in the standing position. In contrast, the PO measured by Stages was lower in the standing position (−4.4%), whereas the Garmin Vector pedals were not affected by the change in position. The authors hypothesized that the PO measured by Stages was significantly lower in the standing position, which probably occurred due to the left-crank-only measurement. Indeed, the algorithm used to determine PO for the Stages system simply doubles the value determined at the left crank and then creates an average. This process may create some issues in situations for which a contralateral force production imbalance is present. The Garmin Vector system did not measure the PO change between the seated and standing positions. This could be due to some technological limits of the system that will be discussed further below. To conclude, both SRM and PowerTap rear hub power meters are considered sensitive for measuring the PO change between the seated and standing positions, whereas the Ergomo pro, Stages, and Garmin Vector power meters are not.
4.3.6. Participant
The number of participants and their characteristics are very important for integrating the results that were obtained. Some studies used only one participant during the measurement process [36,51,77,88,89]. In this situation, the authors consider that differences in the pedalling technique between the athletes or patients does not affect the accuracy of measurement. However, some studies reported differences in the pedalling technique between the novice and elite athletes [165] or between cycling specialities [166,167]. These inter-individual differences can be observed with power meters using the torque analysis. For example, a recreational cyclist or patient has higher torque amplitude values during pedalling for the same PO. Technically, it cannot be excluded that a smoother pedalling pattern can be measured more accurately than an erratic pattern. Given the sampling rate measurement of both force and cadence, it could be possible that some data are interpolated and generate more error with an erratic pedalling pattern. In addition, many systems measure PO in the left and right sides separately (pedals and crank arms). Several studies measured some differences in the pedalling technique for the pulling/pushing technique [168,169,170]. To confirm that the PO measurement system can be sensitive and accurate for all those pedalling techniques, testing many participants during comparisons appears to be mandatory. The pedalling technique could be measured using effectiveness and smoothness indexes. Effectiveness measures how much of the PO that is delivered to the pedal is pushing it forward, whereas smoothness measures how smoothly the PO is delivered to the pedal throughout the revolution. More recently, several systems appeared on the market to measure the PO with only one side device and doubling values to obtain the entire PO. During comparisons with these sensors, the accuracy that was obtained is directly impacted by the bilateral symmetry of the participants that were tested and cannot be imputed fully to the sensors. Many studies reported that the pedalling symmetry is related to many factors, such as pedalling cadence [171], workload [172,173,174] or fatigue [174,175] and that the symmetry can be reduced using specific training approaches [176]. For those kinds of sensors, it is recommended that several participants should be tested during the comparison. Nevertheless, the results that are obtained cannot guarantee that the accuracy of PO will remain constant in various situations, since the symmetry of riders can be modified and lead to higher error measurements.
4.3.7. Temperature
The use of strain gauges allows for the accurate measurement of torque, but they are sensitive to changes in ambient temperature [42,177], which affects the calculated PO. Indeed, an increase in ambient temperature induces a change in the offset, which leads to a systematic error in the measured PO. As reported by Wooles, Robinson, and Keen [177], the offset changes an average of 7 Hz per degree for the SRM, which represents approximately 2 W. Two other studies were interested in analyzing the effects of temperature on PO measurements. Davison, Corbett, and Ansley [75] showed that the CompuTrainer significantly underestimated the SRM by ~7 W in low temperatures (15 and 20 °C), but was similar under high temperatures (28 and 35 °C). In addition, Gardner, Stephens, Martin, Lawton, Lee, and Jenkins [42] stated that both the SRM and PowerTap power meters are sensitive to differences in temperature. More recently, Shute et al. [178] compared four systems (CompuTrainer, PowerTap Hub, Stages crank, and Garmin vector) in three different environmental conditions of temperature, cold 7°, regular 20°, and hot 33°. In this study, the authors observed a significant alteration of accuracy for PowerTap, Vector, and Stages, especially in the hot situation. These studies show that care is needed when performing an offset, especially at the start of the ride if the bicycle is moved from a warm to a cold location. It is recommended to set the zero offset (when possible) on power meters after a warm-up period in order to ensure that the components (primarily strain gauges) are “acclimated” to the ambient temperature. Otherwise, it is recommended that a system that compensates for temperature variations is used during the ride.
4.3.8. Vibration
The effect of vibration on PO measurements has been tested in only three studies [51,114,115]. Bouillod et al. [51] used vibrating plates (Globus, Physioplate FIT, Italy) and demonstrated that the PO measured by Stages and Garmin Vector was significantly decreased by high vibrations (48 and 52 Hz, respectively), whereas the PO measured by SRM and PowerTap G3 power meters were not. Rodríguez-Rielves et al. [114] observed an alteration of Favero Duo measurement when performed with the vibration set at 30 and 40 Hz, which is generated by the Merit Fitness V2000 vibration plate. In the second study, Rodríguez-Rielves et al. [115] pointed that the Rotor InPower system seems to not be influenced by the similar vibration process.
These results can suggest that the robustness of the Stages and Garmin Vector and Favero Duo could alter the validity of the PO measurement on roads with cobblestones or with high macrotexture surfaces. In addition, the decrease in PO measured by Stages and Garmin Vector and Favero Duo could be due to the use of accelerometers to measure angular velocity. The accelerometers could be out of their range of measurement, especially when the road conditions involve a severe vibration exposure from 30 Hz or 48 Hz. The Stages and Garmin Vector power meters cannot be considered suitable for practice with strong vibrations, such as mountain biking and cobblestone roads. The study of Bouillod, Pinot, Soto-Romero, Bertucci, and Grappe [51] highlighted the importance of testing the robustness of the power meters with vibrations, considering that the PO measurement could be affected by the technological conception of the systems.
4.3.9. Field Test
All of the studies analyzed the PO systems in several steady-state periods. During those steady-state periods, small variations in PO are observed around target values. This situation can permit a PO range to be associated with a specific accuracy. Nevertheless, this protocol offers a situation with very low PO variation and without free wheel periods, as in natural-use scenarios. A recent study [21] showed that the variations in PO were lower with ergometer conditions (CV = 6.8%) compared to the level ground (CV = 14.5%) and uphill (CV = 14.1%) conditions for similar exercises. These results suggest that the PO fluctuations were significantly higher under road-cycling conditions by considering the different techniques, vibrations, and pacing strategies. In cases of sensors that lack sensitivity, the PO could be impacted substantially by variations. To recreate real situations, many authors simulated time trials [36,109,140]. In that kind of situation, if a simulation included positive and negative slopes, it is possible to recreate PO measurements that closely simulated the real use. In addition, if the comparison focuses on mobile PO measurement systems, it is highly recommended to perform comparisons in field tests to include many natural stresses that were described previously, such as temperature variation, a large range of PO, and cadence. Few studies tested mobile PO systems in the field [36,51,67,69,70,77,88,89,100,102,103,104]. Laboratory tests were used to test each one separately in order to check for potential problems or a lack of sensitivity under specific conditions and provide explanations. This protocol leads to smooth external stresses and provides steady-state situations that are not in phase with the final use.
5. Conclusions
The procedures and methods used in the studies to assess the validity of power meters are very different, including the protocols, statistical analysis, data processing or interpretation. These differences are mainly due to a lack of consensus in the literature to evaluate these tools. As described in this review, the methods used to assess power meters largely affect the results and make the comparisons between the studies and devices impossible. This review provides some caveats and recommendations to assess the validity of cycling power meters, such as including all of the metrological properties (i.e., accuracy, sensitivity, repeatability, reproducibility, and robustness). In addition, several exercise conditions that could affect the validity have been noted. All of these metrological properties and exercise conditions have to be tested to assess the validity in any situation. However, given the large number of these metrological properties and exercise conditions, the studies can be performed with only some properties, if not all of them are required (e.g., vibration for ergometers). If some properties are not tested, they should be mentioned in the Study Limitation Section. To provide relevant information to the readers, it is recommended to compare a device with a gold standard system using similar time measurements. In addition, the PO range has to fit the requirements of a population that use these systems (rehabilitation bike, elite athletes). Moreover, the inclusion of a large number of participants (at least 10) is highly recommended, in order to limit the effects of individual characteristics on validity. Finally, the protocols aimed at evaluating sensors during anaerobic tests (or sprints) should be performed to obtain specific data, similar to the maximum PO or times to reach a maximum PO. Furthermore, the performance of at least three trials for each sensor and the evaluation of the reproducibility or repeatability between the sensors are also recommended.
Author Contributions
Conceptualization, A.B., G.S.-R., F.G., W.B., E.B. and J.C.; methodology, A.B., G.S.-R., F.G., W.B., E.B. and J.C.; article analysis and draft writing, A.B. and J.C.; review, A.B., G.S.-R., F.G., W.B., E.B. and J.C.; editing and supervision, A.B., F.G. and J.C. All authors have read and agreed to the published version of the manuscript.
Funding
This research received no external funding.
Acknowledgments
The initial development of the manuscript was supported by the French Cycling Federation.
Conflicts of Interest
The authors declare that they have no conflict of interest.
References
- Knudson, D.V. Correcting the use of the term “power” in the strength and conditioning literature. J. Strength Cond. Res. 2009, 23, 1902–1908. [Google Scholar] [CrossRef]
- Passfield, L.; Hopker, J.G.; Jobson, S.; Friel, D.; Zabala, M. Knowledge is power: Issues of measuring training and performance in cycling. J. Sports Sci. 2017, 35, 1426–1434. [Google Scholar] [CrossRef]
- Jobson, S.A.; Passfield, L.; Atkinson, G.; Barton, G.; Scarf, P. The analysis and utilization of cycling training data. Sports Med. 2009, 39, 833–844. [Google Scholar] [CrossRef]
- Garvican, L.A.; Martin, D.T.; McDonald, W.; Gore, C.J. Seasonal variation of haemoglobin mass in internationally competitive female road cyclists. Eur. J. Appl. Physiol. 2010, 109, 221–231. [Google Scholar] [CrossRef] [PubMed]
- Swart, J.; Lamberts, R.P.; Derman, W.; Lambert, M.I. Effects of high-intensity training by heart rate or power in well-trained cyclists. J. Strength Cond. Res. 2009, 23, 619–625. [Google Scholar] [CrossRef] [PubMed]
- Robinson, M.E.; Plasschaert, J.; Kisaalita, N.R. Effects of high intensity training by heart rate or power in recreational cyclists. J. Sports Sci. Med. 2011, 10, 498–501. [Google Scholar]
- Nimmerichter, A.; Eston, R.G.; Bachl, N.; Williams, C. Longitudinal monitoring of power output and heart rate profiles in elite cyclists. J. Sports Sci. 2011, 29, 831–840. [Google Scholar] [CrossRef] [PubMed]
- Martin, J.C.; Milliken, D.L.; Cobb, J.E.; McFadden, K.L.; Coggan, A.R. Validation of a Mathematical Model for Road Cycling Power. J. Appl. Biomech. 1998, 14, 276–291. [Google Scholar] [CrossRef] [PubMed]
- Lukes, R.; Carré, M.; Haake, S. Track cycling: An analytical model. In The Engineering of Sport 6; Springer: Berlin/Heidelberg, Germany, 2006; pp. 115–120. [Google Scholar]
- Lukes, R.; Hart, J.; Haake, S. An analytical model for track cycling. Proc. Inst. Mech. Eng. Part P J. Sports Eng. Technol. 2012, 226, 143–151. [Google Scholar] [CrossRef]
- Gonzalez-Haro, C.; Galilea Ballarini, P.A.; Soria, M.; Drobnic, F.; Escanero, J.F. Comparison of nine theoretical models for estimating the mechanical power output in cycling. Br. J. Sports Med. 2007, 41, 506–509. [Google Scholar] [CrossRef][Green Version]
- Candau, R.B.; Grappe, F.; Menard, M.; Barbier, B.; Millet, G.Y.; Hoffman, M.D.; Belli, A.R.; Rouillon, J.D. Simplified deceleration method for assessment of resistive forces in cycling. Med. Sci. Sports Exerc. 1999, 31, 1441–1447. [Google Scholar] [CrossRef] [PubMed]
- di Prampero, P.E.; Cortili, G.; Mognoni, P.; Saibene, F. Equation of motion of a cyclist. J. Appl. Physiol. Respir. Environ. Exerc. Physiol. 1979, 47, 201–206. [Google Scholar] [CrossRef] [PubMed]
- Underwood, L.; Jermy, M. Mathematical model of track cycling: The individual pursuit. Procedia 2010, 2, 3217–3222. [Google Scholar] [CrossRef]
- Dahmen, T.; Byshko, R.; Saupe, D.; Röder, M.; Mantler, S. Validation of a model and a simulator for road cycling on real tracks. Sports Eng. 2011, 14, 95–110. [Google Scholar] [CrossRef][Green Version]
- Martin, J.C.; Gardner, A.S.; Barras, M.; Martin, D.T. Modeling sprint cycling using field-derived parameters and forward integration. Med. Sci. Sports Exerc. 2006, 38, 592–597. [Google Scholar] [CrossRef]
- Lim, A.C.; Homestead, E.P.; Edwards, A.G.; Carver, T.C.; Kram, R.; Byrnes, W.C. Measuring changes in aerodynamic/rolling resistances by cycle-mounted power meters. Med. Sci. Sports Exerc. 2011, 43, 853–860. [Google Scholar] [CrossRef]
- Bertucci, W.M.; Rogier, S.; Reiser, R.F., 2nd. Evaluation of aerodynamic and rolling resistances in mountain-bike field conditions. J. Sports Sci. 2013, 31, 1606–1613. [Google Scholar] [CrossRef]
- Balmer, J.; Davison, R.C.; Bird, S.R. Peak power predicts performance power during an outdoor 16.1-km cycling time trial. Med. Sci. Sports Exerc. 2000, 32, 1485–1490. [Google Scholar] [CrossRef]
- Bentley, D.J.; McNaughton, L.R.; Thompson, D.; Vleck, V.E.; Batterham, A.M. Peak power output, the lactate threshold, and time trial performance in cyclists. Med. Sci. Sports Exerc. 2001, 33, 2077–2081. [Google Scholar] [CrossRef]
- Bouillod, A.; Pinot, J.; Soenen, F.; Ouvrard, T.; Grappe, F. Dependence of the Nature of the Pedaling Activity on Maximal Aerobic Power in Cycling. Int. J. Sports Physiol. Perform. 2017, 12, 44–49. [Google Scholar] [CrossRef]
- Paton, C.D.; Hopkins, W.G. Seasonal changes in power of competitive cyclists: Implications for monitoring performance. J. Sci. Med. Sport 2005, 8, 375–381. [Google Scholar] [CrossRef]
- Quod, M.J.; Martin, D.T.; Martin, J.C.; Laursen, P.B. The power profile predicts road cycling MMP. Int. J. Sports Med. 2010, 31, 397–401. [Google Scholar] [CrossRef] [PubMed]
- Pinot, J.; Grappe, F. The record power profile to assess performance in elite cyclists. Int. J. Sports Med. 2011, 32, 839–844. [Google Scholar] [CrossRef]
- Ebert, T.R.; Martin, D.T.; McDonald, W.; Victor, J.; Plummer, J.; Withers, R.T. Power output during women’s World Cup road cycle racing. Eur. J. Appl. Physiol. 2005, 95, 529–536. [Google Scholar] [CrossRef] [PubMed]
- Ebert, T.R.; Martin, D.T.; Stephens, B.; Withers, R.T. Power output during a professional men’s road-cycling tour. Int. J. Sports Physiol. Perform. 2006, 1, 324–335. [Google Scholar] [CrossRef]
- Vogt, S.; Heinrich, L.; Schumacher, Y.O.; Blum, A.; Roecker, K.; Dickhuth, H.H.; Schmid, A. Power output during stage racing in professional road cycling. Med. Sci. Sports Exerc. 2006, 38, 147–151. [Google Scholar] [CrossRef]
- Vogt, S.; Schumacher, Y.O.; Blum, A.; Roecker, K.; Dickhuth, H.H.; Schmid, A.; Heinrich, L. Cycling power output produced during flat and mountain stages in the Giro d’Italia: A case study. J. Sports Sci. 2007, 25, 1299–1305. [Google Scholar] [CrossRef] [PubMed]
- Vogt, S.; Schumacher, Y.O.; Roecker, K.; Dickhuth, H.H.; Schoberer, U.; Schmid, A.; Heinrich, L. Power Output during the Tour de France. Int. J. Sports Med. 2007, 28, 756–761. [Google Scholar] [CrossRef]
- Lim, A.C.; Peterman, J.E.; Turner, B.M.; Livingston, L.R.; Byrnes, W.C. Comparison of male and female road cyclists under identical stage race conditions. Med. Sci. Sports Exerc. 2011, 43, 846–852. [Google Scholar] [CrossRef]
- Macdermid, P.W.; Stannard, S. Mechanical work and physiological responses to simulated cross country mountain bike racing. J. Sports Sci. 2012, 30, 1491–1501. [Google Scholar] [CrossRef]
- Fukuda, T.; Kurano, M.; Iida, H.; Takano, H.; Tanaka, T.; Yamamoto, Y.; Ikeda, K.; Nagasaki, M.; Monzen, K.; Uno, K.; et al. Cardiac rehabilitation decreases plasma pentraxin 3 in patients with cardiovascular diseases. Eur. J. Prev. Cardiol. 2012, 19, 1393–1400. [Google Scholar] [CrossRef] [PubMed]
- Isacco, L.; Ritter, O.; Tordi, N.; Laroche, D.; Degano, B.; Bouhaddi, M.; Rakobowchuk, M.; Mourot, L. Similar substrate oxidation rates in concentric and eccentric cycling matched for aerobic power output. Appl. Physiol. Nutr. Metab. 2016, 41, 1204–1207. [Google Scholar] [CrossRef]
- Majerczak, J.; Grandys, M.; Duda, K.; Zakrzewska, A.; Balcerczyk, A.; Kolodziejski, L.; Szymoniak-Chochol, D.; Smolenski, R.T.; Bartosz, G.; Chlopicki, S.; et al. Moderate-intensity endurance training improves endothelial glycocalyx layer integrity in healthy young men. Exp. Physiol. 2017, 102, 70–85. [Google Scholar] [CrossRef]
- Menetrier, A.; Pinot, J.; Mourot, L.; Grappe, F.; Bouhaddi, M.; Regnard, J.; Tordi, N. Effects of recovery using contrast water therapy or compression stockings on subsequent 5-min cycling performance. J. Sci. Cycl. 2013, 2, 49–56. [Google Scholar]
- Bertucci, W.; Duc, S.; Villerius, V.; Pernin, J.N.; Grappe, F. Validity and reliability of the PowerTap mobile cycling powermeter when compared with the SRM Device. Int. J. Sports Med. 2005, 26, 868–873. [Google Scholar] [CrossRef]
- Novak, A.R.; Dascombe, B.J. Agreement of Power Measures between Garmin Vector and SRM Cycle Power Meters. Meas. Phys. Educ. Exerc. Sci. 2016, 20, 167–172. [Google Scholar] [CrossRef]
- Sparks, S.A.; Dove, B.; Bridge, C.A.; Midgely, A.W.; McNaughton, L.R. Validity and reliability of the look Keo power pedal system for measuring power output during incremental and repeated sprint cycling. Int. J. Sports Physiol. Perform. 2015, 10, 39–45. [Google Scholar] [CrossRef] [PubMed]
- Bertucci, W.; Duc, S.; Villerius, V.; Grappe, F. Validity and reliability of the Axiom PowerTrain cycle ergometer when compared with an SRM powermeter. Int. J. Sports Med. 2005, 26, 59–65. [Google Scholar] [CrossRef]
- Novak, A.R.; Stevens, C.J.; Dascombe, B.J. Agreement between Lemond Revolution cycle ergometer and SRM power meter during power profile and ramp protocol assessments. J. Sci. Cycl. 2015, 4, 37–43. [Google Scholar]
- Woods, G.F.; Day, L.; Withers, R.T.; Ilsley, A.H.; Maxwell, B.F. The dynamic calibration of cycle ergometers. Int. J. Sports Med. 1994, 15, 168–171. [Google Scholar] [CrossRef]
- Gardner, A.S.; Stephens, S.; Martin, D.T.; Lawton, E.; Lee, H.; Jenkins, D. Accuracy of SRM and power tap power monitoring systems for bicycling. Med. Sci. Sports Exerc. 2004, 36, 1252–1258. [Google Scholar] [CrossRef]
- Drouet, J.-M.; Champoux, Y.; Bergeron, F. A user-friendly calibration system for bicycle ergometers, home trainers and bicycle power monitoring devices. Sports Eng. 2008, 11, 15–22. [Google Scholar] [CrossRef]
- Bertucci, W.M.; Grappe, F.; Crequy, S. Original characteristics of a new cycle ergometer. Sports Eng. 2011, 13, 171–179. [Google Scholar] [CrossRef]
- Guiraud, T.; Leger, L.; Long, A.; Thebault, N.; Tremblay, J.; Passelergue, P. Vo2 requirement at different displayed power outputs on five cycle ergometer models: A preliminary study. Br. J. Sports Med. 2010, 44, 449–454. [Google Scholar] [CrossRef] [PubMed]
- Bland, J.M.; Altman, D.G. Comparing methods of measurement: Why plotting difference against standard method is misleading. Lancet 1995, 346, 1085–1087. [Google Scholar] [CrossRef]
- Guignard, B.; Ayad, O.; Baillet, H.; Mell, F.; Simbana Escobar, D.; Boulanger, J.; Seifert, L. Validity, reliability and accuracy of inertial measurement units (IMUs) to measure angles: Application in swimming. Sports Biomech. 2021, 1–33. [Google Scholar] [CrossRef] [PubMed]
- Glatthorn, J.F.; Gouge, S.; Nussbaumer, S.; Stauffacher, S.; Impellizzeri, F.M.; Maffiuletti, N.A. Validity and reliability of Optojump photoelectric cells for estimating vertical jump height. J. Strength Cond. Res. 2011, 25, 556–560. [Google Scholar] [CrossRef]
- Atkinson, G.; Nevill, A.M. Statistical methods for assessing measurement error (reliability) in variables relevant to sports medicine. Sports Med. 1998, 26, 217–238. [Google Scholar] [CrossRef]
- Grappe, F. Puissance et Performance en Cyclisme; De Boeck: Louvain-La-Neuve, Belgium, 2012. [Google Scholar]
- Bouillod, A.; Pinot, J.; Soto-Romero, G.; Bertucci, W.; Grappe, F. Validity, Sensitivity, Reproducibility, and Robustness of the PowerTap, Stages, and Garmin Vector Power Meters in Comparison With the SRM Device. Int. J. Sports Physiol. Perform. 2017, 12, 1023–1030. [Google Scholar] [CrossRef]
- Spicer, J.B.; Richardson, C.J.K.; Ehrlich, M.J.; Bernstein, J.R.; Fukuda, M.; Terada, M. Effects of Frictional Loss on Bicycle Chain Drive Efficiency. J. Mech. Des. 2001, 123, 598–605. [Google Scholar] [CrossRef]
- Gavryushin, S.S.; Godzikovsky, V.A.; Gavrilenkov, S.I. Investigation of the Sensitivity of a Strain Gauge Force Sensor to Bending Moment. AIP Conf. Proc. 2019, 2171, 170006. [Google Scholar]
- Bartlett, J.W.; Frost, C. Reliability, repeatability and reproducibility: Analysis of measurement errors in continuous variables. Ultrasound Obstet. Gynecol. 2008, 31, 466–475. [Google Scholar] [CrossRef] [PubMed]
- Connett, J.E. Repeatability and reproducibility. In Wiley Encyclopedia of Clinical Trials; John Wiley & Sons, Inc.: Hoboken, NJ, USA, 2008. [Google Scholar]
- Safrit, M.J.; Wood, T.M. Measurement Concepts in Physical Education and Exercise Science; Human Kinetics Books: Champaign, IL, USA, 1989. [Google Scholar]
- Page, M.J.; McKenzie, J.E.; Bossuyt, P.M.; Boutron, I.; Hoffmann, T.C.; Mulrow, C.D.; Shamseer, L.; Tetzlaff, J.M.; Akl, E.A.; Brennan, S.E.; et al. The PRISMA 2020 statement: An updated guideline for reporting systematic reviews. Syst. Rev. 2021, 10, 89. [Google Scholar] [CrossRef]
- Shamseer, L.; Moher, D.; Clarke, M.; Ghersi, D.; Liberati, A.; Petticrew, M.; Shekelle, P.; Stewart, L.A.; Group, P.-P. Preferred reporting items for systematic review and meta-analysis protocols (PRISMA-P) 2015: Elaboration and explanation. BMJ 2015, 350, g7647. [Google Scholar] [CrossRef]
- Abbiss, C.R.; Peiffer, J.J.; Wall, B.A.; Martin, D.T.; Laursen, P.B. Influence of starting strategy on cycling time trial performance in the heat. Int. J. Sports Med. 2009, 30, 188–193. [Google Scholar] [CrossRef] [PubMed][Green Version]
- Astorino, T.A.; Cottrell, T. Reliability and validity of the velotron racermate cycle ergometer to measure anaerobic power. Int. J. Sports Med. 2012, 33, 205–210. [Google Scholar] [CrossRef] [PubMed]
- Attaway, R.; Bartoli, W.P.; Pate, R.R.; Davis, J.M. Physiologic and perceptual responses to exercise on a new cycle ergometer. Can. J. Sport Sci. 1992, 17, 56–59. [Google Scholar]
- Balmer, J.; Davison, R.C.; Bird, S.R. Reliability of an air-braked ergometer to record peak power during a maximal cycling test. Med. Sci. Sports Exerc. 2000, 32, 1790–1793. [Google Scholar] [CrossRef] [PubMed][Green Version]
- Balmer, J.; Davison, R.C.; Coleman, D.A.; Bird, S.R. The validity of power output recorded during exercise performance tests using a Kingcycle air-braked cycle ergometer when compared with an SRM powermeter. Int. J. Sports Med. 2000, 21, 195–199. [Google Scholar] [CrossRef]
- Balmer, J.; Bird, S.; Davison, R.C.; Doherty, M.; Smith, P. Mechanically braked Wingate powers: Agreement between SRM, corrected and conventional methods of measurement. J. Sports Sci. 2004, 22, 661–667. [Google Scholar] [CrossRef]
- Bernard, J.; Decatoire, A.; Lacouture, P. Comparison of two pedaling sensors, icrankset and SRM, against a standard reference sensor. In Proceedings of the 33rd International Conference on Biomechanics in Sports, Poitiers, France, 29 June–3 July 2015. [Google Scholar]
- Bertucci, W. Analysis of the agreement between the Fortius cycling ergometer and the PowerTap powermeter PO during time trials of 6 and 30 min. Comput. Methods Biomech. Biomed. Eng. 2012, 15, 212–214. [Google Scholar] [CrossRef]
- Bertucci, W.; Crequy, S.; Chiementin, X. Validity and reliability of the G-Cog BMX Powermeter. Int. J. Sports Med. 2013, 34, 538–543. [Google Scholar] [CrossRef] [PubMed]
- Bini, R.; Hume, P. Within-and between-session reliability of a pedal force system for power output and pedal force effectiveness measurements. Hum. Mov. 2020, 21, 69–78. [Google Scholar] [CrossRef]
- Bouillod, A.; Pinot, J.; Soto-Romero, G.; Grappe, F. Validity, sensitivity and reproducibility of Stages and Garmin Vector power meters when compared with SRM device. In Proceedings of the International Conference on Biomechanics in Sports, Poitiers, France, 29 June–3 July 2015. [Google Scholar]
- Chiementin, X.; Crequy, S.; Bertucci, W. Validity and reliability of the G-Cog device for kinematic measurements. Int. J. Sports Med. 2013, 34, 945–949. [Google Scholar] [CrossRef] [PubMed]
- Costa, V.P.; Guglielmo, L.G.A.; Paton, C.D. Reproducibility and validity of the PowerCal device for estimating power output during sprints in well-trained cyclists. Isokinet. Exerc. Sci. 2015, 23, 127–132. [Google Scholar] [CrossRef]
- Costa, V.P.; Guglielmo, L.G.; Paton, C.D. Validity and Reliability of the PowerCal Device for Estimating Power Output During Cycling Time Trials. J. Strength Cond. Res. 2017, 31, 227–232. [Google Scholar] [CrossRef]
- Costa, V.P.; Tramontin, A.F.; Visentainer, L.H.; Borszcz, F.K. Test-retest reliability and validity of the Stages mountain bike power meter. Isokinet. Exerc. Sci. 2019, 27, 55–61. [Google Scholar] [CrossRef]
- Czajkowski, M.; Bouillod, A.; Dauriannes, A.; Soto-Romero, G.; Grappe, F. Validity and reproducibility of the Powertap P1 power meter when compared with SRM device. J. Sci. Cycl. 2016, 5, 9–10. [Google Scholar]
- Davison, R.; Corbett, J.; Ansley, L. Influence of temperature and protocol on the calibration of the Computrainer electromagnetically-braked cycling ergometer. Int. SportMed J. 2009, 10, 66–76. [Google Scholar]
- Dickinson, T.; Wright, J. The reliability and accuracy of the Garmin Vector 3 power pedals. Proc. Inst. Mech. Eng. Part P J. Sports Eng. Technol. 2021, 235, 70–74. [Google Scholar] [CrossRef]
- Duc, S.; Villerius, V.; Bertucci, W.; Grappe, F. Validity and reproducibility of the ergomo® pro power meter compared with the srm and powertap power meters. Int. J. Sports Physiol. Perform. 2007, 2, 270–281. [Google Scholar] [CrossRef][Green Version]
- Earnest, C.P.; Wharton, R.P.; Church, T.S.; Lucia, A. Reliability of the Lode Excalibur Sport Ergometer and applicability to Computrainer electromagnetically braked cycling training device. J. Strength Cond. Res. 2005, 19, 344–348. [Google Scholar] [CrossRef] [PubMed]
- Finn, J.P.; Maxwell, B.F.; Withers, R.T. Air-braked cycle ergometers: Validity of the correction factor for barometric pressure. Int. J. Sports Med. 2000, 21, 488–491. [Google Scholar] [CrossRef] [PubMed]
- Fiolo, N.J.; Lu, H.Y.; Chen, C.H.; Fuchs, P.X.; Chen, W.H.; Shiang, T.Y. The Validity and Reliability of a Tire Pressure-Based Power Meter for Indoor Cycling. Sensors 2021, 21, 6117. [Google Scholar] [CrossRef]
- Franklin, K.L.; Gordon, R.S.; Baker, J.S.; Davies, B. Comparison of methods for determining power generated on a rope-braked cycle ergometer during low-intensity exercise. Sports Eng. 2006, 9, 29–38. [Google Scholar] [CrossRef]
- Glaner, M.F.; Silva, R.A. Validation of a new cycle ergometer. Int. J. Sports Med. 2011, 32, 117–121. [Google Scholar] [CrossRef][Green Version]
- Gordon, R.; Franklin, K.; Davies, B.; Baker, J. Further mechanical considerations between polar and SRM mobile ergometer systems during laboratory-based high-intensity, intermittent cycling activity. Res. Sports Med. 2007, 15, 241–247. [Google Scholar] [CrossRef]
- Granier, C.; Hausswirth, C.; Dorel, S.; Le Meur, Y. Validity and Reliability of the Stages Cycling Power Meter. J. Strength Cond. Res. 2020, 34, 3554–3559. [Google Scholar] [CrossRef]
- Hoon, M.W.; Michael, S.W.; Patton, R.L.; Chapman, P.G.; Areta, J.L. A comparison of the accuracy and reliability of the Wahoo KICKR and SRM power meter. J. Sci. Cycl. 2016, 5, 11–15. [Google Scholar]
- Hopker, J.; Myers, S.; Jobson, S.A.; Bruce, W.; Passfield, L. Validity and reliability of the Wattbike cycle ergometer. Int. J. Sports Med. 2010, 31, 731–736. [Google Scholar] [CrossRef]
- Hurst, H.T.; Atkins, S. Agreement between polar and SRM mobile ergometer systems during laboratory-based high-intensity, intermittent cycling activity. J. Sports Sci. 2006, 24, 863–868. [Google Scholar] [CrossRef]
- Hurst, H.T.; Atkins, S.; Sinclair, J.; Metcalfe, J. Agreement between the stages cycling and SRM powermeter systems during field-based off-road climbing. J. Sci. Cycl. 2015, 4, 21–27. [Google Scholar]
- Randolph, H.; Gibson, K.; Karlee, E.; Kaitlin, B.; Gregory, M.; Ardalan, V. Validity and Reproducibility of the Garmin Vector Power Meter When Compared to the SRM Device. J. Sports Sci. 2017, 5, 235–241. [Google Scholar] [CrossRef]
- Jones, S.; Passfield, L. The dynamic calibration of bicycle power measuring cranks. Eng. Sport 1998, 3, 265–274. [Google Scholar]
- Kirkland, A.; Coleman, D.; Wiles, J.D.; Hopker, J. Validity and reliability of the Ergomopro powermeter. Int. J. Sports Med. 2008, 29, 913–916. [Google Scholar] [CrossRef][Green Version]
- Lawton, E.; Martin, D.; Lee, H. Validation of SRM power cranks using dynamic calibration. In Proceedings of the Fifth IOC World Congress, Lausanne, The Switzerland, 8 November 1999. [Google Scholar]
- Lanferdini, F.J.; Sperb, C.H.; da Rocha, E.S.; Baptista, R.R.; Vaz, M.A. Power output reliability between Garmin® Vector meter and Lode Excalibur Sport® cycle ergometer. Res. Biomed. Eng. 2020, 36, 333–340. [Google Scholar] [CrossRef]
- Lillo-Bevia, J.R.; Pallares, J.G. Validity and Reliability of the Cycleops Hammer Cycle Ergometer. Int. J. Sports Physiol. Perform. 2018, 13, 853–859. [Google Scholar] [CrossRef]
- MacIntosh, B.R.; Bryan, S.N.; Rishaug, P.; Norris, S.R. Evaluation of the Monark Wingate ergometer by direct measurement of resistance and velocity. Can. J. Appl. Physiol. 2001, 26, 543–558. [Google Scholar] [CrossRef] [PubMed]
- Maier, T.; Schmid, L.; Muller, B.; Steiner, T.; Wehrlin, J.P. Accuracy of Cycling Power Meters against a Mathematical Model of Treadmill Cycling. Int. J. Sports Med. 2017, 38, 456–461. [Google Scholar] [CrossRef]
- McGowan, C.; Watson, G. WahooKICKR18 and common bike-mounted power meters—Do they output accurate power data? J. Sci. Med. Sport 2019, 22, S95. [Google Scholar] [CrossRef]
- McGregor, S.; Rivera, P.D. Validity and Reliability of ComputrainerTM and PowertapTM Power Meters During Sprint Exercise: 141 Board# 48 11: 00 AM–12: 30 PM. Med. Sci. Sports Exerc. 2005, 37, S22. [Google Scholar]
- Maxwell, B.F.; Withers, R.T.; Ilsley, A.H.; Wakim, M.J.; Woods, G.F.; Day, L. Dynamic calibration of mechanically, air- and electromagnetically braked cycle ergometers. Eur. J. Appl. Physiol. Occup. Physiol. 1998, 78, 346–352. [Google Scholar] [CrossRef]
- Merkes, P.F.J.; Menaspa, P.; Abbiss, C.R. Validity of the Velocomp PowerPod Compared With the Verve Cycling InfoCrank Power Meter. Int. J. Sports Physiol. Perform. 2019, 14, 1382–1387. [Google Scholar] [CrossRef]
- Micklewright, D.; Alkhatib, A.; Beneke, R. Mechanically versus electro-magnetically braked cycle ergometer: Performance and energy cost of the Wingate Anaerobic Test. Eur. J. Appl. Physiol. 2006, 96, 748–751. [Google Scholar] [CrossRef]
- Miller, M.C.; Macdermid, P.W.; Fink, P.W.; Stannard, S.R. Agreement between Powertap, Quarq and Stages power meters for cross-country mountain biking. Sports Tech. 2016, 8, 44–50. [Google Scholar] [CrossRef]
- Millet, G.P.; Tronche, C.; Fuster, N.; Bentley, D.J.; Candau, R. Validity and reliability of the Polar S710 mobile cycling powermeter. Int. J. Sports Med. 2003, 24, 156–161. [Google Scholar] [CrossRef]
- Nimmerichter, A.; Schnitzer, L.; Prinz, B.; Simon, D.; Wirth, K. Validity and Reliability of the Garmin Vector Power Meter in Laboratory and Field Cycling. Int. J. Sports Med. 2017, 38, 439–446. [Google Scholar] [CrossRef] [PubMed]
- Montalvo-Perez, A.; Alejo, L.B.; Valenzuela, P.L.; Castellanos, M.; Gil-Cabrera, J.; Talavera, E.; Lucia, A.; Barranco-Gil, D. Validity of the Favero Assioma Duo Power Pedal System for Measuring Power Output and Cadence. Sensors 2021, 21, 2277. [Google Scholar] [CrossRef] [PubMed]
- Pallares, J.G.; Lillo-Bevia, J.R. Validity and Reliability of the PowerTap P1 Pedals Power Meter. J. Sports Sci. Med. 2018, 17, 305–311. [Google Scholar] [PubMed]
- Paton, C.D.; Hopkins, W.G. Ergometer error and biological variation in power output in a performance test with three cycle ergometers. Int. J. Sports Med. 2006, 27, 444–447. [Google Scholar] [CrossRef]
- Gross, M.A.D.; Schellenberg, F.; Lüthi, G.; Baker, M.; Lorenzetti, S. Performance determinants and leg kinematics in the BMX supercross start. J. Sci. Cycl. 2017, 6, 3–12. [Google Scholar] [CrossRef]
- Peiffer, J.J.; Losco, B. Reliability/Validity of the fortius trainer. Int. J. Sports Med. 2011, 32, 353–356. [Google Scholar] [CrossRef] [PubMed]
- Reiser, M.; Meyer, T.; Kindermann, W.; Daugs, R. Transferability of workload measurements between three different types of ergometer. Eur. J. Appl. Physiol. 2000, 82, 245–249. [Google Scholar] [CrossRef]
- Reiser, R.F.; Hart, C.R. Cycling on rollers: Kreitler fan resistance at submaximal levels of effort. Int. J. Sports Med. 2008, 29, 212–216. [Google Scholar] [CrossRef] [PubMed]
- Rivera, P.D.; McGregor, S.J. Validity and Reliability of ComputrainerTM and PowertapTM Power Meters during Incremental and Steady State Exercise: 140 Board# 47 9: 30 AM–11: 00 AM. Med. Sci. Sports Exerc. 2005, 37, S22. [Google Scholar]
- Rodger, S.M.; Plews, D.J.; McQuillan, J.; Driller, M.W. Evaluation of the Cyclus cycle ergometer and the Stages power meter for measurement of power output in cycling. J. Sci. Cycl. 2016, 5, 16–22. [Google Scholar]
- Rodriguez-Rielves, V.; Lillo-Bevia, J.R.; Buendia-Romero, A.; Martinez-Cava, A.; Hernandez-Belmonte, A.; Courel-Ibanez, J.; Pallares, J.G. Are the Assioma Favero Power Meter Pedals a Reliable Tool for Monitoring Cycling Power Output? Sensors 2021, 21, 2789. [Google Scholar] [CrossRef]
- Rodriguez-Rielves, V.; Martinez-Cava, A.; Buendia-Romero, A.; Lillo-Bevia, J.R.; Courel-Ibanez, J.; Hernandez-Belmonte, A.; Pallares, J.G. Reproducibility of the Rotor 2INpower Crankset for Monitoring Cycling Power Output: A Comprehensive Analysis in Different Real-Context Situations. Int. J. Sports Physiol. Perform. 2021, 17, 120–125. [Google Scholar] [CrossRef]
- Wainwright, B.; Cooke, C.B.; O’Hara, J.P. The validity and reliability of a sample of 10 Wattbike cycle ergometers. J. Sports Sci. 2017, 35, 1451–1458. [Google Scholar] [CrossRef]
- Whittle, C.; Smith, N.; Jobson, S.A. Validity of PowerTap P1 Pedals during Laboratory-Based Cycling Time Trial Performance. Sports 2018, 6, 92. [Google Scholar] [CrossRef]
- Wilmore, J.H.; Constable, S.H.; Stanforth, P.R.; Buono, M.J.; Tsao, Y.W.; Roby Jr, F.; Lowdon, B.; Ratliff, R. Mechanical and physiological calibration of four cycle ergometers. Med. Sci. Sports Exerc. 1981, 14, 322–325. [Google Scholar]
- Wright, J.; Walker, T.; Burnet, S.; Jobson, S.A. The Reliability and Validity of the PowerTap P1 Power Pedals Before and After 100 Hours of Use. Int. J. Sports Physiol. Perform. 2019, 14, 855–858. [Google Scholar] [CrossRef]
- Zadow, E.K.; Kitic, C.M.; Wu, S.S.; Smith, S.T.; Fell, J.W. Validity of Power Settings of the Wahoo KICKR Power Trainer. Int. J. Sports Physiol. Perform. 2016, 11, 1115–1117. [Google Scholar] [CrossRef] [PubMed]
- Zadow, E.K.; Kitic, C.M.; Wu, S.S.; Fell, J.W. Reliability of Power Settings of the Wahoo KICKR Power Trainer After 60 Hours of Use. Int. J. Sports Physiol. Perform. 2018, 13, 119–121. [Google Scholar] [CrossRef]
- Strain Gauge—An Overview | ScienceDirect Topics. Available online: https://www.sciencedirect.com/topics/engineering/strain-gauge (accessed on 27 November 2021).
- Besnier, F.; Laruelle, E.; Genestier, S.; Gie, S.; Vigneau, C.; Carre, F. [Effects of exercise training on ergocycle during hemodialysis in patients with end stage renal disease: Relevance of the anaerobic threshold intensity]. Nephrol. Ther. 2012, 8, 231–237. [Google Scholar] [CrossRef] [PubMed]
- Bland, J.M.; Altman, D. Statistical methods for assessing agreement between two methods of clinical measurement. Lancet 1986, 327, 307–310. [Google Scholar] [CrossRef]
- Hermand, E.; Cassirame, J.; Ennequin, G.; Hue, O. Validation of a Photoplethysmographic Heart Rate Monitor: Polar OH. Int. J. Sports Med. 2019, 40, 462–467. [Google Scholar] [CrossRef]
- Muhlen, J.M.; Stang, J.; Lykke Skovgaard, E.; Judice, P.B.; Molina-Garcia, P.; Johnston, W.; Sardinha, L.B.; Ortega, F.B.; Caulfield, B.; Bloch, W.; et al. Recommendations for determining the validity of consumer wearable heart rate devices: Expert statement and checklist of the INTERLIVE Network. Br. J. Sports Med. 2021, 55, 767–779. [Google Scholar] [CrossRef]
- Sanderson, D.J. The influence of cadence and power output on the biomechanics of force application during steady-rate cycling in competitive and recreational cyclists. J. Sports Sci. 1991, 9, 191–203. [Google Scholar] [CrossRef]
- Obeid, J.; Larche, M.J.; Timmons, B.W. Optimizing the Wingate Anaerobic Cycling Test for youth with juvenile idiopathic arthritis. Pediatr. Exerc. Sci. 2011, 23, 303–310. [Google Scholar] [CrossRef]
- Menaspa, P.; Abbiss, C.R.; Martin, D.T. Performance analysis of a world-class sprinter during cycling grand tours. Int. J. Sports Physiol. Perform. 2013, 8, 336–340. [Google Scholar] [CrossRef]
- Evans, J.A.; Quinney, H.A. Determination of resistance settings for anaerobic power testing. Can. J. Appl. Sport Sci. 1981, 6, 53–56. [Google Scholar] [PubMed]
- Davies, C.; Wemyss-Holden, J.; Young, K. Measurement of short term power output: Comparison between cycling and jumping. Ergonomics 1984, 27, 285–296. [Google Scholar] [CrossRef]
- Duarte, J.P.; Coelho, E.S.M.J.; Severino, V.; Martinho, D.; Luz, L.; Pereira, J.R.; Baptista, R.; Valente-Dos-Santos, J.; Machado-Rodrigues, A.M.; Vaz, V.; et al. Reproducibility of peak power output during a 10-s cycling maximal effort using different sampling rates. Acta Physiol. Hung. 2014, 101, 496–504. [Google Scholar] [CrossRef]
- Bland, J.M.; Altman, D.G. Comparing two methods of clinical measurement: A personal history. Int. J. Epidemiol. 1995, 24 (Suppl. 1), S7–S14. [Google Scholar] [CrossRef]
- Altman, D.G.; Bland, J.M. Measurement in medicine: The analysis of method comparison studies. Statistician 1983, 32, 307–317. [Google Scholar] [CrossRef]
- Hopkins, W.G. How to interpret changes in an athletic performance test. Sportscience 2004, 8, 1–7. [Google Scholar]
- Sale, D.; Norman, R. Testing strength and power. In Physiological Testing of the High Performance Athlete; Human Kinetics: Champaign, IL, USA, 1991; pp. 21–106. [Google Scholar]
- Lin, L.I. A concordance correlation coefficient to evaluate reproducibility. Biometrics 1989, 45, 255–268. [Google Scholar] [CrossRef]
- Paton, C.D.; Hopkins, W.G. Variation in performance of elite cyclists from race to race. Eur. J. Sport Sci. 2006, 6, 25–31. [Google Scholar] [CrossRef]
- Van Praagh, E.; Bedu, M.; Roddier, P.; Coudert, J. A simple calibration method for mechanically braked cycle ergometers. Int. J. Sports Med. 1992, 13, 27–30. [Google Scholar] [CrossRef] [PubMed]
- Abbiss, C.R.; Quod, M.J.; Levin, G.; Martin, D.T.; Laursen, P.B. Accuracy of the Velotron ergometer and SRM power meter. Int. J. Sports Med. 2009, 30, 107–112. [Google Scholar] [CrossRef] [PubMed]
- Morrow, J.R.; Jackson, A.W. How “significant” is your reliability? Res. Q. Exerc. Sport 1993, 64, 352–355. [Google Scholar] [CrossRef]
- Atkinson, G. A comparison of statistical methods for assessing measurement repeatability in ergonomics research. Sport Leis. Ergon. 1995, 218–222. [Google Scholar]
- Bland, J.M.; Altman, D.G. A note on the use of the intraclass correlation coefficient in the evaluation of agreement between two methods of measurement. Comput. Biol. Med. 1990, 20, 337–340. [Google Scholar] [CrossRef]
- Sullivan, G.M.; Feinn, R. Using effect size-or why the P value is not enough. J. Grad. Med. Educ. 2012, 4, 279–282. [Google Scholar] [CrossRef]
- Cohen, J. Statistical Power Analysis for the Behavioral Sciences; Lawrence Erlbaum Associates Publishers: Mahwah, NJ, USA, 1988. [Google Scholar]
- Paton, C.D.; Hopkins, W.G. Tests of cycling performance. Sports Med. 2001, 31, 489–496. [Google Scholar] [CrossRef] [PubMed]
- Okura, T.; Tanaka, K. [Assessment of maximal aerobic and anaerobic power using cycling ergometry]. Nihon Rinsho 2000, 58, 157–161. [Google Scholar]
- Bar-Or, O. The Wingate anaerobic test. An update on methodology, reliability and validity. Sports Med. 1987, 4, 381–394. [Google Scholar] [CrossRef] [PubMed]
- Bulbulian, R.; Jeong, J.W.; Murphy, M. Comparison of anaerobic components of the Wingate and Critical Power tests in males and females. Med. Sci. Sports Exerc. 1996, 28, 1336–1341. [Google Scholar] [CrossRef]
- Vandewalle, H.; Peres, G.; Heller, J.; Panel, J.; Monod, H. Force-velocity relationship and maximal power on a cycle ergometer. Correlation with the height of a vertical jump. Eur. J. Appl. Physiol. Occup. Physiol. 1987, 56, 650–656. [Google Scholar] [CrossRef]
- Arsac, L.M.; Belli, A.; Lacour, J.R. Muscle function during brief maximal exercise: Accurate measurements on a friction-loaded cycle ergometer. Eur. J. Appl. Physiol. Occup. Physiol. 1996, 74, 100–106. [Google Scholar] [CrossRef]
- Ravier, G.; Grappe, F.; Rouillon, J.D. Application of force-velocity cycle ergometer test and vertical jump tests in the functional assessment of karate competitor. J. Sports Med. Phys. Fit. 2004, 44, 349–355. [Google Scholar]
- Bassett, D.R., Jr. Correcting the Wingate test for changes in kinetic energy of the ergometer flywheel. Int. J. Sports Med. 1989, 10, 446–449. [Google Scholar] [CrossRef] [PubMed]
- Franklin, K.L.; Gordon, R.S.; Baker, J.S.; Davies, B. Accurate assessment of work done and power during a Wingate anaerobic test. Appl. Physiol. Nutr. Metab. 2007, 32, 225–232. [Google Scholar] [CrossRef] [PubMed]
- Santos, E.L.; Novaes, J.S.; Reis, V.M.; Giannella-Neto, A. Low sampling rates bias outcomes from the Wingate test. Int. J. Sports Med. 2010, 31, 784–789. [Google Scholar] [CrossRef] [PubMed]
- Higgins, S.; Fedewa, M.V.; Hathaway, E.D.; Schmidt, M.D.; Evans, E.M. Sprint interval and moderate-intensity cycling training differentially affect adiposity and aerobic capacity in overweight young-adult women. Appl. Physiol. Nutr. Metab. 2016, 41, 1177–1183. [Google Scholar] [CrossRef]
- Burtscher, M.; Pachinger, O.; Ehrenbourg, I.; Mitterbauer, G.; Faulhaber, M.; Pühringer, R.; Tkatchouk, E. Intermittent hypoxia increases exercise tolerance in elderly men with and without coronary artery disease. Int. J. Cardiol. 2004, 96, 247–254. [Google Scholar] [CrossRef]
- Vogel, T.; Leprêtre, P.-M.; Brechat, P.-H.; Lonsdorfer, E.; Benetos, A.; Kaltenbach, G.; Lonsdorfer, J. Effects of a short-term personalized Intermittent Work Exercise Program (IWEP) on maximal cardio-respiratory function and endurance parameters among healthy young and older seniors. J. Nutr. Health Aging 2011, 15, 905–911. [Google Scholar] [CrossRef]
- Hancock, N.J.; Shepstone, L.; Rowe, P.; Myint, P.K.; Pomeroy, V.M. Towards Upright Pedalling to drive recovery in people who cannot walk in the first weeks after stroke: Movement patterns and measurement. Physiotherapy 2017, 103, 400–406. [Google Scholar] [CrossRef] [PubMed]
- Shah, C.; Beall, E.B.; Frankemolle, A.M.; Penko, A.; Phillips, M.D.; Lowe, M.J.; Alberts, J.L. Exercise Therapy for Parkinson’s Disease: Pedaling Rate Is Related to Changes in Motor Connectivity. Brain Connect. 2016, 6, 25–36. [Google Scholar] [CrossRef]
- Chavarren, J.; Calbet, J.A. Cycling efficiency and pedalling frequency in road cyclists. Eur. J. Appl. Physiol. Occup. Physiol. 1999, 80, 555–563. [Google Scholar] [CrossRef]
- Hagberg, J.M.; Mullin, J.P.; Giese, M.D.; Spitznagel, E. Effect of pedaling rate on submaximal exercise responses of competitive cyclists. J. Appl. Physiol. Respir. Environ. Exerc. Physiol. 1981, 51, 447–451. [Google Scholar] [CrossRef]
- Dang, Q.K.; Suh, Y.S. Sensor saturation compensated smoothing algorithm for inertial sensor based motion tracking. Sensors 2014, 14, 8167–8188. [Google Scholar] [CrossRef]
- Duc, S.; Bertucci, W.; Pernin, J.N.; Grappe, F. Muscular activity during uphill cycling: Effect of slope, posture, hand grip position and constrained bicycle lateral sways. J. Electromyogr. Kinesiol. 2008, 18, 116–127. [Google Scholar] [CrossRef] [PubMed]
- Chapman, A.; Vicenzino, B.; Blanch, P.; Hodges, P. Do differences in muscle recruitment between novice and elite cyclists reflect different movement patterns or less skilled muscle recruitment? J. Sci. Med. Sport 2009, 12, 31–34. [Google Scholar] [CrossRef] [PubMed]
- Hug, F.; Drouet, J.M.; Champoux, Y.; Couturier, A.; Dorel, S. Interindividual variability of electromyographic patterns and pedal force profiles in trained cyclists. Eur. J. Appl. Physiol. 2008, 104, 667–678. [Google Scholar] [CrossRef] [PubMed]
- Garcia-Lopez, J.; Diez-Leal, S.; Ogueta-Alday, A.; Larrazabal, J.; Rodriguez-Marroyo, J.A. Differences in pedalling technique between road cyclists of different competitive levels. J. Sports Sci. 2016, 34, 1619–1626. [Google Scholar] [CrossRef] [PubMed]
- Korff, T.; Romer, L.M.; Mayhew, I.; Martin, J.C. Effect of pedaling technique on mechanical effectiveness and efficiency in cyclists. Med. Sci. Sports Exerc. 2007, 39, 991–995. [Google Scholar] [CrossRef]
- Mornieux, G.; Stapelfeldt, B.; Gollhofer, A.; Belli, A. Effects of pedal type and pull-up action during cycling. Int. J. Sports Med. 2008, 29, 817–822. [Google Scholar] [CrossRef]
- Mornieux, G.; Gollhofer, A.; Stapelfeldt, B. Muscle coordination while pulling up during cycling. Int. J. Sports Med. 2010, 31, 843–846. [Google Scholar] [CrossRef]
- Smak, W.; Neptune, R.R.; Hull, M.L. The influence of pedaling rate on bilateral asymmetry in cycling. J. Biomech. 1999, 32, 899–906. [Google Scholar] [CrossRef]
- Edeline, O.; Polin, D.; Tourny-Chollet, C.; Weber, J. Effect of workload on bilateral pedaling kinematics in non-trained cyclists. J. Hum. Mov. Stud. 2004, 46, 493–517. [Google Scholar]
- Carpes, F.P.; Faria, I.E.; Mota, C.B. Influence of Exercise Intensity on Bilateral Pedaling Symmetry. Progress in Motor Control VI. 2007. Available online: https://www.semanticscholar.org/paper/Influence-of-exercise-intensity-on-bilateral-Carpes-Rossato/8730adee662e0b307dc1cc36d471c3317b422d5b (accessed on 6 November 2021).
- Carpes, F.P.; Mota, C.B.; Faria, I.E. On the bilateral asymmetry during running and cycling—A review considering leg preference. Phys. Ther. Sport 2010, 11, 136–142. [Google Scholar] [CrossRef]
- Boonstra, T.; Daffertshofer, A.; Van Ditshuizen, J.; Van den Heuvel, M.; Hofman, C.; Willigenburg, N.; Beek, P. Fatigue-related changes in motor-unit synchronization of quadriceps muscles within and across legs. J. Electromyogr. Kinesiol. 2008, 18, 717–731. [Google Scholar] [CrossRef] [PubMed]
- Kell, D.T.; Greer, B.K. Use of the Wattbike cycle ergometer for attenuation of bilateral pedaling asymmetry in trained cyclists. J. Strength Cond. Res. 2017, 31, 468–473. [Google Scholar] [CrossRef] [PubMed]
- Wooles, A.L.; Robinson, A.J.; Keen, P.S. A static method for obtaining a calibration factor for SRM bicycle power cranks. Sports Eng. 2005, 8, 137–144. [Google Scholar] [CrossRef]
- Shute, R.; Zak, R.; Slivka, D. Validity and reproducibility of commercial cycling power meters in hot and cold environmental temperatures. J. Sci. Cycl. 2019, 8, 32–39. [Google Scholar] [CrossRef]
Publisher’s Note: MDPI stays neutral with regard to jurisdictional claims in published maps and institutional affiliations. |
© 2022 by the authors. Licensee MDPI, Basel, Switzerland. This article is an open access article distributed under the terms and conditions of the Creative Commons Attribution (CC BY) license (https://creativecommons.org/licenses/by/4.0/).