Letter

Prototype of a Textronic Sensor Created with a Physical Vacuum Deposition Process for Staphylococcus aureus Detection

1
Faculty of Electrical, Electronic, Computer and Control Engineering, Lodz University of Technology, Stefanowskiego 18/22, 90-924 Łódź, Poland
2
Faculty of Technical Physics, Information Technology and Applied Mathematics, Lodz University of Technology, ul. Wólczańska 215, 90-924 Łódź, Poland
3
Faculty of Production and Power Engineering, University of Agriculture in Krakow, Balicka 116 B, 30-149 Kraków, Poland
*
Author to whom correspondence should be addressed.
Sensors 2021, 21(1), 183; https://doi.org/10.3390/s21010183
Submission received: 21 November 2020 / Revised: 21 December 2020 / Accepted: 25 December 2020 / Published: 29 December 2020

Abstract

:
Staphylococcus aureus is a bacterium which people have been in contact with for thousands of years. Its presence often leads to severe disorders of the respiratory and circulatory systems. The authors of this article present a prototype of a textronic sensor enabling the detection of this bacterium. This sensor was created using a process of physical vacuum deposition on a flexible textile substrate which can be implemented on clothing. With increasing numbers of bacterial colonies, changes in the sensor’s electrical parameters were observed. The sensor’s resistance reduced by 50% and the capacitance more than doubled within the first two days of starting bacterial cultures. Extensive changes in electrical parameters were observed at 100 Hz and 120 Hz of the measurement signal.

1. Introduction

Human skin is the largest organ of the body, constituting a barrier against microorganisms, including those of a pathogenic nature [1]. Many microorganisms inhabit human skin, with the most numerous being bacteria and fungi. These microorganisms can be divided into two groups: permanent and transient (periodically appearing) microflora. The presence of auto- and allochthonous flora on the skin depends on many environmental and individual factors [2]. Higher temperature and humidity in certain areas (e.g., the groin or armpit) favor the development of microorganisms, mainly Gram-negative bacteria or Staphylococcus aureus [1,3,4,5,6]. Using genetic engineering, it has been established that the solid microflora of the skin include coagulase-negative staphylococci and bacteria of the genera Corynebacterium, Propionibacterium, Brevibacterium, or Micrococcus. In contrast, transient colonizers (mainly in pathological conditions) include Staphylococcus aureus, Staphylococcus pyogenes, and Pseudomonas aeruginosa [1,5,7,8,9].
Skin infections are most often caused by staphylococci and streptococci [10]. Staphylococcus aureus is the only coagulase-positive staphylococcus commonly found on the skin and mucous membranes of humans. Usually, it does not appear on a healthy person’s skin, but it inhabits the mucous membranes of the nose and throat. According to multiple studies in healthy human populations, between 18% and 40% are carriers of Staphylococcus aureus. It is believed that about 20% of the population are persistent carriers, with some being asymptomatic [6,11,12,13].
Conventional Staphylococcal aureus detection methods are laborious and require laboratory work. Among them there is a molecular biology analysis based on the polymerase chain reaction, which is an indirect method of microbial detection. The available chromatographic methods require trained personnel and tedious pre-treatment of the sample. In line with global trends, the aim should be to develop sensors based on new technologies, such as immunosensors, in combination with optical, electrical, and mass detection techniques. A detailed description of Staphylococcal aureus detection procedures is provided by Wu et al. [14].
Practical determination of a microorganism’s presence requires analyses, for which the main limitations are the time and sensitivity of the method. Biosensors are a promising alternative tool for the rapid detection of microorganisms, and because of their potential, they are used in various spheres of human life [15].
The authors of this paper present a textronic sensor prototype that can be integrated into human clothing. Such sensors can be part of a wearable electronic system.
Wearable electronics were originally developed the second decade of the twentieth century. As a precursor, in his laboratory at MIT (Massachusetts Institute of Technology) Steve Mann worked on reducing electronic devices to a portable size. Nowadays, with the miniaturization of electronic components at an advanced level, scientists are combining miniaturized electronic systems with human clothing. Therefore, a new scientific field was created to combine electronics, material engineering, metrology, and computer science with textiles, with the result being textronics. This is also an area where sensors will thrive. According to data from 2018, the wearable sensors market in 2016 reached around US$150 million, and it is expected to increase (Figure 1).
The combination of textile substrates with electronic systems elements is possible using one of many methods including embroidery, knitting, weaving, ink-jet printing, dip-coating, electroless plating, magnetron sputtering, chemical vapor deposition, or physical vacuum deposition [17,18,19,20,21,22,23]. Depending on the used method, it is possible to produce electrically conductive structures at various stages when creating the final textile product. The use of individual methods also depends on the physicochemical properties of the textile substrate.
There are known sensors based on flexible substrates made of textiles. However, most often they use electrically conductive fibers embedded in the fabric structure using the process of weaving, knitting, or embroidery [24]. Flexible substrates facilitate diagnostics, improving non-invasive health monitoring. A review of the available solutions of biosensors produced on flexible polymer substrates is described in [25]. Mathew et al. described the possibility of using flexible, short-term disposable sensors on other polymer substrates to monitor health in real time, using physiological fluids such as saliva, sweat, and tear fluid (e.g., contact lenses for glucose monitoring) [26].
The authors then describe the results of their work in relation to the sensor’s production for bacteria detection on a textile substrate. The sensor structure was developed based on interdigitated electrodes (IDEs) on a flexible substrate that can be an integral part of any textile product [27].
IDEs are usually produced on rigid substrates such as silicon or glass [28,29,30]. Interdigitated electrodes are made in the form of two individual addressable comb-like interdigitated structures. IDEs form part of a group of transducers widely used in metrology where impedance and capacity changes are essential, e.g., in humidity and gas sensors, and in biosensors for tumor cell and cardiac troponin T biomarker detection or in biomedical applications [31,32,33,34,35,36,37,38,39,40]. In the literature, there are also reports on the usage of IDEs in sterility tests in the food industry. One sensor was used to assess sterilization processes using H2O2 (hydrogen peroxide) vapor [29]. The authors of the work suggested using a sensor built based on IDEs for the detection of bacteria, specifically Staphylococcus aureus, which can be present on the skin. The sensor should be a part of specialized dressings for difficult-to-heal wounds [41], which are most often changed every 3 days. The location of the sensor in such a dressing will allow not only for tracking potential microbiological hazards, but also for monitoring the treatment process and generating an alarm in abnormal conditions. In the future the authors also will conduct a study using IDEs sensors for a broader range of temperatures, as in [42,43].

2. Materials and Methods

2.1. Sensor Preparation

The interdigitated electrodes were prepared and used as a sensor for bacteria detection. They were manufactured in an environmentally friendly, physical vacuum deposition process (PVD) using silver with high purity (99.99% guaranteed by the Metals Mint Ltd., Poland) as the deposited metal. The authors investigated sensors with silver layers because this metal is known for its antibacterial properties [44] and as a material which is stable in air with a wide temperature range [45]. The electrodes were created on a textile composite substrate known on the market as Cordura. It is the trade name for a composite made from nylon threads covered with a polyurethane layer which produces an electroconductive continuous layer. The surface mass of the used substrate was 195 g/m2.
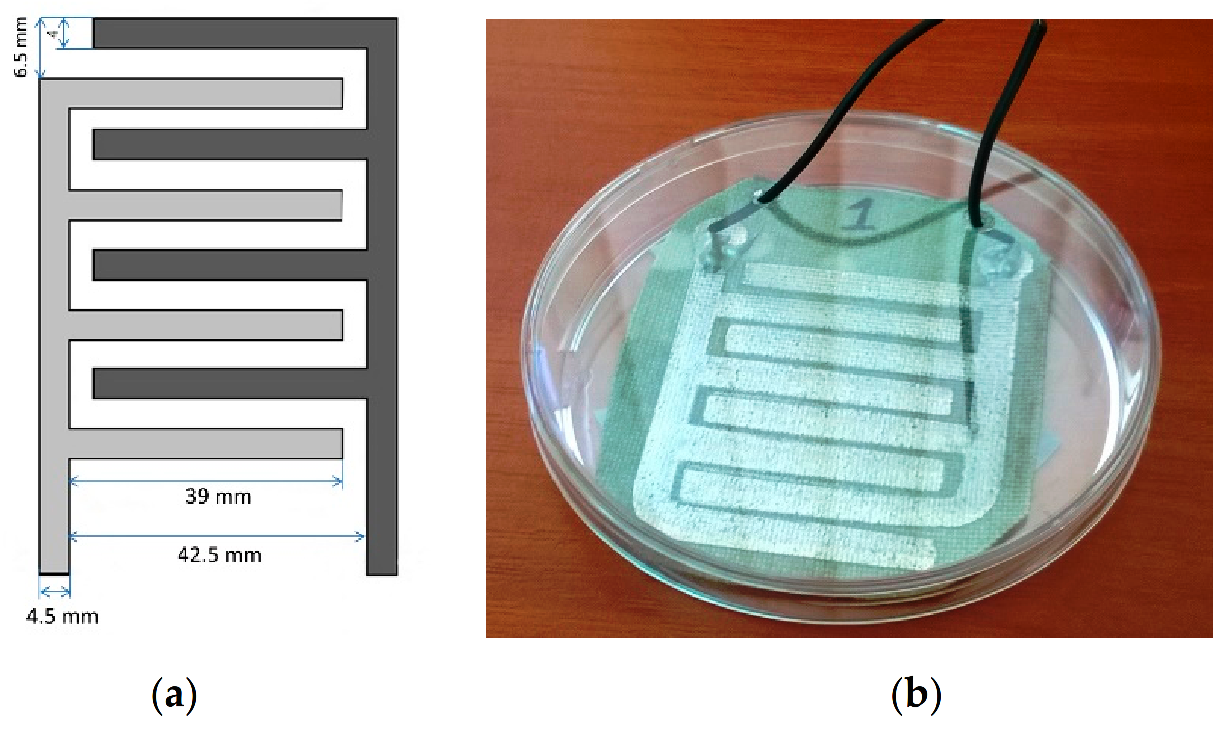
The pre-vacuum value in the PVD process was 5·× 10−5 mbar (0.005 Pa). The application time of the metal from the tungsten boat source was 5 min. The substrate was cleaned with organic solvents and then conditioned at 23 °C and 50% humidity for 24 h. To obtain the assumed shape, masks with the geometry shown in Figure 2 were prepared. The usage of an obscuring mask to produce the desired structures is associated with the phenomenon of shading at the area between the mask and the substrate. For that reason, to minimize this undesirable effect, the authors used a 1-mm-thick mask made of stainless steel created using a laser cutting process [46].
The authors of the study placed measuring electrodes using electroconductive AMEPOX adhesive glue on the bottom of the electrodes (Figure 2b).

2.2. Bio Material

In known evaluation research methods, detection of Staphylococcus aureus is recommended to test infertility (the fertility of substrates used and the suitability of the method), the microbiological cleanness of non-vital products (quantitative microbiological qualities), the effectiveness of disinfectants, and protection against microbes (maintenance test) (Table 1).
For that reason, the authors of the article chose the Staphylococcus aureus bacterium to test the suitability of textronic sensors for bacteria detection. The choice of Staphylococcus aureus is additionally justified due to the nature of the selected substrate and the possibility of using it as an integral part of clothing or other textiles.
The strain Staphylococcus aureus ATCC 25923 was used as an example of the microorganism of transient skin microflora. The used reference strain was obtained directly from the American Type Culture Collection (ATCC, Manassas, Virginia). It belongs to a group of microorganisms that cause exogenous nosocomial infections. Before testing, the strain was stored in a specialized microbank in a frozen state (−70 °C) in the form of a lyophilizate. Strains which are stored in such conditions for many years do not change their properties during storage.
At the initial stage of research, the substrates were autoclaved at a temperature of 121 °C, with a pressure of 1 bar for 15 min. Before testing, the strains were revived by spreading on a Petri dish with solid trypticase soy agar (TSA) medium (Trypticasein Soy LAB-AGAR, BIOMAXIMA, POLAND), with the composition listed in Table 2. It is a non-selective, tryptose-soybean medium for the general cultivation of microorganisms with different growth requirements from clinical samples, pharmaceutical preparations, cosmetics, etc. Cultivation was carried out under aerobic conditions for 24 h at 37 °C.

2.3. Measurement Method

One-hundred-and-fifty milliliters of sterile liquid nutrient medium Nutrient Broth (BIOCOPR, Warsaw, Poland) were poured to the sterile conical flasks (300 mL). The composition of the medium is presented in Table 3. It is a liquid for general use, mainly for the propagation of microorganisms with low growth requirements. Then, from the obtained colonies, a test culture was prepared by preparing microbial suspensions with an optical density of 0.5 on the McFarland scale (Figure 3).
The optical density was measured with a DEN-1B densitometer. Then, in separate, sterile, glass Petri dishes (d = 200 mm) the tested sensors were placed and flooded with previously prepared microbial suspensions.

2.4. Electrical Measurement

Measurements of electrical capacitance and resistance as a real component of impedance using the CEM DT-9935 impedance meter were taken in the case of clean sensors, sensors placed in clean medium, and those placed in the microbial suspensions with an initial optical density of 0.5 on the McFarland scale. The meter uses the ES51919/ES51920 chipset, which includes an analogue front-end integrated circuit with a resistor network to control various ranges. The circuit also provides a variable frequency generator for complex impedance measurement. It is equipped with a 4.5 digital A/C converter. The circuit has the ability to measure AC impedance and DC resistance. Thanks to this, it is possible to automatically or manually measure inductance and capacitance together with parasitic resistances as well as the dissipation factor (D), Q factor (Q), and phase angle of impedance. It is also possible to determine the equivalent resistance of the equivalent circuit of a series or parallel capacitor and coil. The test frequencies of 100 Hz/120 Hz/1 kHz/10 kHz/100 kHz can be selected depending on the tested structure type. Due to the capacitive nature of the circuit, the authors used the measurement at alternating current to obtain the real part’s value (resultant resistance) and the reactance (imaginary part) of the thin-film structure. The necessity to carry out R and C measurements at alternating current also results from the skin effect for the thin-film structure and its influence on the real part of impedance as a function of frequency. Due to the low values of the measured capacitance, capacitance measurements were taken in a parallel system following the meter manufacturer’s recommendations. The measurements were taken at the beginning of the tests and 21, 28, 45, 52, 69, 77 and 90 h after establishing the culture. Cultures were grown on a shaker (50 rpm) at room temperature.

3. Results and Discussion

Silver is a metal with a broad spectrum of anti-microbial activity, and at the same time, it exhibits low toxicity towards mammalian cells. Because of the interaction of silver with bacteria, creating sensors based on that metal is justifiable. The sheet resistance value of the produced electroconductive structures was 1.2 Ω/sq.
During the tests, in addition to electrical parameters, bacterial growth was also monitored using a standard measurement procedure—the McFarland scale. The plot of the number of bacteria as a function of time is presented in Figure 4. The measurements made indicated the development of the bacteria. Changes in dielectric properties between flat electrodes will cause a change in the capacity as well in the resistance of the entire IDE structure.
The growth process of the tested strain of Staphylococcus aureus ATCC 25923 is represented by a growth curve. For certain culture conditions, the bacterial growth curve is characteristic for the species. Figure 4 shows three of the four theoretical phases of microorganism development. Phase II is the exponential growth phase (logarithmic phase). The bacteria divide very quickly, and during this phase, the cell suspension should be taken as the initial sample for subsequent dilutions. Phase III, i.e., the stationary phase, is characterized by a constant number of cells in culture due to the decreasing number of nutrients and the increasing amounts of metabolite in the medium. Phase IV is the dying out phase (final phase), where the quantities of metabolic products in the medium becomes toxic, and the lack of nutrients leads to the death of the culture.
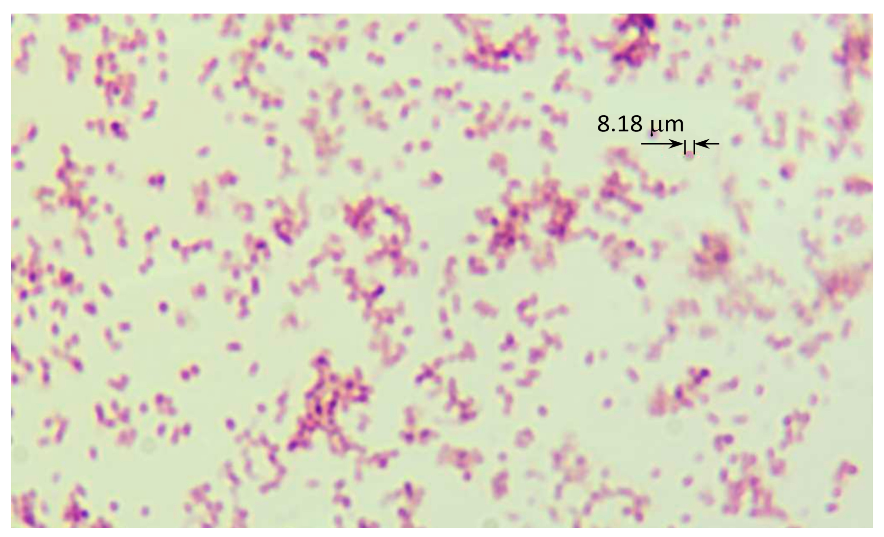
In the third phase of bacterial growth, optical density stabilized at the level of 10 McF, which was recorded between 45 and 69 h of bacterial growth. Figure 5 shows an image that was taken via an optical microscope when the optical density was 6.25 McF.
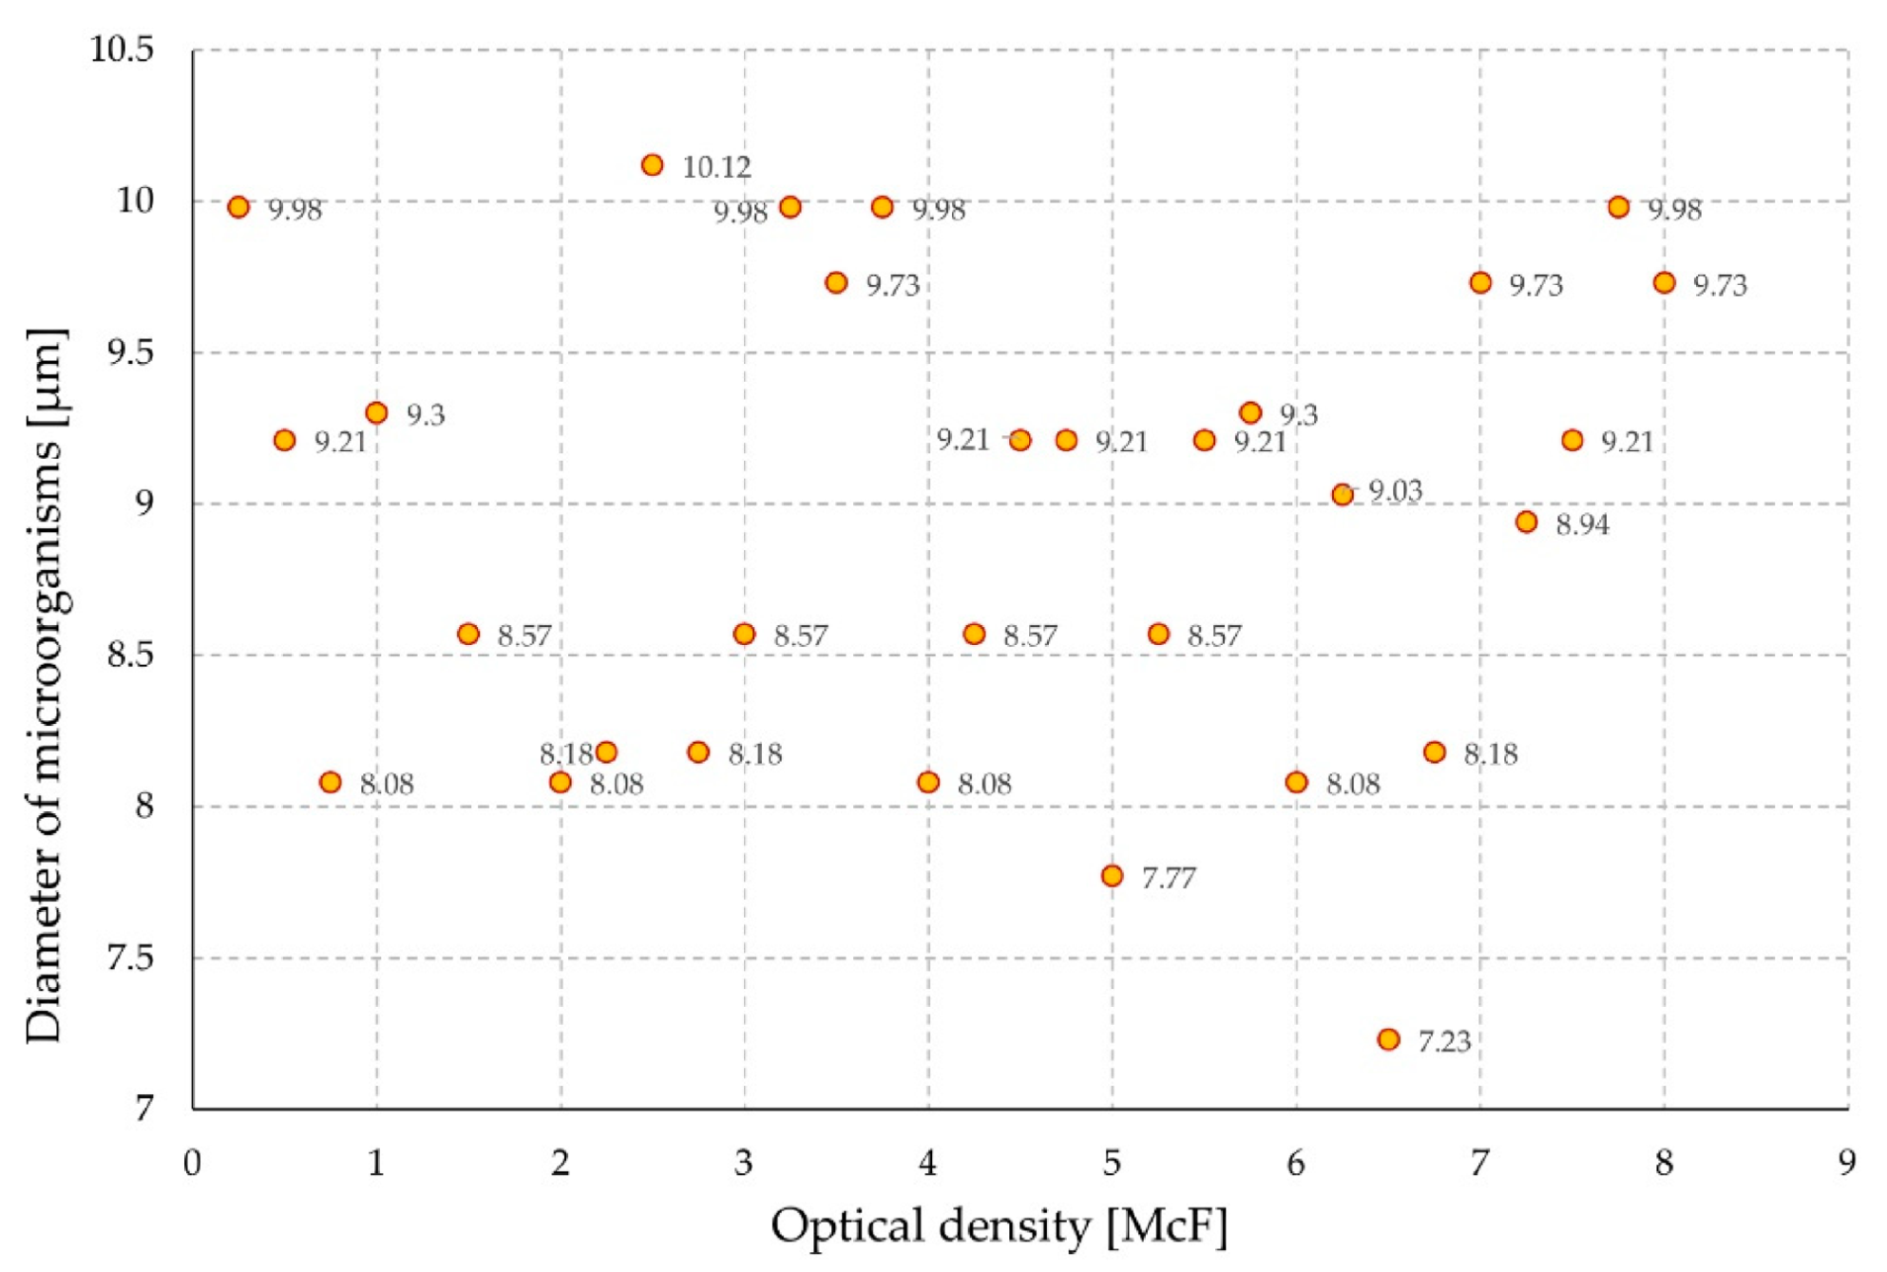
The geometrical parameters of individual microorganisms were examined at different levels of optical density of the solution to exclude its influence on the results of sensor’s electrical measurements. The tests were performed on a suspension without placed sensors. There was no effect of optical density on the cell diameter (Figure 6).
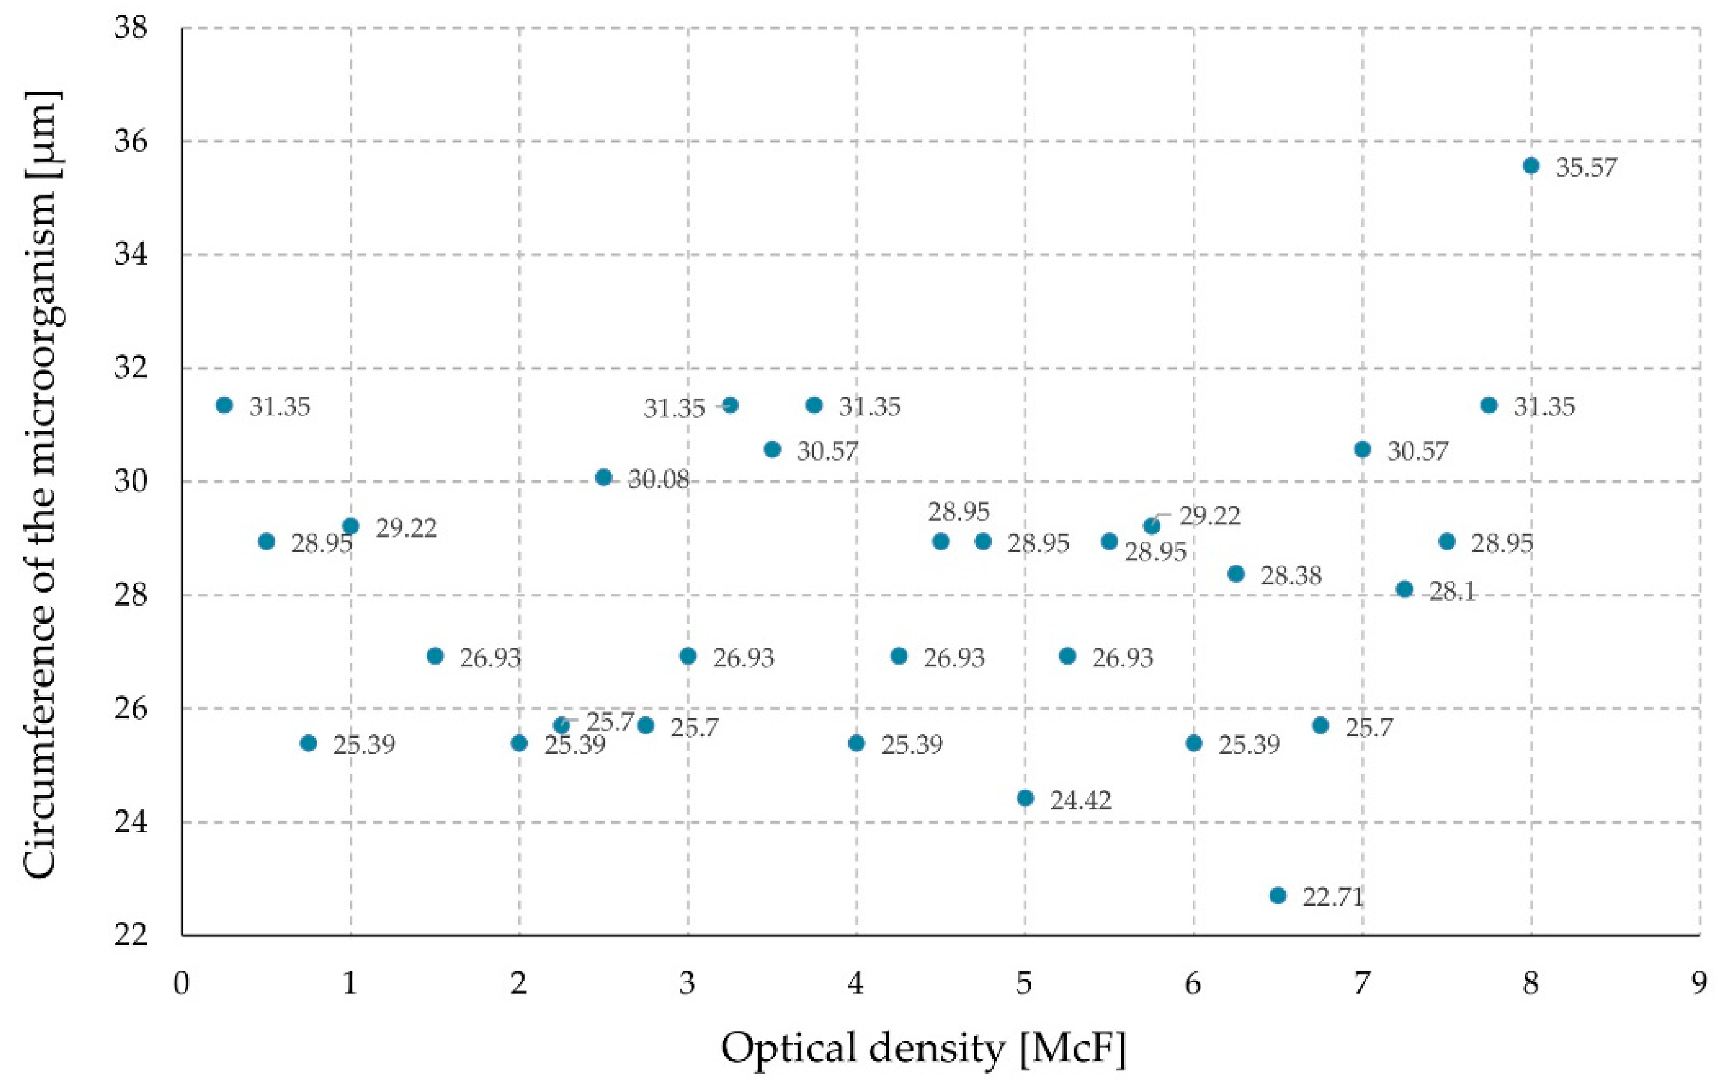
Additionally, the circumference of the microorganism was measured (Figure 7). No quantitative relationships were found.
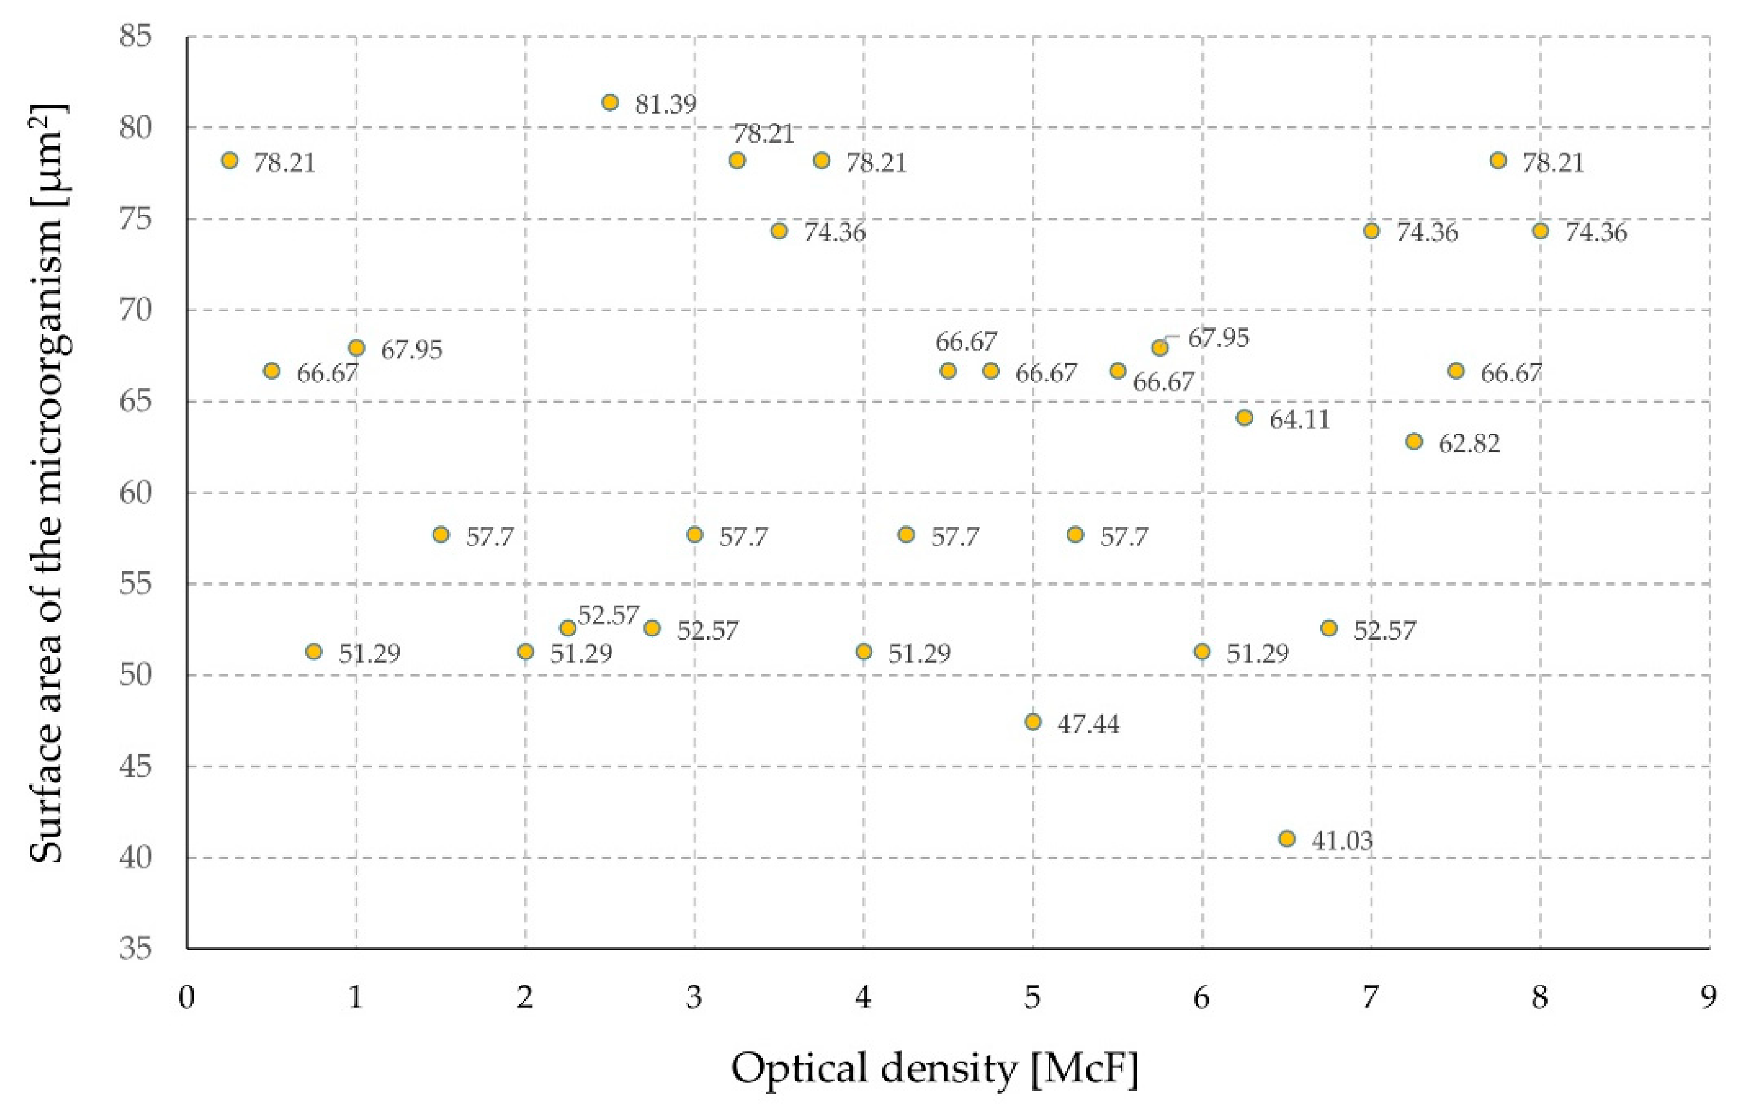
The surface area of the microorganism was also determined (Figure 8). As in the above-mentioned cases, the influence of the surface of the microorganism on the optical density and the measurement result was excluded in the case of sensor tests.
Because there was no difference in the geometric dimensions of bacteria (Figure 6, Figure 7 and Figure 8), the time of the experiment was determined only by the optical density of the suspension.
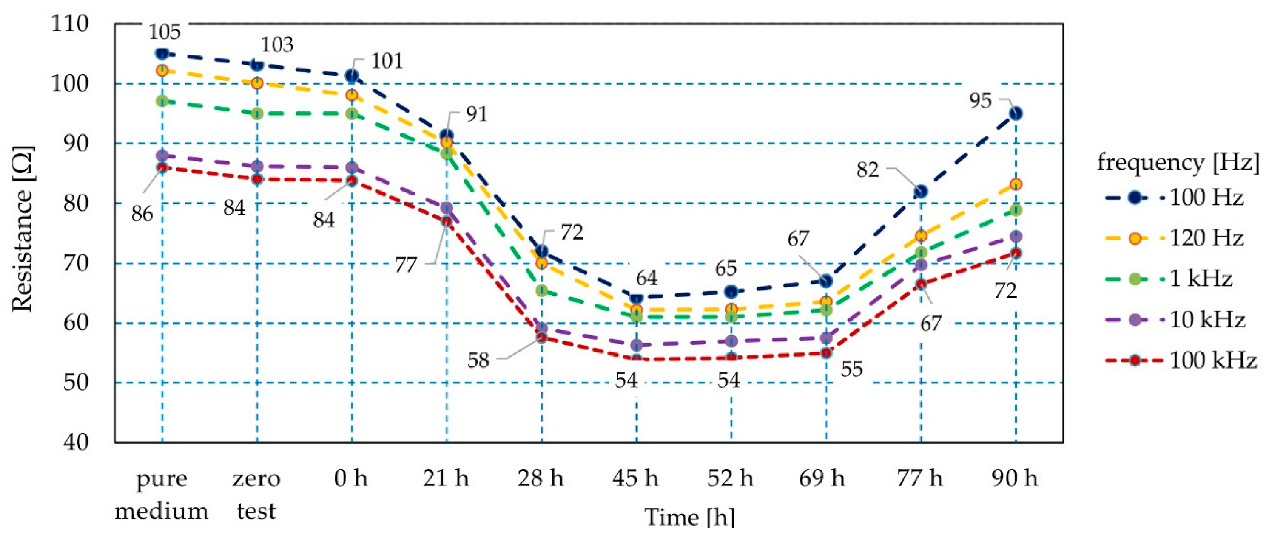
The quantitative identification of bacteria is a critical issue in terms of human safety. Therefore, it should correlate with textile sensor output. Figure 4 shows the sensor resistance (the real component of impedance) characteristics as a function of bacterial growth time (see Figure 9). An evident relationship between the number of bacteria and the sensor characteristics was found. The resistance value decreased (by 50%) with the increased optical density of the preparation, indicating that the number of bacteria was higher. Therefore, based on resistance measurement in the analyzed combination of experiments, it is possible to estimate the dynamics of bacterial growth and to identify the development phases. The presented results show the average values of measurement with 20 sensor samples.
During the research, the relationship between the resistance value and frequency was observed, i.e., the higher the frequency, the lower the resistance in the entire measuring range. The listed differences are relatively constant, but the smallest ones were in the third phase of bacterial growth, i.e., the stabilization phase. The relative difference between resistance values at extreme frequencies was about 16%.
A slightly different observation concerns the measurement of the textile sensor capacitance in the environment of Staphylococcus aureus, where a higher concentration of bacteria generated a higher value of the textile sensor capacitance (Figure 10). The sensor electrical capacitance was measured in equal intervals of time. In Figure 5, those points were connected with a broken line, which allows straightforward interpretation of the relationship between the sensor capacitance and the number of bacteria. As in the case of the sensor impedance value, it is possible to identify the dynamics of bacterial growth detailing the colony growth phases, which can be used directly in practice. Of note was the differentiation of the measured sensor capacity depending on the number of bacteria, where the minimum value was several dozen μF and the maximum number of bacteria was three times higher. This applied to all measured frequency ranges except for the frequency of 100 kHz.
It was observed that in the case of an effective method of quantitative identification of staphylococci based on the textile sensor capacitance, frequencies not exceeding 1 kHz should be used when the diversity concerning changes in the number of bacteria is clear and easily identifiable.
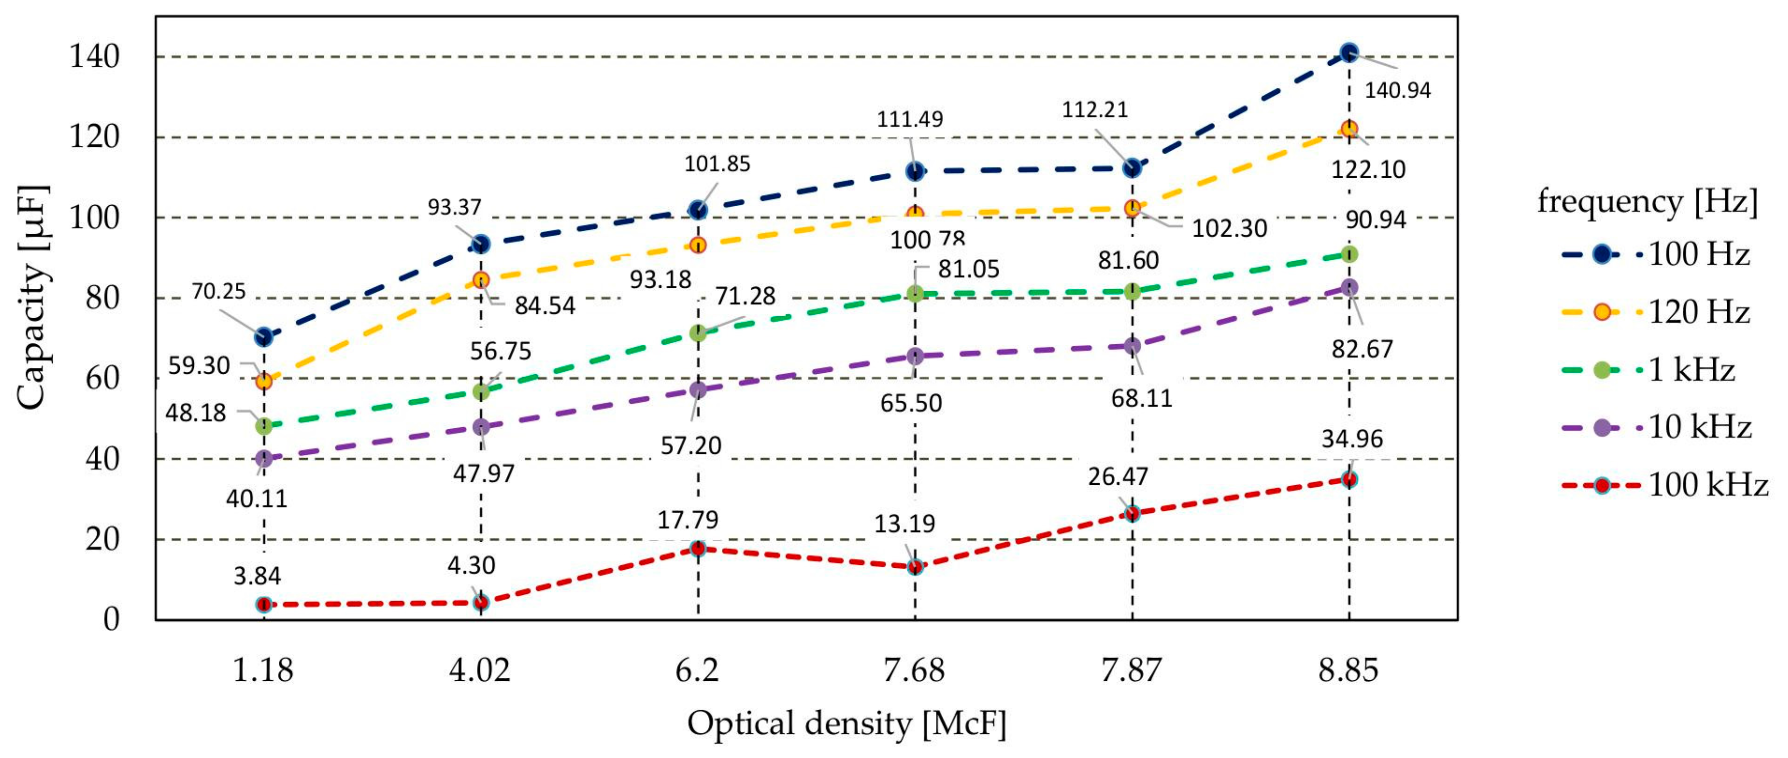
The sensor’s capacity and impedance were measured with regard to microorganism quantity in the initial phase of growth. The measurement results are presented in Figure 11. The increase in the number of bacterial cells in the suspension caused a reduction in the impedance value of the produced sensor. Impedance changes of 40% or more were observed throughout the measurement range. With the measuring signal at the frequency of 100 Hz/120 Hz, the impedance values were twice as high as with higher frequency values (Figure 11). Changes in values were also observed during the measurement of the capacity of sensor structures. In this case, with the growth of bacteria, the capacity with regard to parasitic IDE structures increased. For the lower frequencies of the measurement signal, a 100% increase in capacity was observed. For the higher frequencies used in the experiment, this increase was by as much as nine-fold (Figure 12).
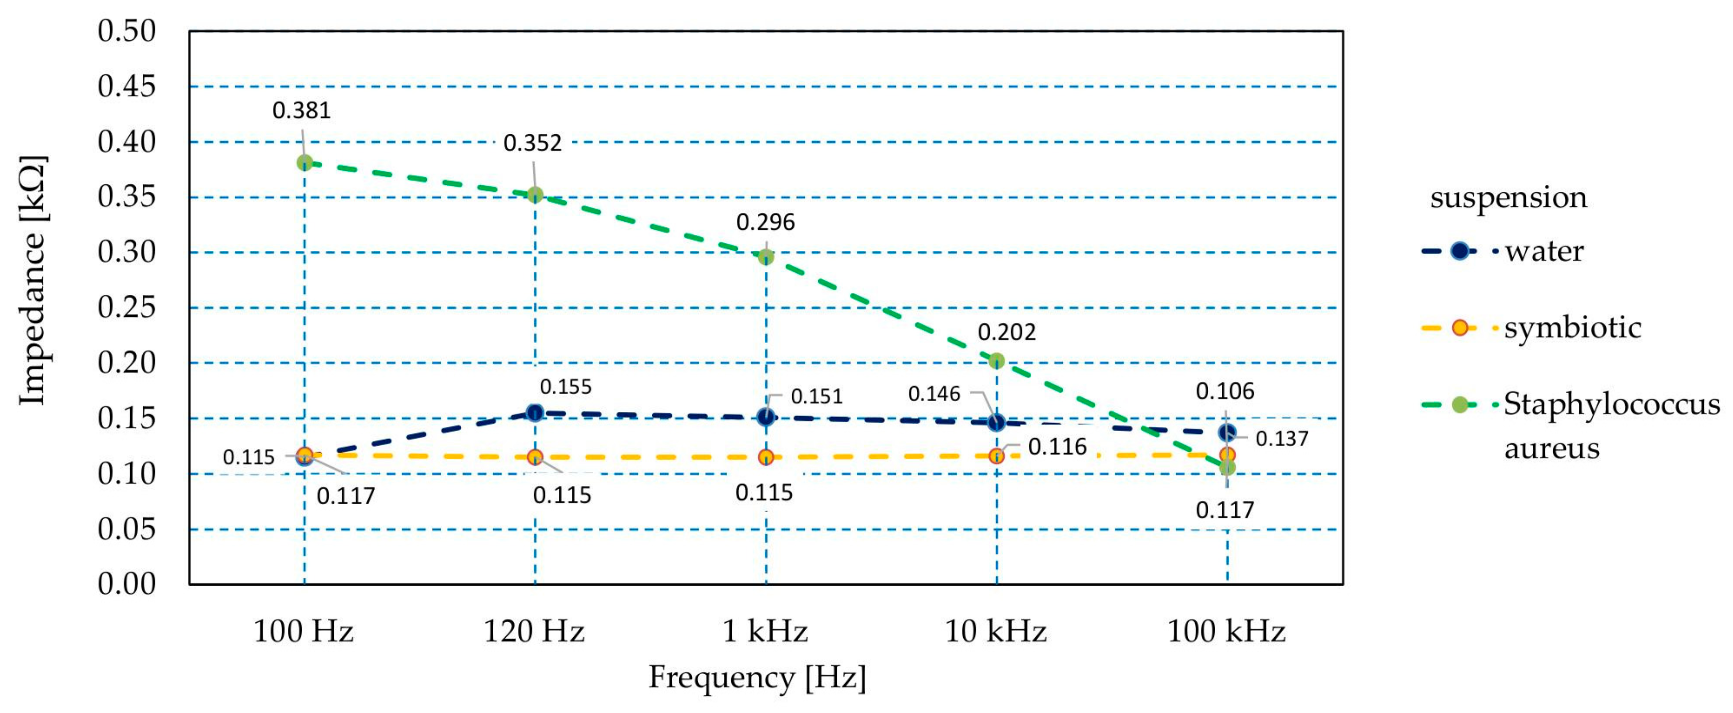
In order to determine the sensitivity of the proposed sensory element, the impedance was also measured in a distilled water solution and in an environment of bacteria harmless for human health such as Lactococcus lactis LI-23, Bifidobacterium longum BI-05, Lactobacillus helveticus SP27, Lactobacillus plantarum Lp-115, Lactobacillus casei Lc-11, Lactobacillus rhamnosus Lr-32, and Bifidobacterium bifidum Bb-02. These are present in Multilac Symbiotic (USP Zdrowie Ltd., Warsaw, Poland). The properties of the sensor were tested at an optical density of 4.94 McF.
Significant differences were observed between the impedance values for beneficial bacteria and water as well as for Staphylococcus aureus, reaching 300% at 100 Hz and over 200% at 120 Hz. The increase in the frequency of the measurement signal reduced the differences in the values of the measured impedance of the sensor immersed in the tested solutions (Figure 13). Thus, there was a difference in the impedance indications of the sensor immersed in demineralized water and a suspension of Multilac Symbiotic of 20% at frequencies higher than 100 Hz. There was a clear distinction between the sensor impedance readings when in contact with harmful and beneficial microorganisms.

4. Conclusions

Despite advances in medicine, Staphylococcus aureus is still a threat to humans. The use of silver as an antibacterial metal is common. In this article, the interaction between silver and Staphylococcus aureus was used to detect the presence and also measure the numbers of bacteria. The increase in the number of bacteria caused changes in the electrical parameters of the produced sensor. The most extensive changes in electrical parameters were observed at 100 Hz and 120 Hz. Changes in the resistance values and sensor capacitance were observed at as early as the first day of testing. This information can be useful for professionals in order to decide how to treat patients. The most extensive parameter changes occurred within the 28–69 h time window from initial bacterial infection. The desired changes in electrical parameters were observed in the initial phase of the multiplication of the Staphylococcus. This allows for quick detection at the point of contact of the measurement electrodes with the undesirable microorganism. Due to the nature of the substrate used to produce the sensor, it can be implemented in various types of textile products.

Author Contributions

Conceptualization, E.K., A.S., and P.K.; Data curation, E.K., T.D., P.K., and A.M.; Formal analysis, E.K., A.S., P.L., T.D., P.K., and A.M.; Investigation, E.K., A.S., P.L., T.D., P.K., and A.M.; Methodology, E.K., A.S., T.D., P.K., and A.M.; Supervision, E.K., P.L., P.K., and A.M.; Validation, E.K., A.S., T.D., and A.M.; Visualization, E.K., T.D., P.K., and A.M.; Writing—original draft, E.K., A.S., P.L., T.D., P.K., and A.M.; Writing—review and editing, E.K., A.S., P.L., P.K., and A.M.; All authors have read and agreed to the published version of the manuscript.

Funding

This research received no external funding.

Institutional Review Board Statement

Not applicable.

Informed Consent Statement

Not applicable.

Data Availability Statement

The data presented in this study are available on request from the corresponding author. The data are not publicly available due to privacy.

Conflicts of Interest

The authors declare no conflict of interest.

References

  1. Malinowska, M.; Tokarz-Deptuła, B.; Deptuła, W. The human microbiome. Postępy Mikrobiol. 2017, 56, 33–42. [Google Scholar]
  2. Zych, M.A.; Górska, E.B.; Jankiewicz, U.; Kowalczyk, P. Disinfectants and their effectiveness on skin microorganisms. Nowa Med. 2013, 1, 31–34. [Google Scholar]
  3. Akiyama, H.; Morizane, S.; Yamasaki, O.; Oono, T.; Iwatsuki, K. Assessment of Streptococcus pyogenes microcolony formation in infected skin by confocal laser scanning microscopy. J. Dermatol. Sci. 2003, 32, 193–199. [Google Scholar] [CrossRef]
  4. El Baze, P.; Thyss, A.; Caldani, C.; Juhlin, L.; Schneider, M.; Ortonne, J.P. Pseudomonas aeruginosa O-11 folliculitis. Development into ecthyma gangrenosum in immunosuppressed patients. Arch. Dermatol. 1985, 121, 873–876. [Google Scholar] [CrossRef] [PubMed]
  5. Gao, Z.; Tseng, C.; Pei, Z.; Blaser, M.J. Molecular analysis of human forearm superficial skin bacterial biota. Proc. Natl. Acad. Sci. USA 2007, 104, 2927–2932. [Google Scholar] [CrossRef] [Green Version]
  6. Noble, W.C. Skin bacteriology and the role of Staphylococcus aureus in infection. Br. J. Dermatol. 1998, 139, 9–12. [Google Scholar] [CrossRef]
  7. Grice, E.A.; Segre, J.A. Topographical and temporal diversity of the human skin microbiome. Science 2009, 324, 1190–1192. [Google Scholar] [CrossRef] [Green Version]
  8. Grice, E.A.; Segre, J.A. The skin microbiome. Nat. Rev. Microbiol. 2011, 9, 244–253. [Google Scholar] [CrossRef]
  9. Leyden, J.J.; McGinley, K.J.; Nordstrom, K.M.; Webster, G.F. Skin microbiota. J. Investig. Dermatol. 1987, 88, 65–72. [Google Scholar] [CrossRef]
  10. Zych, M.A.; Górska, E.B.; Jankiewicz, U.; Kowalczyk, P.; Stępień, W. Diseases caused by microorganisms on the skin. Med. Rodz. 2013, 4, 158–163. [Google Scholar]
  11. Lowy, F.D. Staphylococcus aureus infections. N. Engl. J. Med. 1998, 339, 520–532. [Google Scholar] [CrossRef] [PubMed]
  12. Noble, W.C.; Valkenburg, H.A.; Wolters, C.H.L. Carriage of Staphylococcus aureus in random samples of a normal population. J. Hyg. Camb. 1967, 65, 567–573. [Google Scholar] [CrossRef] [Green Version]
  13. Kluytmans, J.; van Belkum, A.; Verbrugh, H. Nasal carriage of Staphylococcus aureus: Epidemiology, Underlying mechanisms, and associated risk. Clin. Microbiol. Rev. 1997, 10, 505–520. [Google Scholar] [CrossRef] [PubMed]
  14. Wu, S.; Duan, N.; Gu, H.; Hao, L.; Ye, H.; Gong, W.; Wang, Z. A Review of the Methods for Detection of Staphylococcus aureus Enterotoxins. Toxins 2016, 8, 176. [Google Scholar] [CrossRef] [PubMed] [Green Version]
  15. Dobroczyńska, J.I. Detection Systems for Microbiological Identification. Available online: http://www.eko-dok.pl/2013/12.pdf (accessed on 16 October 2020).
  16. Global Wearable Sensors Market Size, Industry Report, 2018–2025. Available online: https://www.grandviewresearch.com/industry-analysis/global-wearable-sensor-market (accessed on 12 September 2020).
  17. Rambausek, L.; Els Bruneel, E.; De Mey, G.; Van Langenhove, L. Polyimide Dielectric Layer on Filaments For Organic Field Effect Transistors: Choice Of Solvent, Solution Composition And Dip-Coating Speed. AUTEX Res. J. 2014, 14, 121–134. [Google Scholar] [CrossRef] [Green Version]
  18. Andrew, T.L.; Zhang, L.; Cheng, N.; Baima, M.; Joon Kim, J.; Allison, L.; Hoxie, S. Melding Vapor-Phase Organic Chemistry and Textile Manufacturing To Produce Wearable Electronics. Acc. Chem. Res. 2018, 51, 850–859. [Google Scholar] [CrossRef] [PubMed]
  19. Ziaja, J. ZnO thin film deposition with pulsed magnetron sputtering. Prz. Elektrotechniczny 2007, 83, 235–239. [Google Scholar]
  20. Tokarska, M.; Frydrysiak, M.; Zieba, J. Electrical properties of flat textile material as inhomegeneous and anisotropic structure. J. Mater. Sci. Mater. Electron. 2013, 24, 5061–5068. [Google Scholar] [CrossRef] [Green Version]
  21. Lada-Tondyra, E.; Jakubas, A. Modern Applications of Textronic Systems. Prz. Elektrotechniczny 2018, 94, 198–201. [Google Scholar]
  22. Stempien, Z.; Rybicki, E.; Rybicki, T.; Kozanecki, M. Reactive inkjet printing of PEDOT electroconductive layers on textile surfaces. Synth. Met. 2016, 217, 276–287. [Google Scholar] [CrossRef]
  23. Pawlak, R.; Lebioda, M.; Tomczyk, M.; Rymaszewski, J.; Korzeniewska, E.; Walczak, M. Modelling and applications of conductive elements on textile materials. COMPEL Int. J. Comput. Math. Electr. Electron. Eng. 2018, 37, 1645–1656. [Google Scholar] [CrossRef]
  24. Nazmul Islam, G.M.; Ali, A.; Collie, S. Textile sensors for wearable applications: A comprehensive review. Cellulose 2020, 27, 6103–6131. [Google Scholar] [CrossRef]
  25. Brennan, D.; Galvin, P. Flexible substrate sensors for multiplex biomarker monitoring. MRS Commun. 2018, 8, 627–641. [Google Scholar] [CrossRef] [Green Version]
  26. Brown, M.S.; Ashley, B.; Koh, A. Wearable Technology for Chronic Wound Monitoring: Current Dressings, Advancements, and Future Prospects. Front. Bioeng. Biotechnol. 2018, 6, 47. [Google Scholar] [CrossRef] [PubMed]
  27. Korzeniewska, E.; Szczesny, A. Parasitic parameters of thin film structures created on flexible substrates in PVD process. Microelectron. Eng. 2018, 193, 62–64. [Google Scholar] [CrossRef]
  28. Madianos, L.; Skotadis, E.; Tsekenis, G.; Patsiouras, L.; Tsigkourakos, M.; Tsoukalas, D. Impedimetric nanoparticle aptasensor for selective and label free pesticide detection. Microelectron. Eng. 2018, 189, 39–45. [Google Scholar] [CrossRef]
  29. Oberländer, J.; Jildeh, Z.B.; Kirchner, P.; Wendeler, L.; Bromm, A.; Iken, H.; Wagner, P.; Keusgen, M.; Schöning, M.J. Study of Interdigitated Electrode Arrays Using Experiments and Finite Element Models for the Evaluation of Sterilization Processes. Sensors 2015, 15, 26115–26127. [Google Scholar] [CrossRef] [Green Version]
  30. Partel, S.; Kasemann, S.; Matylitskaya, V.; Thanner, C.; Dincer, C.; Urban, G. A simple fabrication process for disposable interdigitated electrode arrays with nanogaps for lab-on-a-chip applications. Microelectron. Eng. 2017, 173, 27–32. [Google Scholar] [CrossRef]
  31. Frydrysiak, M.; Korzeniewska, E.; Tęsiorowski, Ł. The textile resistive humidity sensor manufacturing via (PVD) sputtering method. Sens. Lett. 2015, 13, 998–1001. [Google Scholar] [CrossRef]
  32. Stempien, Z.; Kozicki, M.; Pawlak, R.; Korzeniewska, E.; Owczarek, G.; Poscik, A.; Sajna, D. Ammonia gas sensors ink-jet printed on textile substrates. In Proceedings of the IEEE SENSORS, Orlando, FL, USA, 30 October–3 November 2016; pp. 1–3. [Google Scholar] [CrossRef]
  33. Chiang, C.J.; Tsai, K.T.; Lee, Y.H.; Lin, H.W.; Yang, Y.L.; Shih, C.C.; Lin, C.Y.; Jeng, H.A.; Weng, Y.H.; Cheng, Y.Y.; et al. In situ fabrication of conducting polymer composite film as a chemical resistive CO2 gas sensor. Microelectron. Eng. 2013, 111, 409–415. [Google Scholar] [CrossRef]
  34. Tian, W.; Ho, Y.; Chen, C.; Kuo, C. Sensing performance of precisely ordered TiO2 nanowire gas sensors fabricated by electron-beam lithography. Sensors 2013, 13, 865–874. [Google Scholar] [CrossRef] [PubMed] [Green Version]
  35. Mazlan, N.S.; Ramli, M.M.; Abdullah, M.M.A.B.; Halin, D.S.C.; Isa, S.S.M.; Talip, L.F.A.; Danial, N.S.; Murad, S.A.Z. Interdigitated electrodes as impedance and capacitance biosensors: A review. AIP Conf. Proc. 2017, 1885, 020276. [Google Scholar] [CrossRef]
  36. Iswary, L.; Nazri, N.F.N.; Arshad, M.K.; Fathil, M.F.M.; Nuzaihan, M.; Subash, M.N.; Gopinath, C.B. Fabrication and characterization of aluminium interdigitated electrode hybrid with ZnO for cardiac troponin T biomarker detection. AIP Conf. Proc. 2018, 2045, 020038. [Google Scholar] [CrossRef]
  37. Yu, Y.; Xiao, X.; Zhang, Y.; Li, K.; Yan, C.; Wei, X.; Chen, L.; Zhen, H.; Zhou, H.; Zhang, S.; et al. Photoreactive and Metal-Platable Copolymer Inks for High-Throughput, Room-Temperature Printing of Flexible Metal Electrodes for Thin-Film Electronics. Adv. Mater. 2016. [Google Scholar] [CrossRef]
  38. Daud, A.I.; Khairul, W.M.; Isa, M.I.N.; Wahid, K.A.A. Study on Semiconductor Properties of Acetylide-Thiourea Fabricated onto Interdigitated Electrodes (IDEs) Platform towards Application in Gas Sensing Technology. Makara J. Technol. 2017, 21, 103–108. [Google Scholar] [CrossRef] [Green Version]
  39. Rymarczyk, T.; Nita, P.; Vejar, A.; Wos, M.; Stefaniak, B.; Adamkiewicz, P. Wareable mobile measuring device based on electrical tomography. Prz. Elektrotechniczny 2019, 95, 211–214. [Google Scholar] [CrossRef]
  40. Rymarczyk, T.; Klosowski, G.; Tchorzewski, P.; Cieplak, T.; Kozlowski, E. Area monitoring using the ERT method with multisensor electrodes. Prz. Elektrotechniczny 2019, 95, 153–156. [Google Scholar] [CrossRef] [Green Version]
  41. Mathew, M.; Radhakrishnan, S.; Vaidyanathan, A.; Chakraborty, B.; Rout, C.S. Flexible and wearable electrochemical biosensors based on two-dimensional materials: Recent developments. Anal. Bioanal. Chem. 2020. [Google Scholar] [CrossRef]
  42. Pawlak, R.; Lebioda, M. Electrical and thermal properties of heater-sensor microsystems patterned in TCO films for wide-range temperature applications from 15 K to 350 K. Sensors 2018, 18, 1831. [Google Scholar] [CrossRef] [Green Version]
  43. Lebioda, M.; Rymaszewski, J. Dynamic properties of cryogenic temperature sensors. Prz. Elektrotechniczny 2015, 91, 225–227. [Google Scholar] [CrossRef] [Green Version]
  44. Scholza, J.; Nockea, G.; Hollstein, F.; Weissbach, A. Investigations on fabrics coated with precious metals using the magnetron sputter technique with regard to their anti-microbial properties. Surf. Coat. Technol. 2005, 192, 252–256. [Google Scholar] [CrossRef]
  45. Jun, L.Q.; bin Djaswadi, G.W.; bin Hawari, H.F.; Zakariya, M.A.B. Simulation of Interdigitated Electrodes (IDEs) Geometry Using COMSOL Multiphysics. In Proceedings of the International Conference on Intelligent and Advanced System, Kuala Lumpur, Malaysia, 13–14 August 2018. [Google Scholar] [CrossRef]
  46. Pawlak, R.; Tomczyk, M.; Walczak, M. The favorable and unfavorable effects of oxide and intermetallic phases in conductive materials using laser micro technologies. Mater. Sci. Eng. B Adv. Funct. Solid-State Mater. 2012, 177, 1273–1280. [Google Scholar] [CrossRef]
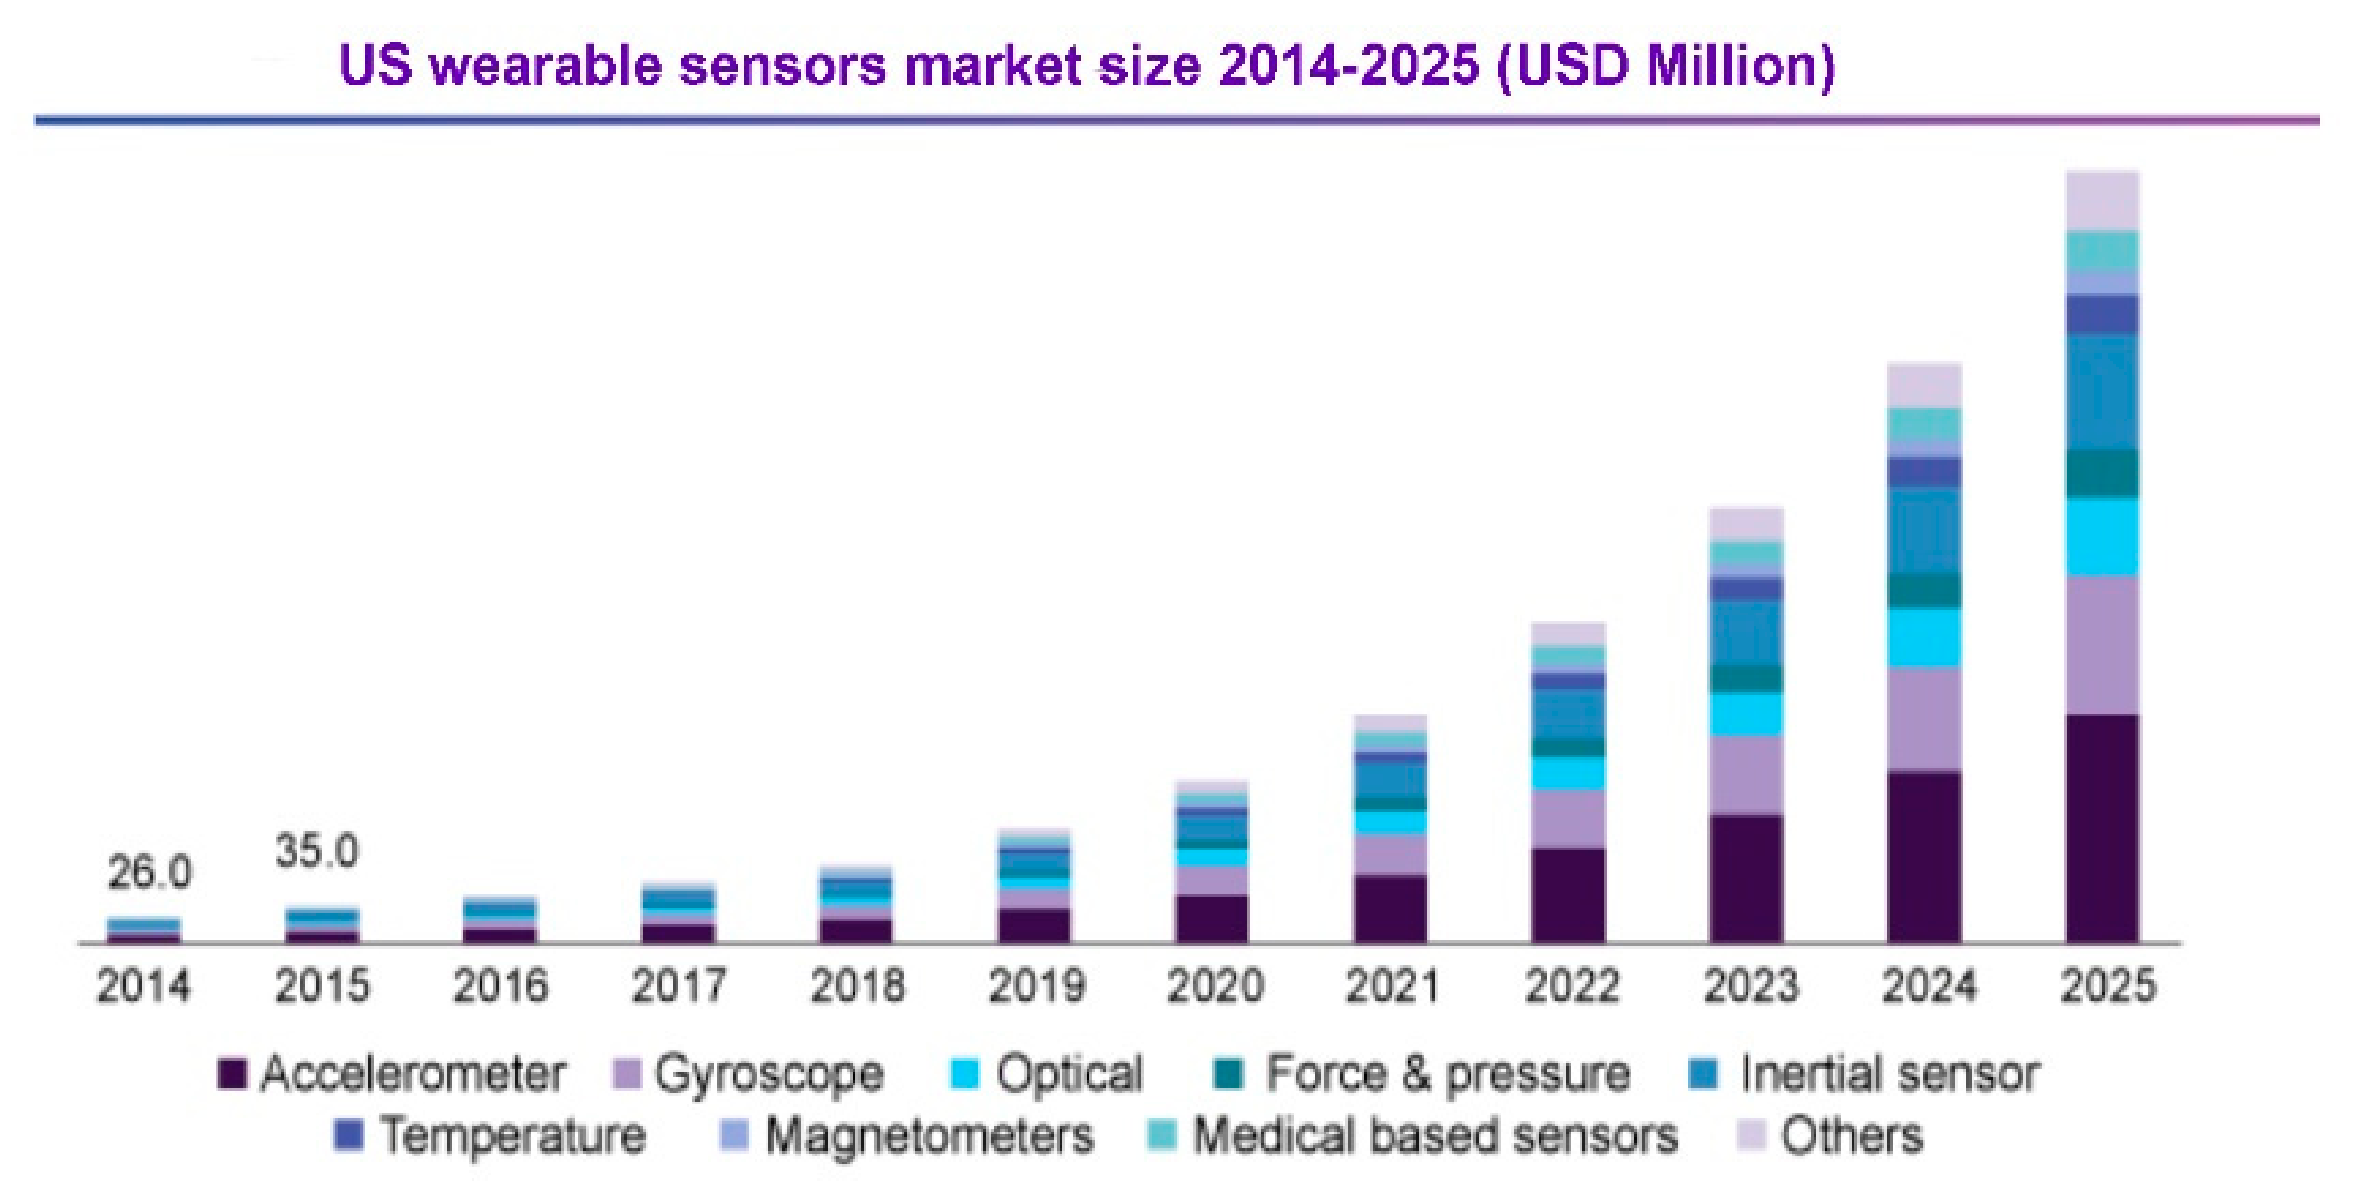
Figure 1. The expected increase in the value of the sensor market [16].
Sensors 21 00183 g001
Figure 2. (a) Geometry of the produced interdigitated electrodes (IDEs); (b) photo of the produced structure.
Sensors 21 00183 g002
Figure 3. McFarland scale.
Sensors 21 00183 g003
Figure 4. The curve of bacterial growth of Staphylococcus aureus ATCC 25923.
Sensors 21 00183 g004
Figure 5. The microscopic image of suspension with Staphylococcus aureus—optical density 6.25 McF.
Sensors 21 00183 g005
Figure 6. The diameter of microorganisms in relation to the optical density of the suspension.
Sensors 21 00183 g006
Figure 7. Circumference of the microorganism in relation to the optical density of the suspension.
Sensors 21 00183 g007
Figure 8. The surface area of the microorganism in relation to the optical density of the suspension.
Sensors 21 00183 g008
Figure 9. The resistance characteristics of the textile sensor during bacterial colony development.
Sensors 21 00183 g009
Figure 10. Characteristics of the textile sensor capacitance during bacterial colony development.
Sensors 21 00183 g010
Figure 11. The dependence of impedance of the sensor with regard to the number of bacteria in the suspension.
Sensors 21 00183 g011
Figure 12. The dependence of the sensor capacity with regard to the number of bacteria in the suspension.
Sensors 21 00183 g012
Figure 13. The dependence of the sensor impedance with regard to frequency in various types of suspensions.
Sensors 21 00183 g013
Table 1. Standard strains recommended in microbiological methods.
MethodologyRecommended Reference Strains of Aerobic Bacteria
Infertility
To test the fertility of substrates used and the suitability of the method
Staphylococcus aureus
Bacillus subtilis
Pseudomonas aeruginosa
To study the microbiological cleanness of non-vital products (quantitative microbiological qualities)Staphylococcus aureus
Bacillus subtilis
Pseudomonas aeruginosa
To determine the effectiveness of protection against microbes (maintenance test)Staphylococcus aureus
Pseudomonas aeruginosa
To test the effectiveness of disinfectantsStaphylococcus aureus
Pseudomonas aeruginosa
Enterococcus hirae
Escherichia coli
Table 2. The composition of TSA medium.
IngredientValue (g/L)
Pancreatin casein hydrolysate15
Soy peptone5
Sodium chloride5
Agar15
Table 3. The composition of Nutrient Broth Medium.
IngredientValue (g/L)
Peptone5
Beef extract3
Publisher’s Note: MDPI stays neutral with regard to jurisdictional claims in published maps and institutional affiliations.