Article

High Repetition Rate Mid-Infrared Differential Absorption Lidar for Atmospheric Pollution Detection

1
Collaborative Innovation Center on Forecast and Evaluation of Meteorological Disasters, Key Laboratory for Aerosol-Cloud-Precipitation of China Meteorological Administration, Key Laboratory of Meteorological Disasters, Ministry of Education, Nanjing University of Information Science and Technology, Nanjing 210044, China
2
Nanjing Institute of Advanced Laser Technology, Nanjing 210038, China
*
Author to whom correspondence should be addressed.
Sensors 2020, 20(8), 2211; https://doi.org/10.3390/s20082211
Submission received: 24 March 2020 / Revised: 10 April 2020 / Accepted: 12 April 2020 / Published: 14 April 2020

Abstract

:
Developments in mid-infrared Differential Absorption Lidar (DIAL), for gas remote sensing, have received a significant amount of research in recent years. In this paper, a high repetition rate tunable mid-infrared DIAL, mounted on a mobile platform, has been built for long range remote detection of gas plumes. The lidar uses a solid-state tunable optical parametric oscillator laser, which can emit laser pulse with repetition rate of 500 Hz and between the band from 2.5 μm to 4 μm. A monitoring channel has been used to record the laser energy in real-time and correct signals. Convolution correction technology has also been incorporated to choose the laser wavelengths. Taking NO2 and SO2 as examples, lidar system calibration experiment and open field observation experiment have been carried out. The observation results show that the minimum detection sensitivity of NO2 and SO2 can reach 0.07 mg/m3, and 0.31 mg/m3, respectively. The effective temporal resolution can reach second level for the high repetition rate of the laser, which demonstrates that the system can be used for the real-time remote sensing of atmospheric pollution gas.

1. Introduction

Presently, monitoring pollutants in the environment is crucial for preventing chemical poisoning and disease onsets. Polluting, toxic, flammable and explosive gases have been widely concerned for the public health and security. The release of a large amount of chemical substances in the environment has a harmful impact on human health and safety. Several industrial plants use dangerous chemicals for compounds synthesis. An accidental release of these chemicals in the environment can easily lead to serious accidents [1]. Furthermore, several harmful gases are important components of “Chemical warfare”, which can seriously endanger public safety [2,3]. Regular monitoring and quantification of polluting, toxic, flammable and explosive gases is inevitable to ensure the public health and security.
As an important means of monitoring atmospheric gases, DIAL has many advantages over other conventional detection instruments, such as good continuity, large detection range, high measurement sensitivity etc. It is widely used in multiple fields including atmospheric, agricultural and industrial gas detection. At present, great progress has been made in the visible and ultraviolet spectral regions DIALs, which can determine and quantify the concentration of various gases in the atmosphere [4,5,6,7,8]. Ultraviolet DIAL uses Dye laser or Raman laser. The laser structure is complex and the wavelength tuning range is narrow, thereby, limiting detection capability. Compared to the UV DIAL, the research on the infrared spectral region, especially the mid-infrared spectral region, is relatively scarce. However, the spectrum of mid-infrared (2.5–25 μm) is mainly produced by the vibration of molecular fundamental frequency. Many atmospheric components and dangerous gases such as CH4, SO2, NO2, NO, H2S etc. have strong absorption capacity in the mid-infrared spectral region, their absorption spectrum is often hundreds to thousands of times stronger than those in the near infrared region [9]. Therefore, mid-infrared lasers have good application prospects in the field of gas component detection [10,11]. In recent years, a series of achievements have been made in the research of gas detection in the mid-infrared band. S. Veerabuthiran et al. [12] developed a 3.0–3.45 μm DIAL system with a laser energy of 5 mJ, line width less than 7 cm−1 and frequency of 10 Hz. The designed system could be used to measure the concentration of thiodiglycol (TDG) vapor plumes in open state. The maximum detection distance was 1 km, and the sensitivity was about 10 ppm·m. D. Mammez et al. [13] presented a 1.98–2.30 μm DIAL system. The laser has energy of 5–10 mJ, line width of 60 MHz, and repetition rate of 30 Hz. The system could realize the concentration distribution measurement of H2O, CO2 and CH4. The detection sensitivity of CH4 was about 2 ppm. S. Lambert-Girard et al. [14] developed a 1.5–3.8 μm DIAL system, with laser energy of 15–17.5 μJ, laser line width of 10–200 nm, which could be used to detect H2O, CO2 and CH4 simultaneously, with a minimum detection accuracy of 1 ppm·m. O.A. Romanovskii et al. [15] developed a 1.8–2.5 μm and 3–4 μm DIAL system, with laser energy of 9–25 mJ, laser line width of 2 cm−1, and repetition rate of 30 Hz, which could be used to detect H2O, CO2. The error in recovering the concentration from the lidar measurement data did not exceed 0.4 g/m3 for H2O and 0.13 ppm for CO2.
The OPO DIAL lidar systems described above work either in the near or in the middle IR region of the spectrum. All the discussed systems obtained high laser energy but the repetition rate was relatively low.
The aim of this work is to develop a high repetition rate 2.5–4 μm DIAL system and evaluate its performance for detection of atmospheric pollution plumes at long distances. The system can be used for monitoring the emission of industrial polluted gases and the environment around chemical plants. We used techniques, such as convolution correction, monitoring channel to reduce system error. Taking NO2 and SO2 as the experimental objects, gas cell calibration experiment and the open field observation experiment were carried out to verify the performance of the equipment.

2. DIAL Theory

Different gas molecules have their own characteristic absorption spectrum. The principle of DIAL detection is according to the difference in the absorption capacity of the laser at different wavelengths. DIAL emits two laser beams of different wavelengths. One beam is at the strong absorption position of the target gas named as λon, and the other beam is at the weak absorption or non-absorption position named as λoff. The concentration of the target gas can be measured by detecting the difference between the returned signals of the two lasers [16]. Assuming the transmitted power is Pt, the overall system efficiency is η, the telescope receiving area is A, the distance of the hard target is R, the reflectivity of the hard target is ρ, the absorption cross-sections of λon and λoff are σon and σoff, the atmospheric attenuation coefficient is α and the number concentration of the molecule is N(R), then the energy P received by the detector can be expressed as [17,18,19]:
P = P t η A R 2 ρ · e x p { 2 0 R α + N ( R ) · σ on , off d R } .
According to the inversion method of DIAL, after some algebraic manipulations, add the Avogadro constant NA and the gas molecular mass M. Then N(R) is converted into the standard unit (mg/m3). The average gas concentration on the path R can be expressed as:
N ( R ) = 1 2 R Δ σ [   l n ( P on P off ) ] · M N A .
where ∆σ is the differential absorption cross-section (∆σ = σ(λon) − σ(λoff)) [20]. Pon is the echo signal of λon and Poff is the echo signal of λoff. The premise of using Formula (2) for the concentration inversion is that the parameters of λon and λoff are consistent except for wavelength. However, it is difficult to guarantee in practice. Considering the inversion problem caused by the deviation of initial energy, divergence angle and coaxial of λoff and λon etc., we use a mid-infrared detector in the lidar system to record the initial laser energy of λon and λoff as Pon1 and Poff1 to correct the system deviation. Finally obtains the DIAL inversion equation [21]:
N = 1 2 Δ σ R [ ln ( P on · P off 1 P off · P on 1 ) ] M N A .
The sensitivity of the DIAL method is characterized by the minimum measurable concentration of the gas molecule that can be detected with the minimum errors in optical signal. The expression for the minimum detectable content is given below [12]:
N m i n = 1 2 Δ σ R [ ln ( 1 + ( 1 S N R ) ) ] .
where Nmin is the detection sensitivity of target gas and SNR is the detection signal-to-noise ratio of the system.

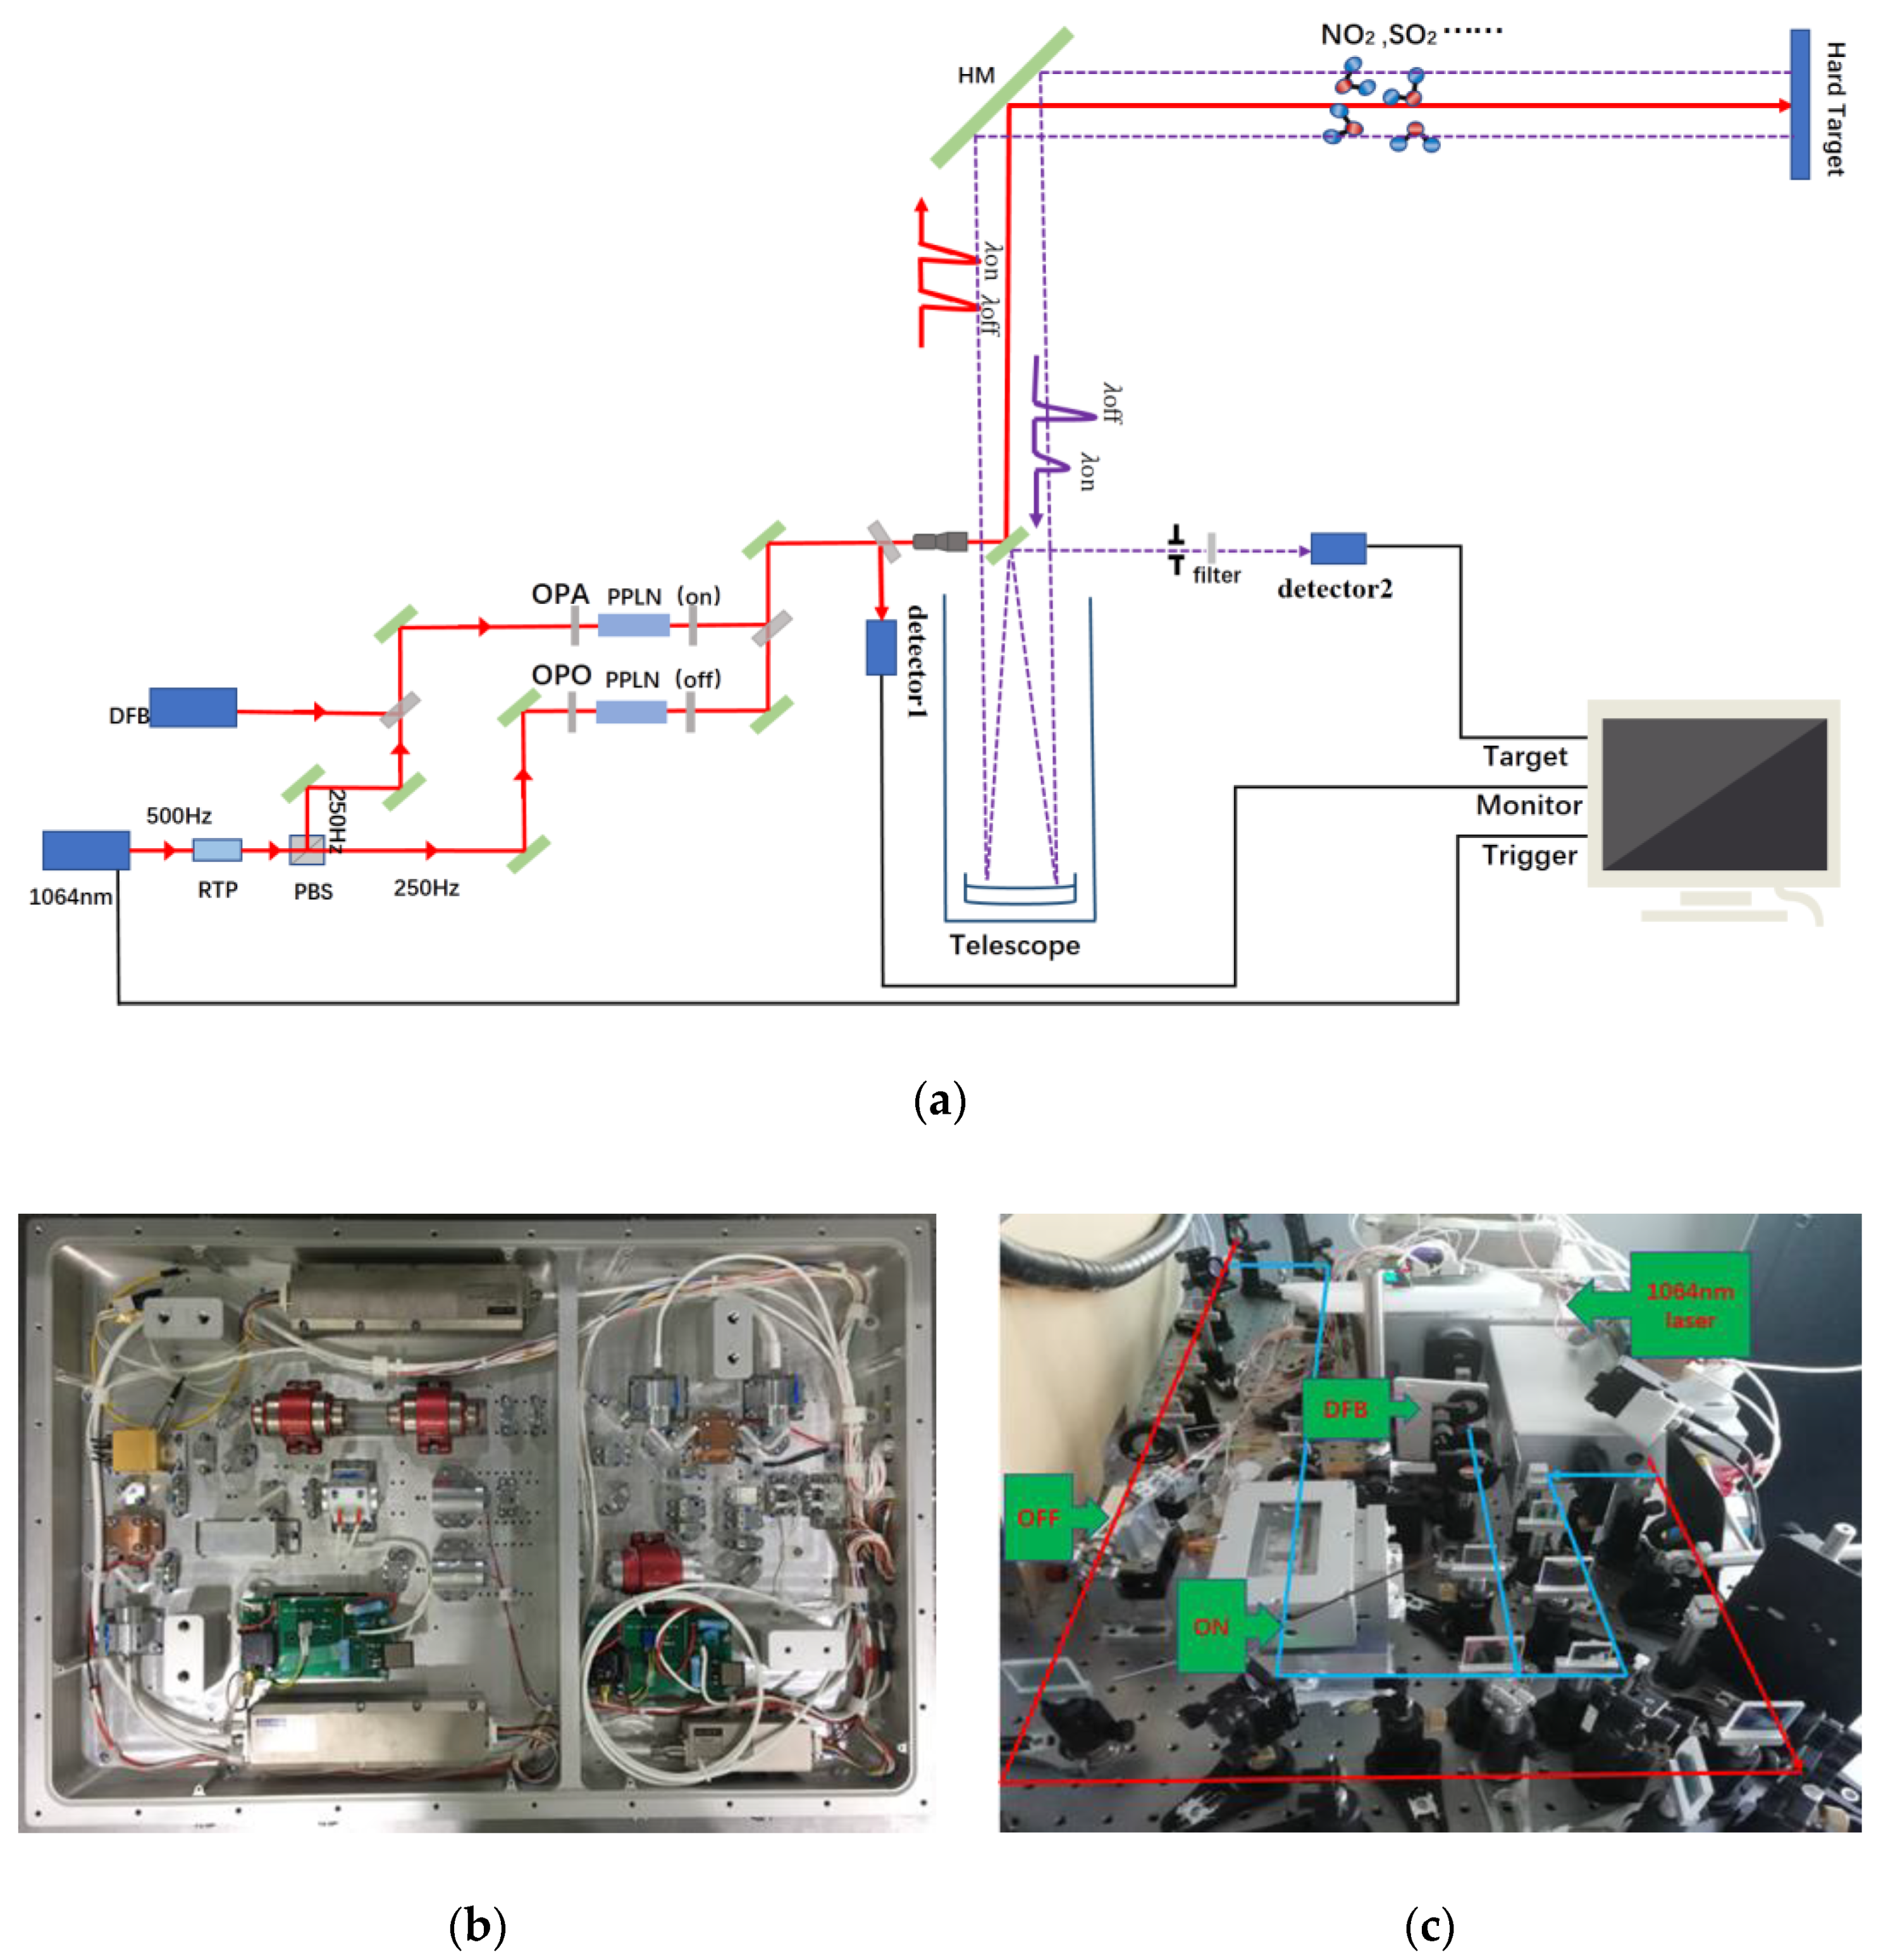
3. DIAL System Description

In the transmitter of the system, we use a 1064 nm Nd: YAG laser with a repetition rate of 500 Hz as the pump light source. The 1064 nm laser is divided into two 250 Hz lasers through RTP (Rubidium Titanyl Phosphor) crystal and PBS (Polarizing Beam Splitter) mirror. Then through their respective PPLN (Periodically Poled Lithium Niobate) channels, the 1064 nm laser is converted into mid-infrared λon laser with a DFB (Distributed Feedback Laser) injected and λoff laser. By changing the PPLN crystals and adjusting temperature, the wavelength can be tuned to measure different gases. The time interval of λon and λoff is 0.002 s, which can effectively reduce the error caused by environmental change, during laser alternating, and improve the anti-interference ability. The two lasers pass through the beam combining mirror, 45° reflector, beam expander, scanning mirror, then enter into the atmosphere. The scanning head can horizontally rotate from 0 to 345°, vertically rotate from 0 to 90°, and can scan space at a maximum speed of 6°/s. In the receiving part, the system uses a 300 mm Newton reflecting telescope to acquire the echo signal, then the signal is detected by a VIGO mid-infrared detector. The detector is very compact and reliable, which is easy to be integrated into the mounting assembly. An optical mounting assembly with XYZ translation movement has been designed to hold the detector and front-end focusing optics. The acquisition card (spectrum m2i-4960) has 16bit resolution and 60 MHz sampling speed. The sampling channel, trigger mode, frequency and storage mode can be set to realize the control of signal acquisition. Finally, the returned signal is stored in the hard disk of industrial computer. The whole system is installed in an experimental cabin. The laser is divided into two beams by a beam splitter with a splitting ratio of nine to one. The high-energy beam is used for normal detection. The low-energy beam weakens by the filter with transmittance of 0.01 then received by the detector. We estimate the initial laser energy based on the detector signal, beam splitting ratio and transmittance. As shown in Figure 1, a complete set of mid-infrared DIAL is provided and Table 1 shows various parameters of lidar.
The wavelength of the laser should be determined prior to gas detection. Due to the injection of a DFB laser into optical parametric amplification (OPA) to obtain mid-infrared laser, and using NO2 as an example, the outputting λon laser spectral width is less than 0.02 nm. Comparing DFB is used as a seeder, λoff uses the more economical OPO mode to output wide spectrum laser with the laser spectral width is about 10 nm. In order to evaluate the absorption of λoff, we use a spectrometer (YOKOGAWA, AQ6370C) to measure the laser spectral width, and then convolute the laser spectrum with the ideal gas absorption spectrum to obtain the corresponding absorption cross-section under the laser spectral width. In the process of correction, the spectral lines of laser are normalized and fitted. After convolution correction, the absorption cross-section changes obviously, but it doesn’t affect the usage. Figure 2a is the absorption spectral lines of NO2 near 3.4 μm from HITRAN database; (b) is the normalization laser spectrum of λoff; (c) is the absorption spectral lines after convolution correction. In the Figure 2c, the blue solid line is the convoluted correcting data, the red dotted solid line is the measured data of wide spectrum. The convoluted absorption cross-section no longer has a fine peak and valley structure, it presents a large absorption peak as a whole. The position of NO2 without absorption also changes. In order to verify the effect of the convolution correction more intuitively, we used laser spectrum at the absorption peak (3430 nm) for convolution correction, so the correction effect around 3430 nm was the best. When the wavelength was far from 3430 nm, due to slight differences in laser linewidth, there were some differences between the measured value and the calculated value. Therefore, when we selected the λoff wavelength, the laser spectrum at the valley of the gas absorption spectrum was used to make precise correction. According to the result, the absorption cross-section at 3405 nm is 8.9 × 10⁻²¹ cm2/molecule, which is much less than the absorption cross-section at λon (3424.5 nm). According to the principle of wavelength optimization, the wavelength of λoff is chosen at 3405 nm. The wavelength of λon laser is chosen at 3424.5 nm as shown in the Figure 2a, which is the absorption peak of NO2 according to the data in the HITRAN [22]. The selection of laser wavelengths λon and λoff for other gases measurement is similar.

4. DIAL Detection Experiments and Results

The lidar system calibration experiment and open field observation experiment have been carried out in order to characterize the performance of lidar system. It is necessary to discuss the influence of gases in the environment before the experiment. The ambient concentration of SO2 and NO2 is about tens of micrograms per cubic meter, which is much smaller than emissions of pollutants from various factories. According to Lambert-Beer law:
I ( v ) = I 0 e x p [ σ ( v ) C L ] .  
where I 0 is the initial laser energy, I ( v ) is the laser energy after absorption, L is the length of transmission path, C is the concentration of gas. We calculate that the attenuation due to the absorption of background gas is approximately 0.008. The ambient concentration of SO2 and NO2 has little effect on the experimental results. Before each experiment, we will also receive a set of background data to normalized correct the laser signal to counteract the effects of various gases in the atmosphere.

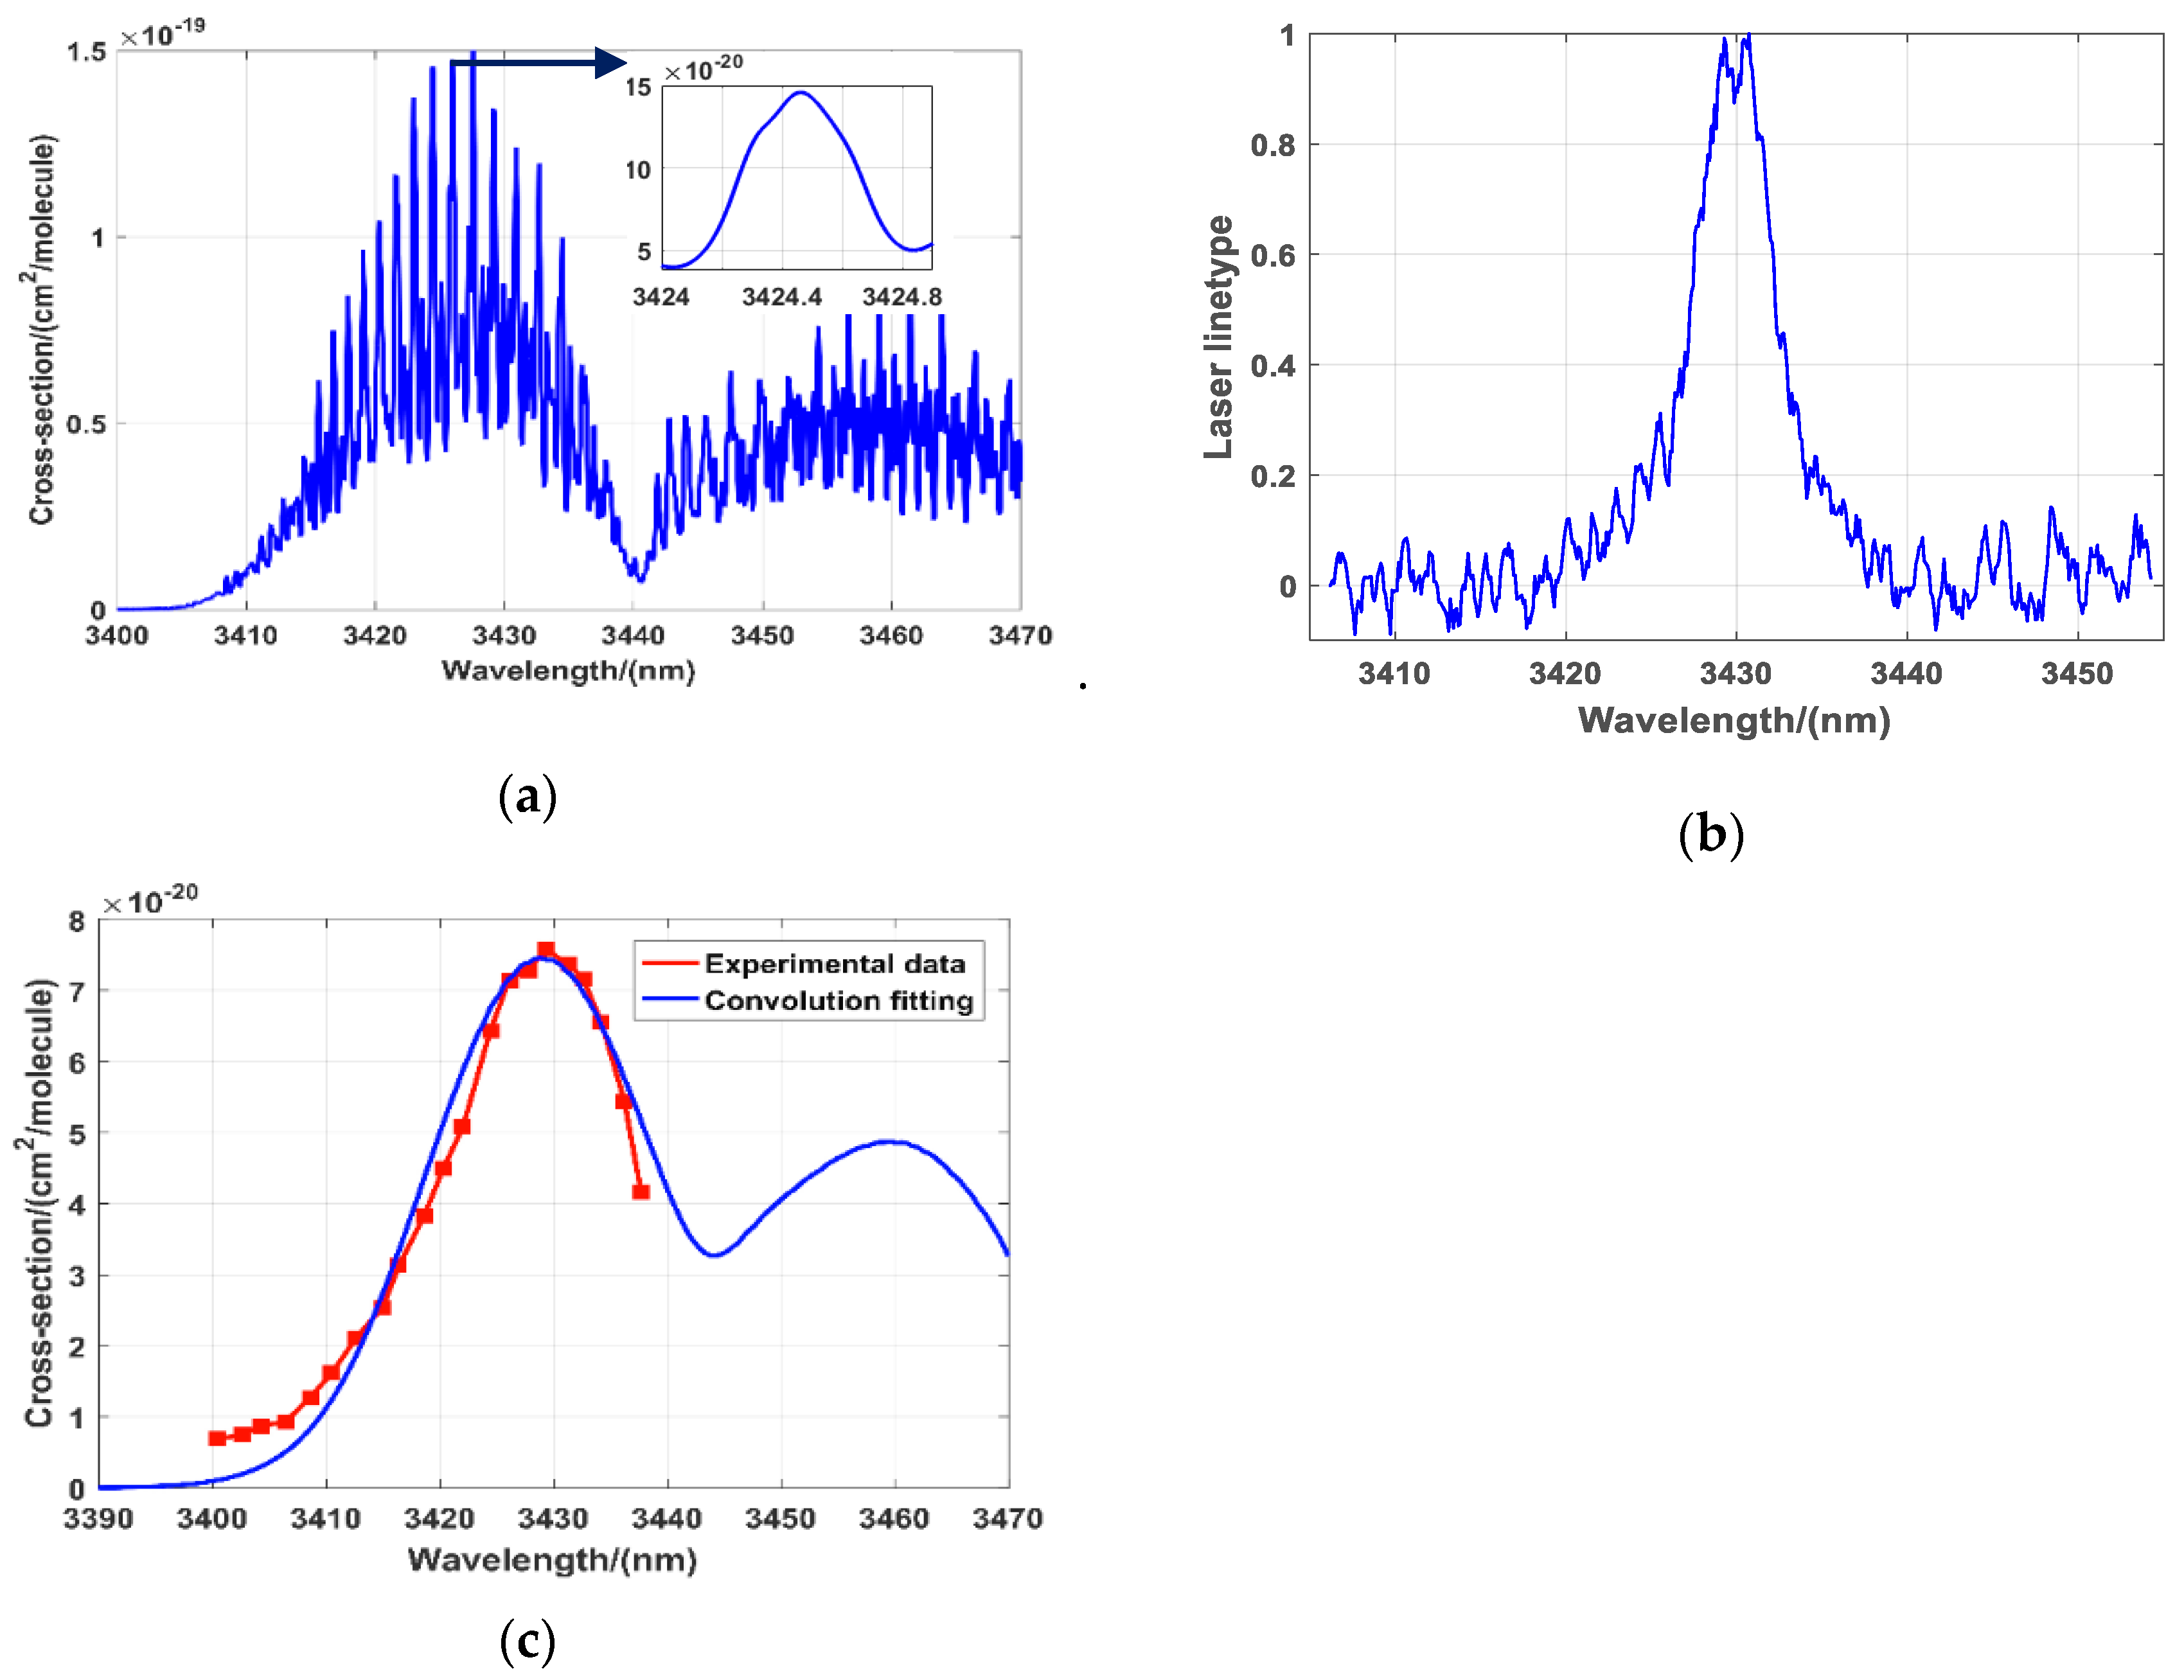
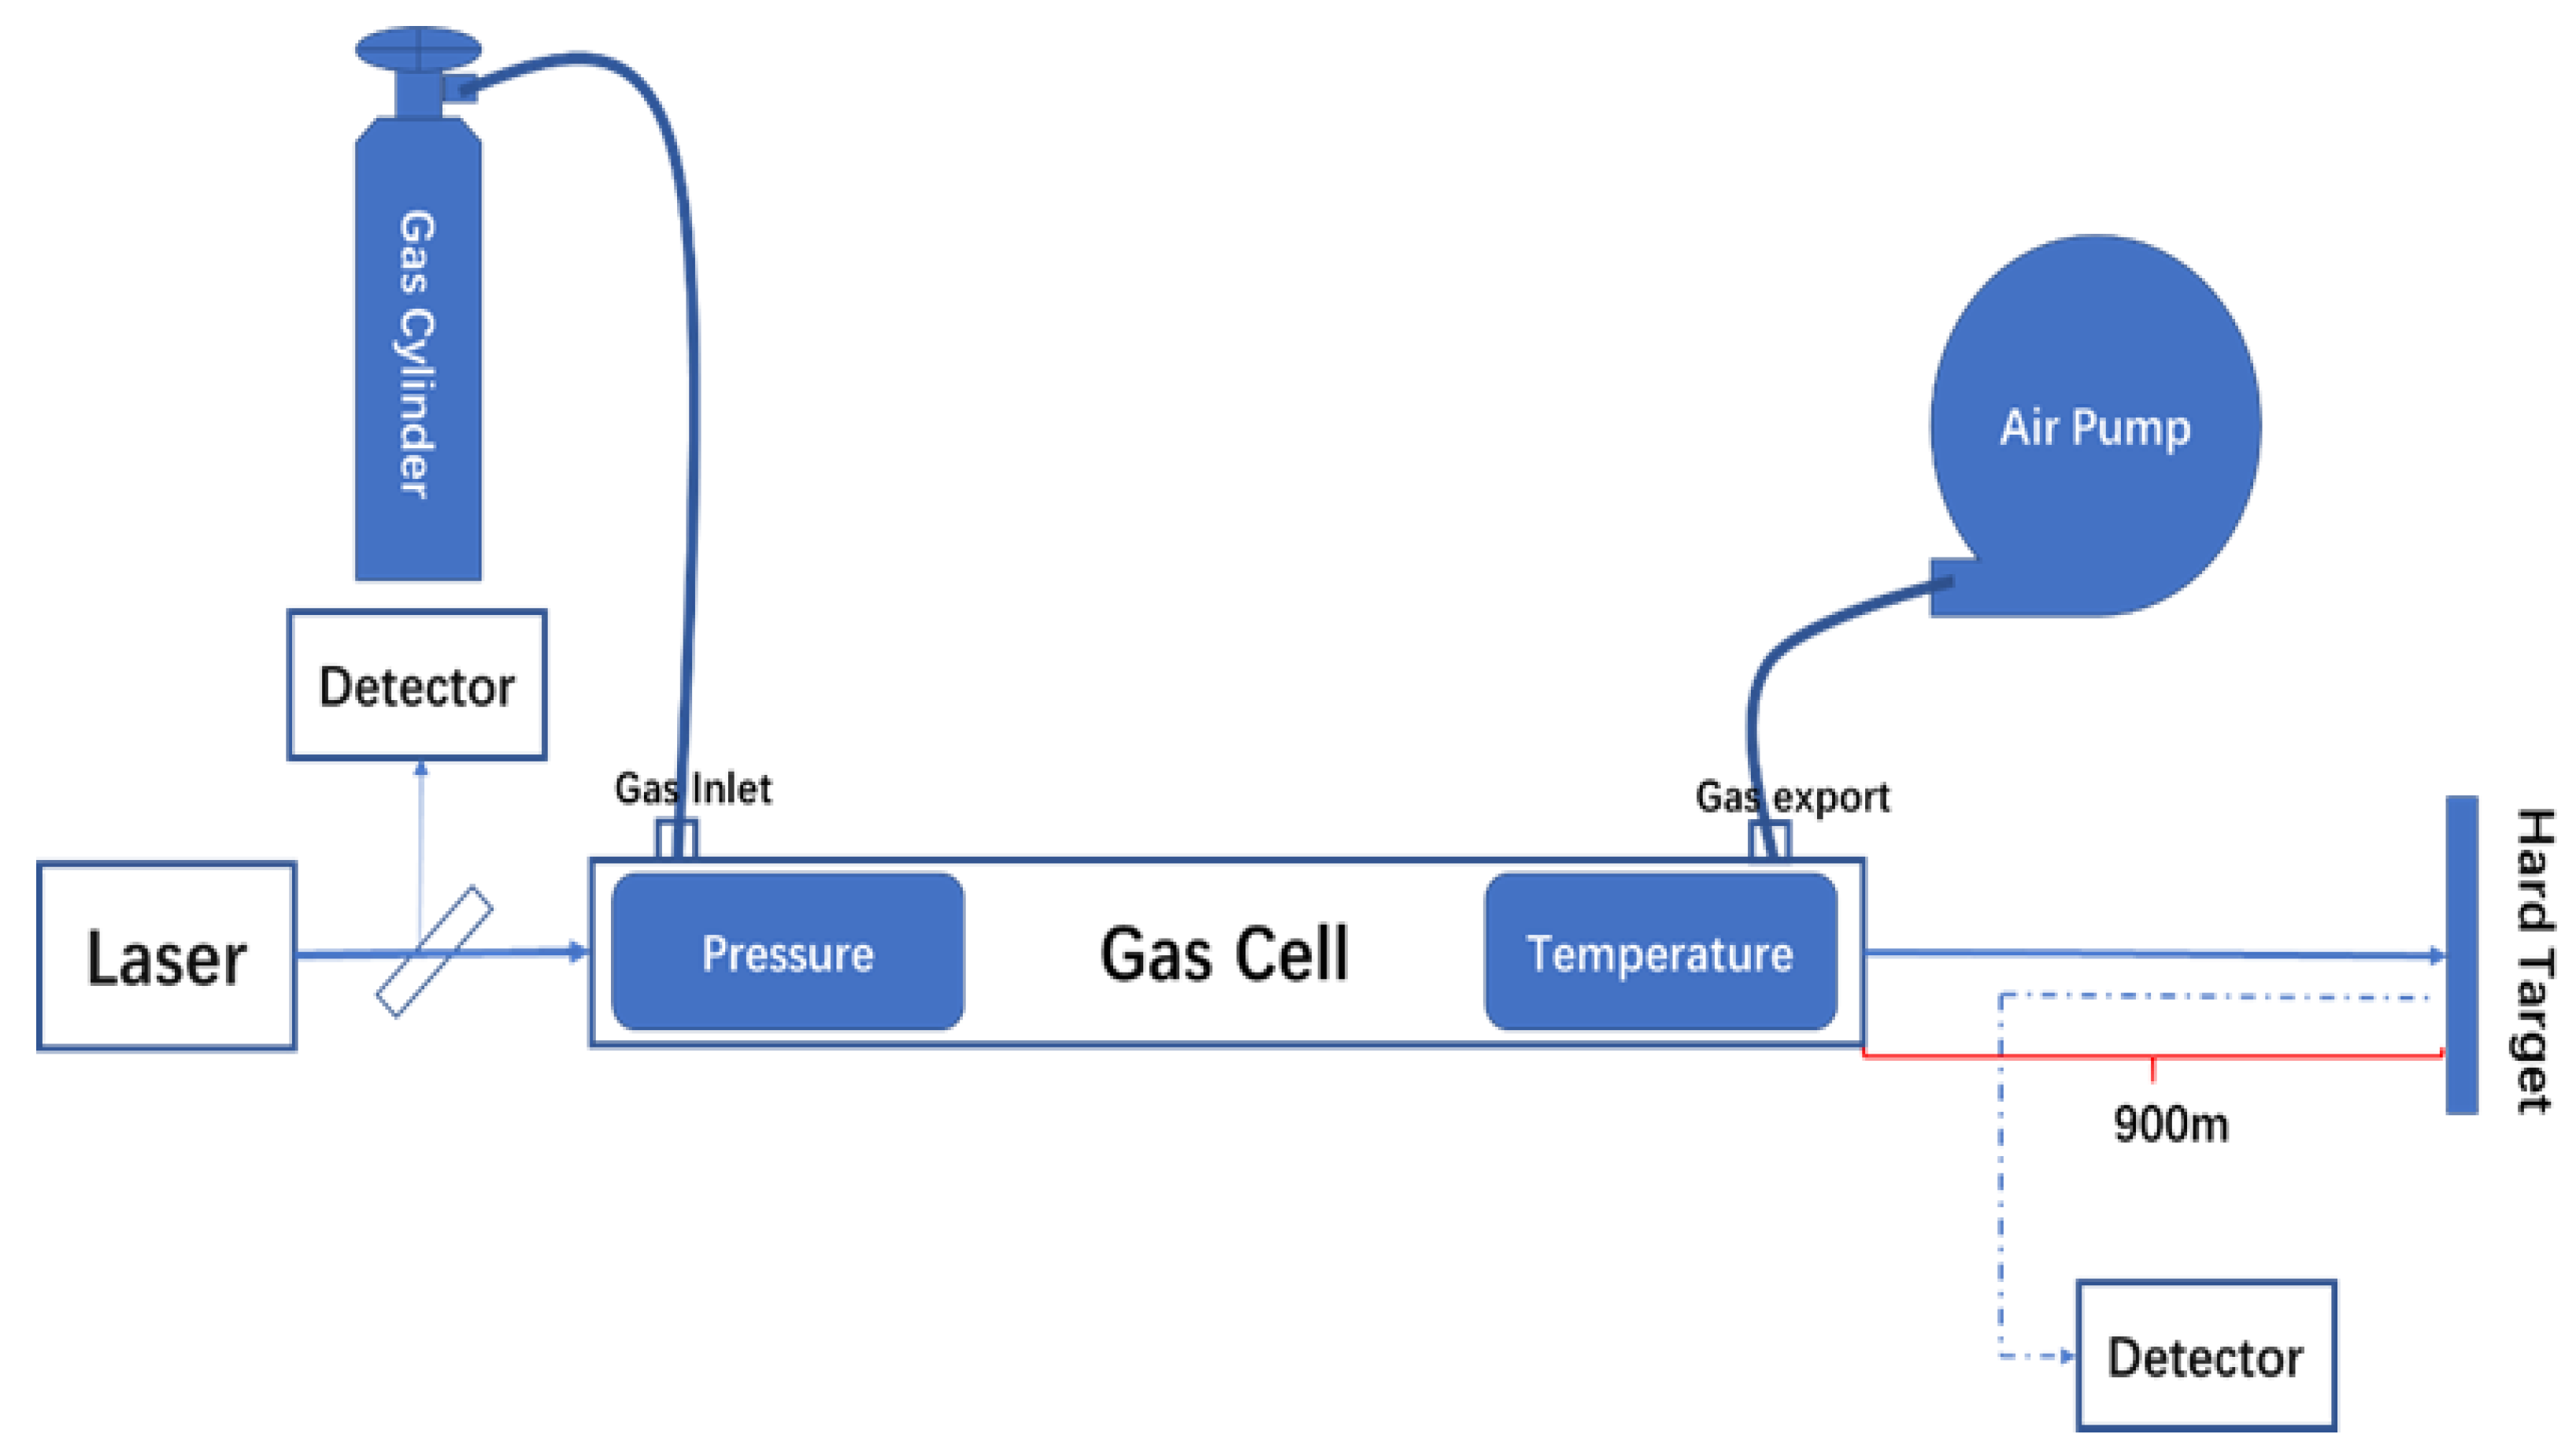
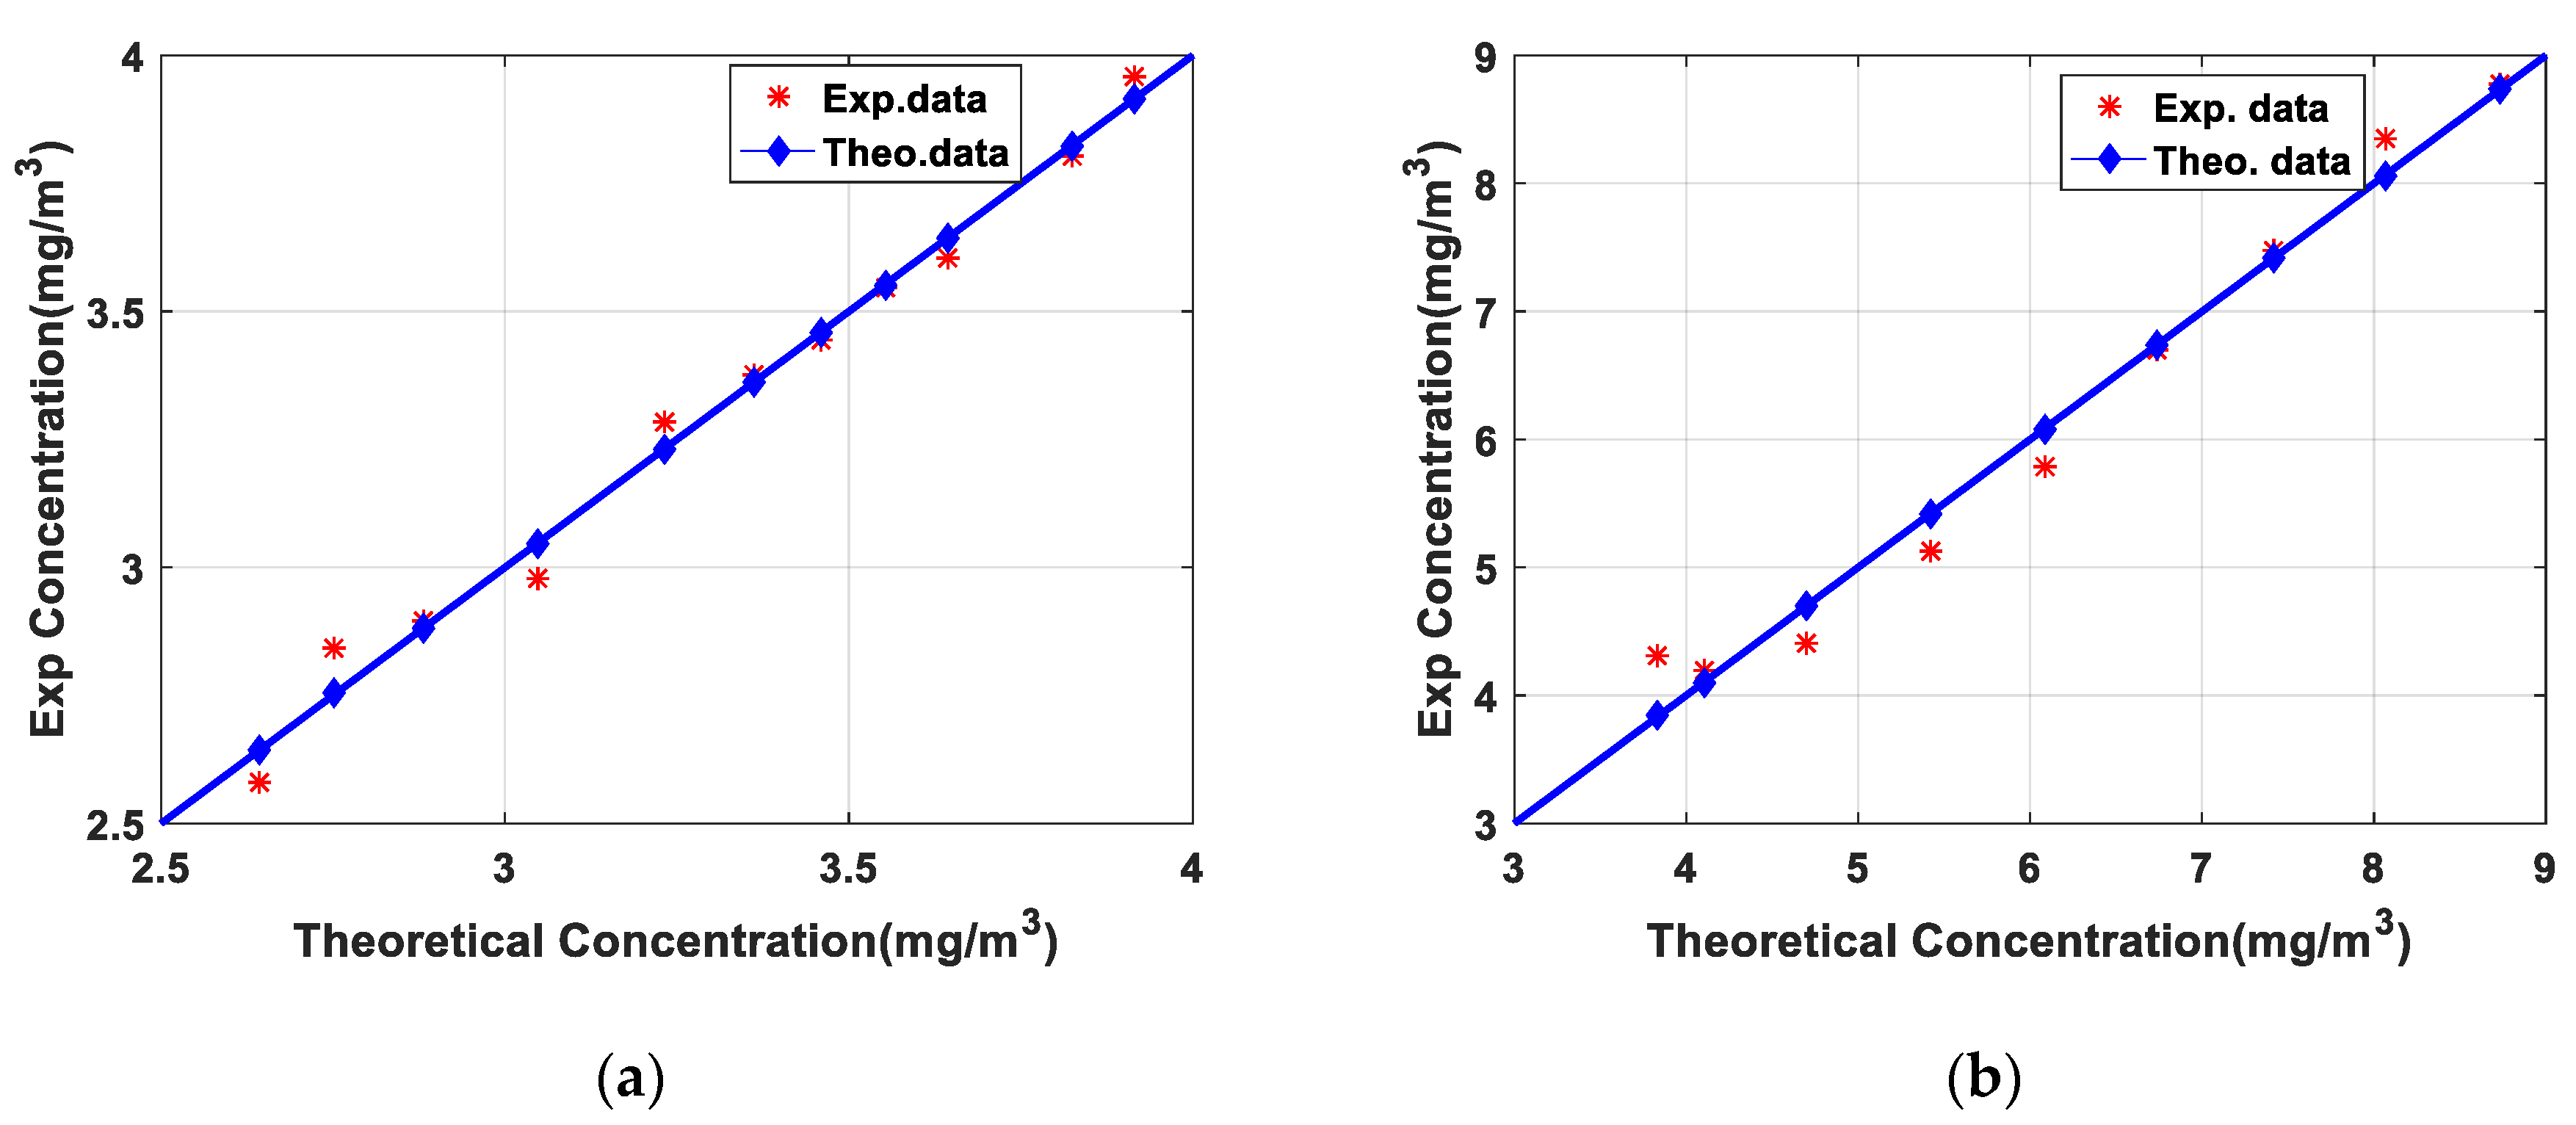
4.1. Calibration Experiment of DIAL

After constructing the DIAL system, the calibration experiment should be carried out to verify the ability of the system measuring the gas. Limited by the weather and the surrounding environment, there are few chances for lidar to observe the gas emission. At the same time, in the field experiment, the concentration of gas is easily interfered by human activities and air flow, resulting in uneven concentration distribution, and it is very difficult to verify the accuracy of lidar in an open field. In this paper, we used a set of precision calibration device to verify the accuracy of lidar detection. We simulated the equivalent gas integration path absorption in the open field by controlling the temperature and air pressure of the gas cell. In this experiment, there are no influences from field test and environmental factors that need to be considered.
As shown in Figure 3, the experiment used gw-1000c short optical path gas cell, with a total length of 20 cm and a diameter of 2 cm. The laser was directed to go straight through the cell, which was suitable for the spectral band of 700–12,000 nm. The gas cell was equipped with a temperature controller and a dp-100 Panasonic pressure sensor to display the real-time temperature and pressure. The experiments used 12,000 ppm NO2 standard gas (98.8% N2, 1.2% NO2) and 12,000 ppm SO2 standard gas (98.8% N2, 1.2% SO2) as the experimental gases. At the same time, in order to improve the signal-to-noise ratio, all of the λon and λoff signals acquired were made up of 250 pulses on average (the corresponding acquisition time was 1 s). We took a wall with a distance of 900 m as the hard target. Prior to the experiment, we adjusted the direction of the scanner to make the laser illuminate the hard target through the atmosphere. During the experiment, we used the vacuum pump to draw out the gas in the cell, put the cell into the optical path and recorded the two detector signals as the background data. Then, we opened the standard gas cylinder and injected a proper amount of standard gas into the cell. The concentration of the gas can be calculated from the pressure and temperature of the cell. We acquired the data of the detectors under different pressures with same temperature, inverted the concentration in the gas cell and compared it with the theoretical concentration to verify the detection ability of the system.
The echo signals of λon and λoff were different when the cell was under the vacuum condition. Although both λon and λoff lasers were powered by the same pump source, but they passed through different PPLN crystals and different optical paths, resulting in a little difference in divergence angle, energy and shape. It was difficult to ensure that the parameters of the two lasers were the same except for the wavelength. Thus, the monitoring channel was introduced. It could acquire the energy of the lidar and correct the echo signals. Figure 4 is the corrected detector signals. After the correction, we could inverse gas concentration in the next step.
We then carried out the calibration experiment. First, we opened the gas cylinder valve and emitted the standard gas into the cell. Second, the pressure in the gas cell was changed to control the absolute content of gas and the data were acquired under the different contents. Third, we calculated the concentration of gas and compared with the theoretical concentration. The experiment was carried out in the normal atmospheric environment. The temperature was maintained at 298 K and was not changing significantly, but the pressure changed by a large amount. The absorption spectrum would be greatly different under different pressures, which might increase the inversion error. According to the data of HITRAN, we corrected the ∆σ to increase the accuracy. The corrected ∆σ was substituted into Formula (3) to calculate the gas concentration as the measured result, then we used the ideal gas state equation to obtain the theoretical concentration:
N a l l = P V R T .
where P is the pressure of the gas cell, V is the volume of the gas cell, R is the ideal gas constant, Nall is the total gas molecular in the absorption cell. According to the percentage of gas in the standard gas cylinder, we got accurate concentration. We verified the detection performance of the DIAL system by comparing it with the measured results.
Figure 5 shows the comparison results between the measured concentration from Formula (3) and the theoretical concentration in the gas cell from ideal gas state equation. The measured NO2 and SO2 gas concentrations coincided well with the theoretical concentration curve, and the inversion results were in good agreement with the theoretical results. However, there were also some differences between the measured concentration and the theoretical concentration especially at low concentrations. The gas cell cannot be completely sealed. When the gas concentration in the cell is lower, the external gas is easier to enter the cell and the error of gas inversion results is larger. In order to evaluate the matching degree between the inversion result and the theoretical value, Pearson correlation coefficient (CC) was used to evaluate the consistency and the root mean square error (RMSE) was used to evaluate the deviation. The CC and RMSE of NO2 were 0.993 and 0.047 respectively while the CC and RMSE of SO2 were 0.988 and 0.2582. The calibration experiments of NO2 and SO2 ensured the reliability of the lidar system and the inversion algorithm.

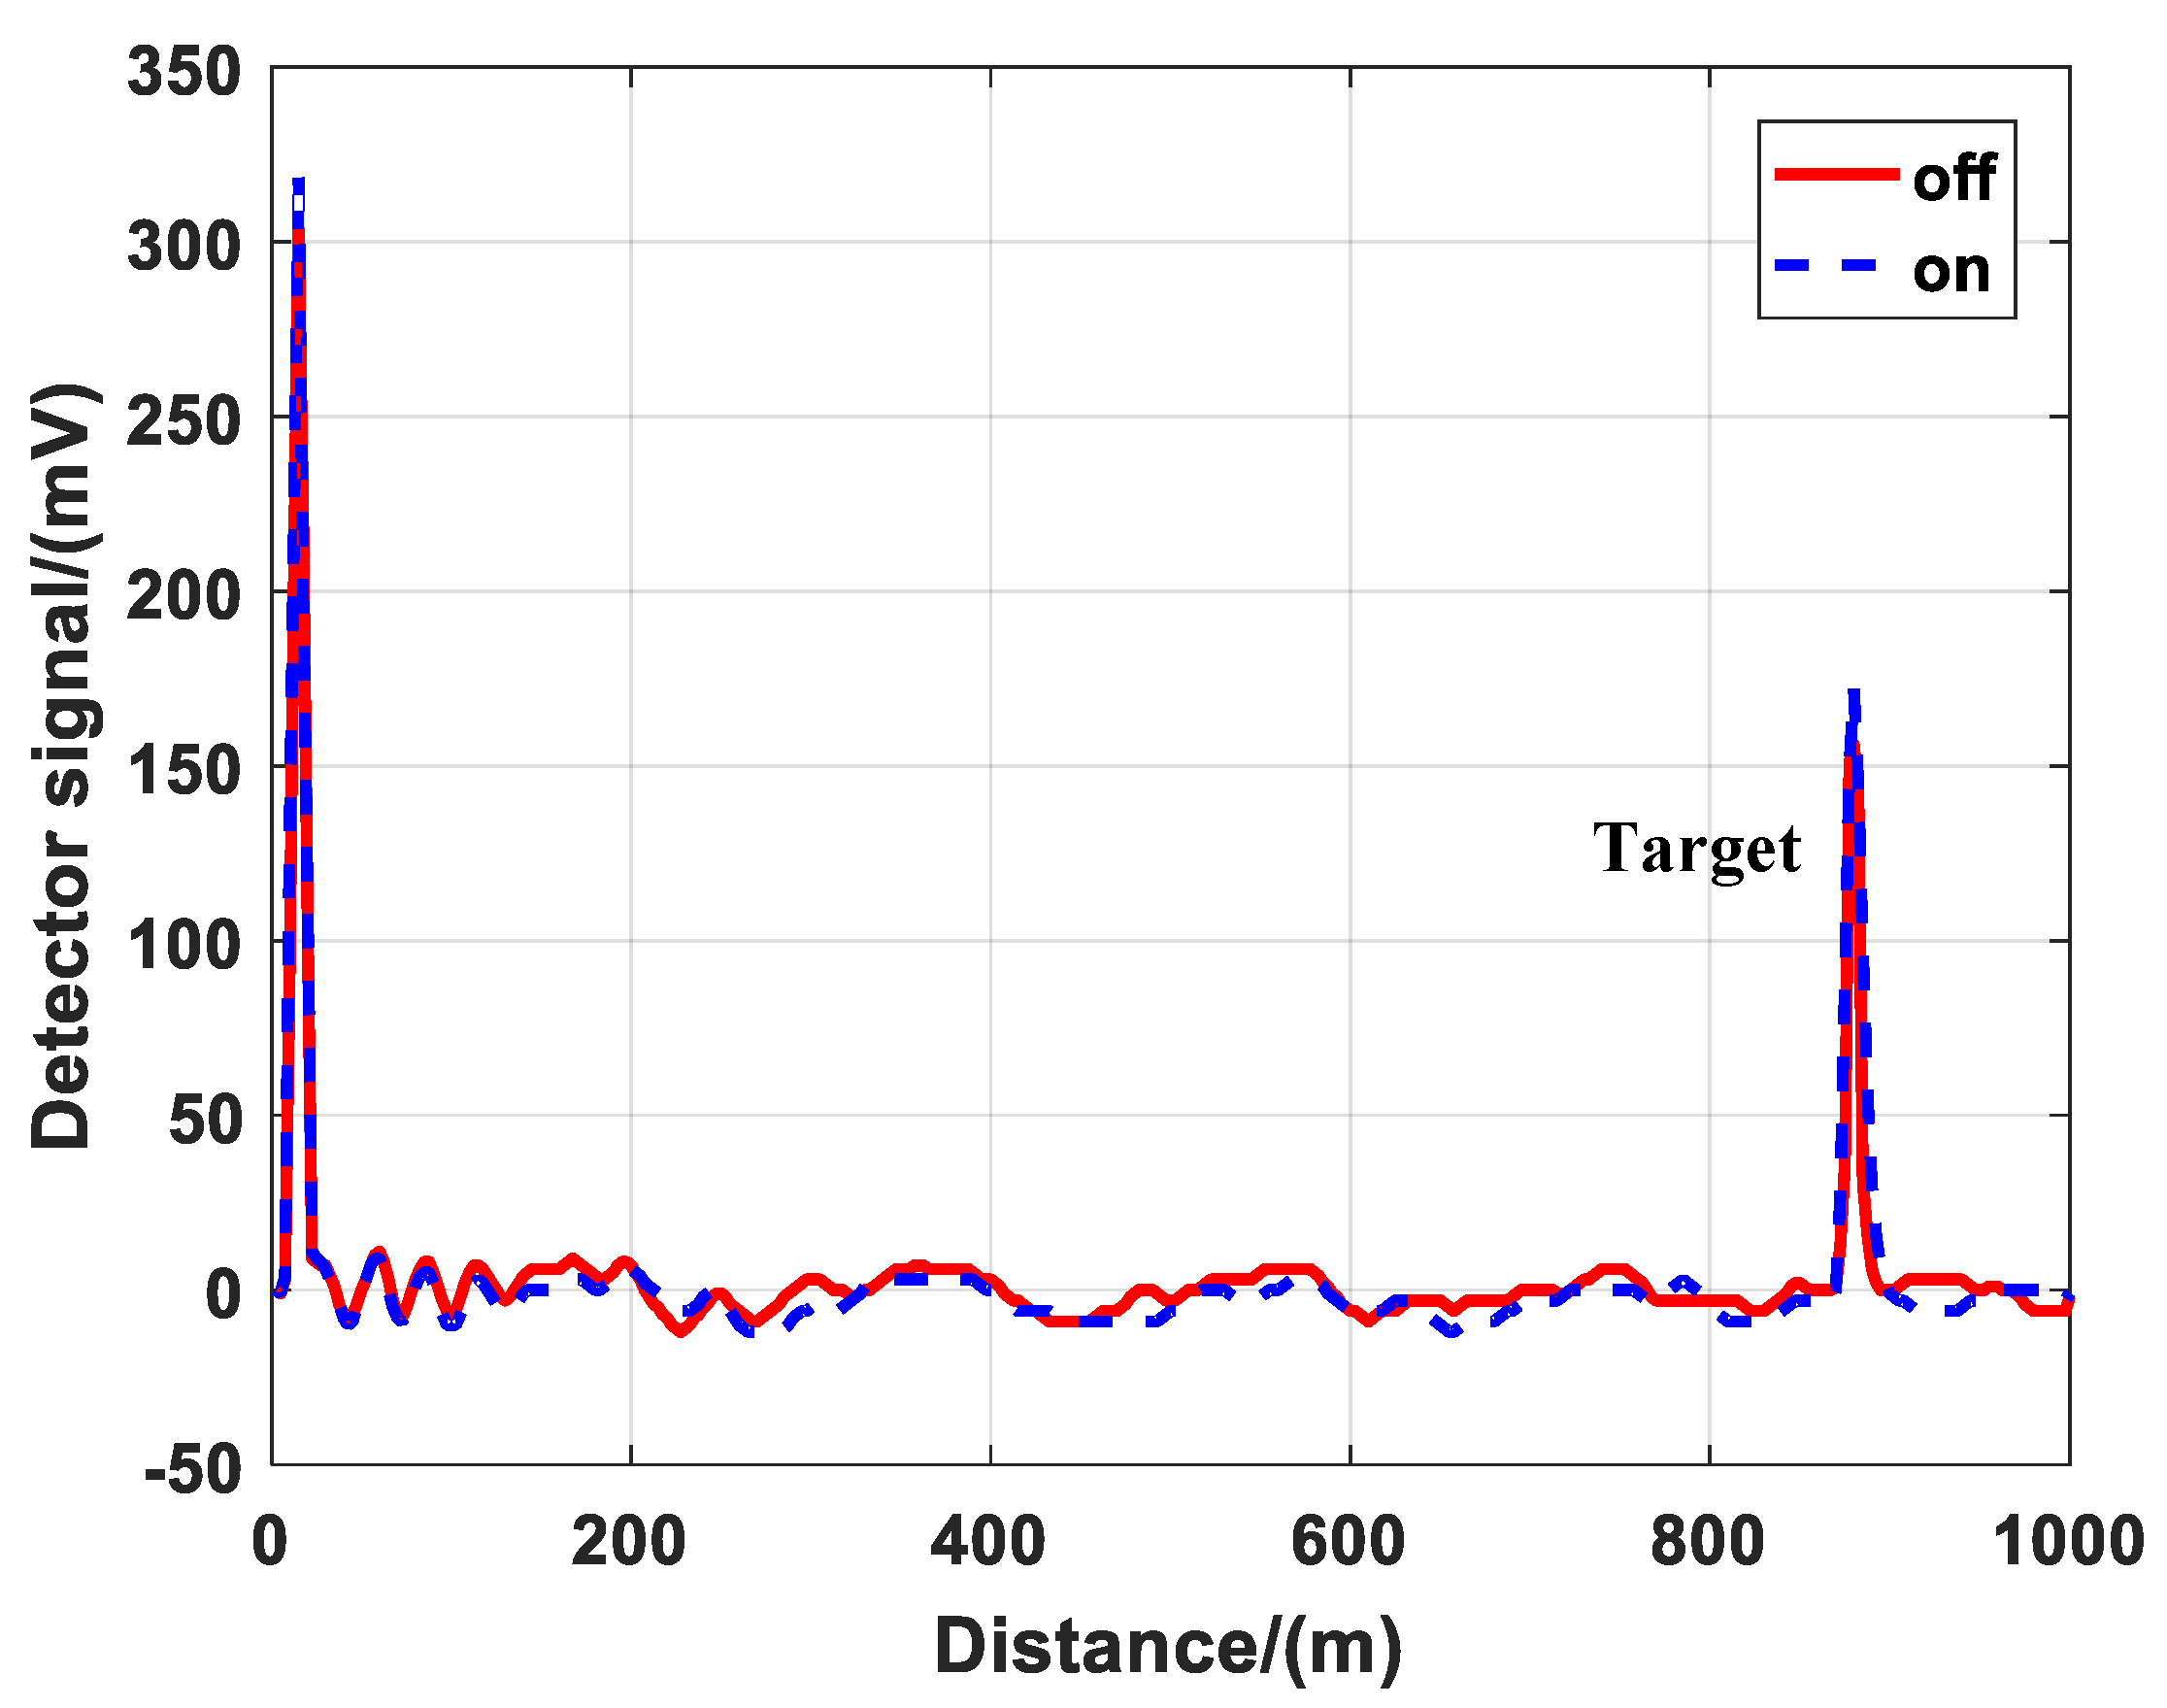
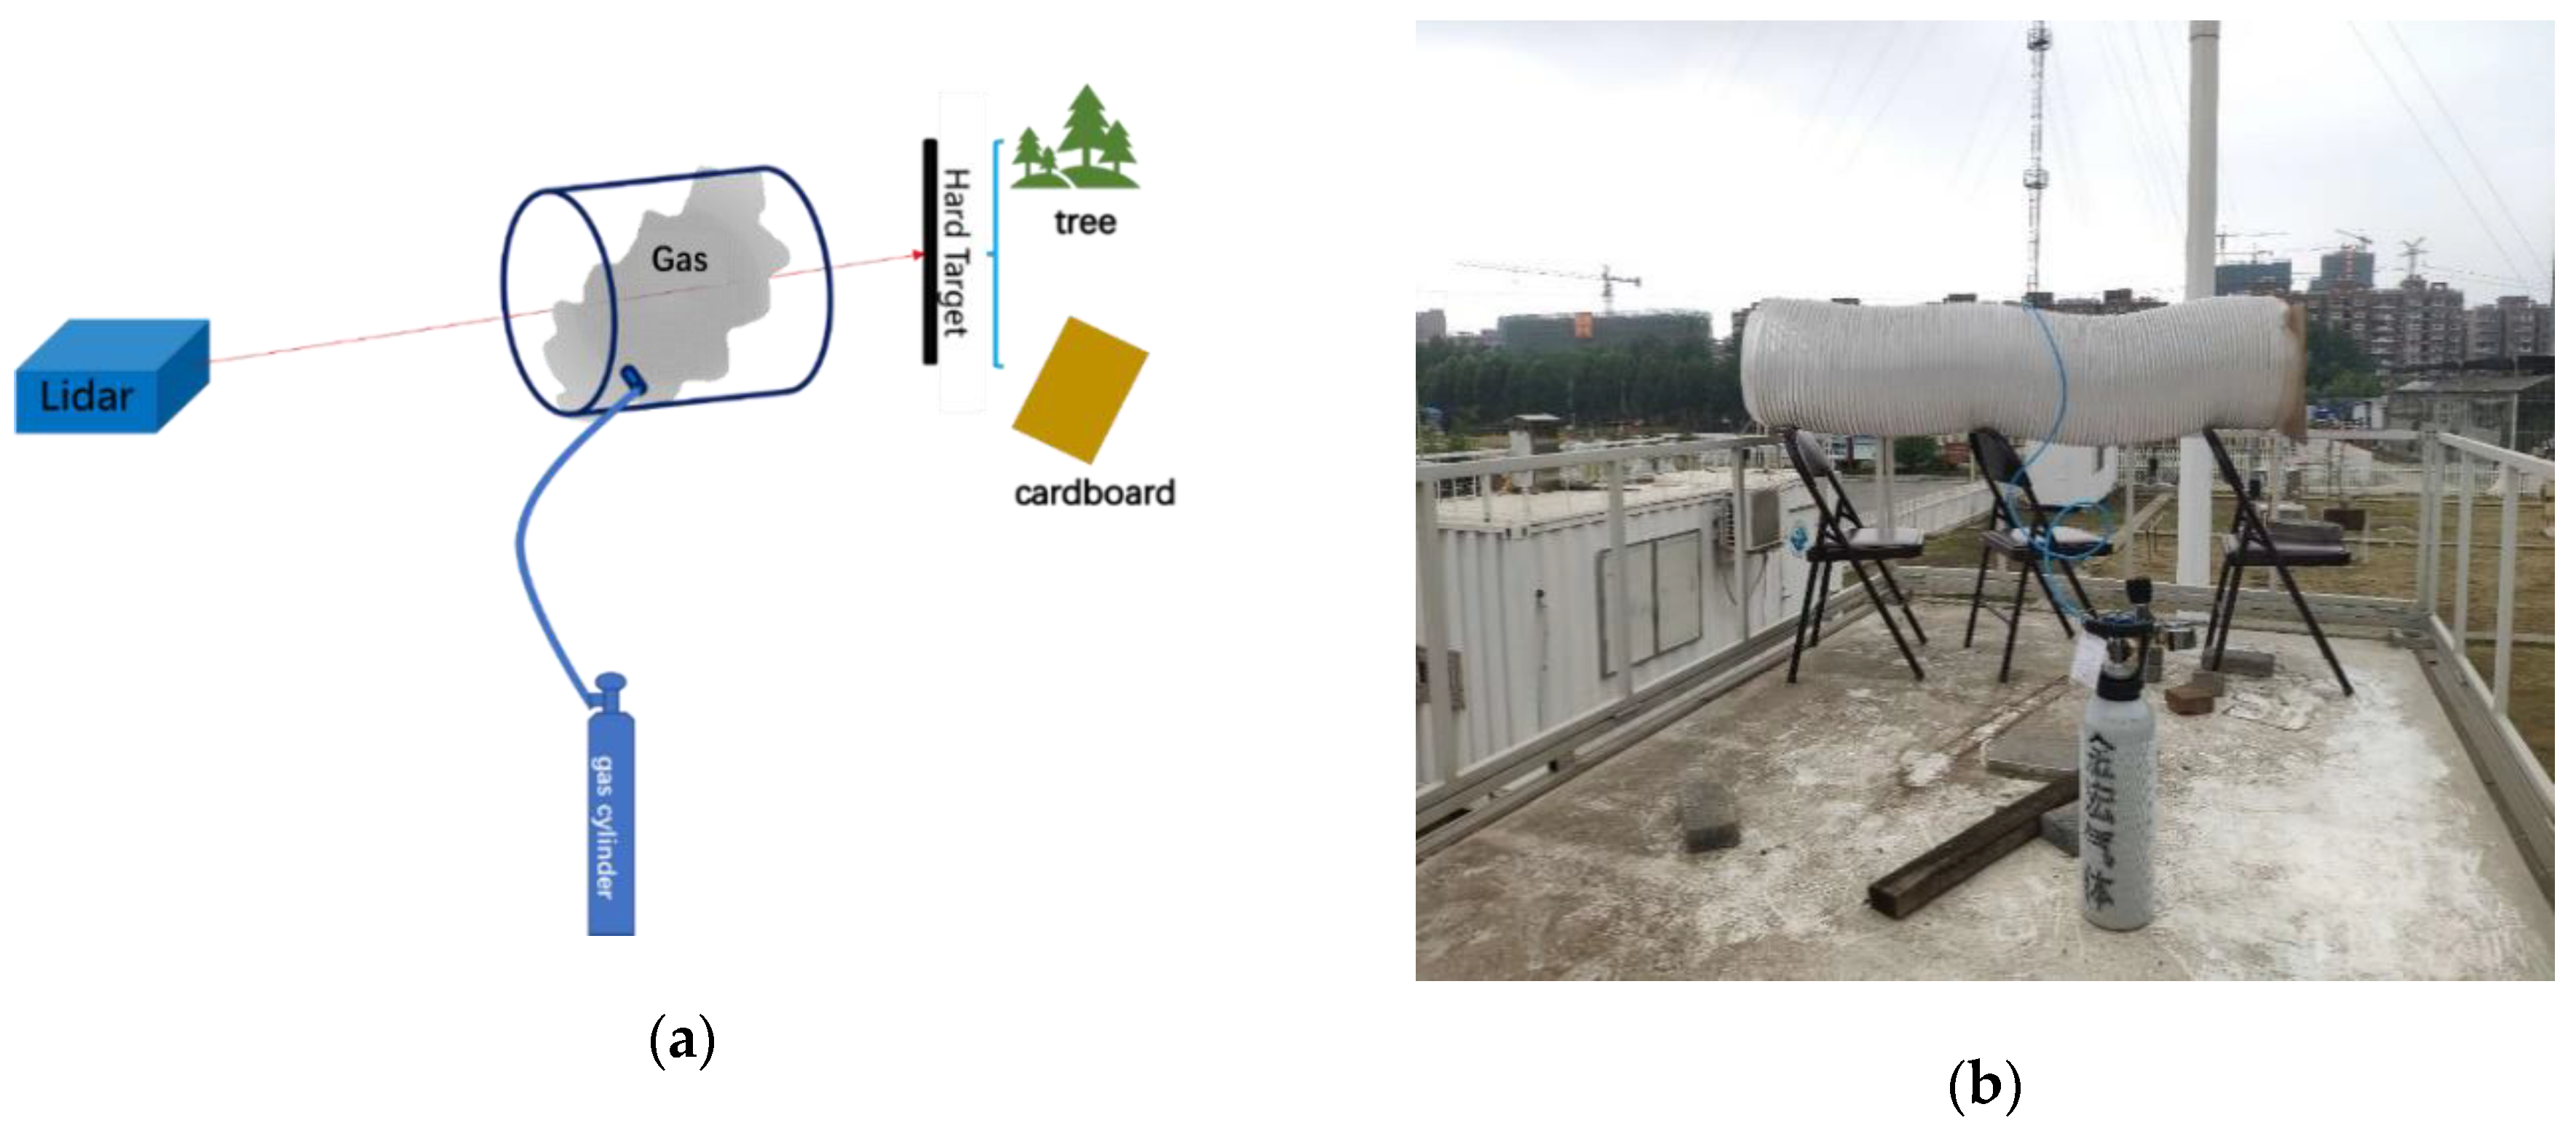
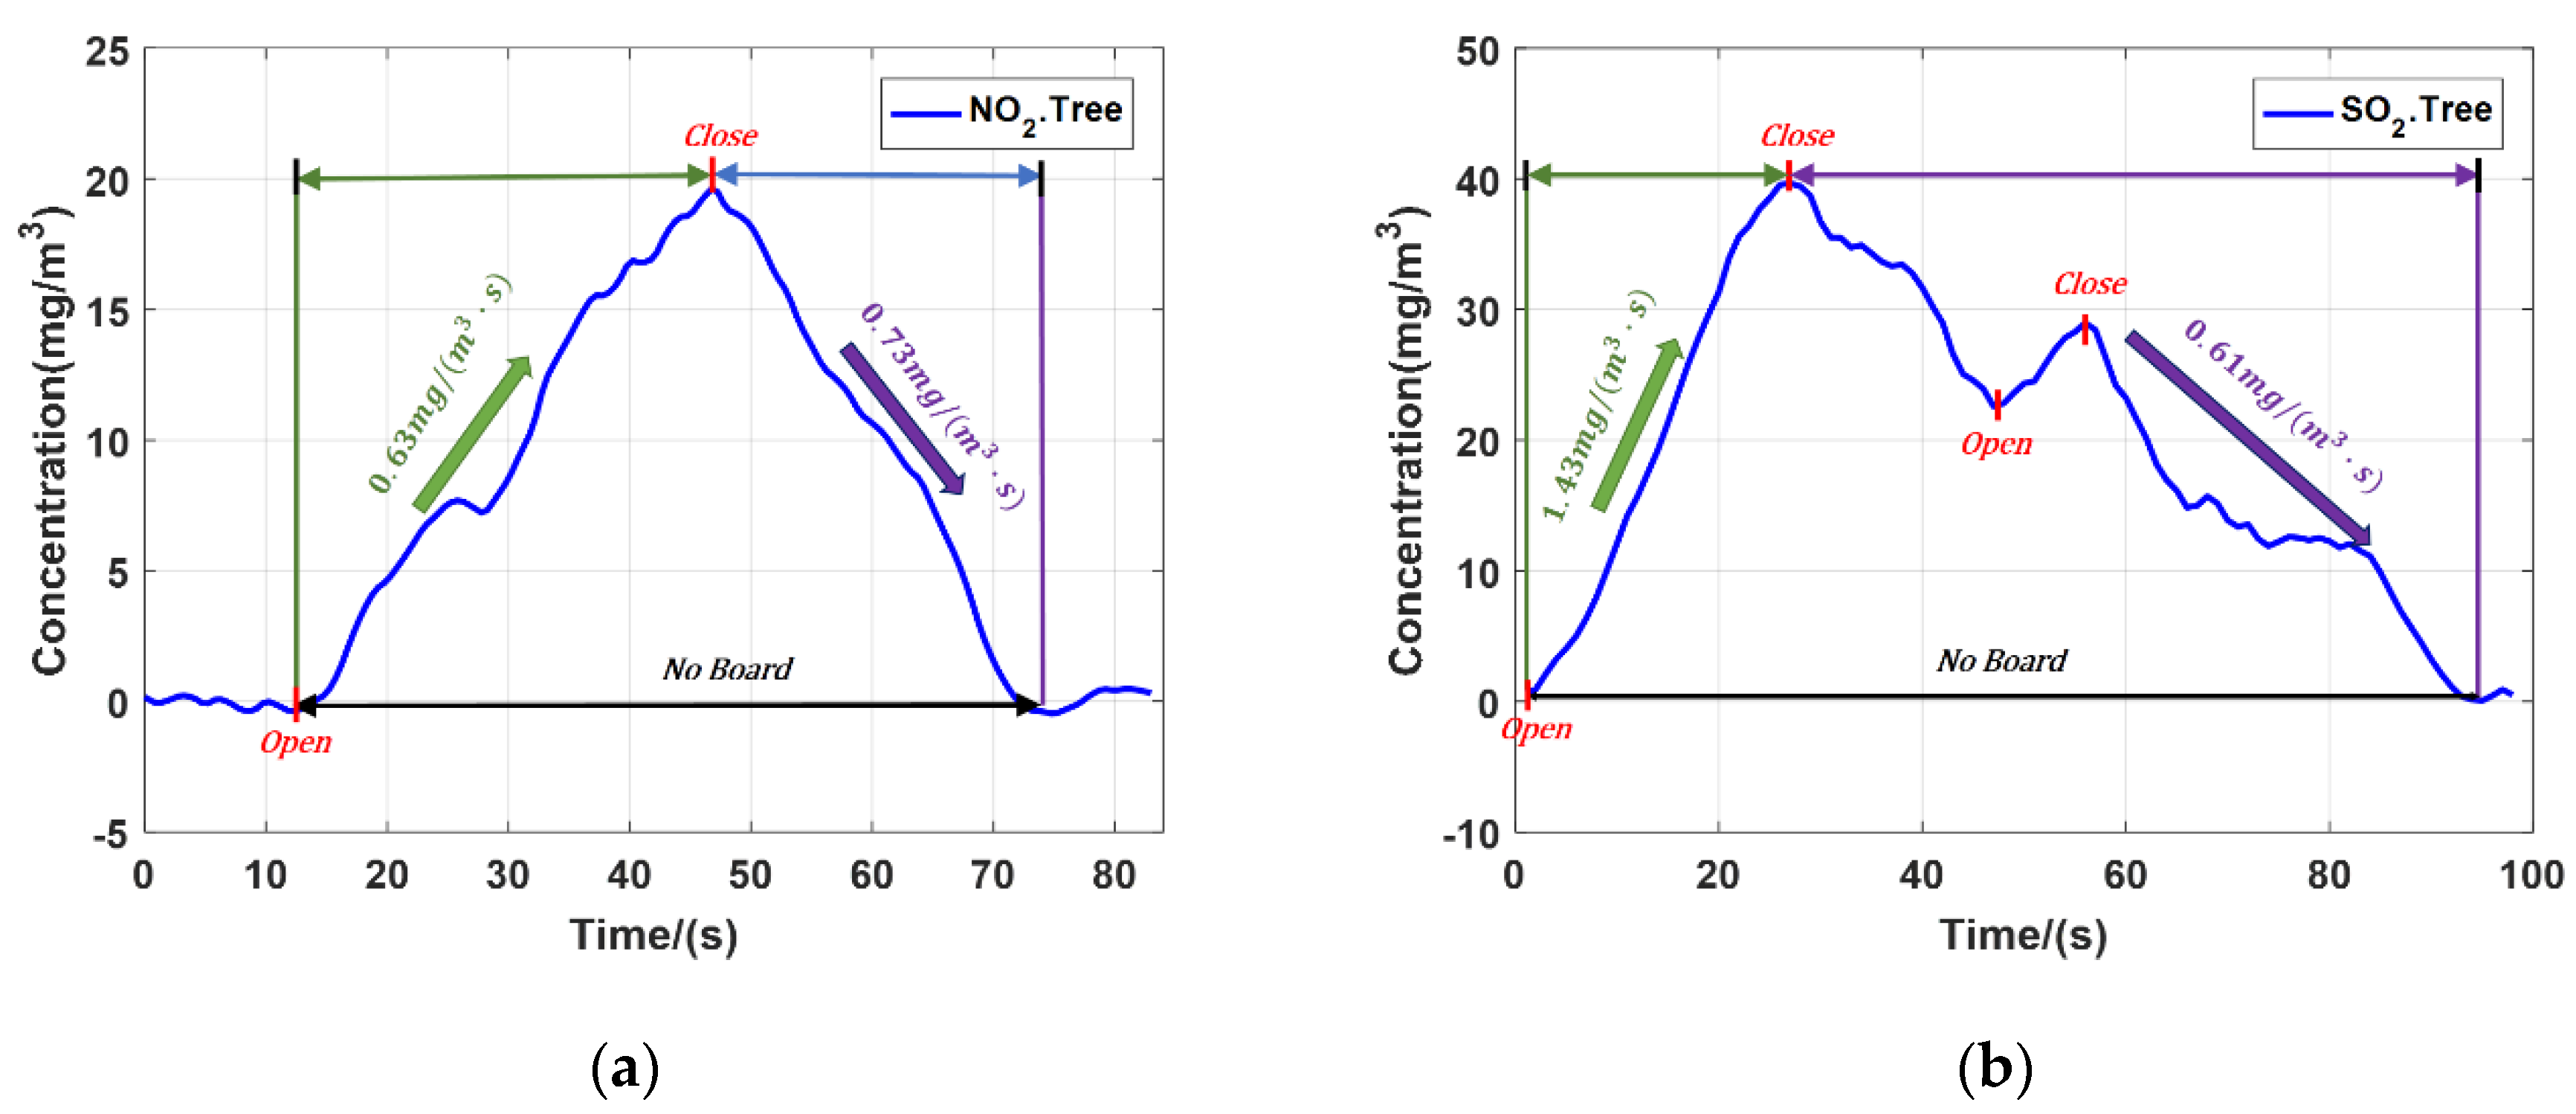
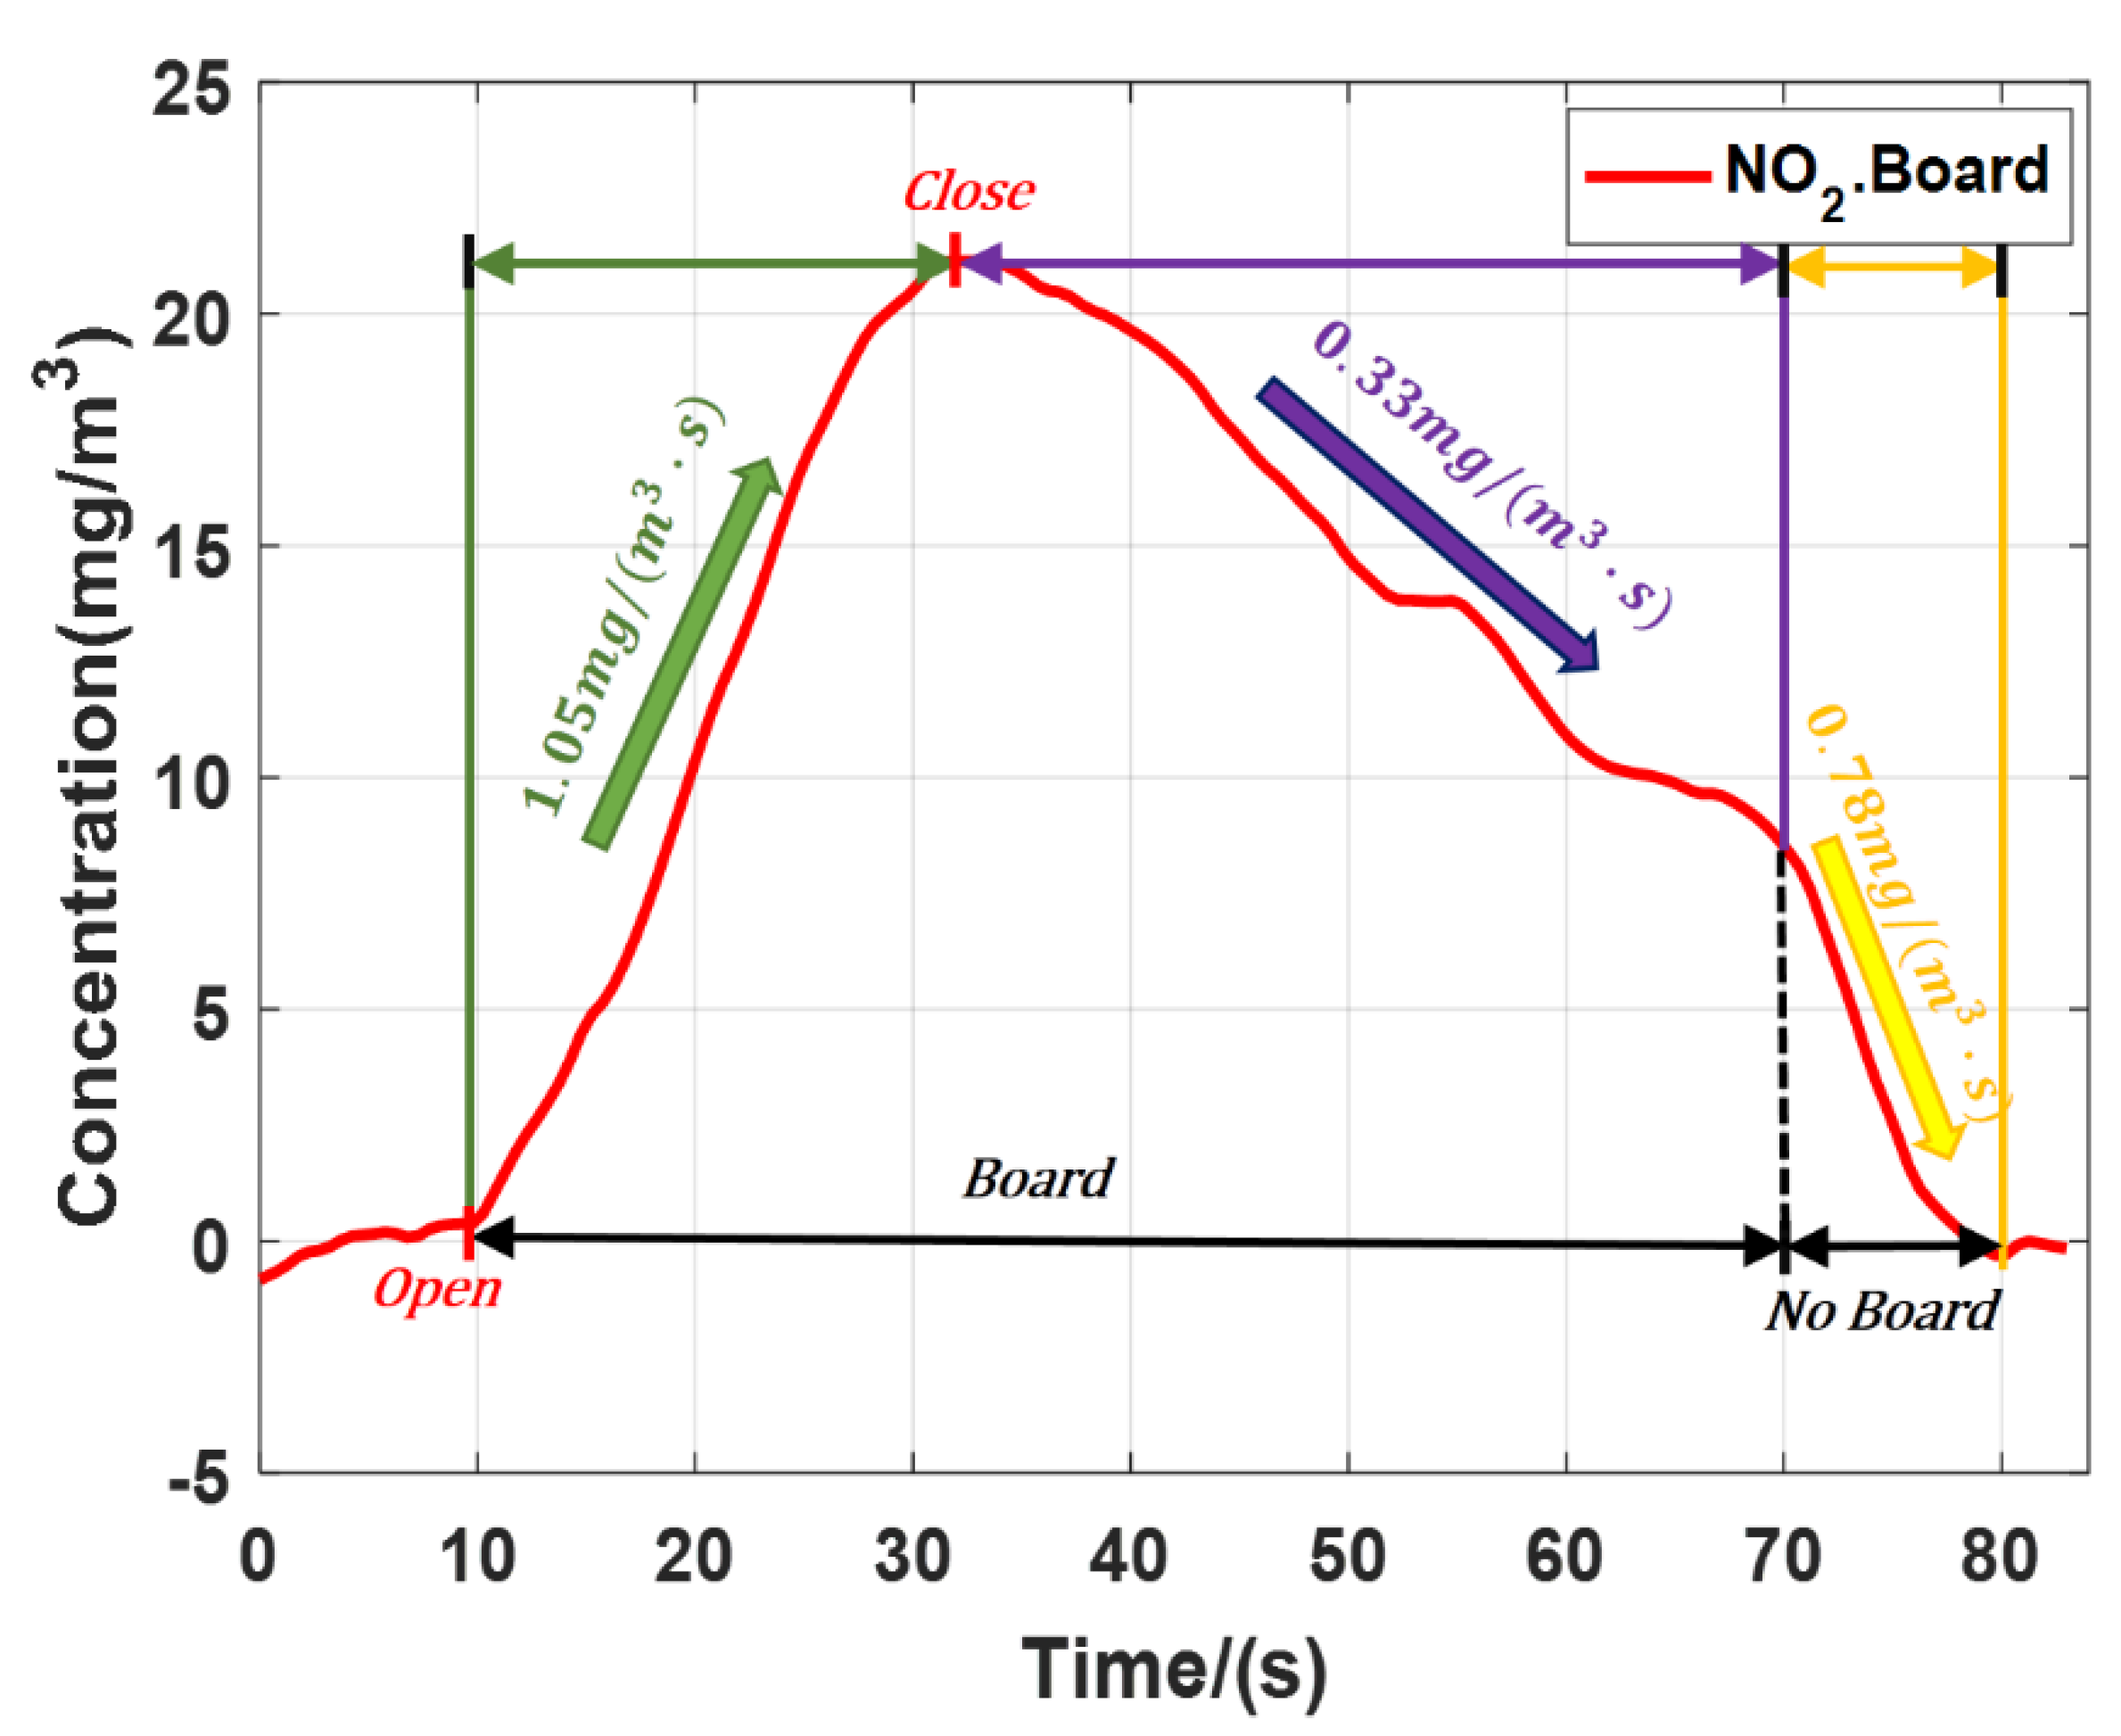
4.2. Open Field Observation of DIAL

In order to explore the detection capability of gas emission in the open field, we carried out the detection of polluted gas emissions in open field during the afternoon of 21 May 2019. The meteorological condition is relative stable and the atmospheric temperature was 24 °C, the relative humidity was 42%, visibility was 26 km and windspeed was 3 m/s. Figure 6a shows the schematic diagram of open field gas measuring experiment and Figure 6b shows the photograph of open field gas measuring experiment. We placed an exhaust pipe with length of 2 m and diameter of 400 mm at a distance of 200 m from the lidar system. The two ends of the pipe were open while the sidewall was sealed. A circular vent was left on the sidewall to connect with standard gas cylinder to simulate the discharge of pollution gases. Prior to the experiment, the scanning head of lidar was pointed to the pipe to ensure that the laser passed through the pipe completely and reached the hard target. In the infrared spectrum, the contribution of molecular scattering to the total signal was negligible. The returned signal depended on the reflected signal of the hard target and the pollution gas column content. The differential absorption signal ratio was calculated according to the returned signal from the hard target and then the gas concentration was inverted. In order to make the results repeatable and nonspecific, the experiments were carried out with trees, and board, as hard targets respectively. The board was directly placed on the rear end of the pipe. The trees were the background targets located at the rear end of the pipe. In the experiment, we firstly operated the lidar to collect the background signal of the system, then opened the cylinder valve releasing the gas to the pipe. When the concentration reached the maximum, we closed the cylinder valve and waited for the gas to dissipate. The system acquired the signal intensity of the whole release process and inverted the concentration of gases.
The experiments of NO2 and SO2 emission were carried out with the trees as the hard target. Based on the characteristics of high repetition rate and signal-to-noise ratio, the temporal resolution can reach second level. Figure 7a is average concentration of NO2 and Figure 7b is average concentration of SO2. The two experiments completely recorded the changes of NO2 and SO2 concentration. During the NO2 experiment, the gas cylinder was opened once. When the cylinder opened, the NO2 concentration rose at the speed 0.63 mg/(m3 s). Then we closed the cylinder, the gas concentration dropped at the speed of 0.73 mg/(m3·s). Finally, all NO2 dissipated and the concentration returned to the initial concentration value. During the SO2 experiment, the gas cylinder was opened twice. The valve was fully opened in the first time, and then the valve was half opened, the second time. During the first opening of the valve, the average SO2 concentration rose sharply at the speed of 1.43 mg/(m3·s). Then the valve was closed, the gas concentration decreased at the speed of 0.61 mg/(m3·s). Before the dissipation of the SO2, the valve was opened again and the SO2 concentration increased. Finally, all SO2 dissipated and the concentration returned to the initial value.
The NO2 emission experiment was carried out with a board as the hard target. Figure 8 shows the result. When the gas cylinder valve was half opened, the NO2 concentration rose at the speed of 1.05 mg/(m3·s), Then we closed the gas cylinder valve, the NO2 concentration slowly dropped at the speed of 0.33 mg/(m3·s). After a period of time, we removed the board and the gas dissipation speed increased to 0.78 mg/(m3·s), basically consistent with the gas dissipation speed in Figure 7a. Because the board was directly placed behind the pipe, it was not easy for the gas to flow out from the pipe. Compared with the results of experiment which taking the trees as the hard target, the board just behind the pipe kept the high concentration of NO2 in the pipe. The experimental results were in line with the scientific reality. According to SNR of lidar and ∆σ of polluted gases, substituting Formula (4) to calculate, the minimum detection sensitivity was 0.07 mg/m3 (NO2) and 0.31 mg/m3 (SO2).

5. Conclusions

In this work, a set of 2.5–4 μm solid-state high repetition rate mid-infrared DIAL has been developed. By changing the PPLN crystals and adjusting the temperature, the wavelength can be tuned to measure a variety of gases. In this study, taking NO2 and SO2 as examples, the original inversion equation is modified to correct the system error caused by the lidar system. We carried out the lidar system calibration experiment and open field observation experiment. The calibration experiment showed CC was higher than 98%, which ensured the lidar’s detection ability for measurement of the pollution gases. The open field observation experiment showed the lidar system can record the real-time concentration changes of gas with high temporal resolution up to second level. The minimum detection sensitivity for NO2 and SO2 was 0.07 mg/m3, and 0.31 mg/m3, respectively. The system has advantages in temporal resolution, which can be used to monitor the concentration of pollution gases around plants and help improve the early warning tasks. Using a pipe to simulate gas emission in the open field is not an ideal approach. In the next stage of research, we will use the system to detect the gas emission of chemical plants to verify the detection performance in a real open field. We will continue to make full use of the characteristics of wavelength tunable and high temporal resolution to realize the effective detection of some other kinds of gases.

Author Contributions

Y.G. and L.B. conceived and designed the experiments; Y.G. and B.Y. performed the experiments; Y.G. and L.B. performed the experiments analyzed the data; Y.G., L.B., F.M. and B.Y. contributed reagents/materials/analysis tools. All authors have read and agreed to the published version of the manuscript.

Funding

The work was funded by the National Natural Science Foundation of China (Grant No. 41675133) and the Natural Science Foundation of Jiangsu Province (Grant No. BE2015003-4)

Conflicts of Interest

The authors declare no conflict of interest.

References

  1. Rossi, R.; Ciparisse, J.F.; Gelfusa, M.; Malizia, M.; Gaudio, P. The project TELEMACO: Detection, identification and concentration measurements of hazardous chemical agents. J. Instrum. 2019, 14, C03004. [Google Scholar] [CrossRef]
  2. Vale, A.; Bradberry, S.; Rice, P.; Marrs, T.C. Chemical warfare and terrorism. Medicine 2003, 31, 26–29. [Google Scholar] [CrossRef]
  3. Moore, B.L.; Geller, R.J.; Clark, C. Toxic industrial chemicals and chemical weapons: Exposure, identification, and management by syndrome. Emerg. Med. Clin. N. Am. 2015, 33, 13–36. [Google Scholar]
  4. Axelsson, H.; Edner, H.; Galle, B.; Ragnarson, P.; Mats, R. Differential optical absorption spectroscopy (DOAS) measurements of ozone in the 280–290 nm wavelength region. Appl. Spectrosc. 1990, 44, 1654–1658. [Google Scholar] [CrossRef] [Green Version]
  5. Innocenti, F.; Robinson, R.; Gardiner, T.; Finlayson, A.; Connor, A. Differential Absorption Lidar (DIAL) measurements of landfill methane emissions. Remote Sens. 2017, 9, 953. [Google Scholar] [CrossRef] [Green Version]
  6. Weibring, P.; Edner, H.; Svanberg, S. Versatile mobile lidar system for environmental monitoring. Appl. Opt. 2003, 42, 3583–3594. [Google Scholar] [CrossRef] [Green Version]
  7. Repasky, K.S.; Moen, D.; Spuler, S.; Nehrir, A.R.; Carlsten, J.L. Progress towards an autonomous field deployable diode-laser-based differential absorption lidar (DIAL) for profiling water vapor in the lower troposphere. Remote Sens. 2013, 5, 6241–6259. [Google Scholar] [CrossRef] [Green Version]
  8. Xiang, C.; Han, G.; Zheng, Y.; Ma, X.; Gong, W. Improvement of CO2-DIAL signal-to-noise ratio using lifting wavelet transform. Sensors 2018, 18, 2362. [Google Scholar] [CrossRef] [Green Version]
  9. Sa, R.; Bu, L.; Wang, Q.; Zhou, J. Spectral characteristics of polluted gases and their detection by mid-infrared differential absorption lidar. Opt. Int. J. Light Electron Opt. 2017. [Google Scholar] [CrossRef]
  10. Saito, Y.; Bring, P.W.; Edner, H.; Svanberg, F. Possibility of Hard-Target Lidar Detection of a Biogenic Volatile Organic Compound, nu-Pinene Gas, Over Forest Areas. Appl. Opt. 2001, 40, 3572–3574. [Google Scholar] [CrossRef]
  11. Mirov, S.B.; Fedorov, V.V.; Martyshkin, D.; Moskalev, I.S.; Mirov, M.; Vasilyev, S. Progress in Mid-IR lasers based on Cr and Fe-Doped II–VI chalcogenides. IEEE J. Sel. Top. Quantum Electron. 2014, 21, 292–310. [Google Scholar] [CrossRef]
  12. Veerabuthiran, S.; Razdan, A.K.; Jindal, M.K.; Prasad, G. Open field testing of mid IR DIAL for remote detection of thiodiglycol vapor plumes in the topographic target configuration. Sens. Actuators B Chem. 2019, 298, 126833. [Google Scholar] [CrossRef]
  13. Mammez, D.; Cadiou, E.; Dherbecourt, J.B.; Raybaut, M.; Melkonian, J.M.; Godard, A.; Lefebvre, M. Multispecies transmitter for DIAL sensing of atmospheric water vapour, methane and carbon dioxide in the 2 μm region. SPIE Remote Sens. Int. Soc. Opt. Photonics 2015. [Google Scholar] [CrossRef]
  14. Lambert-Girard, S.; Allard, M.; Piché, M.; Babin, F. Differential optical absorption spectroscopy lidar for mid-infrared gaseous measurements. Appl. Opt. 2015, 54, 1647. [Google Scholar] [CrossRef]
  15. Romanovskii, O.A.; Sadovnikov, S.A.; Kharchenko, O.V.; Yakovlev, S.V. Development of Near/Mid IR differential absorption OPO lidar system for sensing of atmospheric gases. Opt. Laser Technol. 2019, 116, 43–47. [Google Scholar] [CrossRef]
  16. Robinson, R.; Gardiner, T.; Innocenti, F.; Woods, P.; Coleman, M. Infrared differential absorption Lidar (DIAL) measurements of hydrocarbon emissions. J. Environ. Monit. 2011, 13, 2213–2220. [Google Scholar] [CrossRef]
  17. Veerabuthiran, S.; Razdan, A.K. LIDAR for detection of chemical and biological warfare agents. Def. Sci. J. 2011, 61, 241–250. [Google Scholar] [CrossRef]
  18. Han, G.; Xu, H.; Gong, W.; Liu, J.; Du, J.; Ma, X.; Liang, A. Feasibility study on measuring atmospheric CO2 in urban areas using spaceborne CO2-IPDA LIDAR. Remote Sens. 2018, 10, 985. [Google Scholar] [CrossRef] [Green Version]
  19. Xin, Y.J.; Dan, Z.Y.; Qin, W.; Bing, B.L.; Qiao, L.J.; Biao, C.W. Influence of surface reflectance and aerosol optical depth on performance of spaceborne integral path differential absorption Lidar. Chin. J. Lasers 2019, 46, 0910001. [Google Scholar]
  20. Gimmesead, G.G. Differential-absorption Lidar for ozone and industrial emissions. Lidar 2005, 102, 187–212. [Google Scholar]
  21. Refaat, T.F.; Singh, U.N.; Petros, M.; Remus, R.; Yu, G. Self-calibration and laser energy monitor validations for a double-pulsed 2-μm CO_2 integrated path differential absorption lidar application. Appl. Opt. 2015, 54, 7240–7251. [Google Scholar] [CrossRef] [PubMed]
  22. Xu, L.; Bu, L.B.; Cai, H.Z.; Sa, R.; Zhou, J. Wavelength selection and detection capability simulation of the mid-infrared DIAL for NO2 detecion. Infrared Laser Eng. 2018, 47, 1030002. [Google Scholar]
Figure 1. (a) Schematic diagram of differential absorption lidar system; (b) Photograph of the 1064 nm Nd: YAG laser; (c) Photograph of DIAL.
Sensors 20 02211 g001
Figure 2. (a) Absorption line of NO2 near 3.4 μm; (b) Normalized laser spectrum of λoff; (c) Absorption spectral lines after convolution correction.
Sensors 20 02211 g002
Figure 3. The schematic diagram of the calibration experiment.
Sensors 20 02211 g003
Figure 4. Corrected detector signals from the atmosphere and hard target background condition.
Sensors 20 02211 g004
Figure 5. (a) Result of NO2 calibration experiment; (b) Result of SO2 calibration experiment.
Sensors 20 02211 g005
Figure 6. (a) Schematic diagram of open field gas measuring experiment; (b) Photograph of open field gas measuring experiment.
Sensors 20 02211 g006
Figure 7. (a) Average concentration of NO2; (b) Average concentration of SO2.
Sensors 20 02211 g007
Figure 8. Average concentration of NO2 with board as the hard target.
Sensors 20 02211 g008
Table 1. Main Performance Parameter of the lidar.
Typical ParameterValue
Wavelength λ on/   λ off(NO2)3424.5/3405 nm
λ on/   λ off(SO2)3988.9/3940.0 nm
λ on/   λ off(NO)2657.4/2630.4 nm
Pulse energy0.14 mJ/0.12 mJ
Pulse duration20 ns
Pulse Linewidth0.02 nm(on)/10 nm(off)
Pulse rate (on/off)250 Hz/250 Hz
Sampling rate60 MHz
Sampling digit16 bit
Detector bandwidth 5 MHz
Detector sensitivity6.5 × 104 V/W
Detector spectral response range2.5–4.5 μm

