1. Introduction
This work is designed as a brief disclosure of a significant new application of previous work on Quantum Strategic Organizational Design (QSOD) [
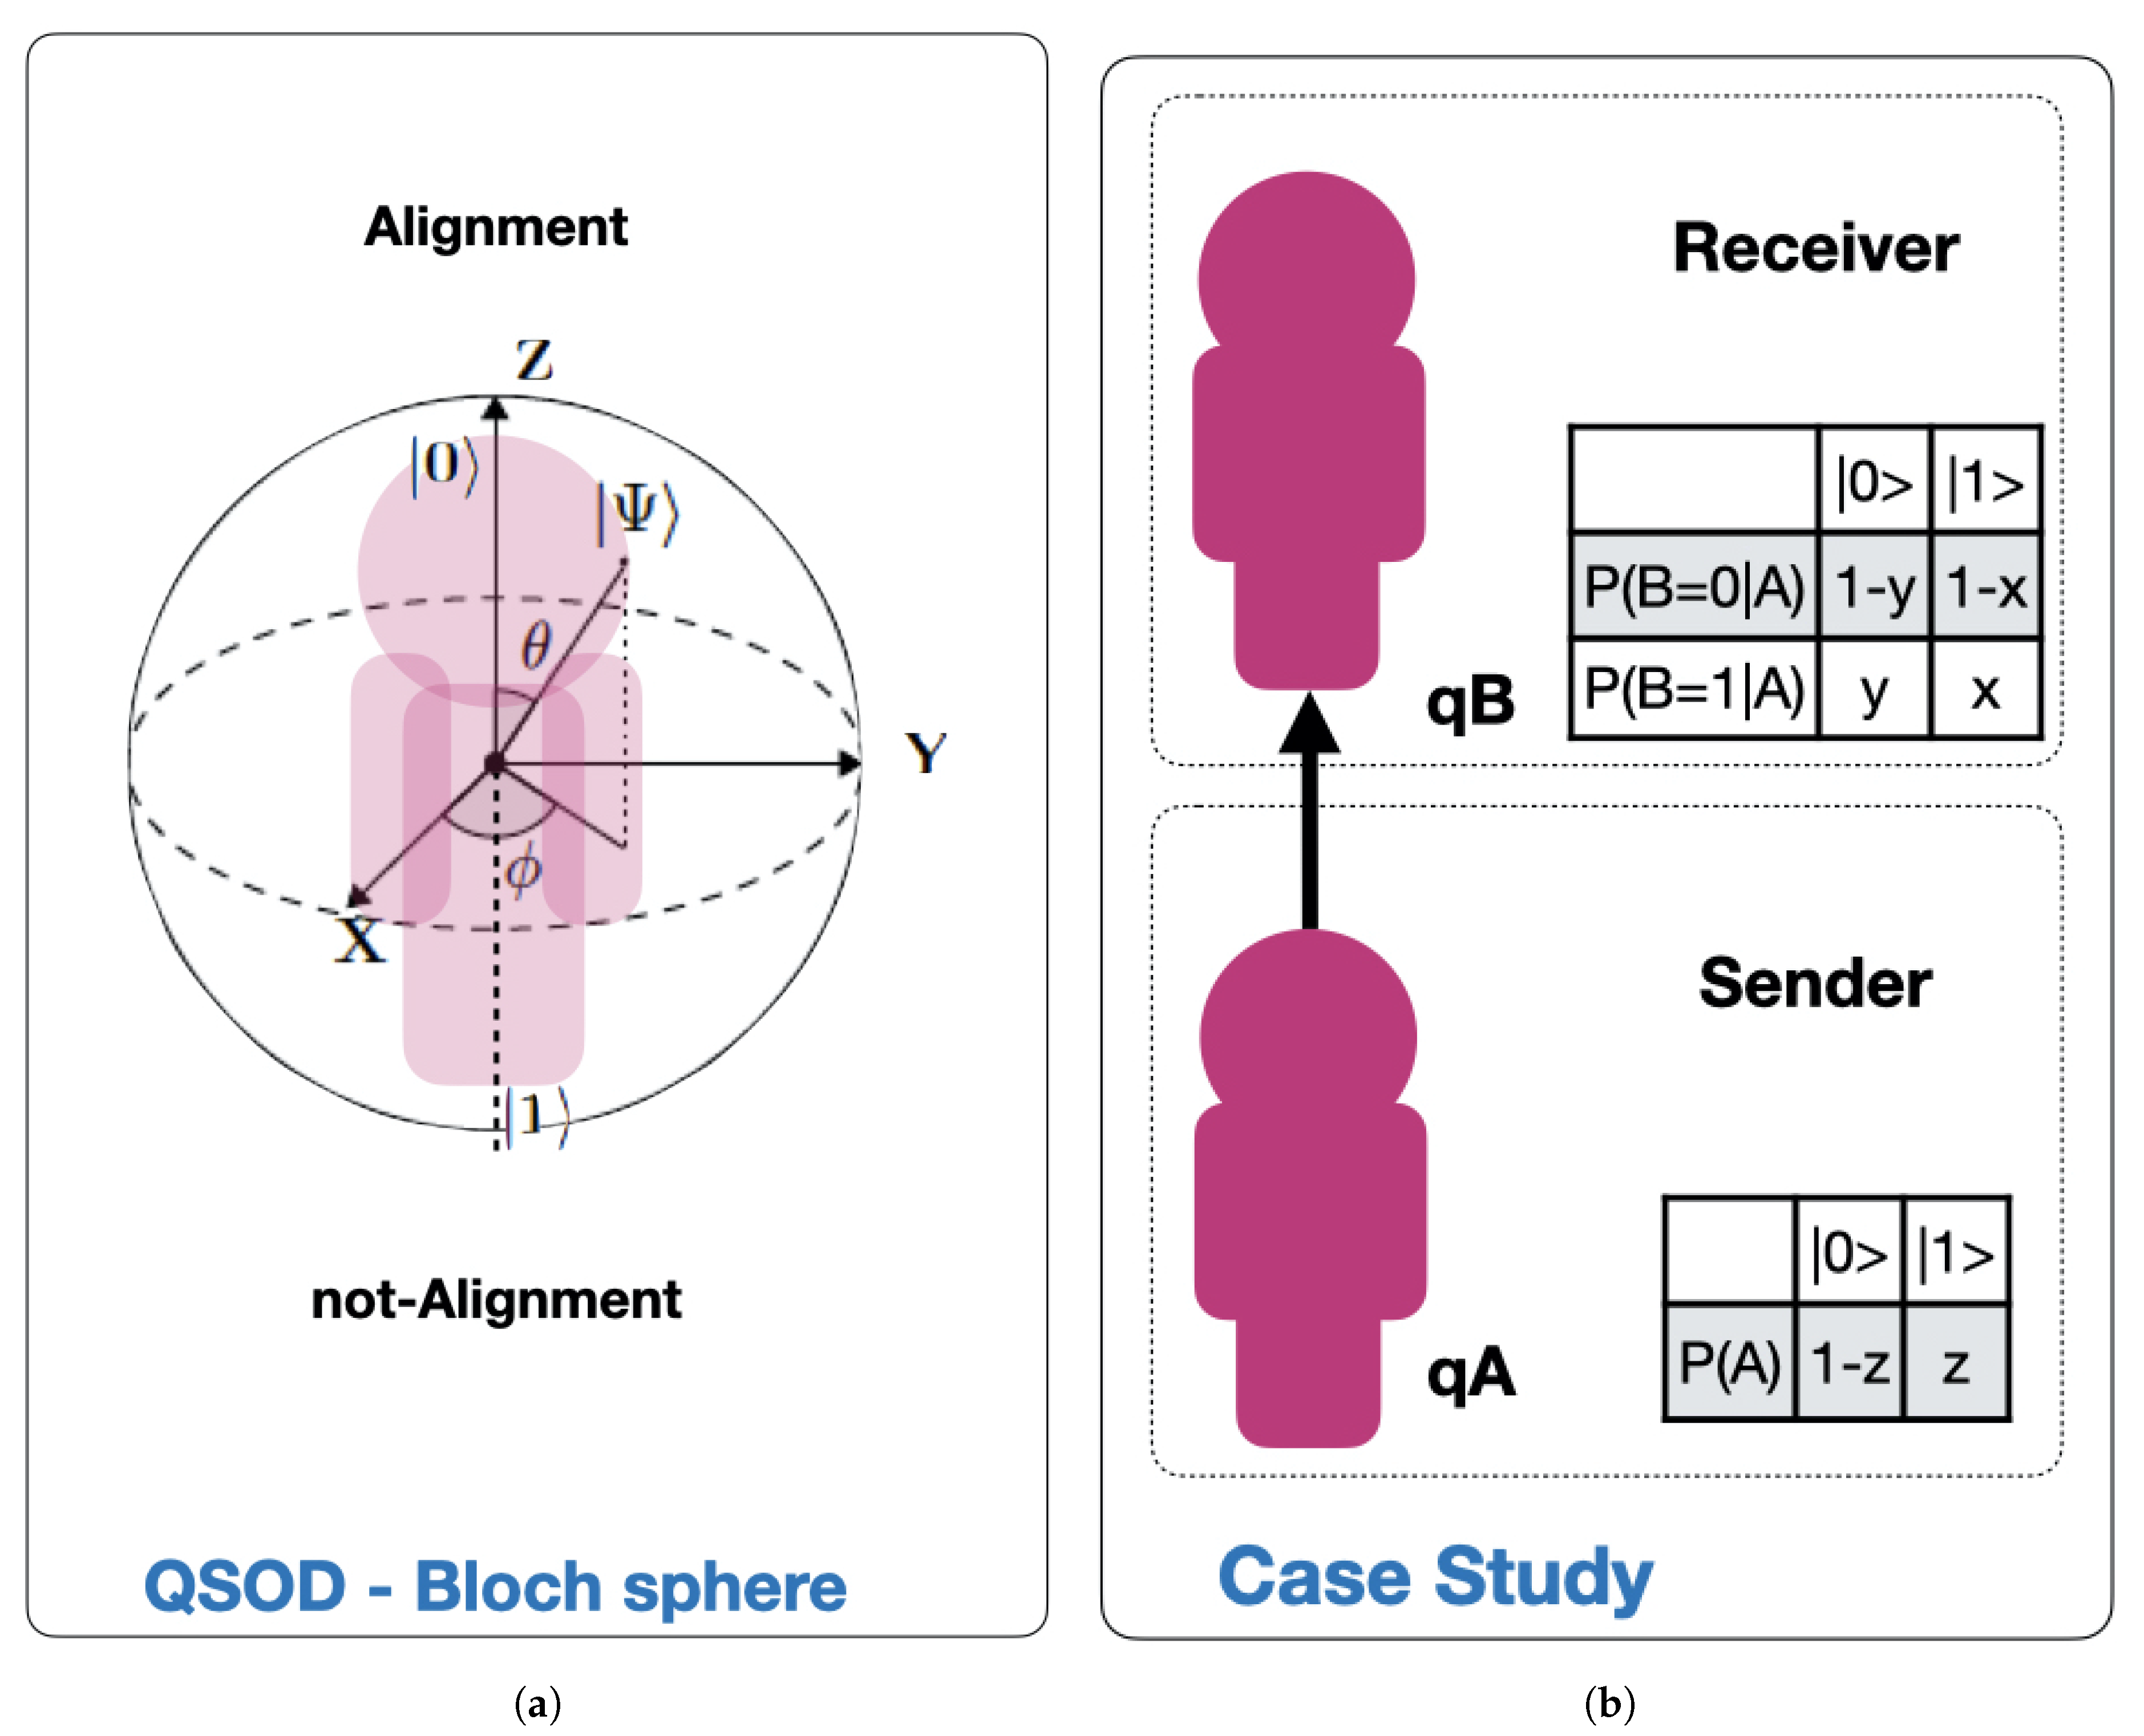
1], which the interested reader should refer to as a framework. Within this framework, QSOD makes the real-time simulation of organizational alignment states of complex systems in Industry 4.0 possible. QSOD’s simulation as decision networks and their equivalent quantum circuits undoubtedly opens a wide field of possibilities for the study of the design of complex networked strategic organizations. As represented schematically in
Figure 1a, in the mentioned work we represented the individual process owner, the node of a complex network of Industry 4.0 represented in the form of a decision graph [
2], as a quantum computing unit or
qubit [
3,
4]. This
qubit is allowed to have two fundamental states, one of alignment or asymptotic stability of the key performance indicators (KPIs) defining its performance [
5,
6,
7,
8,
9,
10,
11,
12,
13], represented by the state
and another of non-alignment, absence of such stability, represented by the state
. In this paper we intend to expand this study, taking the simplest case of two organizational agents, a subordinate
A reporting to another agent
B represented in
Figure 1b, that will be simulated by means of a two-
qubit quantum circuit.
Bloch’s sphere, shown in
Figure 1a, is commonly used to geometrically represent a
qubit [
14]. This is a useful and common geometric image of the quantum evolution of a single- or two-level system. On the Bloch sphere, of unitary radius, the
Z-axis is the computational axis and its positive direction coincides with the state
, and the negative with the state
. A
qubit can be represented as a point on the Bloch sphere with the help of two parameters (
,
), as expressed by Equation (
1):
Our goal is to determine the probability of alignment of agent B, , as a function of the alignment probability of agent A, given by , and the conditional alignment probabilities between agents A and B, given by and . This is achieved through the simulation of more than 500 different quantum circuit configurations in which the relative alignment probabilities vary and is measured. In this work we present relevant conclusions about the alignment probabilities of the higher hierarchy agent depending on the alignment state of the leadership relationship.
The rest of the work hereinafter continues as follows: first,
Section 2 begins with a description of the configuration of the quantum circuit computations necessary to simulate the outlined two-
qubit organizational design configuration. Second,
Section 3 presents the case study that will simulate numerous quantum circuits, varying the mentioned parameters in order to obtain an optimal configuration of them. Third, in
Section 4 we discuss the results obtained and propose an interpretation in the perspective of previous studies and of the working hypotheses. Finally, in
Section 5 we discuss the findings and their implications in a broad context, and future research directions and limitations are highlighted.
2. QSOD Circuit—Two-Qubit Organizational Design Configuration
In this case, two
qubits are utilized, and therefore their aggregated state can be determined utilizing the tensorial product of the individual
qubits. The multiple
qubit state can be expressed as a linear combination of the
and
states, then the aggregated state can be represented as in Equation (
2):
where
,
and
.
Our initial hypothesis is that there is much intrinsic value for any organizational leader in Industry 4.0, to know their alignment status with the company’s strategic objectives. Moreover, not only it is important for them to know, but the company has a great interest in having its leaders aligned with its strategic objectives, since this is expected to increase its overall organizational efficiency and effectiveness. We focus on finding answers to the question of how to maximize the probability of alignment of agent
B,
, depending on agent
A’s individual no-alignment probability,
, and the relative probability of alignment between the two agents,
and
. Mathematically speaking, we intend to find the values of
that maximize the function
. In other words, our challenge reduces to finding the values of
that maximize Equation (
3):
Based on the principles of quantum circuit design that model decision networks presented in [
1], the quantum circuit that models the interactions presented by
Figure 1b translates into the quantum circuit Equation (4).
This circuit presents two
qubits , with rotation angle
and initial state
, and
with rotation angles
,
and initial state
. The respective interpretation of these rotations and the equations to calculate them are described in
Table 1.
3. Case Study
In the case study we proceed, as announced, to simulate a total of 500 configurations of the circuit shown in Equation (4). We intend to find the values of parameters
that maximize the probability of alignment of the agent
B,
. To do this, the parameters
are varied in 10% incremental intervals in order to make a uniform mapping and create a proper display of the results. However, not all
values are relevant. We are interested in values of
, since they indicate that the alignment probability of the agent
A,
, is greater than or equal to 50%. In other words it is equal to or better than a random process. We map the values
, thus generating 500 simulations, each with a run of 3.5 s, giving a total computation time of 1750 s. The circuits were simulated on
qiskit tool, a Python-based [
15] quantum computing platform developed by IBM [
16], and the code and results can be accessed in this
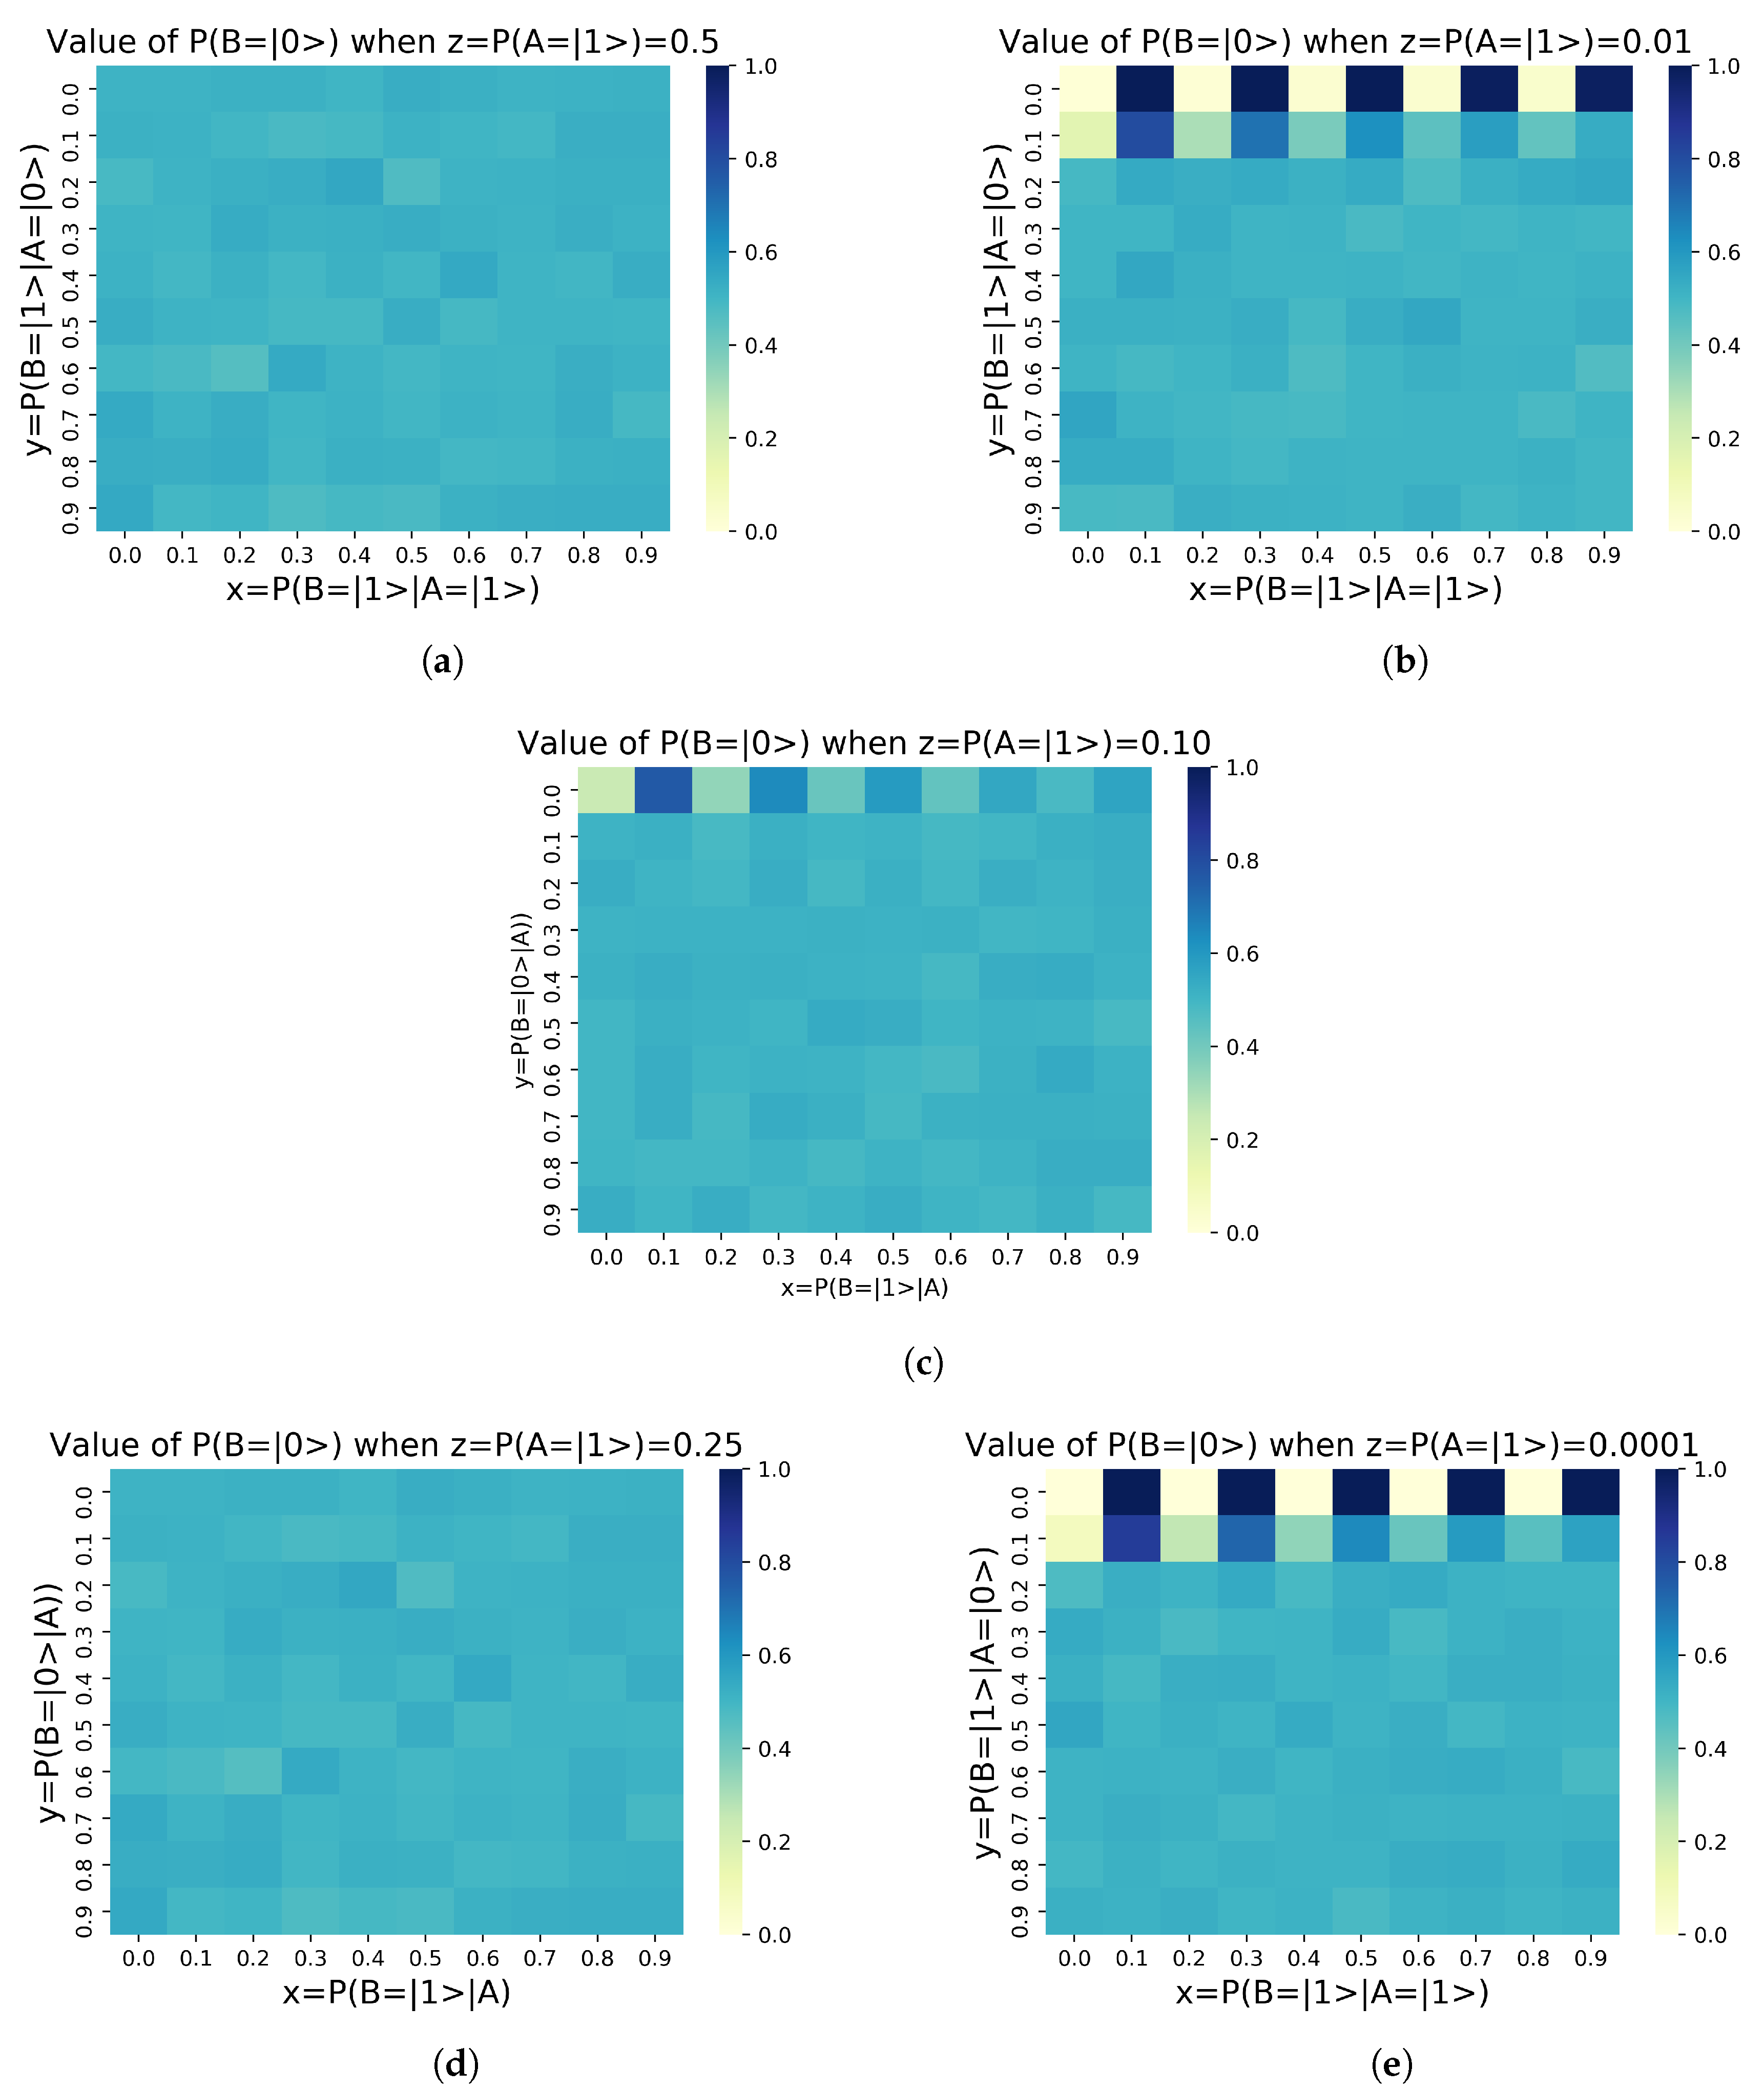
Open Access Repository. We summarize the obtained results in
Figure 2 by representing
as a function of
.
These results can be interpreted as follows:
Figure 2a describes the alignment state of agent B,
, for different values of conditioned alignment probability between agents
A and
B,
, being the alignment probability of agent
A =
= 50%.
Figure 2b describes the alignment state of agent B,
, for different values of conditioned alignment probability between agents
A and
B,
, being the alignment probability of agent
A =
= 75%.
Figure 2c describes the alignment state of agent B,
, for different values of conditioned alignment probability between agents
A and
B,
, being the alignment probability of agent
A =
= 90%.
Figure 2d describes the alignment state of agent B,
, for different values of conditioned alignment probability between agents
A and
B,
, being the alignment probability of agent
A =
= 99%.
Figure 2e describes the alignment state of agent B,
, for different values of conditioned alignment probability between agents
A and
B,
, being the alignment probability of agent
A=
= 99.99%.
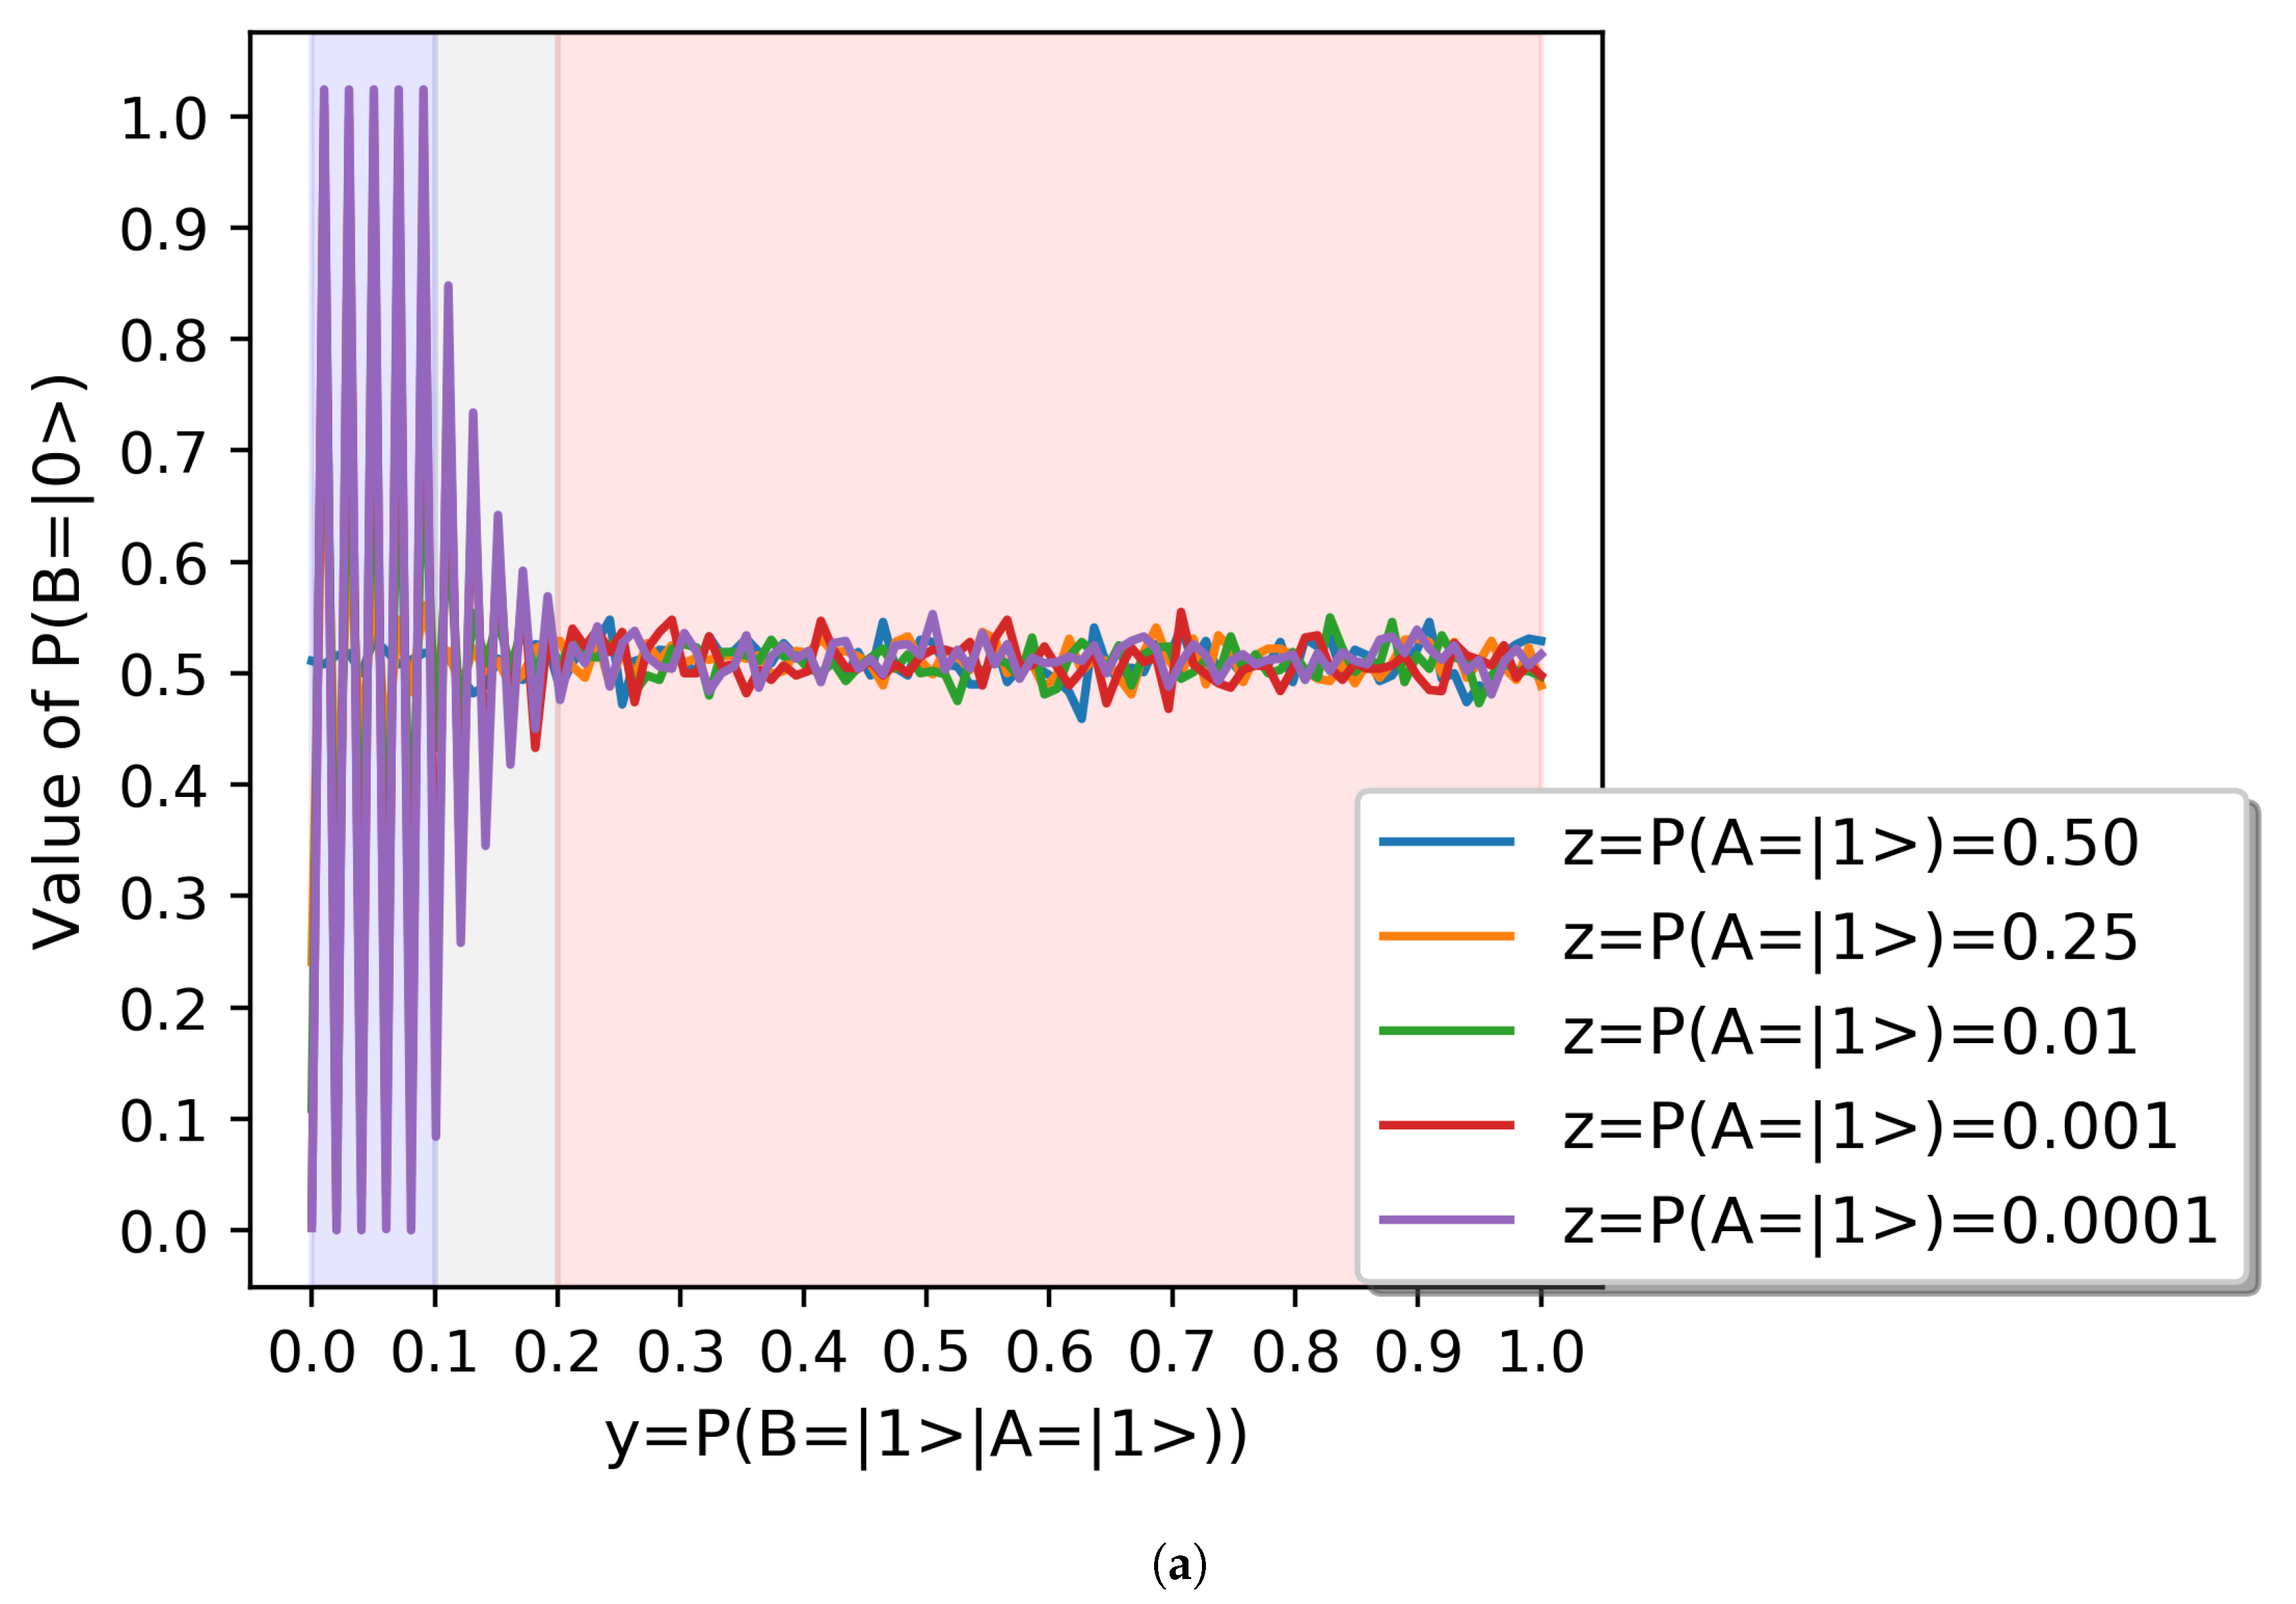
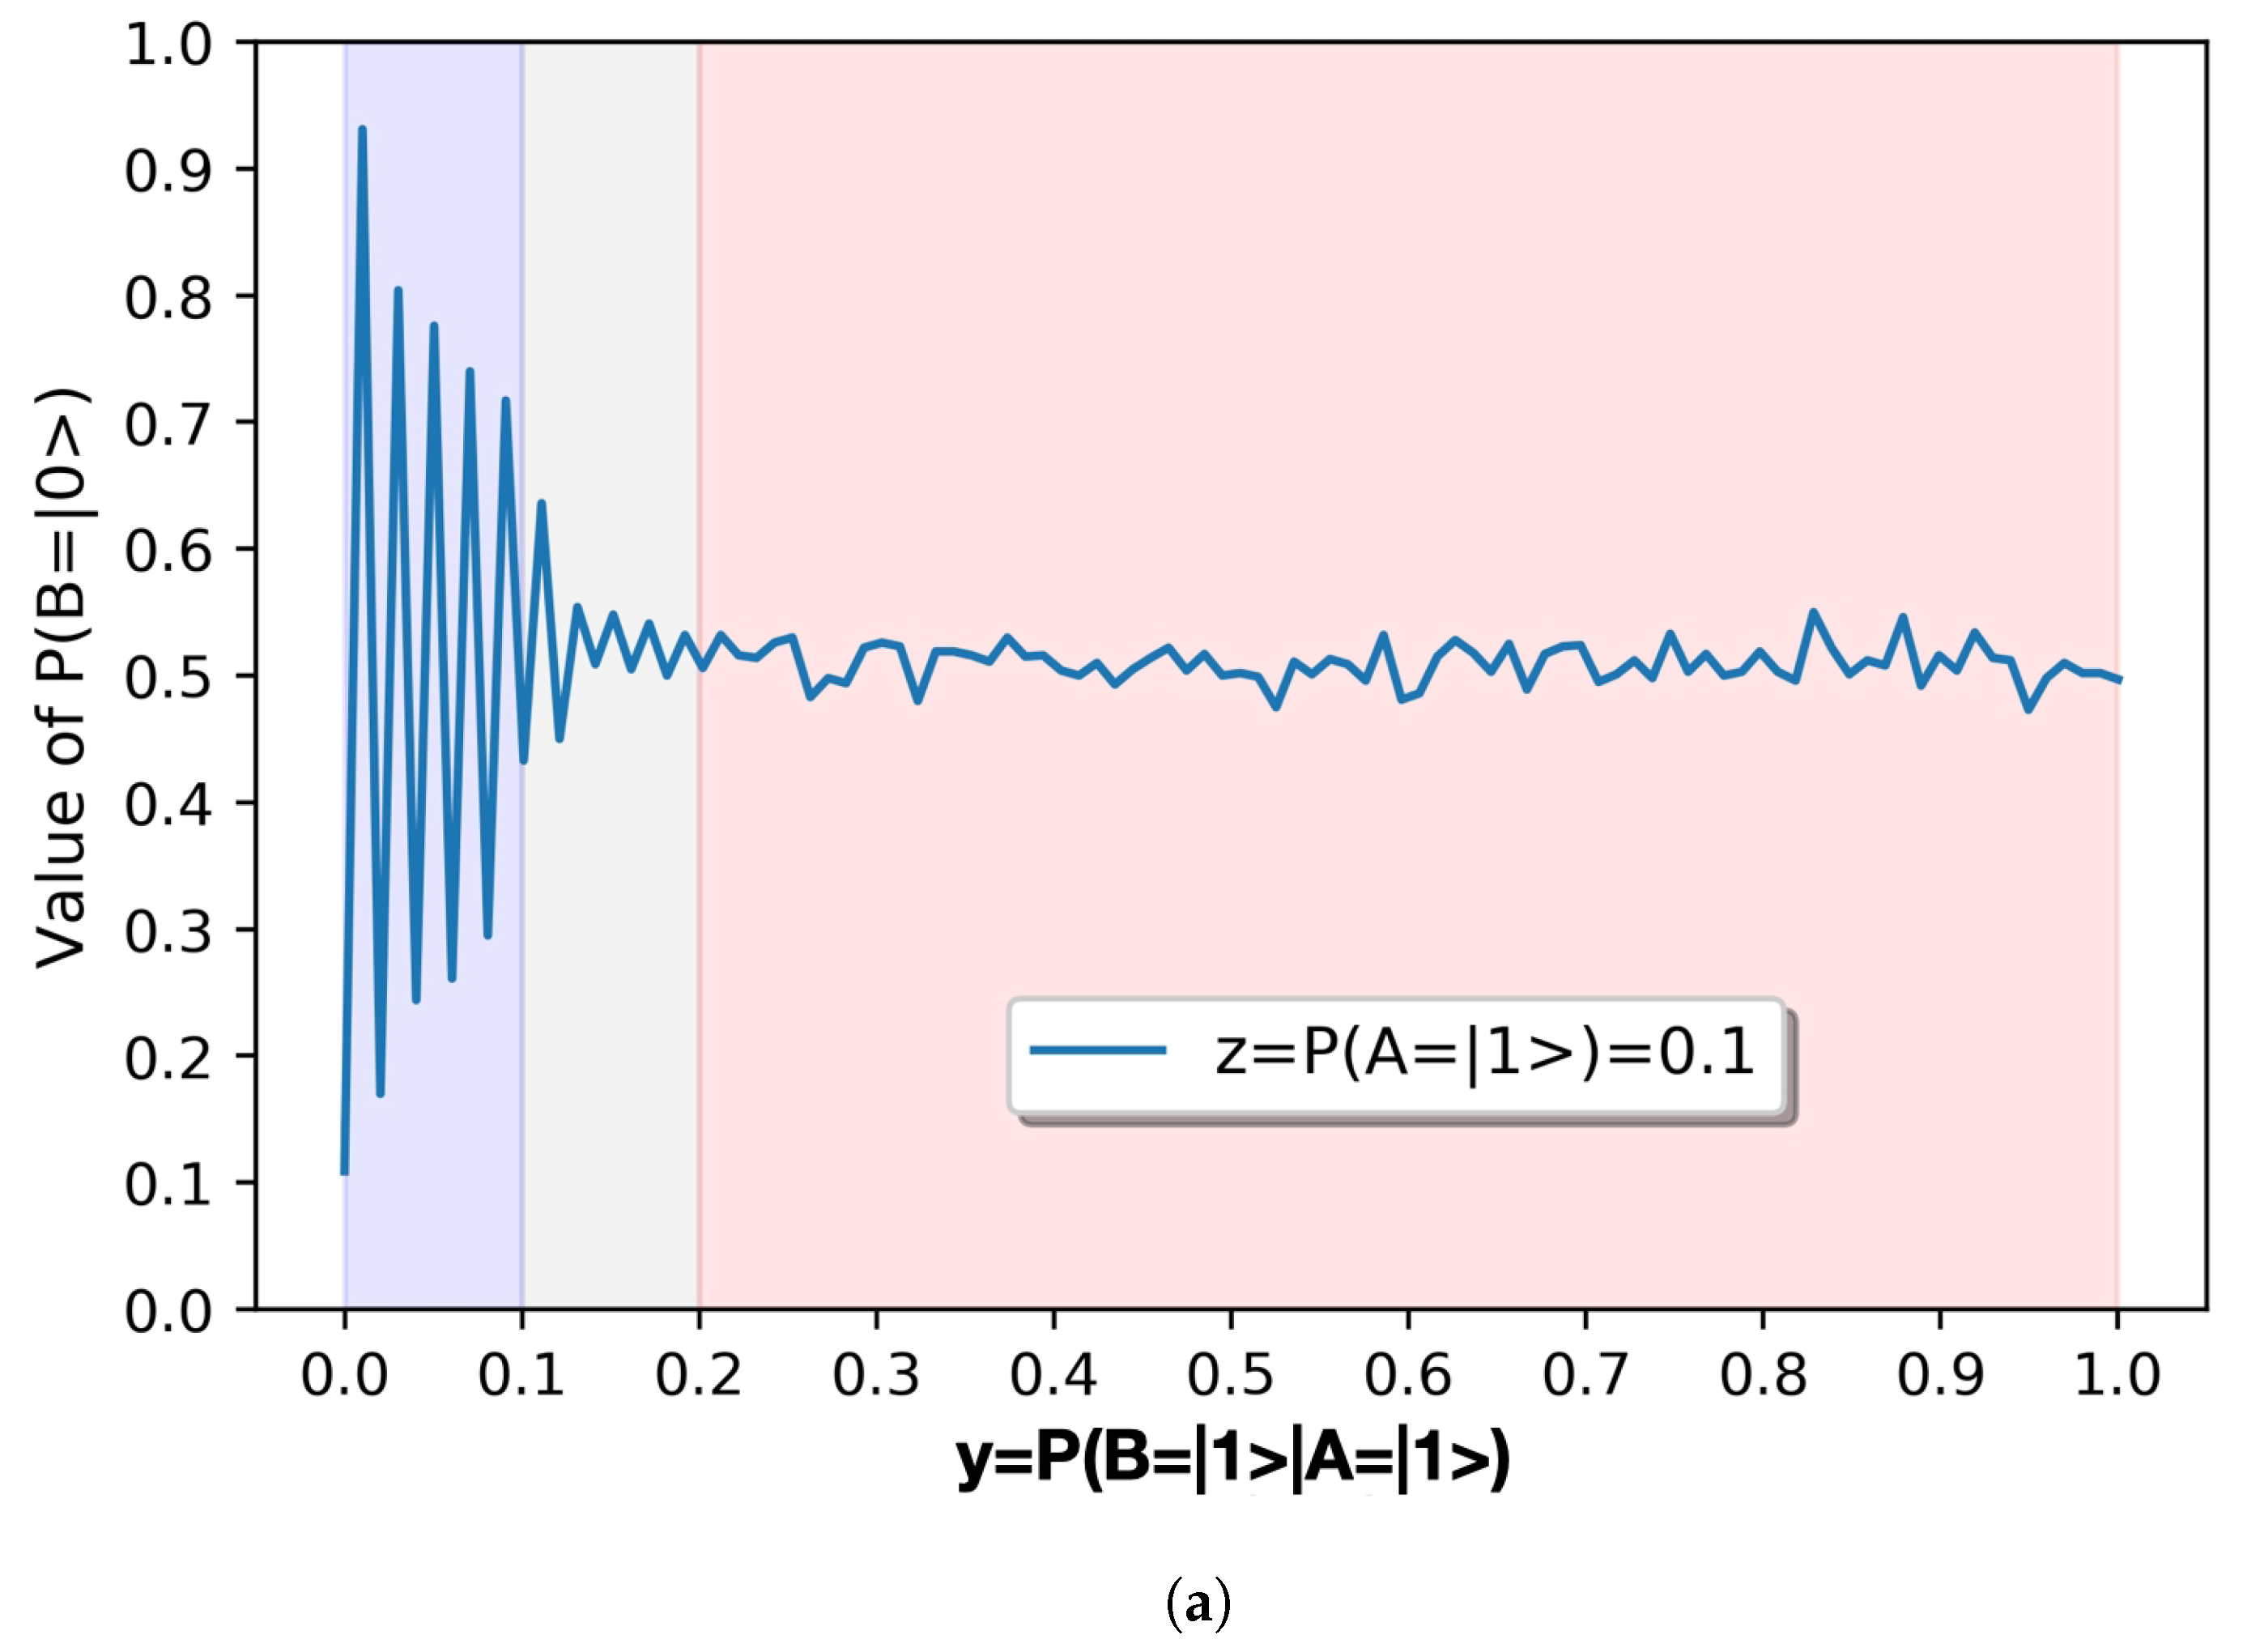
We can intuitively observe in
Figure 2 that the first partial derivatives of the two dimensional functions
with changing
and with
, given respectively by
and
. We represent the values of
as a function of
in
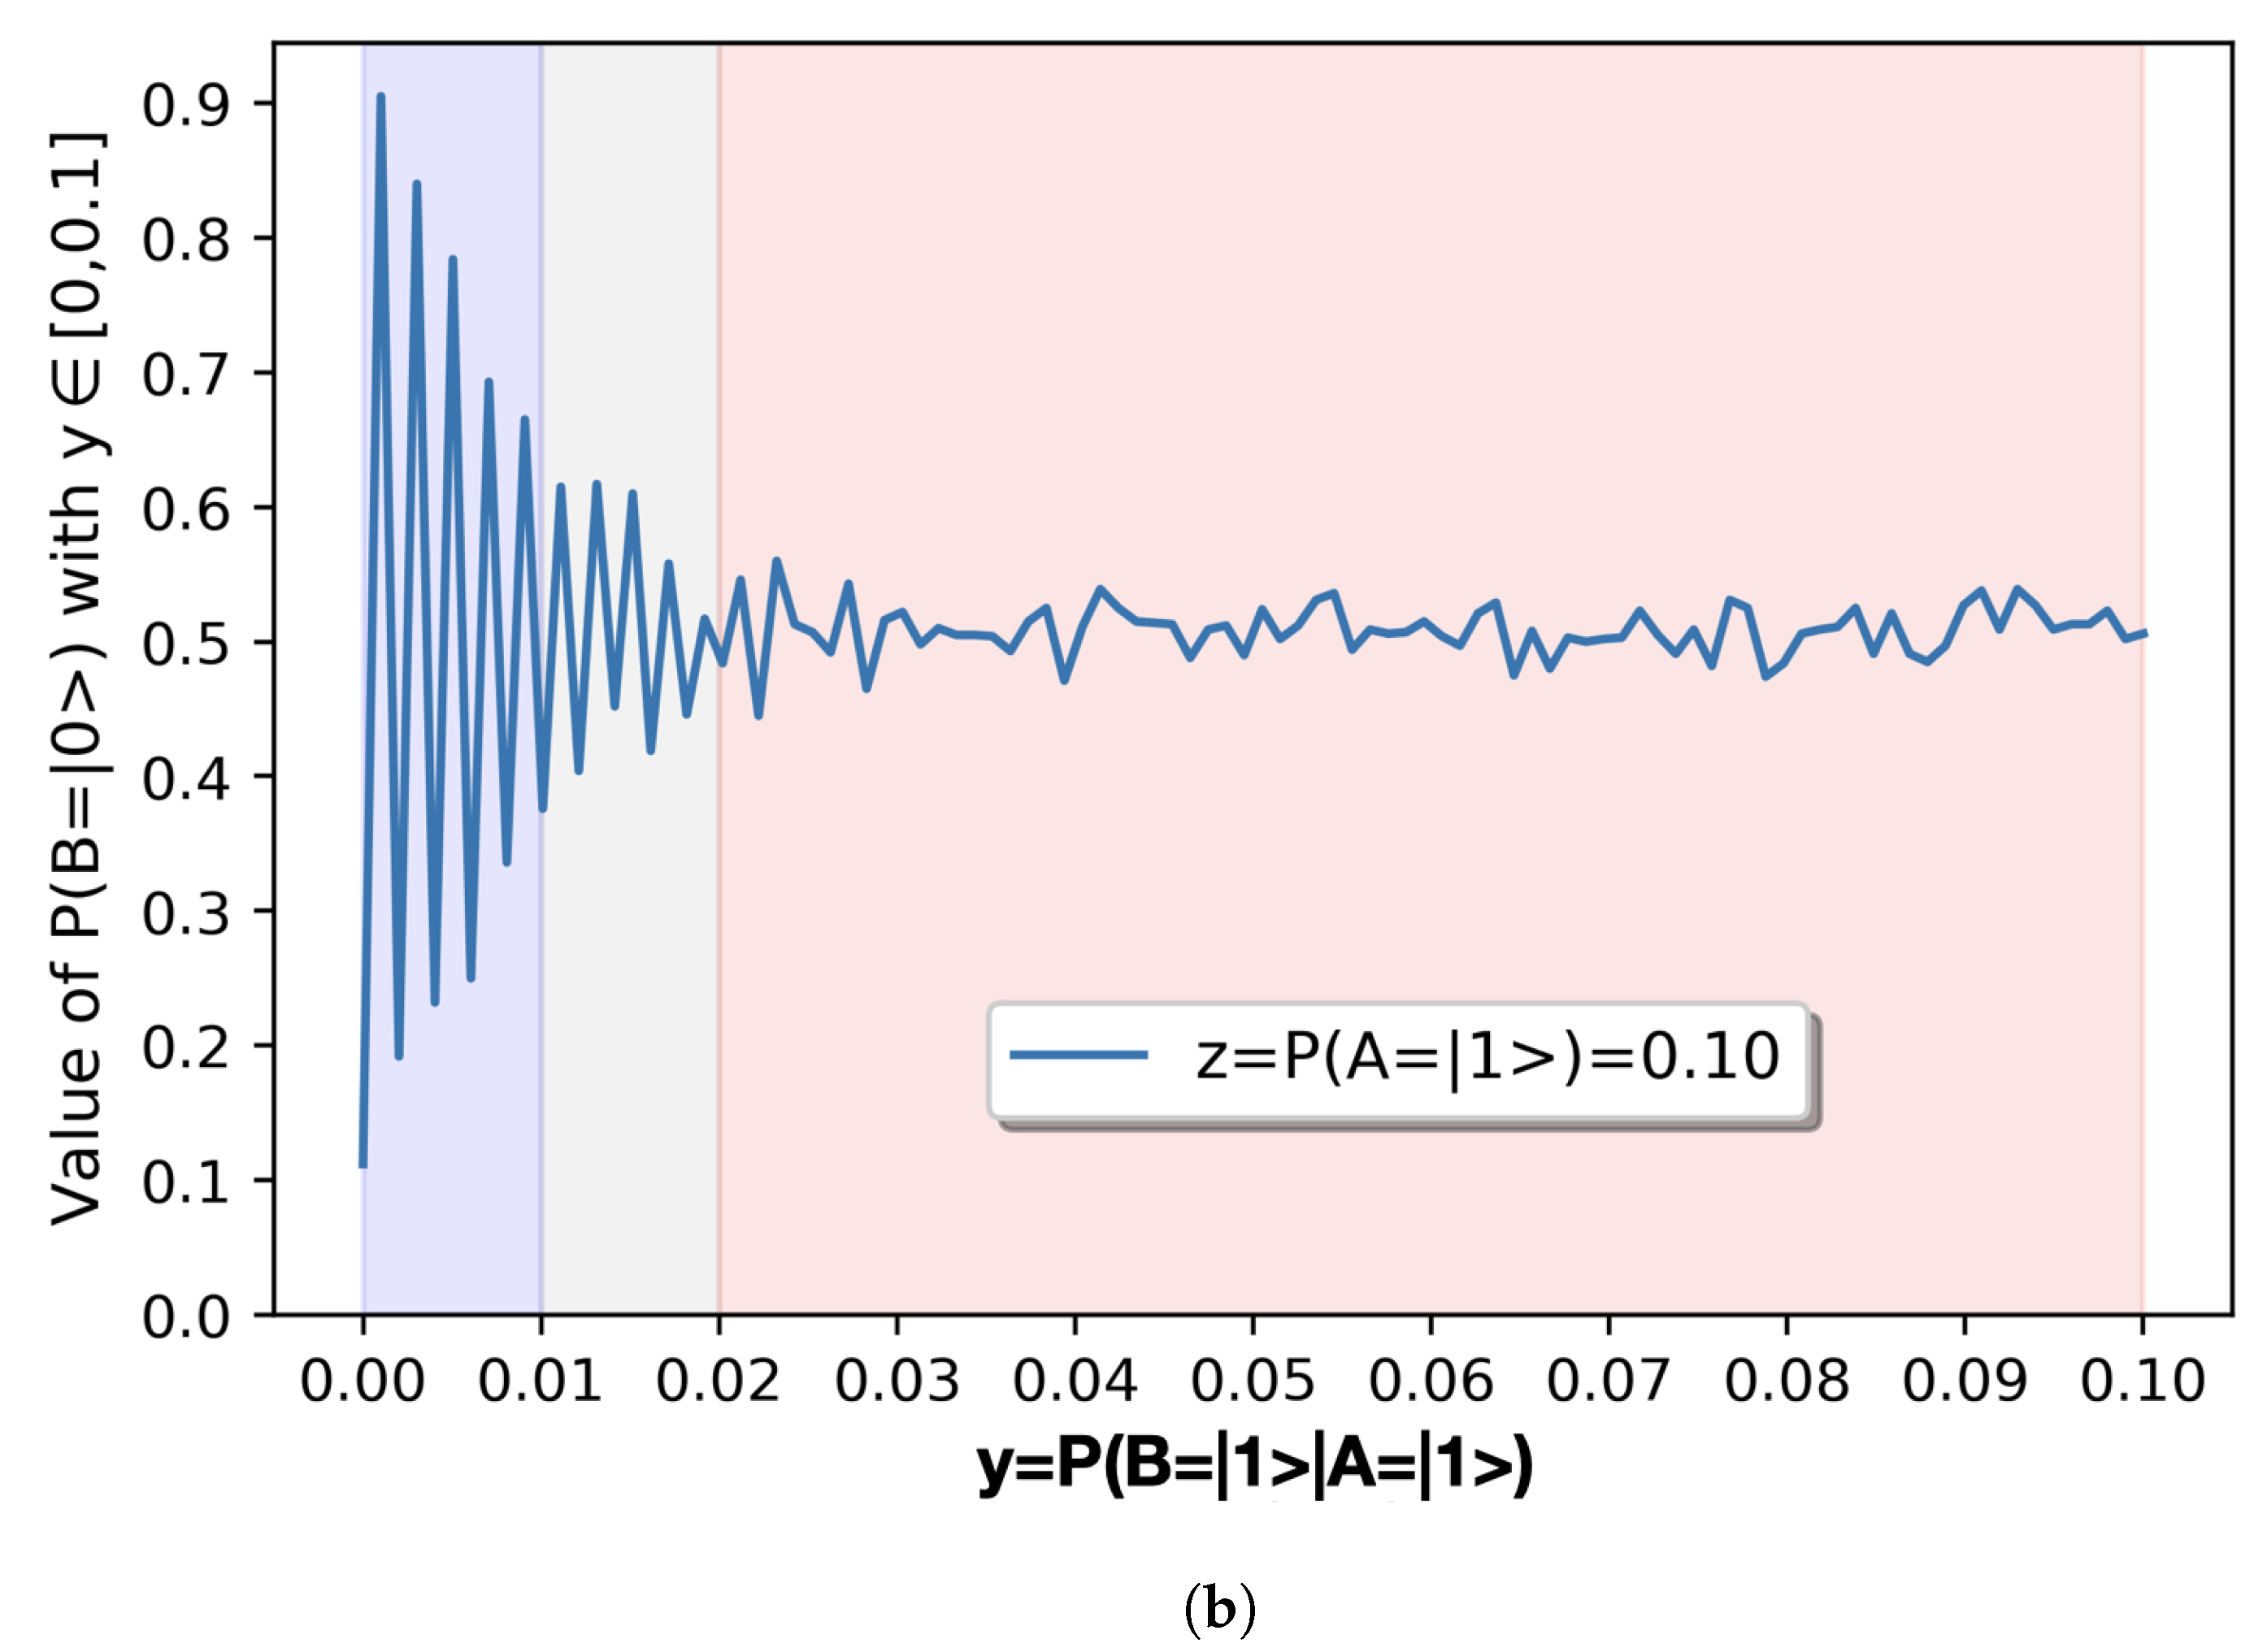
Figure 3a. As we indicate in
Figure 3b, each [0.1] interval of interval of
contains ten values of
.
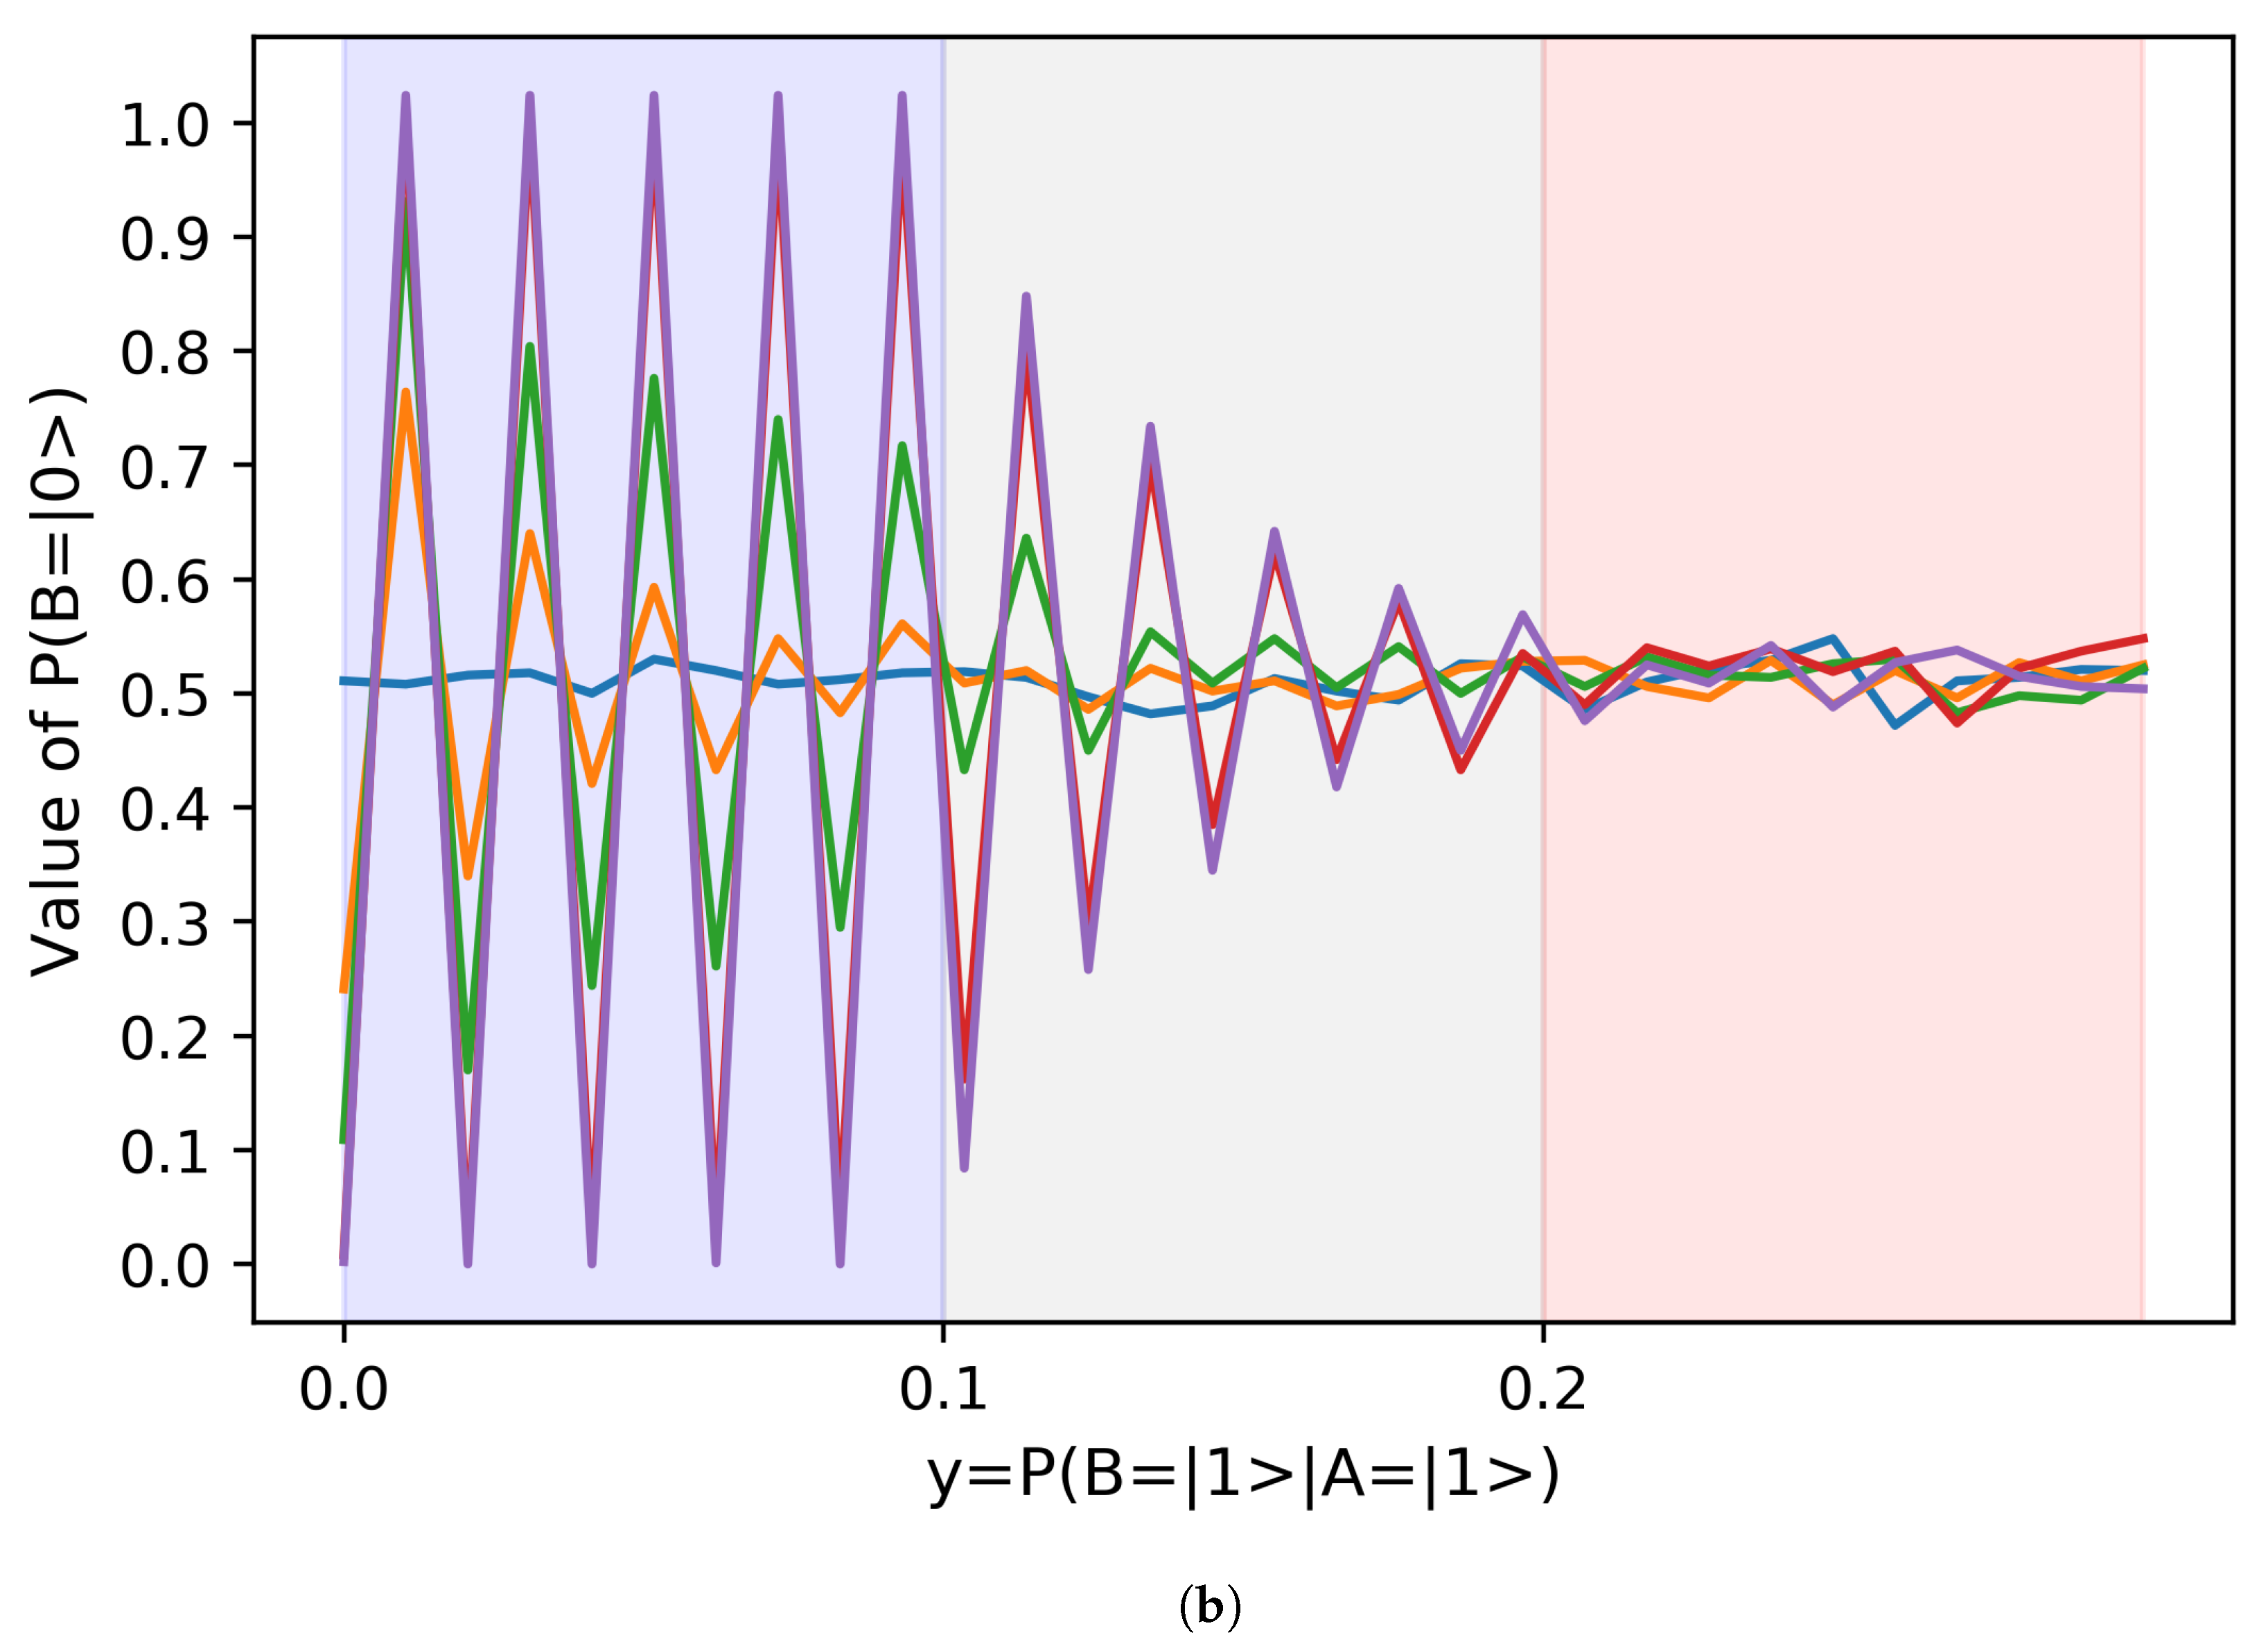
If we increase the granularity of the mapping of the quantum circuits in search of a fractality within their behavior, and we make a mapping of the
for values of
, then we obtain the results of
Figure 4b. Similarly as in the previous diagrams, each [0.01] interval of
contains ten values of
for values of
.
In the following
Section 4 we discuss these results in detail.
4. Discussion
We will now proceed to discuss the results
R systematically. We will begin by discussing
Figure 3, which describes the change in the alignment probability of the agent
B described by the function
, with increasing values of the relative alignment probability of B, depending on A, given by
. Before we do so, a gentle reminder for the reader that taking into consideration Bayes’s theorem, this probability can be expressed with Equation (
5):
This means that growing values of the relative probability of agent B alignment, conditioned to agent A being in not-alignment, are caused by growing values of the intersection . In other words, increasing values of the counter express that the probability of the intersection of and is high and therefore both present similar states.
Accordingly, the following results can be enumerated:
R1. In general, we can say that the probability of alignment of agent B, , oscillates consistently around the value 0.5 as a harmonic underdamped oscillator for different values of , which is the equilibrium state of the system. This is plausible.
R2. At the scale represented in
Figure 3a we observe that the angular frequency of this oscillator changes for different values of
and therefore we can separate the behavior of the function in three different regions, marked in
Figure 3a, and depicted in
Figure 3b in detail.
R3. For values of , the probability of alignment of agent B, , oscillates consistently around 0.5 with a minimal amplitude for all values of .
R4. For values of , the probability of alignment of agent B, , oscillates consistently around 0.5 with an exponential decay that consistently increases with .
R5. For values of , the probability of alignment of agent B, , oscillates consistently around 0.5. The oscillation presents an exponential decay for , and presents no decay for values of .
R6. However, the most striking observation of all is that if we increase the mapping of the circuits by a factor of 10, as shown in
Figure 4b in which we make a mapping of the
with [0.01] intervals for
, we observe the same behavior as with the mapping of the
with [0.1] intervals for
shown in
Figure 4a. The results
R1–
R5 are valid for both mapping intervals. The parameters (exponential decay, displacement, amplitude, and phase) of the signals represented in
Figure 4 are very similar. Only the frequency is inversely proportional to the mapping interval, hence scaling the oscillation shape, and suggesting that the two graphics depict a similar process. This means that the behavior of this system is fractal. This has powerful implications, which we discuss in the conclusions.
In the following
Section 5 we offer the conclusions derived from these results, we discuss the findings and their implications in a broad context, offer certain limitations of the study, and present possible next research paths to pursue.
5. Conclusions, Limitations and Further Steps
Quantum computing explores the processing and exchange of information as natural phenomena that respect the laws of quantum mechanics. The reason for this is that quantum computing makes use of “superposition”, which is the ability of quantum computers to simultaneously be in multiple different states. Leading an organizational effort to achieve coordinated strategic goals is a probabilistic process in which the decision makers can rarely be sure that the choice made is the right one. Managers are conditioned by the simultaneous decisions of other agents in the organization whose consequences cannot be fully anticipated a priori. The purpose of this work has been to propose an efficient quantum computing algorithm that is capable of discerning the state of alignment of the organization in the interaction of one process owner informing another and, therefore, supporting the leaders of the organizations in their decision-making process.
We can summarize the main takeaway of this study with the following statement: the case of two qubits shown by QSOD, allows us to affirm that when the strategic objective of the organizational design is to increase the alignment of a process owner, increasing the network by adding a support agent is most likely to have no effect at all on the performance of the agent being reported to. We learn this from R1. In fact, the probability of alignment of the original agent always oscillates around the random state.
From result R2, R3, R4, and R5 we also observe that there is an exchange of energy between the original agent and the added agent, so that the alignment probability of the original agent can be positively influenced for low levels of intersection between the alignment probability of the original agent and the added agent. This could be interpreted to mean that the original agent can benefit from the presence of its new partner as long as the new partner provides process information. In other words, if the added agent is able to explain some of the variability in the value creation process that could not previously be explained by the original agent, then the asymptotic stability probability of the original agent will increase. The immediate consequence of this reading is that to add hierarchy levels to strategic design models of organizations, it is necessary to ensure the asymptotic stability of the lower agents before implementing a stable aggregation. It is important to highlight at this point that, in the context of QSOD, a hierarchy does not only describe the rather classical hierarchical relationship between agents but rather a reporting relationship. This concept is more inclusive as it includes the relationship between an agent and his/her boss, but also the relationship between an agent and his/her customer, or the relationship between an agent and a supplier. Our work helps, therefore, model interactions between organizational process owners and these interactions can potentially be scaled to any organizational context, including small and medium enterprises. This finding is very powerful for industry leaders, as well as for Strategic Organizational Design scholars because it imposes a severe constraint to ensure a sustainable and stable growth of Industry 4.0 organizations.
The implications of result R6 are profound and reveal the essence of what some call the fractal organization. The interaction of two process owners reveals an energy interchange that oscillates with more or less amplitude depending on certain parameters—the conditional alignment probabilities. However, what is really striking is that, independently of the granularity in which these parameters are observed, the oscillation always follows the same pattern. Such pattern is expressed by the results R1–R5 and represents the cornerstone of the bilateral interaction under study. Fractality in this QSOD context allows for a quantification of these complex dynamics and its pervasive effect offers robustness and resilience to the two-qubit interaction.
The main limitation of this study is that it only refers to two agents. Furthermore, the simulations of the quantum circuits have been made in a classic computer simulator. Although this undoubtedly reduces some statistical significance to the results, this fact is not relevant to our study at this time and can be neglected.
The results obtained studying the QSOD case of two qubits opens new interesting research questions. In order to continue offering a valuable contribution to Industry 4.0 leaders and the research community in general, the future steps we intend to take in this line of research will focus on studying the behavior of other more complex QSOD configurations.
Author Contributions
Conceptualization, J.V.-D.; methodology, J.V.-D.; software, J.V.-D.; validation, J.V.-D., R.M.B. and J.C.L.; formal analysis, J.V.-D.; investigation, J.V.-D.; resources, R.M.B. and J.C.L.; data curation, J.V.-D.; writing—original draft preparation, J.V.-D.; writing—review and editing, R.M.B. and J.C.L.; visualization, J.V.-D.; supervision, R.M.B. and J.C.L.; project administration, R.M.B. and J.C.L.; funding acquisition, J.V.-D. All authors have read and agreed to the published version of the manuscript.
Funding
J.V.D. would also like to acknowledge the Spanish Agencia Estatal de Investigacion, through research project code RTI2018-094614-B-I00 into the “Programa Estatal de I+D+i Orientada a los Retos de la Sociedad”. This work was also partially supported by the Ministerio de Ciencia, Innovación y Universidades under Contract No. PGC2018-093854-B-I00.
Conflicts of Interest
The authors declare no conflict of interest.
Abbreviations
The following abbreviations are used in this manuscript:
| QSOD | Quantum Strategic Organizational Design |
| KPI | Key Performance Indicators |
References
- Villalba-Diez, J.; Zheng, X. Quantum Strategic Organizational Design: Alignment in Industry 4.0 Complex-Networked Cyber-Physical Lean Management Systems. Sensors 2020, 20, 5856. [Google Scholar] [CrossRef] [PubMed]
- Nielsen, T.D.; Jensen, F.V. Bayesian Networks and Decision Graphs, 2nd ed.; Springer: New York, NY, USA, 2009. [Google Scholar]
- Nielsen, M.A.; Chuang, I. Quantum Computation and Quantum Information; Cambridge University Press: Cambridge, UK, 2010. [Google Scholar]
- Piattini, M.; Peterssen, G.; Pérez-Castillo, R. Quantum Computing: A New Software Engineering Golden Age. SIGSOFT Softw. Eng. Notes 2020, 45, 12–14. [Google Scholar] [CrossRef]
- Villalba-Diez, J.; Ordieres-Mere, J. Improving manufacturing operational performance by standardizing process management. Trans. Eng. Manag. 2015, 62, 351–360. [Google Scholar] [CrossRef]
- Villalba-Diez, J.; Ordieres-Meré, J.; Nuber, G. The HOSHIN KANRI TREE. Cross-Plant Lean Shopfloor Management. In Proceedings of the The 5th Conference on Learning Factories, Bochum, Germany, 7–8 July 2015; Elsevier: Bochum, Germany, 2015. [Google Scholar] [CrossRef]
- Villalba-Diez, J.; Ordieres-Mere, J.; Chudzick, H.; Lopez-Rojo, P. NEMAWASHI: Attaining Value Stream alignment within Complex Organizational Networks. Procedia CIRP 2015, 37, 134–139. [Google Scholar] [CrossRef]
- Villalba-Diez, J.; Ordieres-Mere, J. Strategic Lean Organizational Design: Towards Lean World-Small World Configurations through Discrete Dynamic Organizational Motifs. Math. Probl. Eng. 2016, 2016, 1–10. [Google Scholar] [CrossRef]
- Jimenez, P.; Villalba-Diez, J.; Ordieres-Meré, J. HOSHIN KANRI Visualization with Neo4j. Empowering Leaders to Operationalize Lean Structural Networks. Procedia CIRP 2016, 55, 284–289. [Google Scholar] [CrossRef]
- Villalba-Diez, J. The HOSHIN KANRI FOREST. Lean Strategic Organizational Design, 1st ed.; CRC Press, Taylor and Francis Group LLC: Boca Raton, FL, USA, 2017. [Google Scholar]
- Villalba-Diez, J. The Lean Brain Theory. Complex Networked Lean Strategic Organizational Design; CRC Press, Taylor and Francis Group LLC: Boca Raton, FL, USA, 2017. [Google Scholar]
- Villalba-Diez, J.; Zheng, X.; Schmidt, D.; Molina, M. Characterization of Industry 4.0 Lean Management Problem-Solving Behavioral Patterns Using EEG Sensors and Deep Learning. Sensors 2019, 19, 2841. [Google Scholar] [CrossRef] [PubMed]
- Schmidt, D.; Villalba Diez, J.; Ordieres-Meré, J.; Gevers, R.; Schwiep, J.; Molina, M. Industry 4.0 Lean Shopfloor Management Characterization Using EEG Sensors and Deep Learning. Sensors 2020, 20, 2860. [Google Scholar] [CrossRef] [PubMed]
- Mosseri, R.; Dandoloff, R. Geometry of entangled states, Bloch spheres and Hopf fibrations. J. Phys. Math. Gen. 2001, 34, 10243–10252. [Google Scholar] [CrossRef]
- Van Rossum, G. Python Tutorial, Technical Report CS-R9526; Centrum voor Wiskunde en Informatica (CWI): Amsterdam, The Netherland, 1995. [Google Scholar]
- Wille, R.; Meter, R.V.; Naveh, Y. IBM’s Qiskit Tool Chain: Working with and Developing for Real Quantum Computers. In Proceedings of the 2019 Design, Automation Test in Europe Conference Exhibition (DATE), Florence, Italy, 25–29 March 2019; pp. 1234–1240, ISSN 1558-1101. [Google Scholar] [CrossRef]
| Publisher’s Note: MDPI stays neutral with regard to jurisdictional claims in published maps and institutional affiliations. |
© 2020 by the authors. Licensee MDPI, Basel, Switzerland. This article is an open access article distributed under the terms and conditions of the Creative Commons Attribution (CC BY) license (http://creativecommons.org/licenses/by/4.0/).


