1. Introduction
Vegetation has aesthetic, environmental, human health, and economic benefits in urban ecosystems. Trees play an integral role within the urban environment as oxygen producers, improving air quality, mitigating urban heat island effect, and raising property values [
1]. Tree species diversity is a vital parameter to characterize urban ecosystems. It is also becoming more and more important for sustainable urban planning. Therefore, spatially-explicit detailed tree species mapping is critical for understanding the value to ecological services, in addition to establishing policies for sustainable urban development [
2]. Traditional inventories of urban tree species derived from field surveys and manual interpretation of aerial photographs are costly, time-consuming, and lack the ability to cover large areas [
3]. Conversely, remote sensing methods, such as aerial and satellite imagery, can provide timely and detailed data at finer temporal and spatial scales at a lower cost than extensive field sampling. Initial attempts at tree species mapping were limited to broad vegetation coverage or single tree species over homogenous forest stands using moderate spectral and spatial resolution sensors (e.g., Landsat, MODIS, etc.). However, mapping individual tree species in a complex urban environment is challenging due to the fine scale of spatial variation and highly heterogeneous background.
Recently, enhanced remote sensing techniques and high spatial resolution satellite imagery (e.g., IKONOS, WorldView, GeoEye, Planet Labs) have expanded the ability to classify tree species in a complex urban environment [
4,
5]. Contrary to moderate spatial resolution satellite imagery, individual tree crowns can be distinguished in high spatial resolution imagery [
6]. While some of these satellite sensors (e.g., IKONOS, GeoEye) are capable of acquiring <3 m multispectral spatial resolution, they do not have the spectral range and spatial resolution necessary to discriminate the subtle difference in structural and chemical composition between tree species [
7]. Compared to the traditional four-spectral band IKONOS and GeoEye, the WorldView-2 (WV2) satellite (DigitalGlobe Inc., Westminster, CO, USA) launched in 2009 has eight spectral bands and a spatial resolution of 0.5 m in the panchromatic band and 2.0 m in the VNIR bands. The four additional bands (coastal, yellow, red-edge and near-infrared 2 bands) increase the ability to adequately distinguish tree species [
8,
9,
10]. The WorldView-3 (WV3) satellite was launched in August 2014 with a 16-band mode that consists of eight VNIR bands, similar to WV2, in addition to eight short-wave infrared (SWIR) bands that may enhance vegetation analysis. However, to our knowledge, no studies have demonstrated the benefits of SWIR bands in detailed mapping of urban tree species.
Airborne Light Detection and Ranging (LiDAR) systems provide highly accurate 3-dimensional (3D) information capable of measuring height, structural characteristics and other biophysical properties of vegetation. Individual or stand-level tree parameters, such as tree height, canopy density, canopy volume, crown shape/width, diameter at breast height (DBH) and Leaf Area Index, can be estimated through the combination of field data with 3D structural information ascertained from intensity/range of individual pulse returns recorded by LiDAR sensors [
11]. The structural information derived from LiDAR data can add another contributing dimension to remotely-sensed individual tree analysis, when combined with the biochemical and biophysical information extracted from spectral sensors [
3].
The effectiveness of any image classification depends on a variety of considerations, in conjunction with the selection of an appropriate classifier [
12]. Parametric classifiers like maximum likelihood classifier (MLC) are not suitable for urban tree species classification because of the highly complex image scenes and limitations when handling high dimensional, multi-source data [
13]. Over the past two decades, machine learning algorithms have been developed as a more accurate and efficient alternative to conventional parametric classifiers, when dealing with highly dimensional and complex image data. Popular non-parametric classifiers, such as Support Vector Machine (SVM) and Random Forest (RF), are appealing for image classification, as they do not rely on data distribution assumptions and generally produce higher classification accuracies [
14,
15]. SVM classifiers have proven to be effective in tree species classification [
16,
17,
18], along with RF classifiers [
11,
19].
As a subfield of machine learning, deep learning (DL), which attempts to model high-level abstractions in data using a hierarchal manner, has gained recent popularity in the remote sensing field for its ability to characterize complex patterns within imagery datasets. Similar to the function of the deep architecture of the human brain, deep learning algorithms formulate learning models that construct natural relationships between input and output data through deep architecture comprised of multiple layers of nonlinear transformation operations [
20]. Contrary to the popular object-based approach to individual tree species classification, deep learning eliminates the hand-crafted feature extraction step, by examining the local spatial arrangement and structural patterns characterized by the low-level features [
21]. Deep learning has demonstrated superior results over other commonly used classifiers for scene classification [
22,
23] as well as outperforming other methods in 3-D LiDAR tree species classification [
24]. This study examines one of the latest neural networks for visual object recognition, Dense Convolutional Network (DenseNet), and its ability to classify dominant tree species within a highly complex urban environment using a data fusion approach with high spatial resolution multispectral imagery and LiDAR datasets. Recent studies have demonstrated DenseNet outperforms other deep learning architectures such as Inception, VGG and ResNet through achieving higher classification accuracies with fewer input parameters [
25,
26,
27]. While deep learning has recently exhibited success for individual tree detection [
6], crop classification [
28] and hyperspectral image classification [
29], DenseNet has not been examined for its utility for individual tree species classification, to our knowledge.
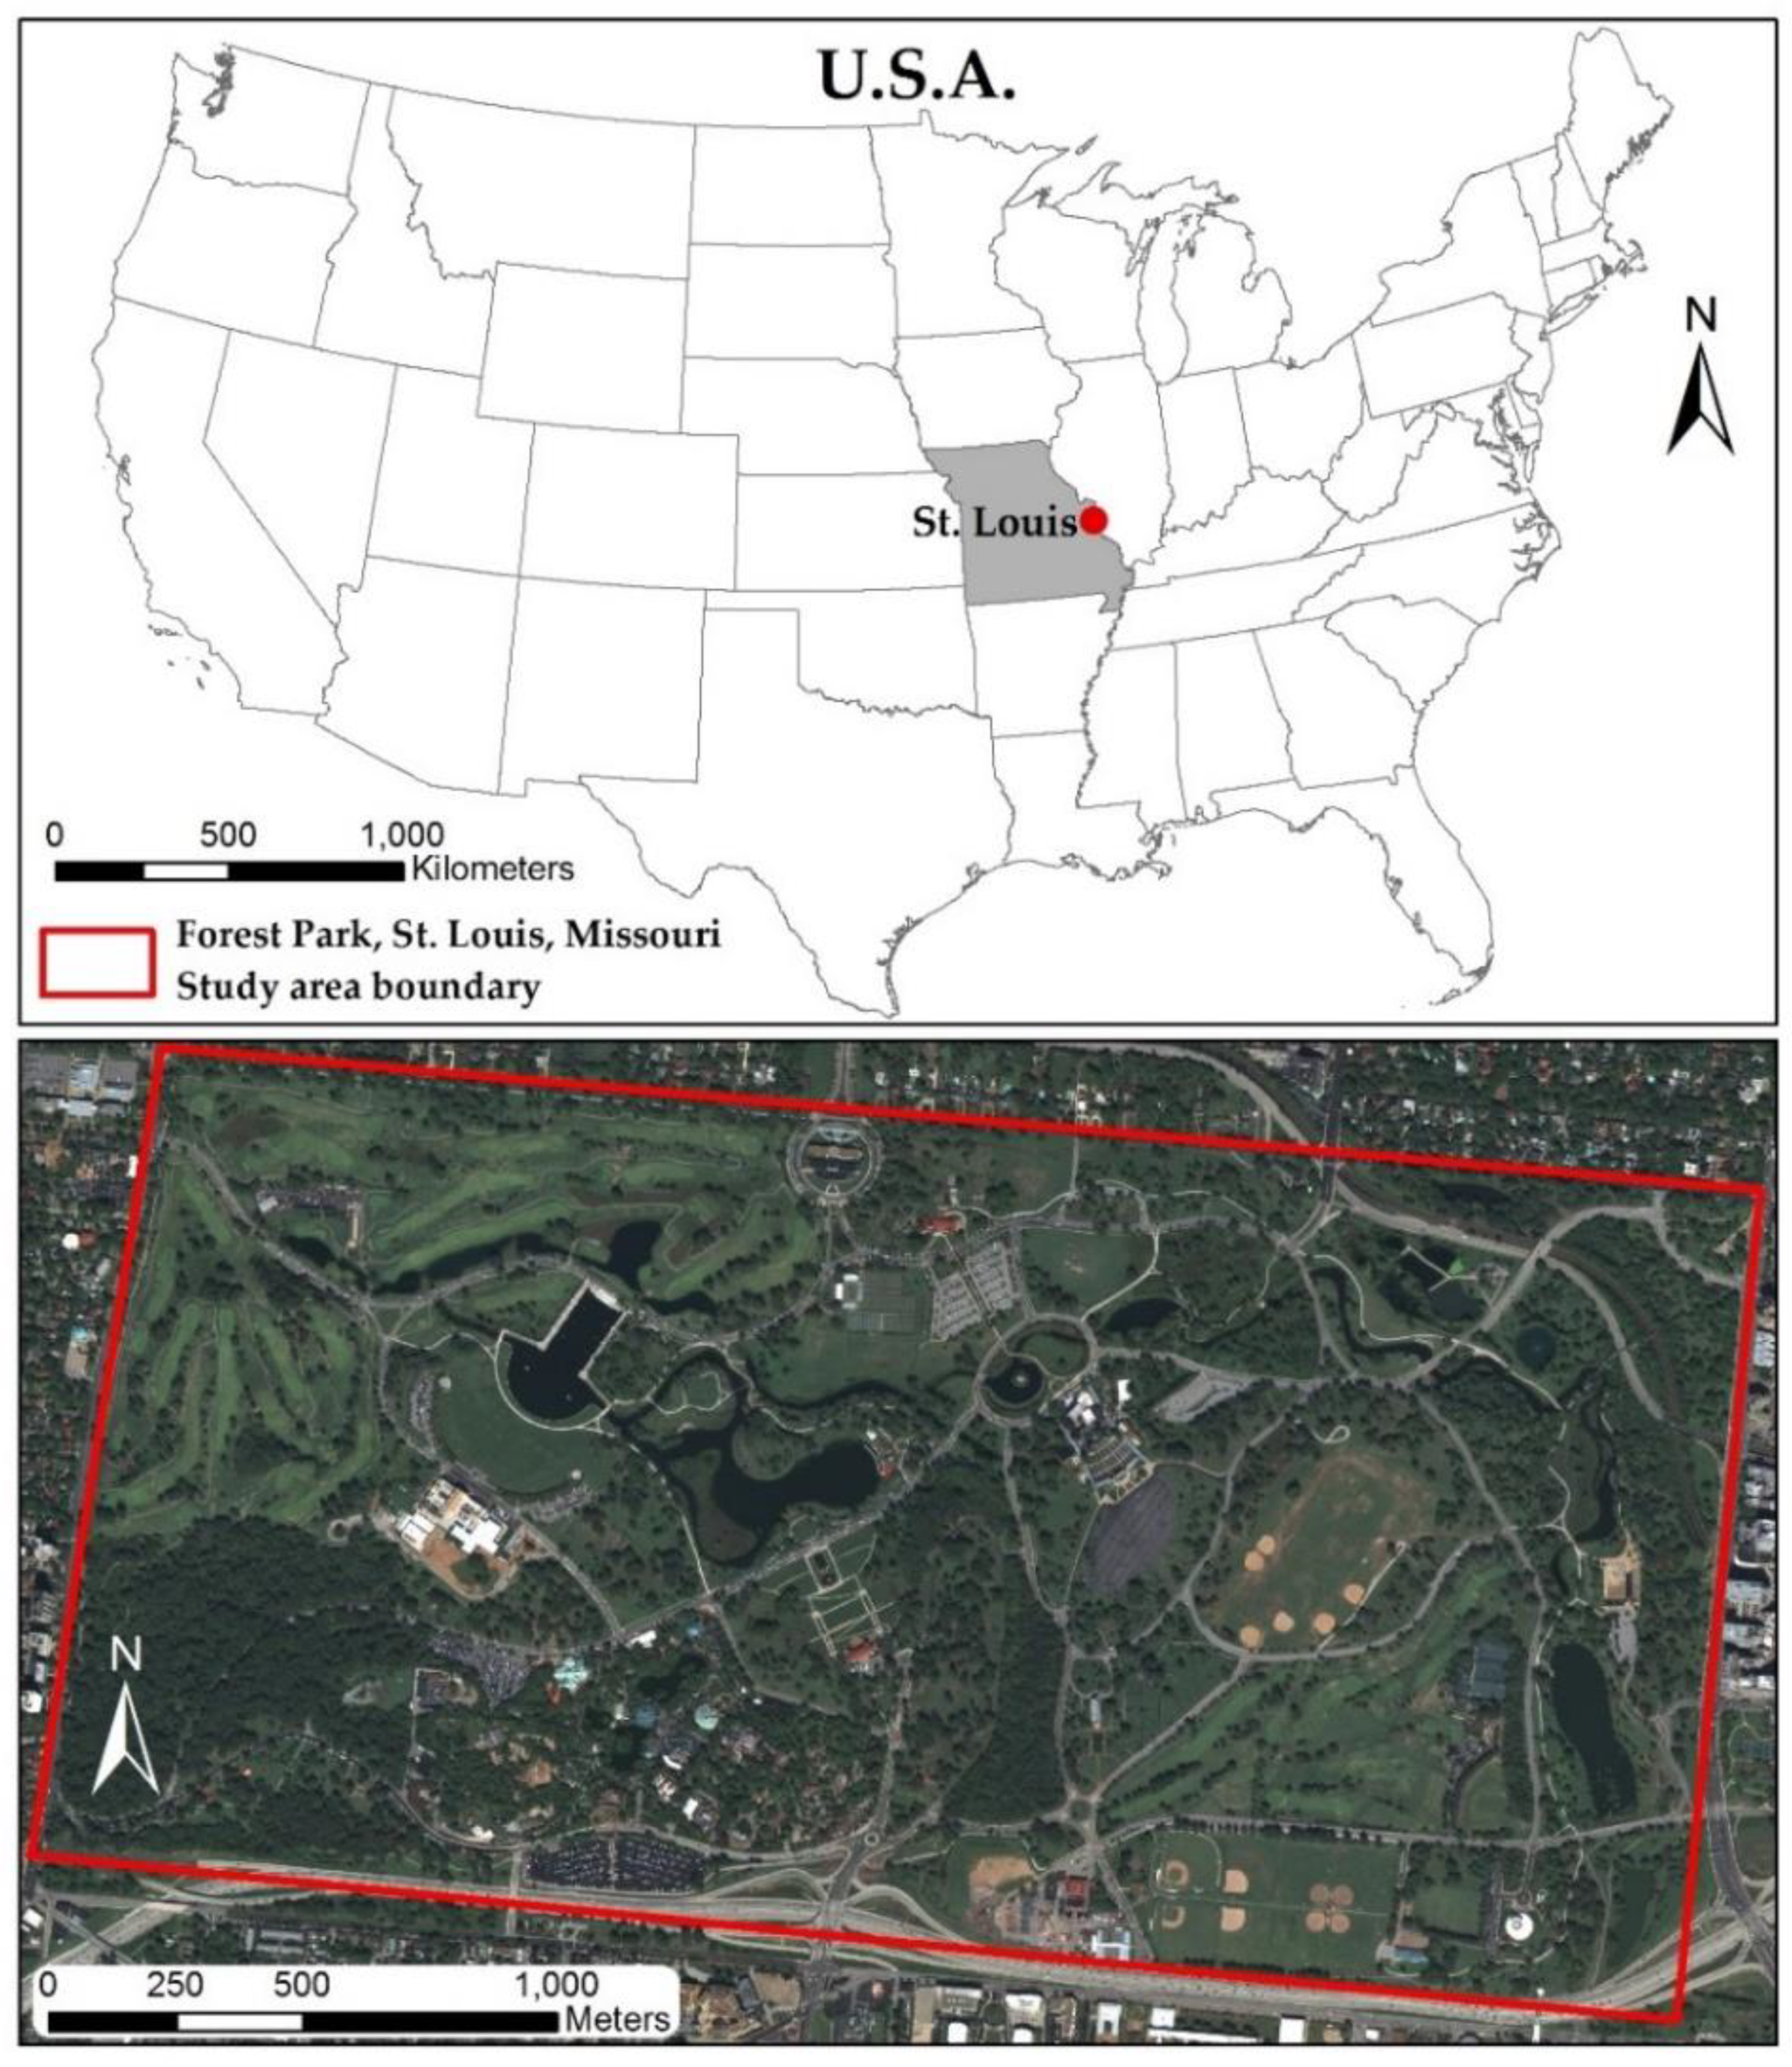
The goal here is to evaluate high spatial resolution imagery in combination with LiDAR data for tree species classification in a complex urban environment, demonstrated within a highly biodiverse city park, Forest Park, in St. Louis, Missouri, USA, which represents an urban forest containing typical tree species found in big cities. Furthermore, the tree arrangement of the park is similar to normal urban tree distribution, where trees can be found near walkways, roads, buildings (residential and commercial), green spaces and can exist individually or in clusters of same or varied species. Crown sizes vary greatly between species as well as growth stage, which makes it difficult to distinguish individual tree spectral and spatial characteristics from moderate spatial resolution imagery. Therefore, higher spatial resolution data is required to identify single tree crown spectral and structural parameters needed for individual urban tree species classification. Moreover, a pixel-based classification method cannot be used for species classification due to high variation of spectral response within a single canopy [
30].
The objectives of this study are to: (1) propose a data fusion approach with DenseNet for tree species identification. To best of our knowledge, DenseNet is the first time employed for urban tree specifies classification in this paper; (2) analyze the impact of different combination of data source such as PAN band, VNIR, SWIR, and LiDAR on detailed tree species classification, and the contribution of different features types extracted from different sensors; (3) compare DenseNet performance to SVM and RF classifiers and (4) investigate the impacts of the limited number of training samples on classification accuracy for various classifiers.
3. Results
3.1. Classification Accuracy Using a Data Fusion Approach
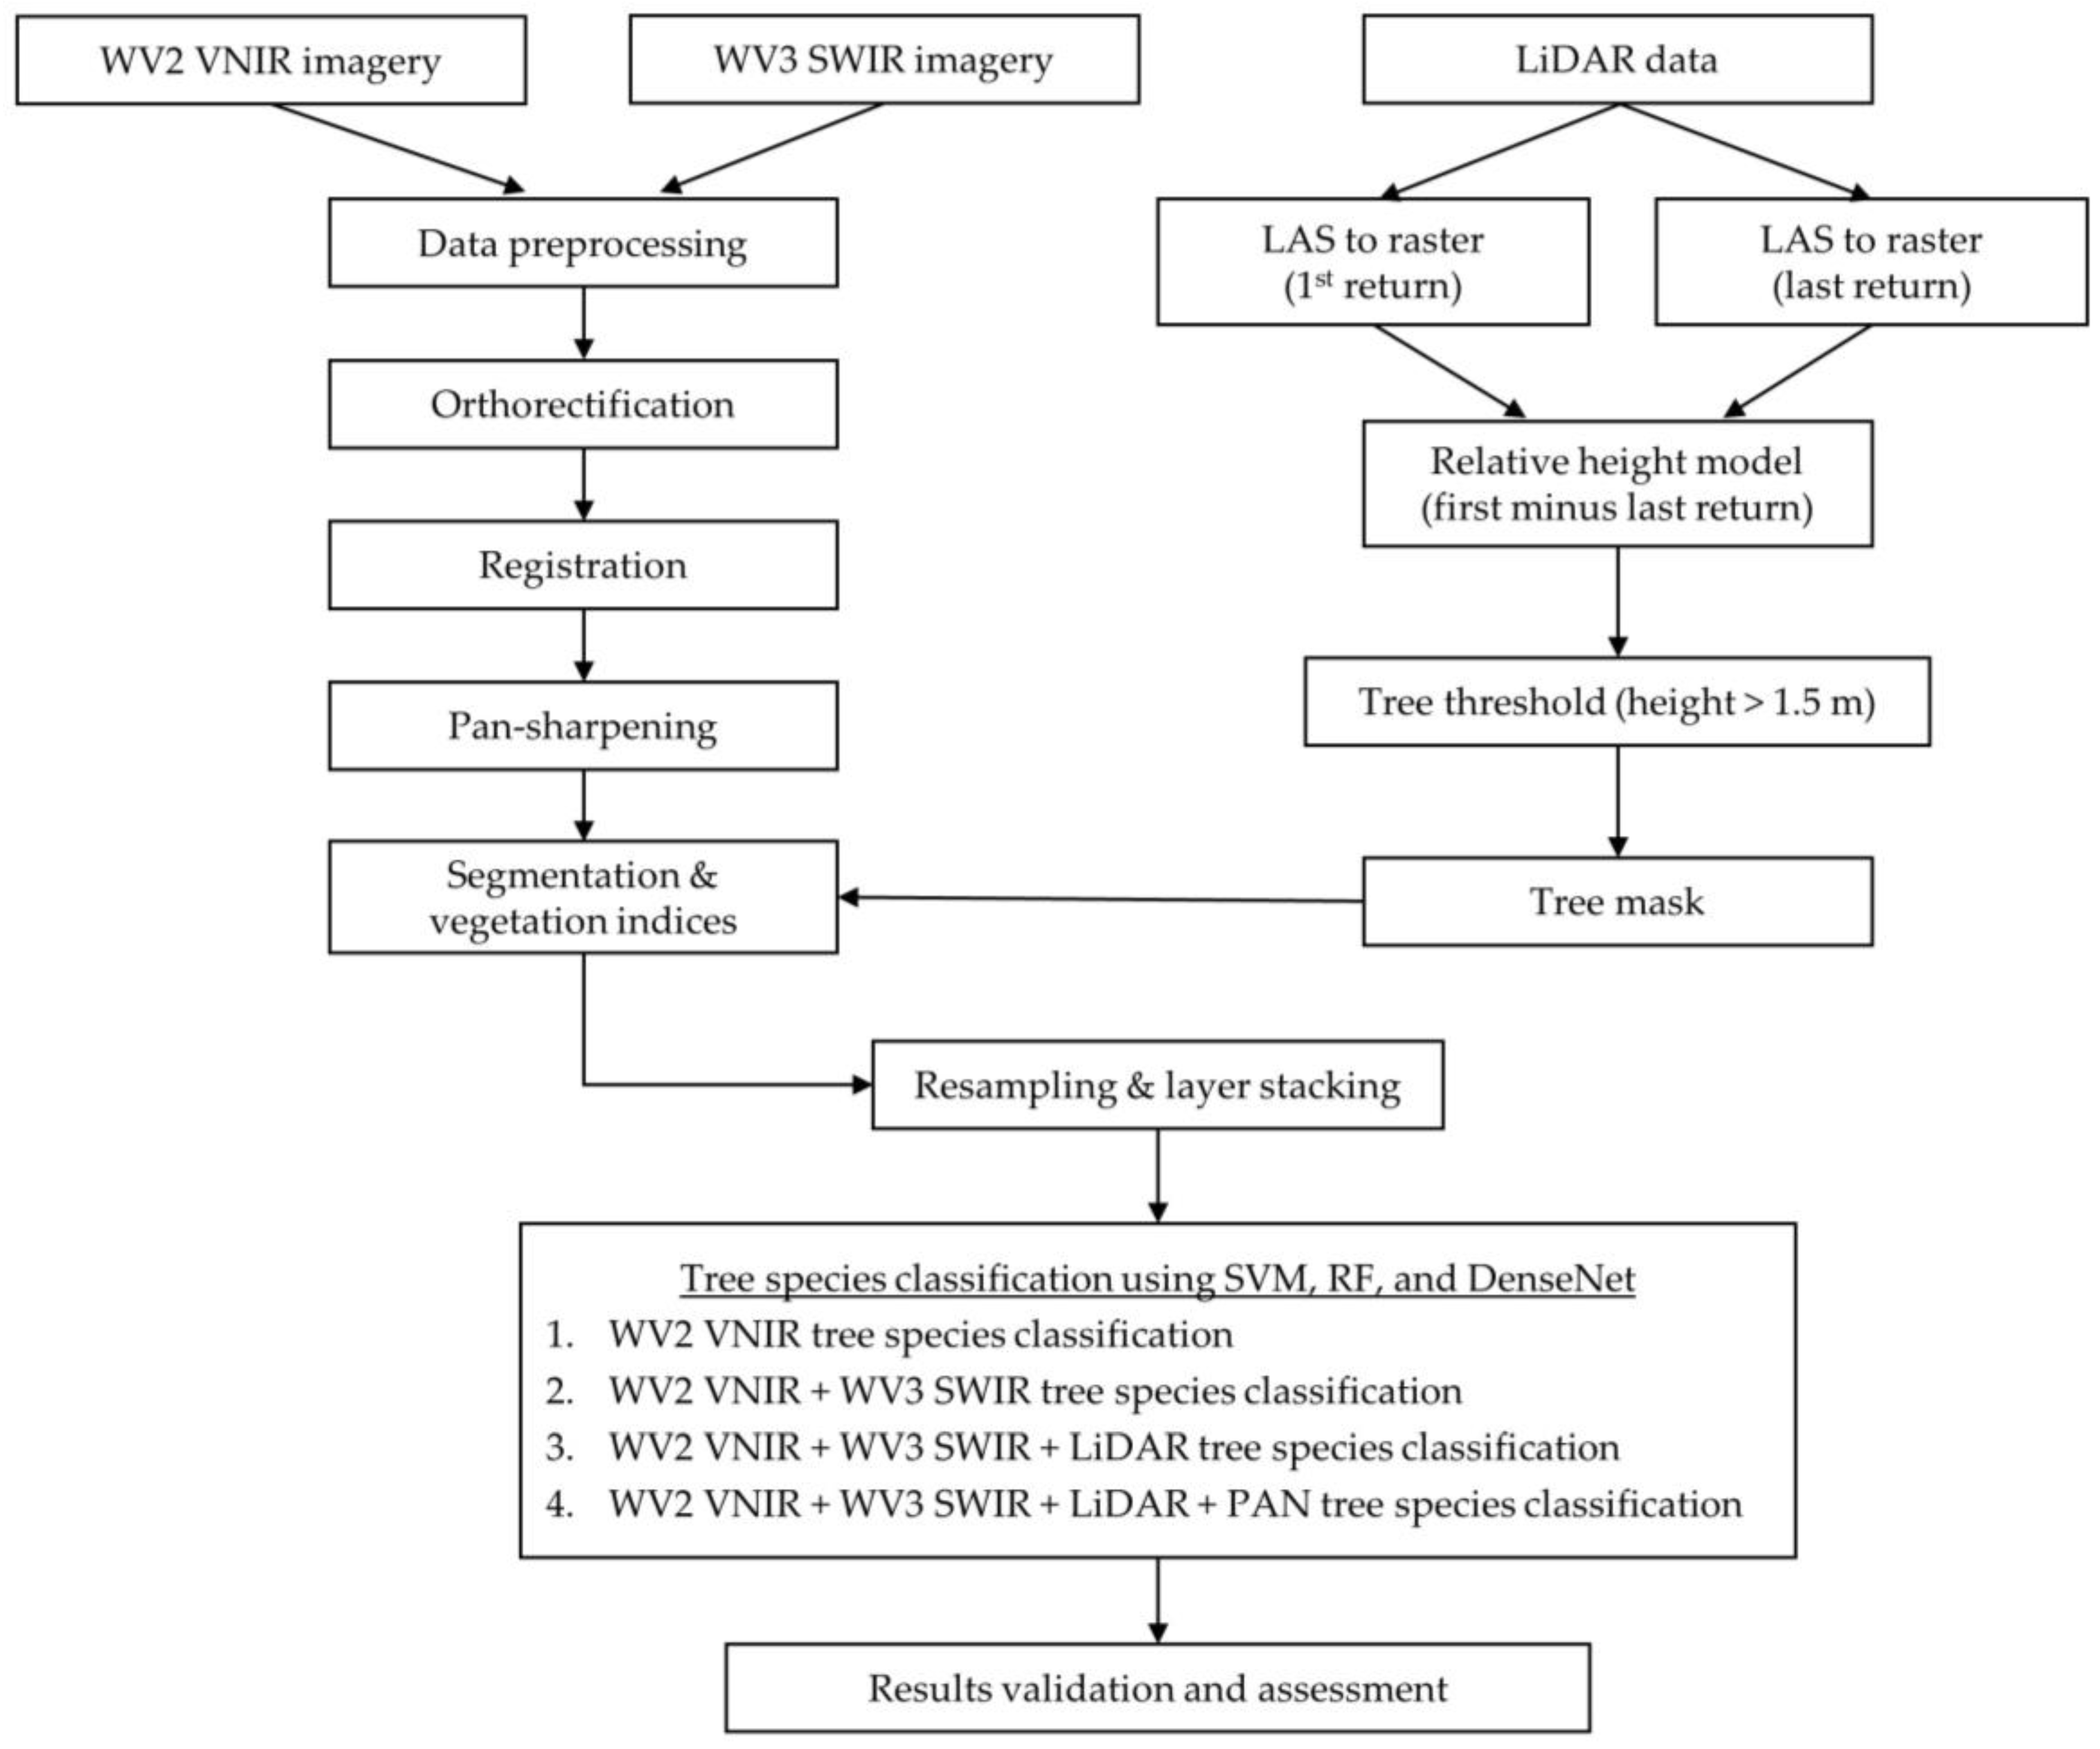
To identify the optimal data fusion approach to use for the comparison of machine learning classifiers, the combination of WV2 Panchromatic and VNIR band, WV3 SWIR and LiDAR datasets were tested for classification accuracy. DenseNet was used to classify the eight dominant tree species using 8 pan-sharpened VNIR bands of the WorldView-2 image, then adding 8 SWIR bands of the WorldView-3 image, LiDAR return intensity image, and finally the panchromatic band from the WorldView-2 dataset. The fully combined dataset consisted of 18 bands.
Table 5 shows the results for the DenseNet classification using a data fusion approach.
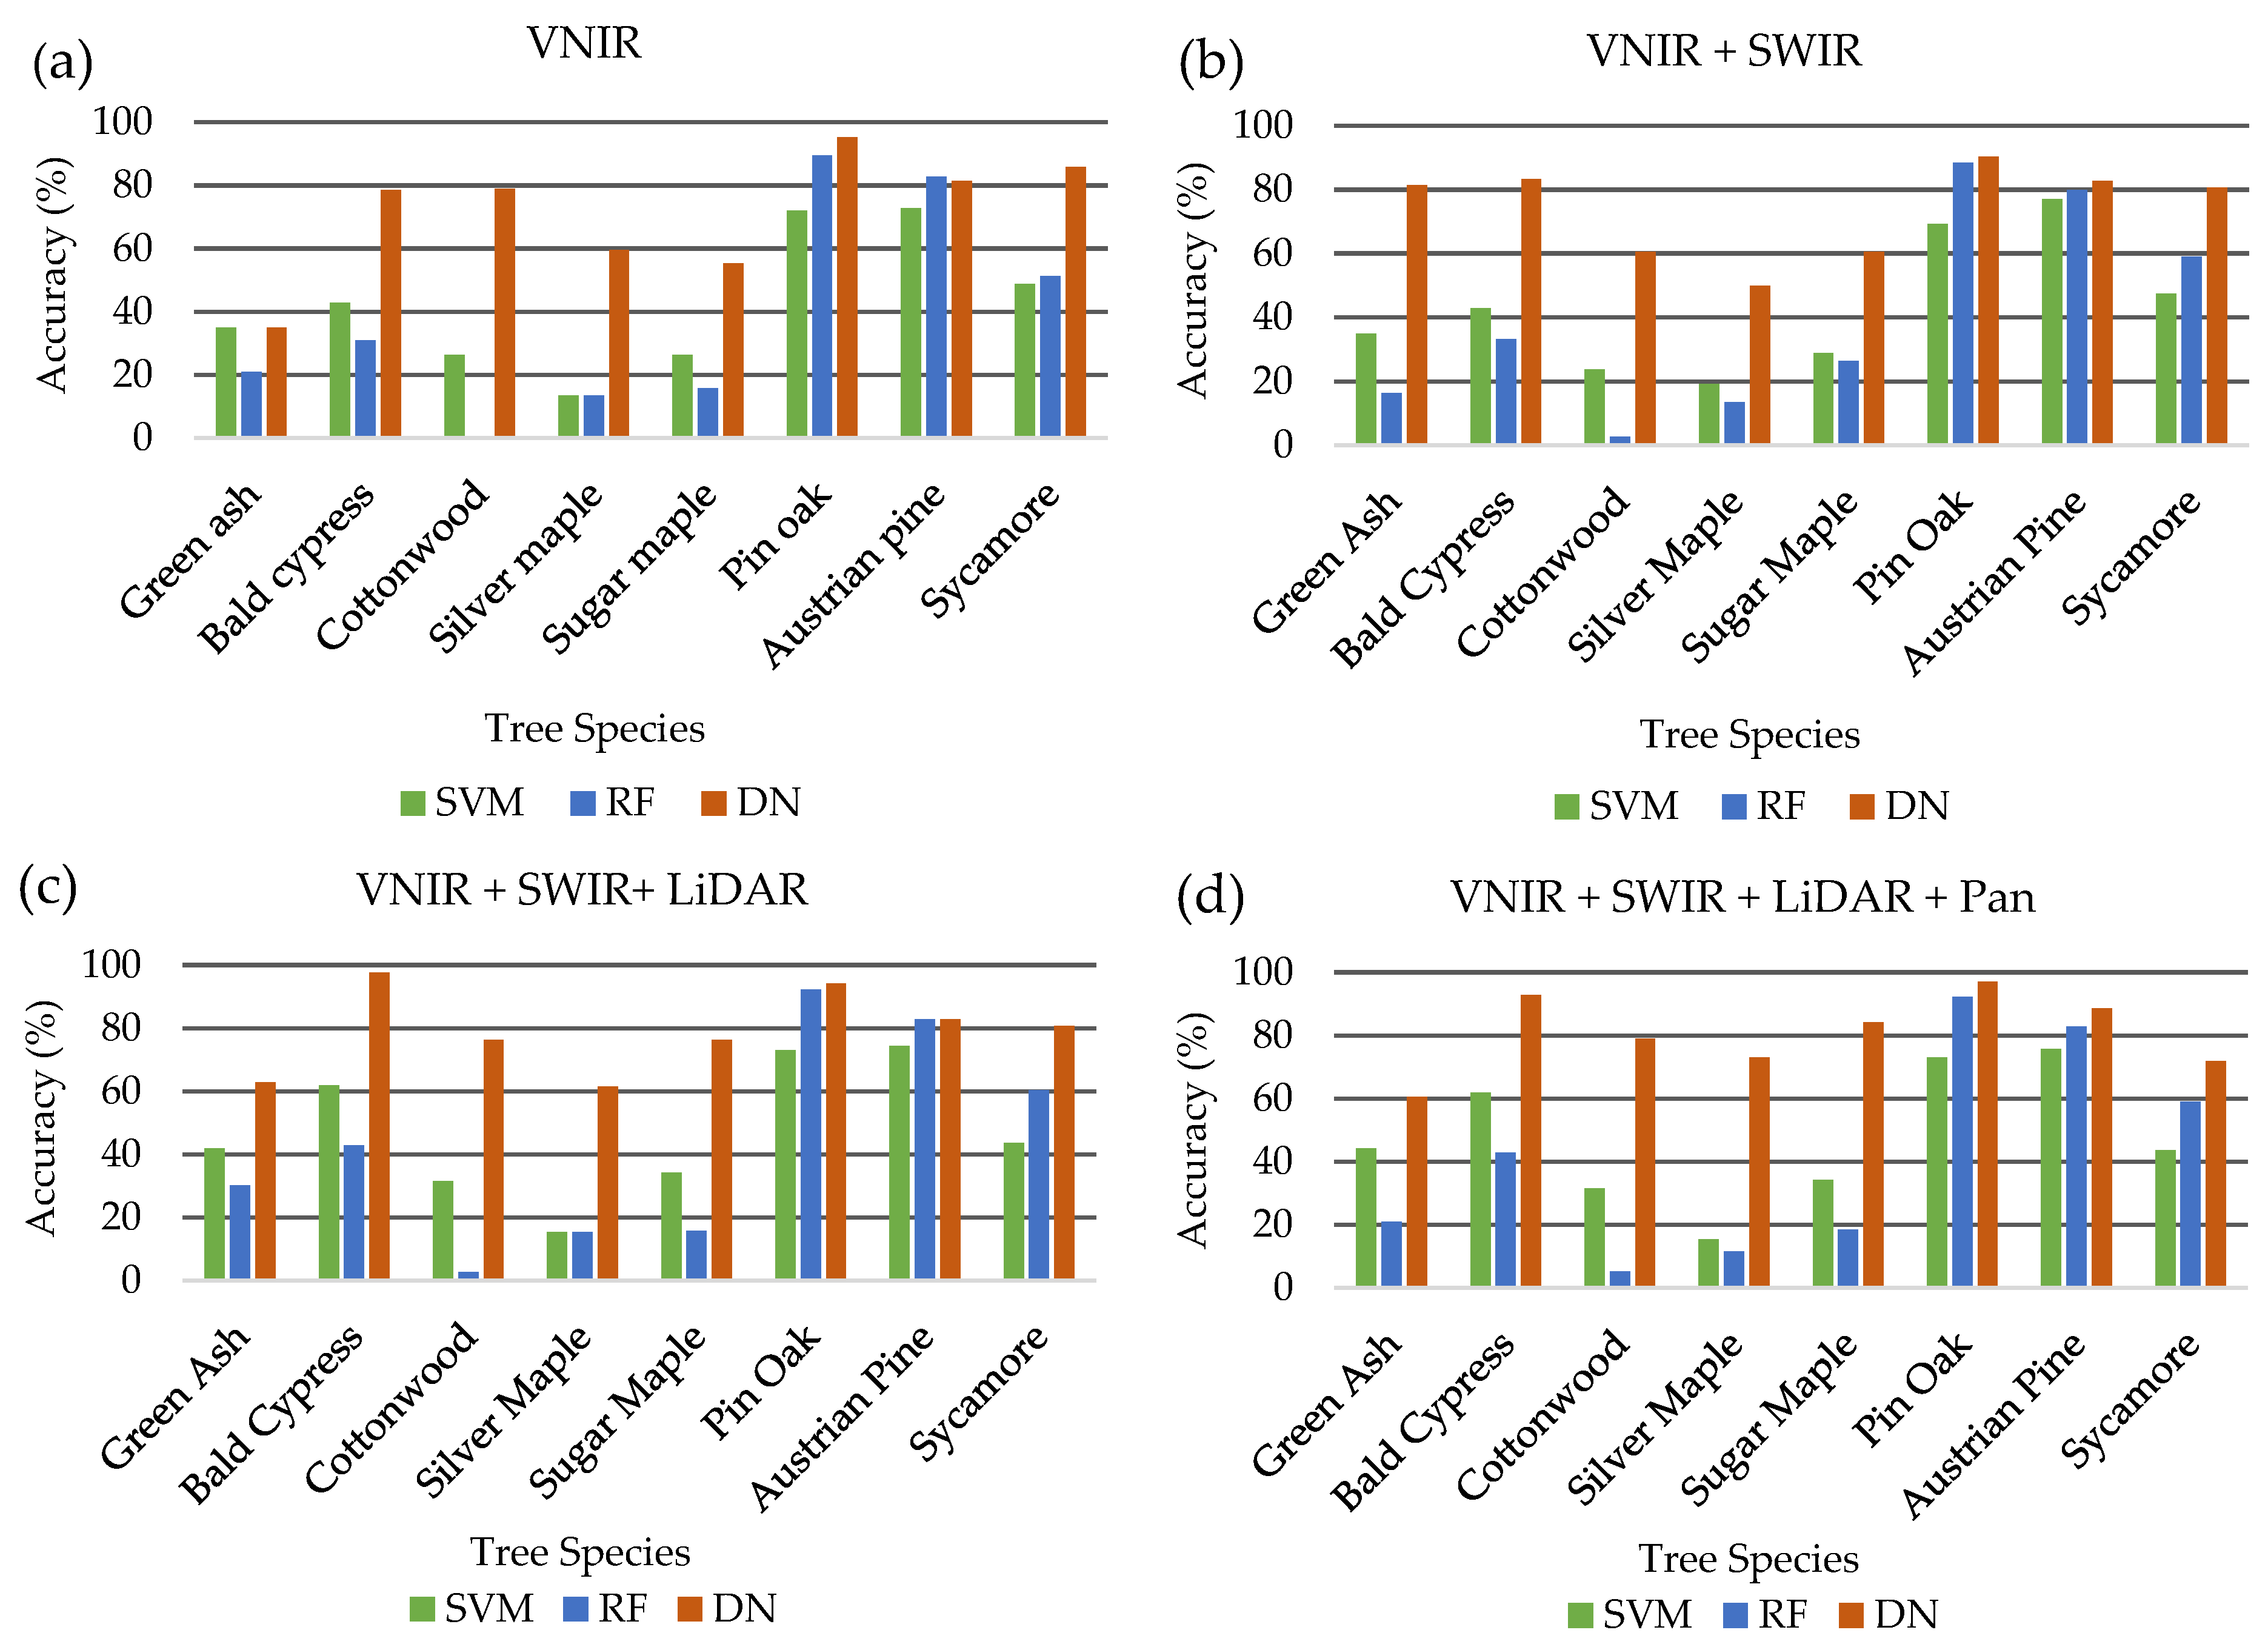
The addition of each dataset improved overall classification demonstrating the ability of DenseNet to extract useful information from each dataset. Overall and average accuracies increased with each additional dataset starting at 75.9% and 71.2% and improving to 82.6% and 80.9%, respectively. The kappa coefficient, which is a statistical measure of inter-rater reliability, was also improved with each added combination, ranging from 0.71 when using only 8 VNIR bands to 0.80 when incorporating all 18 combined bands from three different sensors. The highest total overall accuracies were achieved using a fused combination of 18 bands derived from WorldView-2, WorldView-3 and LiDAR datasets.
Individual tree species varied in the classification accuracies depending on the combination of datasets demonstrating the unique spectral or textural characteristics of each species identified by different sensors. Green ash classification was increased significantly from 34.9% to 81.4% with the addition of the 8 SWIR WorldView-3 bands to the 8 VNIR WorldView-2 bands. However, the incorporation of LiDAR and panchromatic bands decreased accuracy to 62.8% and 60.5%, respectively, demonstrating its spectral separability in the SWIR region. Classification accuracy for sycamore was decreased with the addition of datasets to the initial 8 VNIR WorldView-2 bands from 85.9% to 71.8%, indicating its spectral separability in the VNIR region. Among all the species, bald cypress produced the highest classification of 97.6% with the incorporation of the LiDAR intensity image highlighting its unique structural characteristics exhibited from leaf-off LiDAR intensity returns. Three of the eight species, green ash, bald cypress and sycamore, did not achieve the highest classification accuracy with the addition of the panchromatic band to the other combined datasets. The decrease in accuracy with the incorporation of additional dataset highlight the potential for classification confusion resulting from redundancy of information with the panchromatic band and the pan-sharpened VNIR bands.
SVM and RF classifiers are frequently used for tree species classification [
5,
8,
11] due to their capacity to deal with high-dimensional datasets. The SVM classifier utilized Radial Basis Function Kernel (RBF) as the kernel function with a three-fold cross grid search method to determine optimal classifier parameters. Validation results for the RF classifier set the optimal decision tree parameter at 500 trees. Individual tree species classification results from commonly used machine classifiers are presented in
Table 6.
Similar to results achieved from the DenseNet classifier, overall accuracies, albeit much lower, increased with the addition of each dataset ranging from 48.2% to 51.8% and from 48.6% to 52% for SVM and RF classifiers, respectively. Likewise, kappa coefficients were lower for SVM and RF classifiers ranging from 0.39 to 0.44 for SVM and 0.38 to 0.42 for RF, which can be interpreted as fair to moderate per the aforementioned scale. Despite higher overall accuracies, RF produced lower kappa coefficients, potentially due to its inability to accurately classify cottonwood species. Pin oak and Austrian pine were among the highest individual species classification accuracies for both classifiers achieving 73% and 75.7% and 92.3% and 82.9% for SVM and RF, respectively. Overall accuracy was highest for the SVM classifier at 51.8% when using the full 18-band combination of VNIR/SWIR/LiDAR/Pan datasets while the RF classifier produced the highest accuracy of 53.1% with the exclusion of the panchromatic band.
3.2. Classification Results Incorporating Vegetation Indices and Textural Information
Since the highest overall classification accuracy was achieved for two of the three classifiers—DenseNet (82.6%) and SVM (51.9%)—with the full combination of 18 bands (8 WV2 VNIR, 8 WV3 SWIR, LiDAR intensity return, WV2 panchromatic band), this dataset was chosen as the common dataset to compare the addition of the designated 13 VIs (
Table 4) and 118 extracted statistical spectral features, textural features, and shape features (
Table 3) for each classifier. Generally, the addition of VIs and textural features to the 18-band data fusion set increased the classification accuracy of individual species for the SVM and RF classifiers. Except for cottonwood, the incorporation of the 13 VIs increased SVM classification accuracy for individual species as well as the overall accuracy (60%), average accuracy (54.9%) and kappa coefficient (0.53). Adding the 118 features to the SVM classifier decreased overall accuracy (58.3%) and kappa coefficient (0.51).
For the RF classifier, the inclusion of the 13 VIs increased classification accuracy for five of the eight tree species while only slightly decreasing classification accuracy for Bald cypress (40.5%), Sugar maple (15.8%) and pin oak (65.4%) species. Conversely, the addition of the 118 features increased classification accuracy for the same individual species (Bald cypress—59.5%, Sugar maple—36.8%, Pink oak—94.2%) while simultaneously decreasing classification accuracy for Green ash (20.9%), Austrian pine (84.3%) and Sycamore (65.4%) tree species. Overall accuracy, average accuracy and the kappa coefficient improved with the incorporation of the 13 VIs and subsequently with the inclusion of the 118 statistical spectral features, textural features, and shape features.
Unlike the SVM and RF classifiers, DenseNet performance generally decreased with the addition of extra information to the combined 18-band dataset (VNIR/SWIR/LiDAR/Pan). Green ash was the only species to increase individual classification accuracy with the integration 13 VIs and 118 features (textural + statistical spectral + shape) to 65.1% and 74.4%, respectively. There was no change in classification accuracy for bald cypress (92.9%) when adding the 13 VIs but decreased to 78.6% with in inclusion of the 118 features for the DenseNet classifier. The incorporation of the 13 VIs improved classification accuracy for sycamore (89.7%) but decreased to 84.6% when adding the 118 extracted features, which is still an improvement over the 18-band combination (71.8%). Oppositely, Austrian pine decreased in classification accuracy (82.8%) with the assimilation of the 13 VIs but improved to its highest classification accuracy (90%) with the inclusion of the 118 features. Supplementation of the initial 18-band dataset decreased overall performance when using the DenseNet classifier, with overall accuracy, average accuracy, and kappa coefficient decreasing with the incorporation of each additional dataset.
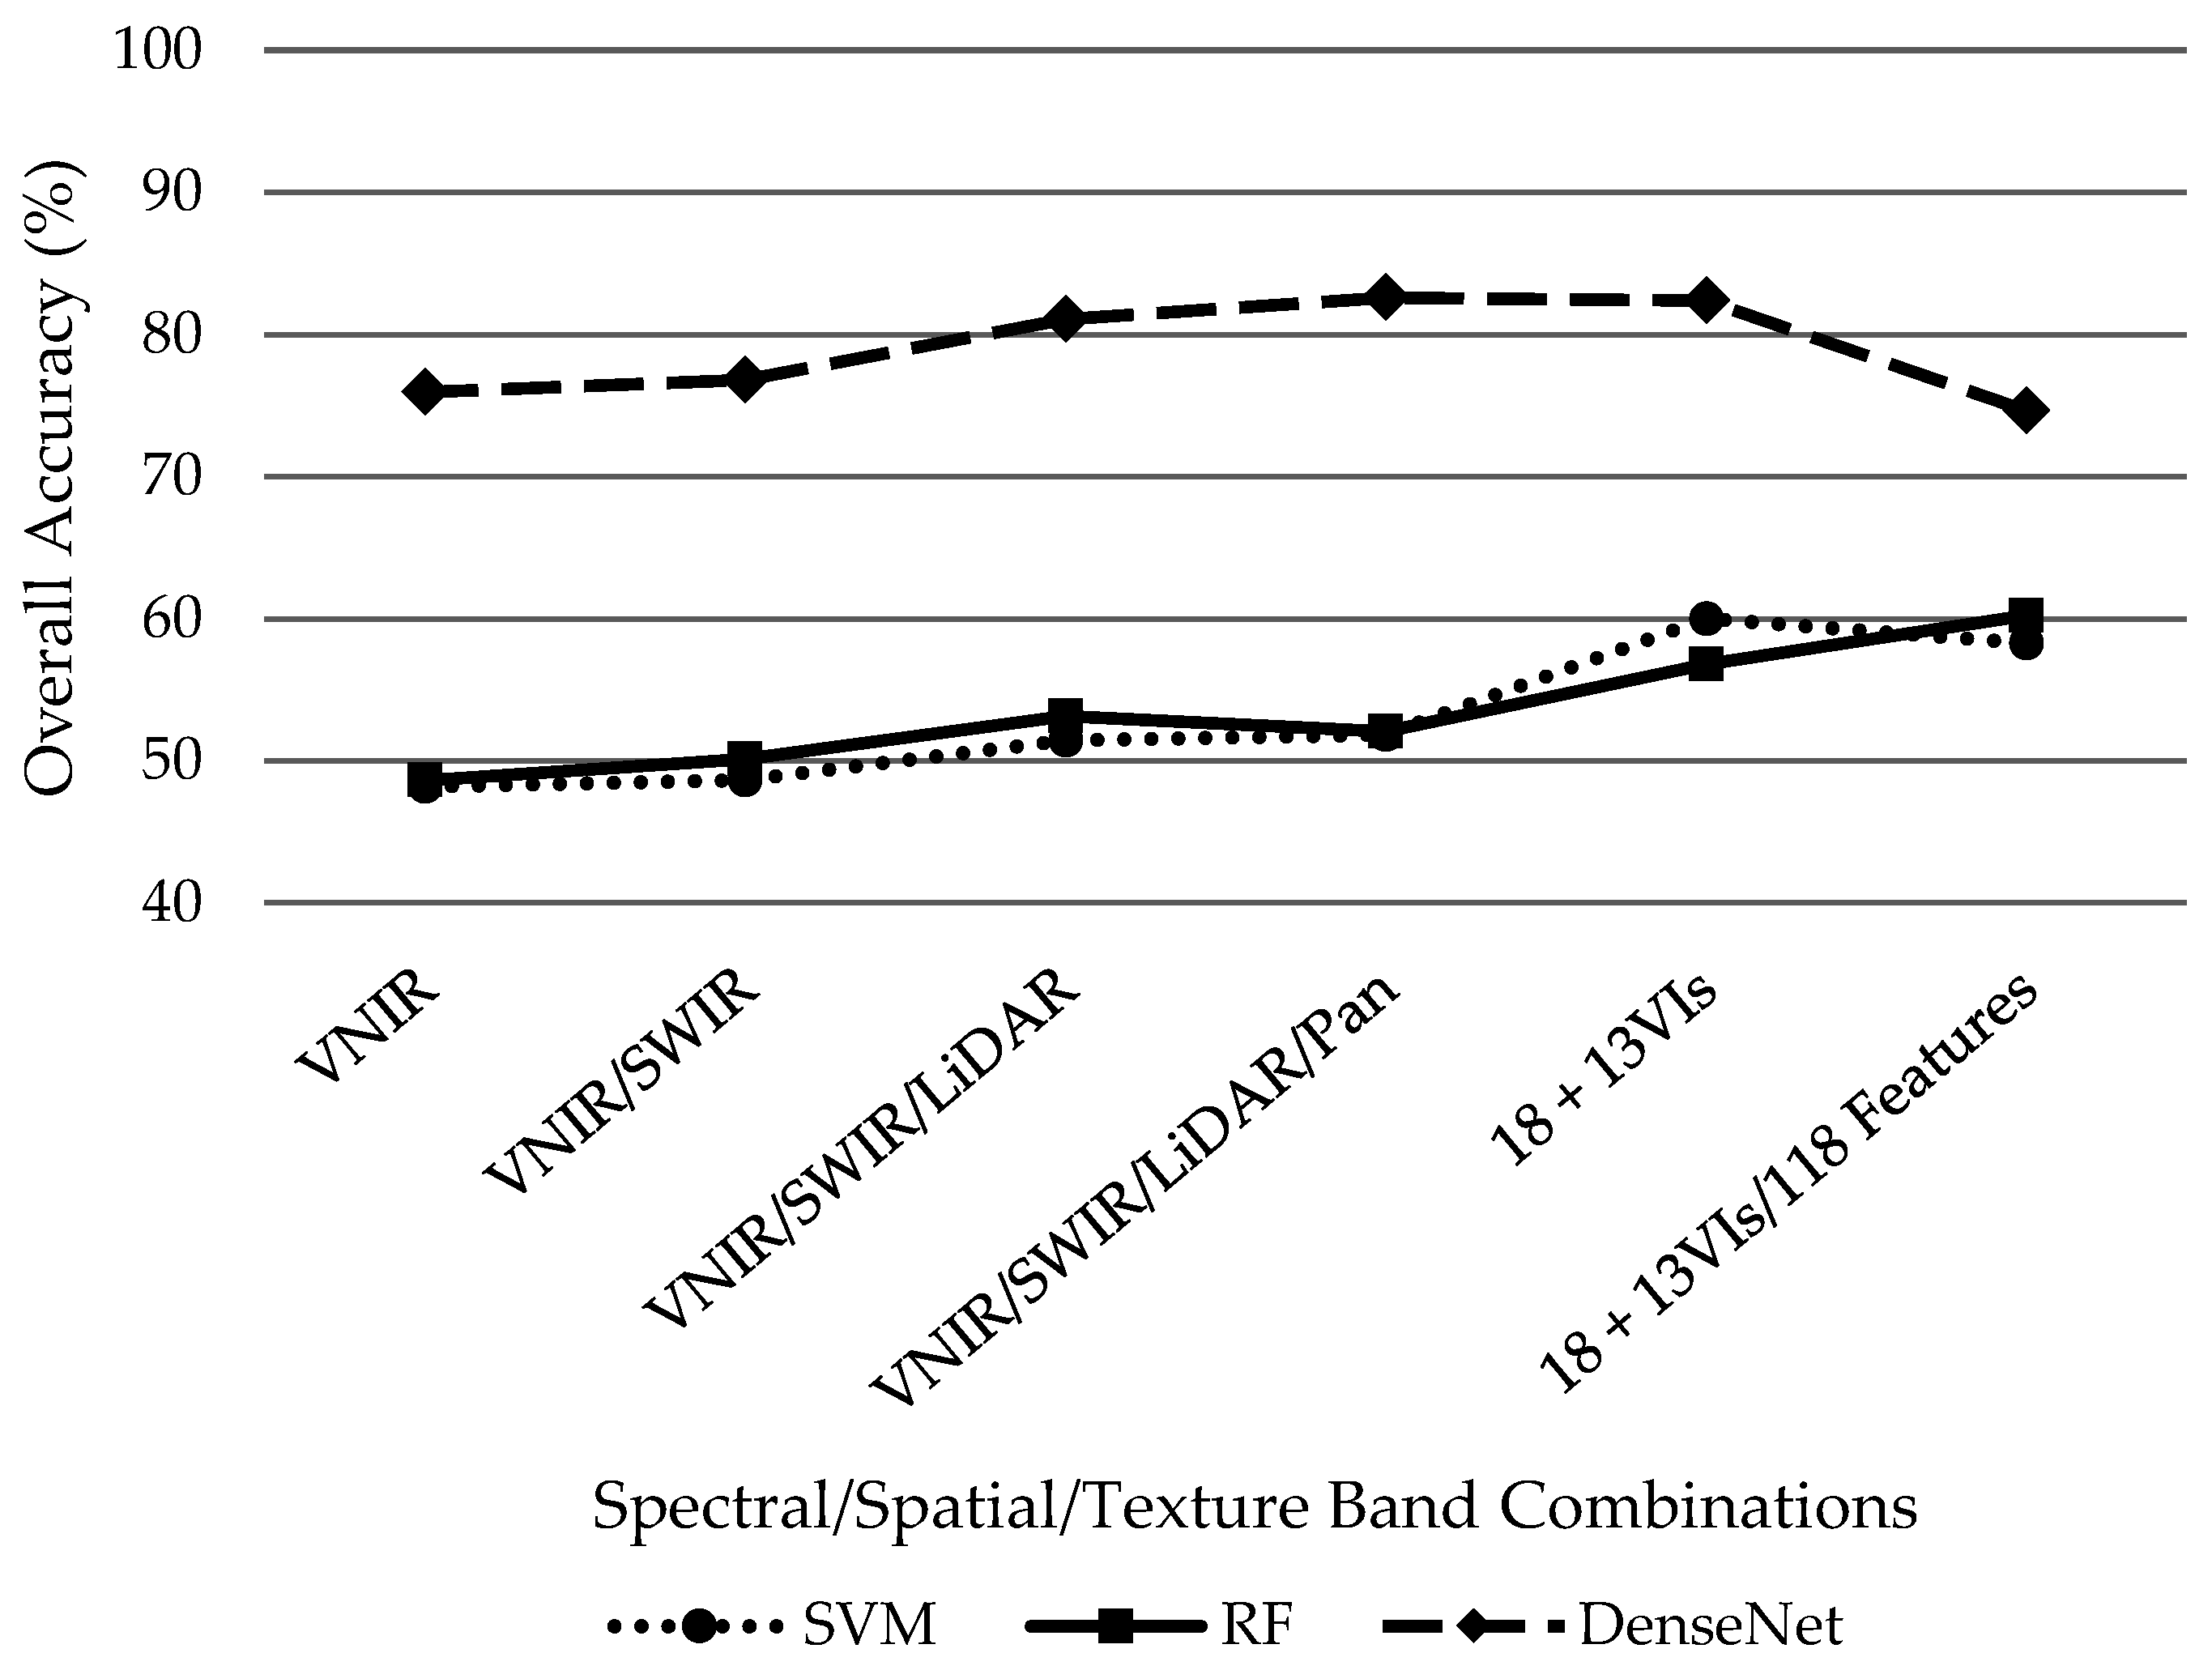
Overall, DenseNet outperformed SVM and RF classifiers regardless of the dataset combination as demonstrated in
Figure 6. However, it is worth noting that the addition of supplementary datasets improved overall accuracy from the initial 18-band VNIR/SWIR/LiDAR/PAN dataset for the SVM and RF classifiers while the additional information hindered DenseNet performance by decreasing overall accuracy after the initial 18 bands. Using the initial 18 bands, SVM and RF classifiers demonstrated similar performance with overall accuracies of 51.8% and 52%, respectively. The SVM classified performed its best (60%) while only including the 13 VIs without the 118 features. Conversely, the RF classifier slightly outperformed SVMs highest accuracy with 60.2% with the incorporation of 13 VIs plus the 118 features despite underperforming the SVM classifier with only the initial 18 bands plus 13 VIs at 56.8%. Distinctively, DenseNet achieved its best results 82.6% while only incorporating the initial 18 VNIR/SWIR/LiDAR/PAN bands. Overall accuracy then decreased with the addition of 13 VIs then the 118 features to 82.4% and 74.6%, respectively.
5. Conclusions
This study examined high spatial resolution imagery, i.e., WV2 VNIR and WV3 SWIR images, for analysis with an image-based classification method. At the study site, three classification schemes, including classification based on leaf-on WV2 VNIR images, both WV2 VNIR and WV3 SWIR images, and WV2/WV3 along with LiDAR derived tree extraction methods were conducted to examine the effects of high spatial resolution imagery and data fusion approaches on urban tree species classification. Two common machine learning algorithms, SVM and RF, were compared against the latest deep learning algorithm, i.e., DenseNet, to examine their ability to classify dominant individual tree species in a complex urban environment. Our results demonstrated that a data fusion approach, with the incorporation of VNIR, SWIR and LiDAR datasets improves overall accuracy of individual tree species classification across all classifiers employed in this study.
We determined that DenseNet significantly outperformed popular machine learning classifiers, SVM and RF. The inclusion of additional variables (i.e., statistical spectral, textural, and shape features) hindered the overall accuracy of the DenseNet classifier while improving accuracy for RF and SVM for individual tree species classification. This indicates the strength of deep learning to analyze similar statistical spectral, textural and shape information within the hidden layers and without the need for engineering hand-crafted features.
The contribution of each feature type on classification accuracy was investigated by separately adding shape, statistical spectral, texture, and VIs to the 18-band fused imagery baseline dataset. Among the individual input features, VIs added to the 18-band fused baseline dataset produced the highest overall classification accuracies with DenseNet (82.4%), which was followed by texture features (80.43%), and shape features (78.06%). Regardless of additional feature dataset category, DenseNet consistently attained the highest overall classification accuracy of 82.6% compared to SVM and RF. However, it should be mentioned that the separate inclusion of texture and VIs to the 18-band fused data achieved only mildly lower overall classification accuracies of 80.4% and 82.4%, respectively.
Moreover, limiting the amount of training samples, which counters deep learning’s position as the preferred classifier for large datasets with abundant training samples, DenseNet is still the superior classifier compared to SVM and RF for individual tree species classification. Regardless of the number of training samples, DenseNet outperformed with overall accuracies 29.7% higher on average than the next closest classifier (RF). This study demonstrates the potential of deep learning as a powerful classifier for complex landscapes such as urban tree species classification. However, to further explore its utility and robustness, deep learning algorithms should be tested at other study areas and across a variety of tree species and available datasets.


