Abstract
This study analyzed the fluorometric laboratory tests for the detection of the presence of oil in seawater in cases corresponding to the real situation in the sea: when the point of seawater sampling is not in the same place as the appropriate sensor. The phenomenon of fluorescence exhibited by both natural and alien substances (oil) in the sea was used. The possibility of oil detection in the water column based on a fluorometric index (FI) extracted from the excitation–emission matrix (EEM) was studied. Laboratory tests were carried out on water taken from the Gulf of Gdańsk (Baltic Sea). Seawater samples were contaminated with small amounts of various types of oil (the lowest oil-to-water ratio was 0.5 × 10⁻⁶). A statistically significant difference was found between FI values for uncontaminated seawater and seawater exposed to various kinds of oil (i.e., crude oils, lubricant oils, and fuels).
1. Introduction
Oil pollution is an ongoing problem for the marine environment. However, this issue was significantly reduced as a result of the MARPOL Convention [1]: tanker construction was improved, strict standards for oil discharges were established, a legal system of deterioration was developed, and methods for the early detection of oils on the sea surface were improved. Instrumental analytical methods for detecting the perpetrators of spills were also regulated [2]. The technical and organizational basis for combating spillages has significantly improved [3,4]. However, oil spills still appear [5]. Currently, in the scientific literature, the issues of remote detection of oil stains appearing at sea are widely discussed [6,7,8]. Both optical and radar methods [3,9,10,11,12,13,14] are well developed in this field. Activities aimed at limiting the share of oil substances polluting the marine environment also include the possibility of early detection before they spread in the sea. This is particularly difficult if these substances exist in the depths of the sea in a dispersed form or they penetrate deeply into the environment beneath the surface of the water from tanks, pipelines, wrecks, mining equipment, or bottom seepage. In cases when the oil has spread in the sea and flows deeper into the sea under the influence of the wind and waves, different methods based on UV-visible, IR, and Raman spectroscopy, or those based on oil fluorescence [15,16,17,18], are required for the detection of oil substances. Moreover, for underwater oil pollution detection, different sensors can be used [19,20,21,22,23].
Both seawater and some hydrocarbon substances leaching into the water from the oil are capable of fluorescence induced by ultraviolet light. If seawater did not exhibit fluorescence, it would be easy to detect substances derived from oil. However, since oil substances and substances naturally occurring in the sea fluoresce similarly [18], a universal method for interpreting the fluorescence spectra in terms of detecting the presence of oil in seawater is required. Preliminary studies on seawater samples contaminated with only one type of oil (crude oil Petrobaltic), but sampled in various terms [24], have shown the possibility of using a numerical indicator extracted from the excitation–emission matrix (EEM) spectrum, whose value indicates the lack of exposure of water to oil pollution or an oil hazard in the vicinity of the point of water sampling or a possible sensor location. This paper outlines the results of a wider analysis of the possibility of signaling the presence of various types of oil in seawater, using a similar procedure for the interpretation of EEMs in all cases. The results presented in this paper are promising, but in order to finally implement the proposed method in real conditions and further in various sea regions, additional verification analyses are needed.
2. Materials and Methods
2.1. Materials
2.1.1. Seawater Samples
Seawater samples were collected in the Orłowo pier in Gdynia (Southern Baltic Sea, Poland). Seawater was sampled from a 1 m depth into 1 L glass bottles, three times in 2019: March (T = 4 °C and salinity 7.4 PSU), April (T = 6 °C and salinity 7.6 PSU), and May (T = 10°C and salinity 7.5 PSU).
2.1.2. Oil Samples
Several kinds of oils were used for the laboratory contamination of seawater.
(1) Crude oils:
Petrobaltic—extracted from the Baltic Sea shelf, light crude, with American Petroleum Institute API gravity 43–44° and sulfur content 0.12%.
Flotta—extracted from the North Sea (Orkney), medium crude with API gravity 35.4° and sulfur content 1.22%.
Gullfaks—extracted from the North Sea (off-shore), light crude with API gravity 37.5° and sulfur content 0.22%.
(2) Lubricant oils:
Marinol 1240—as a representative of lubricant oil used for the lubrication of inverter-type marine engines operating on light fuel. The oil base contains less than 3% polycyclic aromatic hydrocarbons (PCA).
Cyliten 460—as a representative of lubricant oil used in marine ship engine systems and used for the lubrication of single- and multi-cylinder reciprocating compressors of synthesis gas. The oil base contains less than 3% PCA.
(3) Fuels:
Eurodiesel—used as fuel for diesel engines with a sulfur content of 10 mg/kg.
E95—light fuel with up to 1% benzene, <3% n-hexane, and approximately 6% toluene.
2.2. Methods
2.2.1. Exposure of Seawater Samples to Oil
For laboratory measurements, seawater samples were contaminated by each oil. Small amounts of oil were placed on a slice of aluminum foil and then weighed and inserted into a seawater sample (Figure 1) to reach the desired oil-to-water ratio. Four samples polluted by each kind of oil with an oil-to-water ratio (ro/w) in the range of 0.5 × 10⁻⁶ to 500 × 10−6 were prepared. Natural seawater was exposed to the added oil for one day.
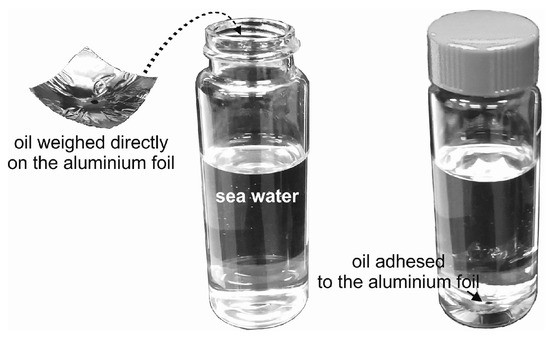
Figure 1.
Procedure of the seawater sample exposure to oil.
2.2.2. Measurement and Apparatus
Instrument
A Hitachi F-7000 FL spectrofluorometer was used to determine the EEMs using a 1 × 1 cm quartz cuvette.
Measurement Parameters
The excitation wavelength was changed from 200 to 480 nm with an excitation sampling interval of 5 nm. The emission wavelength was changed from 260 to 600 nm with a 5 nm emission sampling interval, a 10 nm excitation slit, and a 10 nm emission slit. The integration time was 0.5 s, and the photomultiplier tube voltage was 400 V.
2.2.3. Measurement of Seawater and Oil-Contaminated Seawater Samples
- The EEMs for samples of environment seawater were previously measured three times, allowing for a reliable, artefact-free background to be obtained.
- Next, the EEMs of seawater exposed to each kind of oil for various ro/w were measured.
- Measurements for all samples were performed at a stabilized temperature of 20 °C.
- Rayleigh scattering to yield a digital matrix of EEMs was removed (if the excitation wavelength and emission wavelengths were equal and the emission wavelength was two times higher than the excitation wavelength).
3. Results and Discussion
3.1. Fluorometric Index (FI) Calculations
The studies took into account 84 EEMs for artificially contaminated samples of seawater and nine EEMS for uncontaminated samples (Figure 2). Based on the EEMs of seawater samples and seawater contaminated by different kind of oils, an FI was proposed for oil detection. The proposed FI was extracted from the EEMs and used only specific values of fluorescence intensity described by the excitation wavelength maximum (λEx) corresponding to the emission wavelength maximum (λEm) for selected wavelengths for natural seawater and seawater polluted by oil. The FI was defined as a quotient of the fluorescence intensity at the emission wavelength for seawater polluted by oil to the intensity at the emission wavelength for natural seawater corresponding to the detected excitation maximum for both natural seawater and seawater polluted by oil described as FIo/w by Formula (1). This definition of FIo/w indicates the growth of its value in the presence of oil in water.
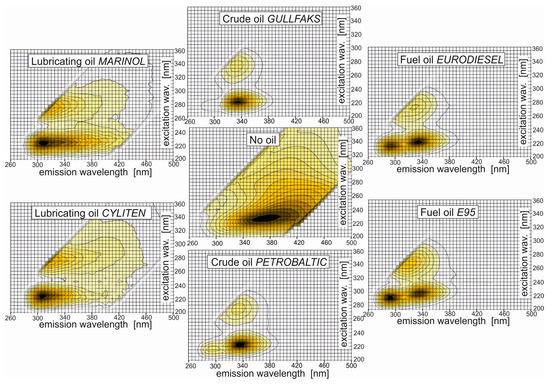
Figure 2.
Excitation–emission matrix (EEM) spectra of seawater sampled on 15 March 2019, and the same seawater artificially polluted by individual oils for an oil-to-water ratio of 50 × 10−6. Each spectrum is normalized to its maximal peak.
The effectiveness of oil detection in seawater based on the proposed indicator FIo/w was checked, taking into account the kinds of oils (Section 2) and oil-to-water ratios.
For oil detection in seawater, it is necessary to take into account the presence of natural seawater components. Therefore, to obtain information on the presence of natural seawater components, the EEMs of natural seawater were determined three times in 2019. Next, the influence of oil presence in seawater on the EEMs was analyzed. Figure 2 presents EEMs for natural seawater (no oil) and seawater polluted by different types of oils selected for an oil-to-water ratio of 50 × 10−6 on 15 March 2019. The EEMs of natural seawater (no oil) in Figure 2 indicate the presence of the main peak in the UV-range centered at 225 nm of an excitation wavelength and corresponding to an emission wavelength centered at 360 nm (λEx/λEm = 225/360) (Table 1). The detected peak is well linked to the tryptophan-like seawater component. Figure 2 clearly presents the influence of oil on the EEMs. In the EEMs of seawater polluted by oil, for all oils, the main peak is centered at 340 nm for an emission wavelength corresponding to an excitation wavelength of 225 nm (λEx/λEm = 225/340) (Table 1) with an accuracy of ±5 nm. Moreover, for all types of oils, a second peak was centered at 330 nm for an emission wavelength corresponding to an excitation wavelength of 275 nm (λEx/λEm = 275/330) (Table 1) with an accuracy of ±5 nm, but with a lower fluorescence intensity than the main peak at 225/340. The results of the determined peaks for the EEMs for individual oils are presented in Table 1, and it is visible that, for the selected oil in the EEMs, other specific peaks depending on the type of oil and oil-to-water ratio are determined. The EEMs for all considered oils (Figure 2) revealed bands of fluorescence intensity between 300 and 400 nm, with the main band at 340 nm. These bands are probably caused by the presence of fluorophores, which are usually centered in one- to three-ring aromatic structures in the petroleum substances [25,26,27,28]. The EEMs from 15 March 2019 overlap with those from 15 April and 20 May 2019.

Table 1.
Major fluorescent peaks of natural seawater and the same samples polluted by oil at oil-to-water ratios of 0.5 × 10⁻⁶, 5 × 10⁻⁶, 50 × 10−6, and 500 × 10−6 with their wavelength-independent maxima (for 15 March 2019).
Taking into account the determined EEM peaks for all oils, it is clear that the peak for natural seawater (λEx/λEm = 225/360) and the main peak for seawater polluted by oil (λEx/λEm = 225/340) were detected at the same excitation wavelength. However, taking into account the peaks for the EEMs determined previously for natural seawater from more than a dozen tests in 2017 [24], the peak for natural seawater is dominant for an emission wavelength at 355 nm (λEx/λEm = 225/355). This is a reason to choose the selected wavelengths for FIo/w definition. Therefore, FIo/w was calculated as the quotient of the fluorescence intensity at a 340 nm emission wavelength and an intensity at 355 nm, while the excitation wavelength remained equal to 225 nm (Formula (2)):
where I(λEm) describes, respectively, the fluorescence intensity corresponding to the emission wavelength for polluted seawater (340 nm) and natural seawater (355 nm) linked to the same excitation wavelength (λEx) for both kinds of seawater (225 nm).
Calculations for the FIo/w values were performed for both natural seawater samples and seawater samples polluted by individual oils (one time for each sample for three different sampling times). Table 2, Table 3, Table 4 and Table 5 present the calculated FIo/w values for three different times in 2019. The results for the calculated FIo/w values indicate the difference between natural seawater and polluted seawater. FIo/w for polluted seawater achieved higher values (above 1) than for natural seawater (below 1). This is confirmation of the good choice of wavelengths for FIo/w. Moreover, in Table 3, Table 4 and Table 5, it is clearly visible that FIo/w values depend on the type of oil and are stabilized for an oil-to-water ratio above 50 × 10−6.
Table 2.
Fluorometric index (FIo/w) calculated by Formula (2) for the uncontaminated seawater.
Table 3.
Fluorometric index (FIo/w) calculated by Formula (2) for the seawater contaminated with individual oils on 15 March 2019.
Table 4.
Fluorometric index (FIo/w) calculated by Formula (2) for the seawater contaminated with individual oils on 15 April 2019.
Table 5.
Fluorometric index (FIo/w) calculated by Formula (2) for the seawater contaminated with individual oils on 20 May 2019.
Figure 3 presents FIo/w for unpolluted seawater and seawater polluted with various kinds of oil for different oil-to-water ratios ranging from 0.5 × 10⁻⁶ to 500 × 10−6. A distinct increase in FIo/w already exists for ro/w = 0.5 × 10⁻⁶. Beginning with ro/w = 50 × 10−6, the FIo/w value ceases to depend on ro/w. The deviation of FIo/w values from other oils was observed for Marinol and Cyliten. This is probably caused by the low content of PCA.
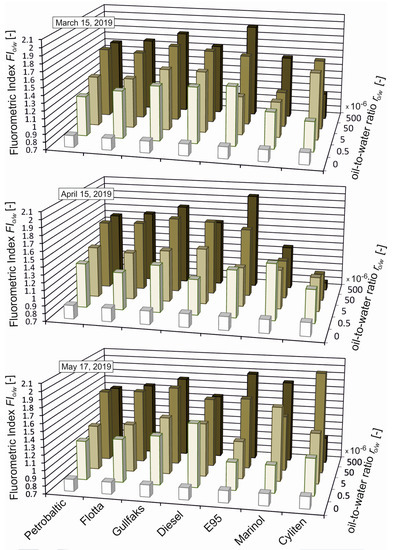
Figure 3.
Fluorometric index (FIo/w) for unpolluted seawater and seawater artificially polluted with various kinds of oil for oil-to-water ratios of 0.5 × 10⁻⁶, 5 × 10⁻⁶, 50 × 10−6, and 500 × 10−6.
3.2. Statistical Analysis of the Fluorometric Index
Statistical calculations were performed to check the deviation of determined fluorometric index (FIo/w) values for three different times of sampling for natural seawater and the same seawater polluted by oil. Confidence intervals (CI) of the mean of the FIo/w values were performed using a Student’s t-test at a significance level of 0.05 for each kind of oil for three water sampling terms. Figure 4 presents the fluorometric index (FIo/w) and CI of the mean for natural seawater (no oil) and seawater artificially polluted by different kinds of oil with oil-to-water ratios of 0.5 × 10⁻⁶, 5 × 10⁻⁶, 50 × 10−6, and 500 × 10−6. The FIo/w values for different kinds of oils and different oil-to-water ratios are statistically different in several cases. However, the confidence bars of contaminated water and clean water did not overlap.
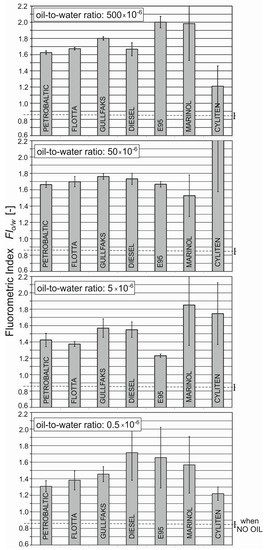
Figure 4.
Mean values of fluorometric index confidence intervals of the mean (the significance level was 0.05) for natural seawater (no oil) and seawater artificially polluted by different kinds of oil for oil-to-water ratios of 0.5 × 10⁻⁶, 5 × 10⁻⁶, 50 × 10−6, and 500 × 10−6.
Next, the standard deviation of the mean values of FIo/w for all kinds of oil for 21 samples from three different times of seawater sampling were determined. Figure 5 presents the average standard deviation of the mean calculated FIo/w values for natural seawater and artificially polluted seawater for different oil-to-water ratios. The highest value of the standard deviation of FIo/w value was found for the 500 × 10−6 oil-to-water ratio. However, the standard deviation of the average FIo/w value for water exposed to oil does not overlap with the standard deviation of the average FIo/w value for uncontaminated water. Moreover, the coefficient of variations of FIo/w achieved values of approximately 10% for the oil-to-water ratios 0.5 × 10⁻⁶ and 50 × 10−6, 14% for the oil-to-water ratio 50 × 10−6, and 19% for the oil-to-water ratio 500 × 10−6. This indicates that the diversity of FIo/w for all oil samples within a given oil-to-water ratio is small, and the FIo/w values indicate high similarity.
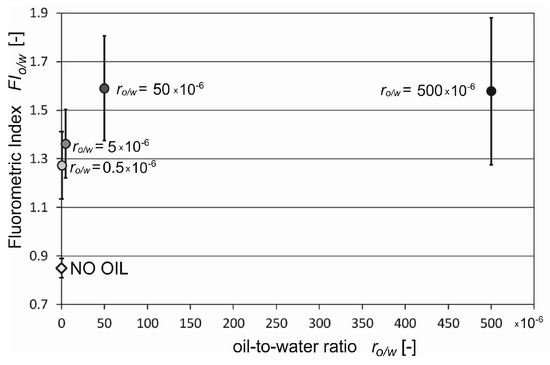
Figure 5.
Fluorometric index (FIo/w) with standard deviation of the mean for natural seawater (no oil) and seawater artificially polluted by various kinds of oil.
4. Conclusions
The value of the fluorometric index (FIo/w) indicates the presence of oil in seawater, although it nonlinearly depends on the oil-to-water ratio, but only for low values. The FIo/w values remain at the same level when the oil-to-water ratio exceeds 50 × 10−6. The influence of the type of oil does not manifest itself in an unambiguous way. However, the performed statistical calculations indicate a high similarity in the FIo/w values independent of the type of oil as well as the oil-to-water ratio. Moreover, no case was found where the value of FIo/w for seawater exposed to oil was not different from the value of FIo/w for natural seawater. At an oil-to-water ratio below 0.5 × 10⁻⁶, the detection of oil with the FIo/w indicator is probably possible; however, the quantitative lower limit of detection is not yet specified. In turn, to check the effectiveness of the method against weathered oils and their mixtures, separate research is needed. A possible future-oriented immersion sensor in its structure would have to reflect the idea described in this work (i.e., be equipped with an excitation channel (225 nm) and two emission channels (340 and 355 nm)). The listed wavelengths refer to the area of the Gulf of Gdańsk (Baltic Sea); therefore, in relation to other sea areas, the values of these wavelengths should be verified and possibly corrected.
Author Contributions
Conceptualization, E.B. and Z.O.; methodology, E.B; formal analysis, E.B.; investigation, E.B. and Z.O; data curation, E.B. and Z.O; writing—original draft preparation, E.B.; writing—review and editing, Z.O; visualization, E.B. and Z.O.
Acknowledgments
This paper was supported by a Gdynia Maritime University grant, No. WM/2019/PZ/05.
Conflicts of Interest
The authors declare no conflict of interest.
References
- IMO. The International Convention for the Prevention of Pollution from Ships (MARPOL), 1973 as Modified by the Protocol of 1978. Available online: http://www.imo.org/en/About/conventions/listofconventions/pages/international-convention-for-the-prevention-of-pollution-from-ships-(marpol).aspx (accessed on 1 July 2019).
- Wang, Z. Oil Fingerprinting and Spill Source Identification; Davidson, W.F., Lee, K., Cogswell, A., Eds.; Oil Spill Response: A Global Perspective; NATO Science for Peace and Security Series C: Environmental Security; Springer: Dordrecht, The Netherlands, 2008. [Google Scholar]
- Fingas, M. The Basics of oil Spill Cleanup, 3rd ed.; CRC Press: Boca Raton, FL, USA, 2012. [Google Scholar]
- Fingas, M. Oil Spill Science and Technology, 2nd ed.; Gulf Professional Publishing: Houston, TX, USA, 2016. [Google Scholar]
- Fingas, M. Marine Oil Spills 2018. J. Mar. Sci. Eng. 2019, 7, 82. [Google Scholar] [CrossRef]
- Migliacci, M.; Gambardella, A.; Tranfaglia, M. SAR Polarimetry. To Observe Oil Spills. IEEE Trans. Geosci. Remote Sens. 2007, 43, 506–511. [Google Scholar] [CrossRef]
- Robbe, N.; Zielinski, O. Airborne remote sensing of oil spills-analysis and fusion of multi-spectral near-range data. J. Mar. Sci. Environ. 2004, 2, 19–27. [Google Scholar]
- Hu, C.; Feng, L.; Holmes, J.; Swayze, G.A.; Leifer, I.; Melton, C.; Garcia, O.; Macdonald, I.; Hess, M.; Muller-Karger, F.; et al. Remote sensing estimation of surface oil volume during the 2010 Deepwater Horizon oil blowout in the Gulf of Mexico: Scaling up AVIRIS observations with MODIS measurements. J. Appl. Remote Sens. 2018, 12, 026008. [Google Scholar] [CrossRef]
- Leifer, I.; Lehr, W.J.; Beatty, D.S.; Bradley, E.; Clark, R.; Dennison, P.; Hu, Y.; Matheson, S.; Jones, C.E.; Holt, B.; et al. State of the art satellite and airborne marine oil spill remote sensing: Application to the BP Deepwater Horizon oil spill. Remote Sens. Environ. 2012, 124, 185–209. [Google Scholar] [CrossRef]
- Downare, T.D.; Mullinst, O.C. Visible and Near-Infrared Fluorescence of Crude Oils. Appl. Spectrosc. 1995, 49, 754–776. [Google Scholar] [CrossRef]
- Wang, Z.; Stout, S. Oil Spill Environmental Forensics: Fingerprinting and Source Identification, 2nd ed.; Academic Press, Elsevier: London, UK, 2016. [Google Scholar]
- Skou, N.; Sorensen, B.; Poulson, A. A New Airborne Dual Frequency Microwave Radiometer for Mapping and Quantifying Mineral Oil on the Sea Surface. In Proceedings of the Second Thematic Conference on Remote Sensing for Marine and Coastal Environments, ERIM Conferences, Ann Arbor, MI, USA, 9–12 May 1994; pp. II559–II565. [Google Scholar]
- Sun, S.; Hu, C.; Feng, L.; Swayze, G.A.; Holmes, J.; Graettinger, G.; MacDonald, I.; Garcia, O.; Leifer, I. Oil slick morphology derived from AVRIS measurements of the Deepwater Horizon oil spill: Implications for spatial resolution requirements of remote sensors. Mar. Pollut. Bull. 2016, 103, 276–285. [Google Scholar] [CrossRef] [PubMed]
- Garcia-Pineda, O.; MacDonald, I.; Hu, C.; Svejkovsky, J.; Hess, M.; Dukhovskoy, D.; Morey, S.L. Detection of floating oil anomalies from the Deepwater Horizon oil spill with synthetic aperture radar. Oceanography 2013, 26, 124–137. [Google Scholar] [CrossRef]
- Zielinski, O.; Busch, J.A.; Cembella, A.D.; Daly, K.L.; Engelbrektsson, J.; Hannides, A.K.; Schmidt, H. Detecting marine hazardous substances and organisms: Sensors for pollutants, toxins and pathogens. Ocean Sci. 2009, 5, 329–349. [Google Scholar] [CrossRef]
- Patra, D.; Mishra, A.K. Total synchronous fluorescence scan spectra of petroleum products. Anal. Bioanal. Chem. 2002, 373, 304–309. [Google Scholar] [CrossRef] [PubMed]
- Poryvkina, L.; Babichenko, S.; Davydova, O. SFS characterisation of oil pollution in natural water. In Proceedings of the 5th International Conference on Remote Sensing for Marine and Coastal Environments, San Diego, CA, USA, 5–7 October 1998; Volume 2, pp. 520–524. [Google Scholar]
- Baszanowska, E.; Otremba, Z. Modification of optical properties of seawater exposed to oil contaminants based on excitation-emission spectra. J. Eur. Opt. Soc. Rap. Public 2015, 10, 10047. Available online: http://www.jeos.org/index.php/jeos_rp/article/view/15047 (accessed on 30 June 2019). [CrossRef]
- Zhou, Z.; Guo, L.; Shiller, A.M.; Lohrenz, S.E.; Asper, V.L.; Osburn, C.L. Characterization of oil components from the Deepwater Horizon oil spill in the Gulf of Mexico using fluorescence EEM and PARAFAC techniques. Mar. Chem. 2013, 148, 10–21. [Google Scholar] [CrossRef]
- Zhou, Z.; Liu, Z.; Guo, L. Chemical evolution of Macondo crude oil during laboratory degradation as characterized by fluorescence EEMs and hydrocarbon composition. Mar. Pollut. Bull. 2013, 66, 164–175. [Google Scholar] [CrossRef] [PubMed]
- Conmy, R.N.; Coble, P.G.; Farr, J.; Wood, A.M.; Lee, K.; Pegau, W.S.; Walsh, I.D.; Koch, C.R.; Abercrombie, M.I.; Miles, M.S.; et al. Submersible Optical Sensors Exposed to Chemically Dispersed Crude Oil: Wave Tank Simulations for Improved Oil Spill Monitoring. Environ. Sci. Technol. 2014, 48, 1803–1810. [Google Scholar] [CrossRef] [PubMed]
- Tedetti, M.; Guigue, C.; Goutx, M. Utilization of a submersible UV fluorometer for monitoring anthropogenic inputs in the Mediterranean coastal waters. Mar. Pollut. Bull. 2010, 60, 350–362. [Google Scholar] [CrossRef] [PubMed]
- Hou, Y.; Li, Y.; Liu, B.; Liu, Y.; Wang, T. Design and Implementation of a Coastal-Mounted Sensor for Oil Film Detection on Seawater. Sensors 2017, 18, 70. [Google Scholar] [CrossRef] [PubMed]
- Baszanowska, E.; Otremba, Z. Fluorometric index for sensing oil in the sea environment. Sensors 2017, 17, 1276. [Google Scholar] [CrossRef] [PubMed]
- Wakeman, S.G. Synchronous fluorescence spectroscopy and its application to indigenous and petroleum-derived hydrocarbons in lacustrine sediments. Environ. Sci. Technol. 1997, 11, 272–276. [Google Scholar]
- Mendoza, W.G.; Riemer, D.D.; Zika, R.G. Application of fluorescence and PARAFAC to assess vertical distribution of subsurface hydrocarbons and dispersant during the Deepwater Horizon oil spill. Environ. Sci. 2013, 15, 1017–1030. [Google Scholar] [CrossRef] [PubMed]
- Zhou, Z.; Guo, L.; Osburn, C.L. Fluorescence EEMs and PARAFAC Techniques in the Analysis of Petroleum Components in the Water Column. In Hydrocarbon and Lipid Microbiology Protocols; McGenity, T., Timmis, K., Nogales, B., Eds.; Springer Protocols Handbooks, Springer: Berlin/Heidelberg, Germany, 2015. [Google Scholar]
- Bugden, J.B.C.; Yeung, C.W.; Kepkay, P.E.; Lee, K. Application of ultraviolet fluorometry and excitation–emission matrix spectroscopy (EEMs) to fingerprint oil and chemically dispersed oil in seawater. Mar. Pollut. Bull. 2008, 56, 677–685. Available online: http://www.ncbi.nlm.nih.gov/pubmed/18304589 (accessed on 30 June 2019). [CrossRef] [PubMed]
© 2019 by the authors. Licensee MDPI, Basel, Switzerland. This article is an open access article distributed under the terms and conditions of the Creative Commons Attribution (CC BY) license (http://creativecommons.org/licenses/by/4.0/).