Combination of High- and Low-Rate GPS Receivers for Monitoring Wind-Induced Response of Tall Buildings

Abstract
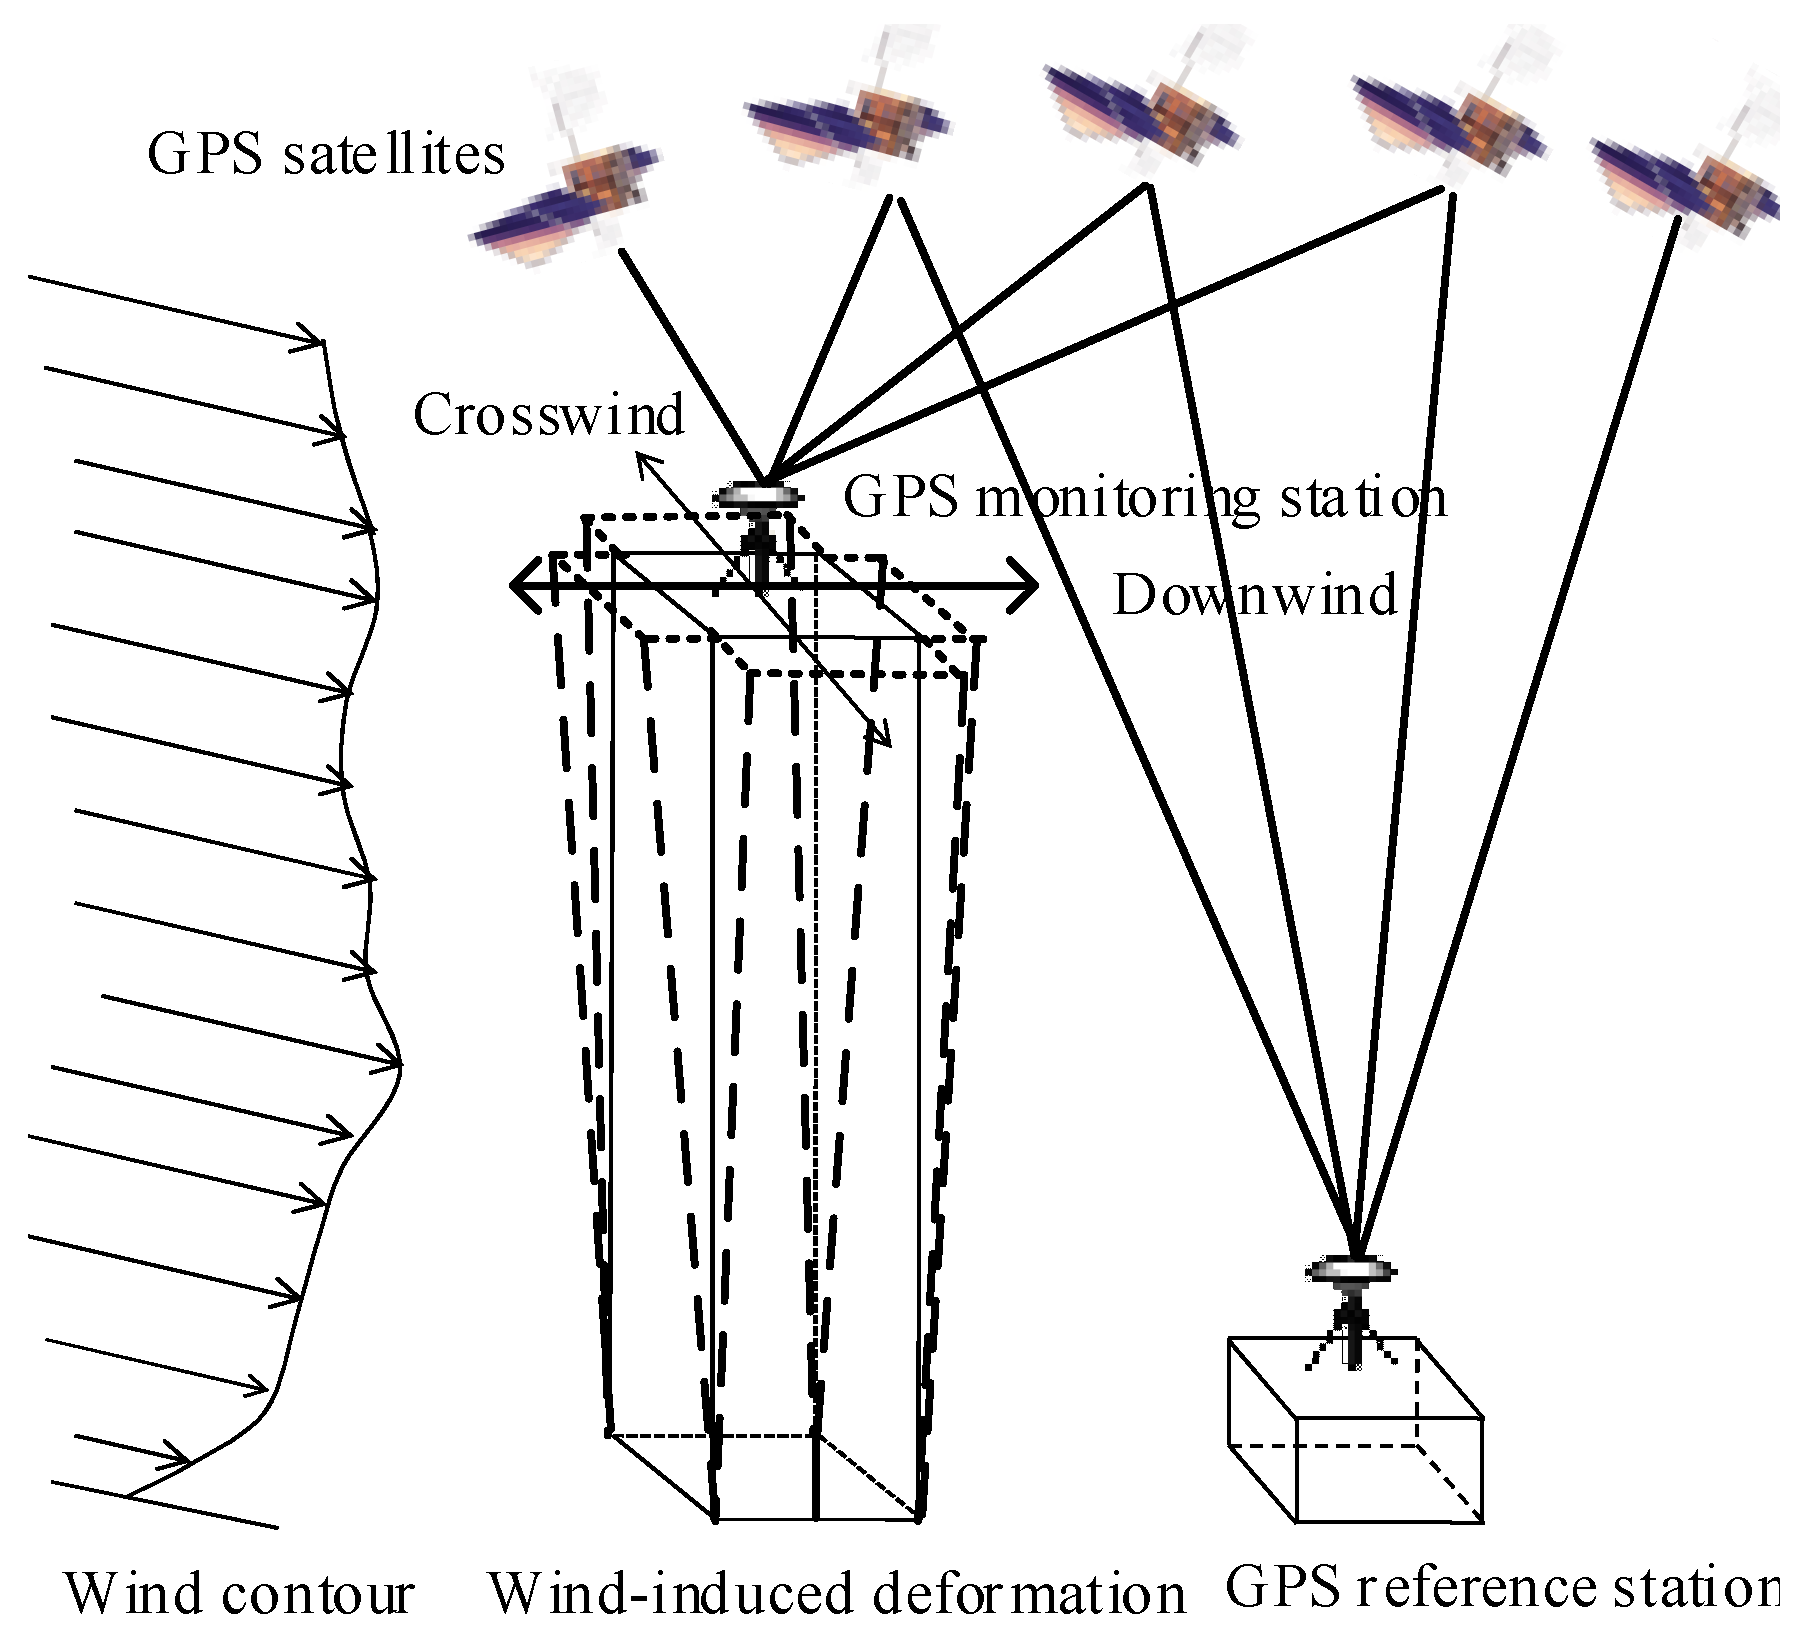
1. Introduction
2. Combination of High- and Low-Rate GPS Receivers
2.1. Single-Epoch Relative Positioning
2.2. Time-Differenced Positioning
2.3. Combination Adjustment
3. Simulation Experiment
3.1. Experiment Design
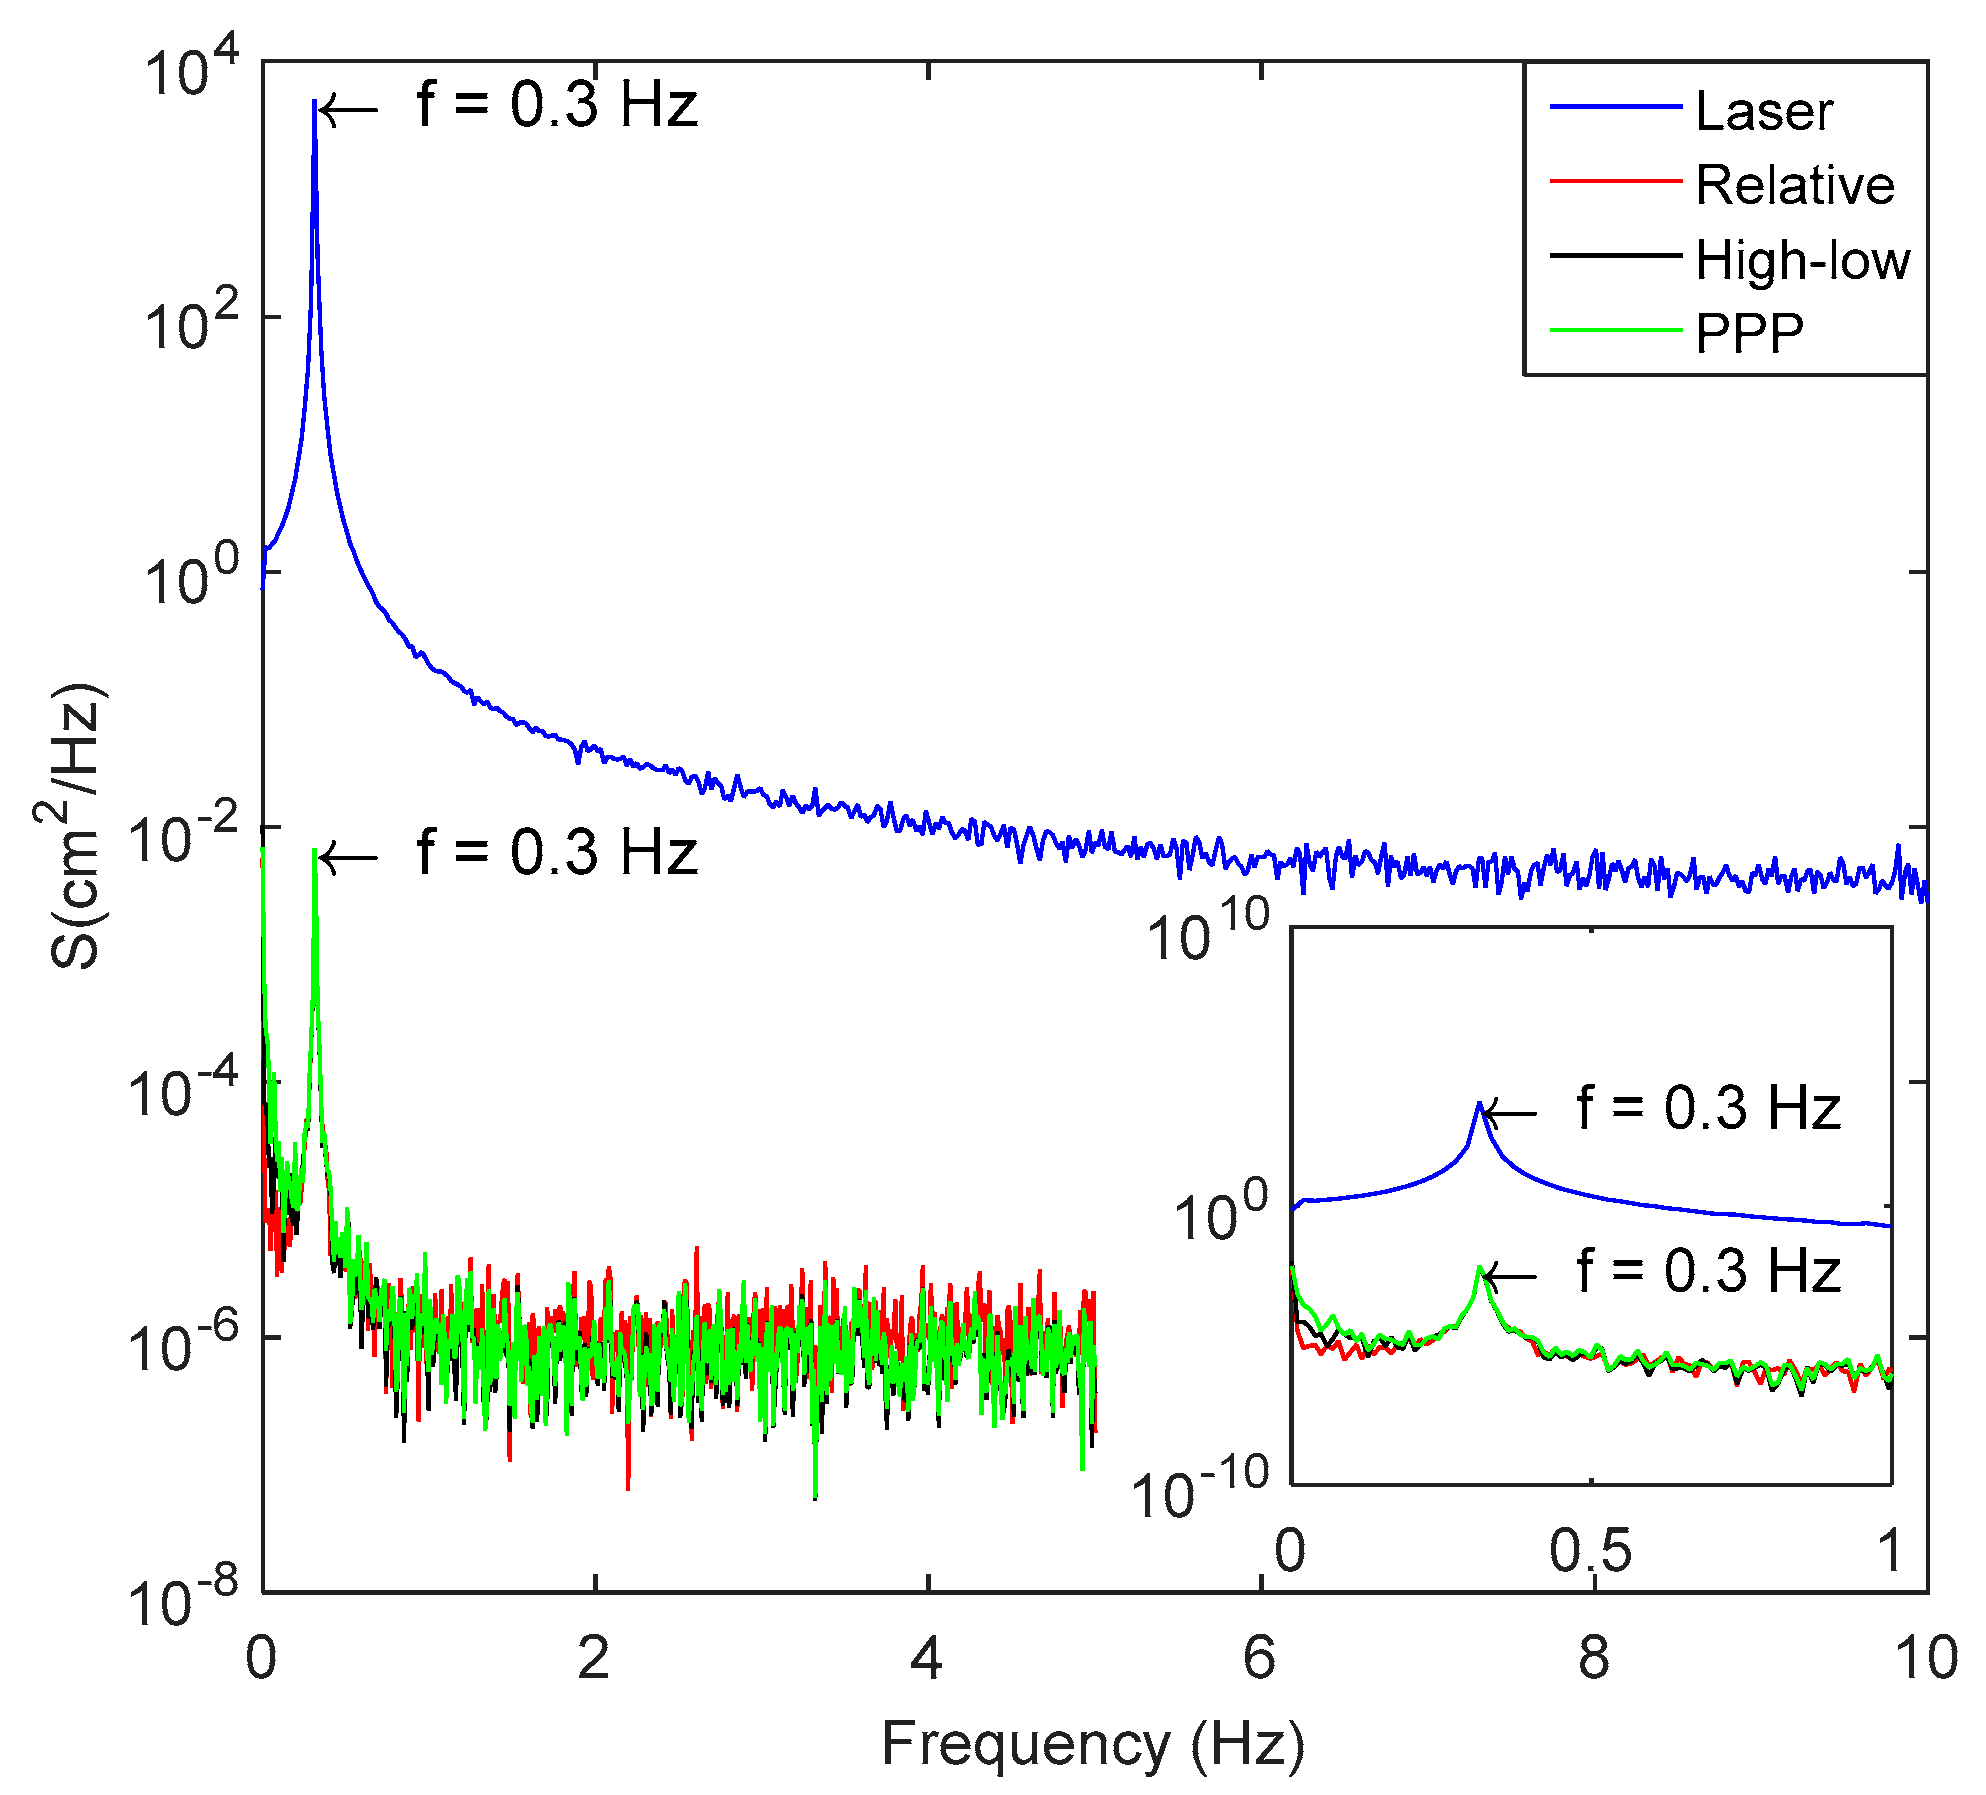
3.2. Data Processing and Result Analysis
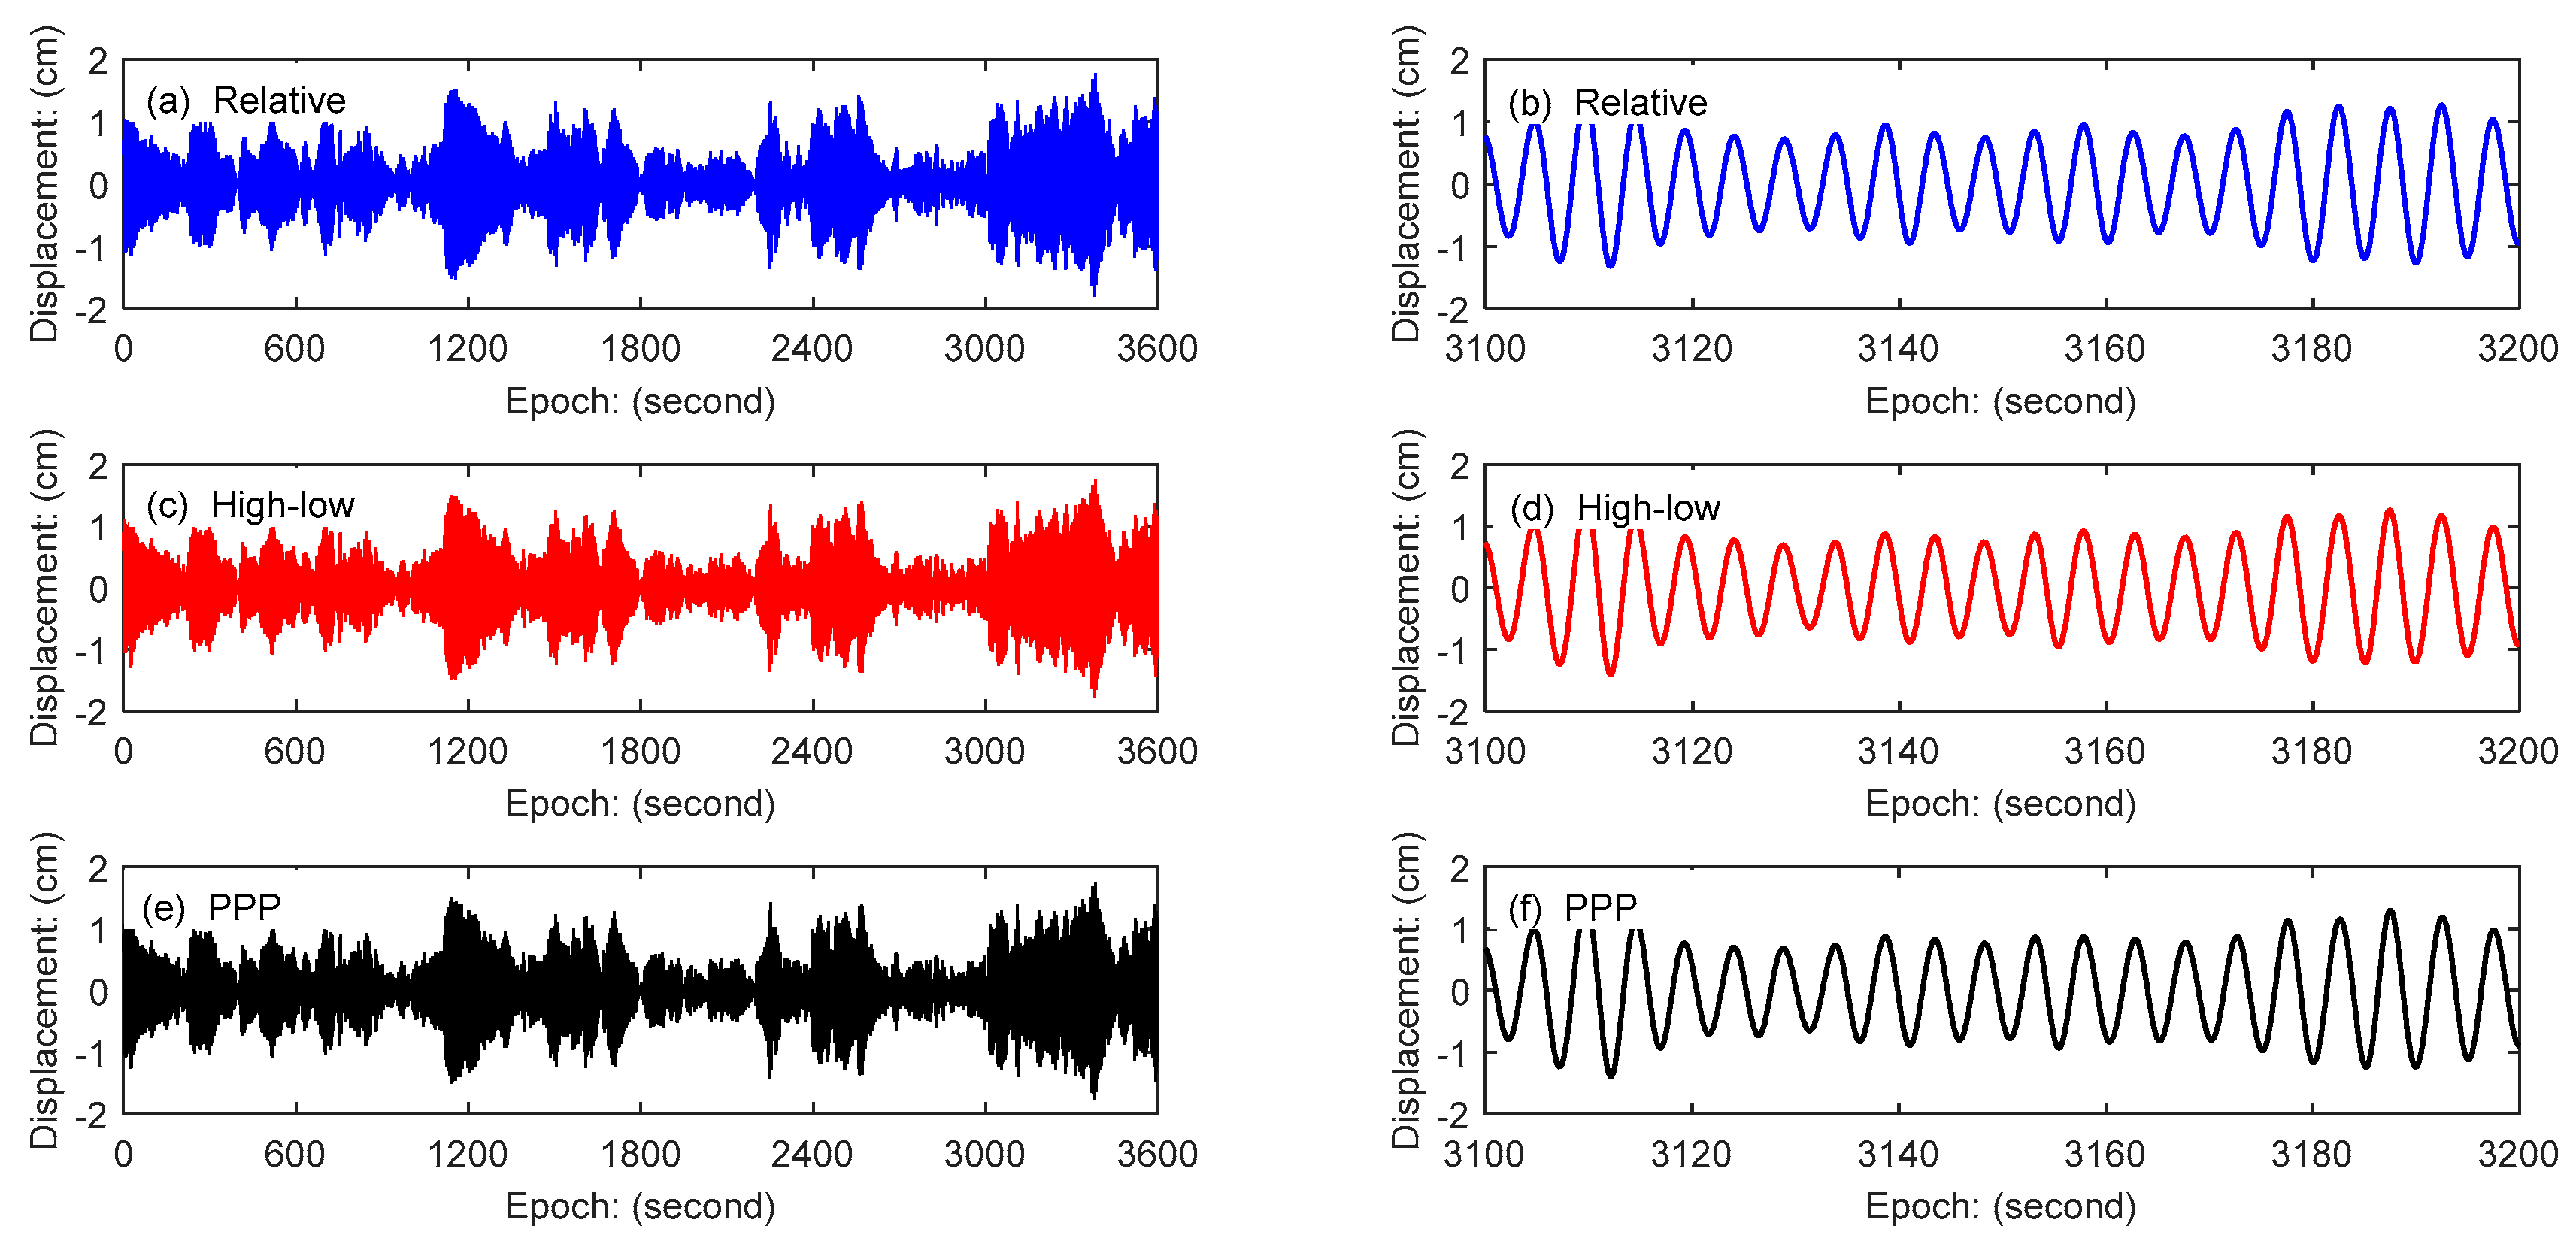
- Scheme 1: 10 Hz observation data of reference and monitoring stations are processed by single-epoch relative positioning technology (hereafter referred to as relative positioning method).
- Scheme 2: 10 Hz observation data of monitoring station is processed by the PPP technology (hereafter referred to as the PPP method).
- Scheme 3: 30 s observation data of the reference station and the 10 Hz observation data of the monitoring station are processed by the combining high- and low-rate GPS positioning method proposed in this paper (hereafter referred to as the combining high- and low-rate GPS method).
4. Experiment with Real Data
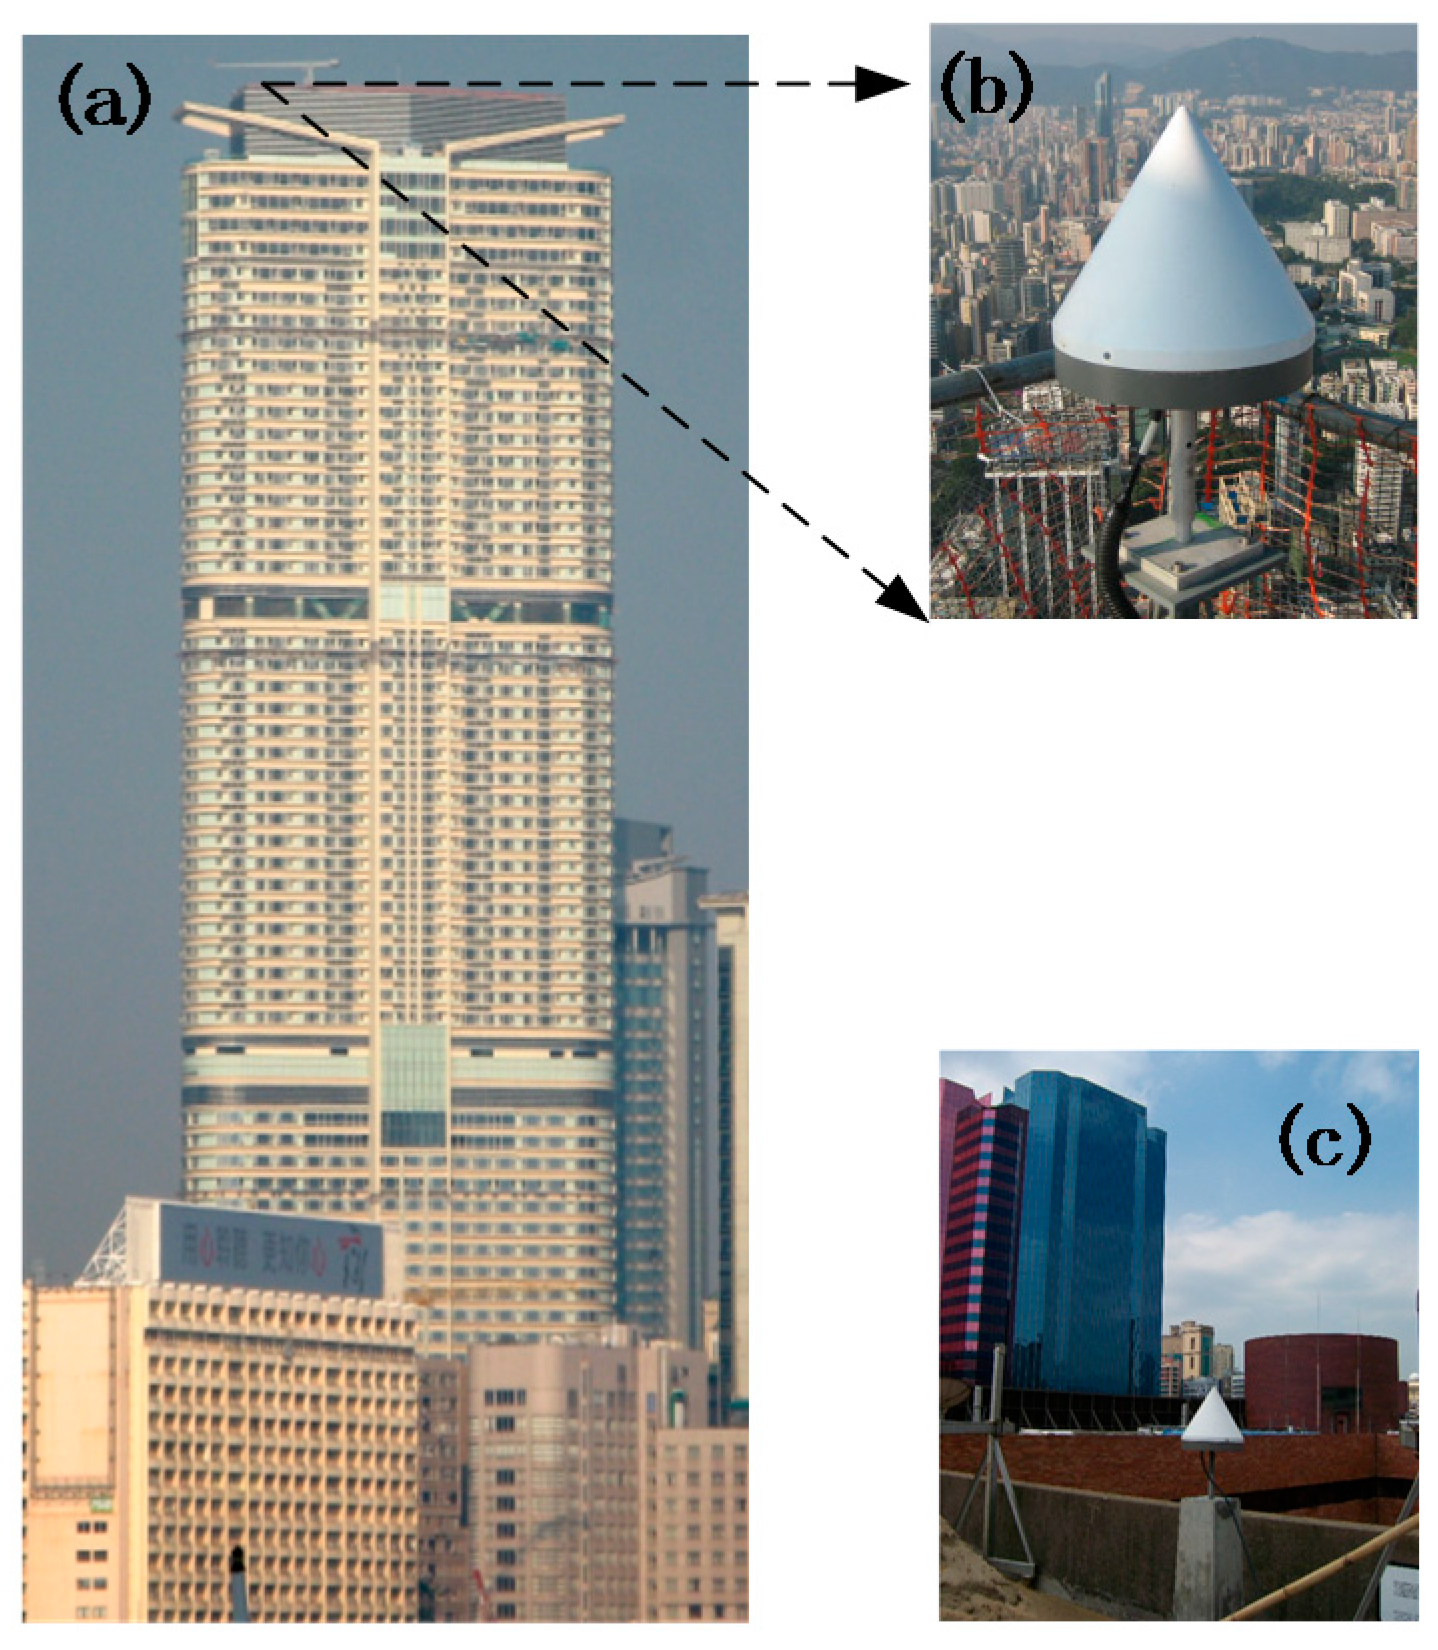
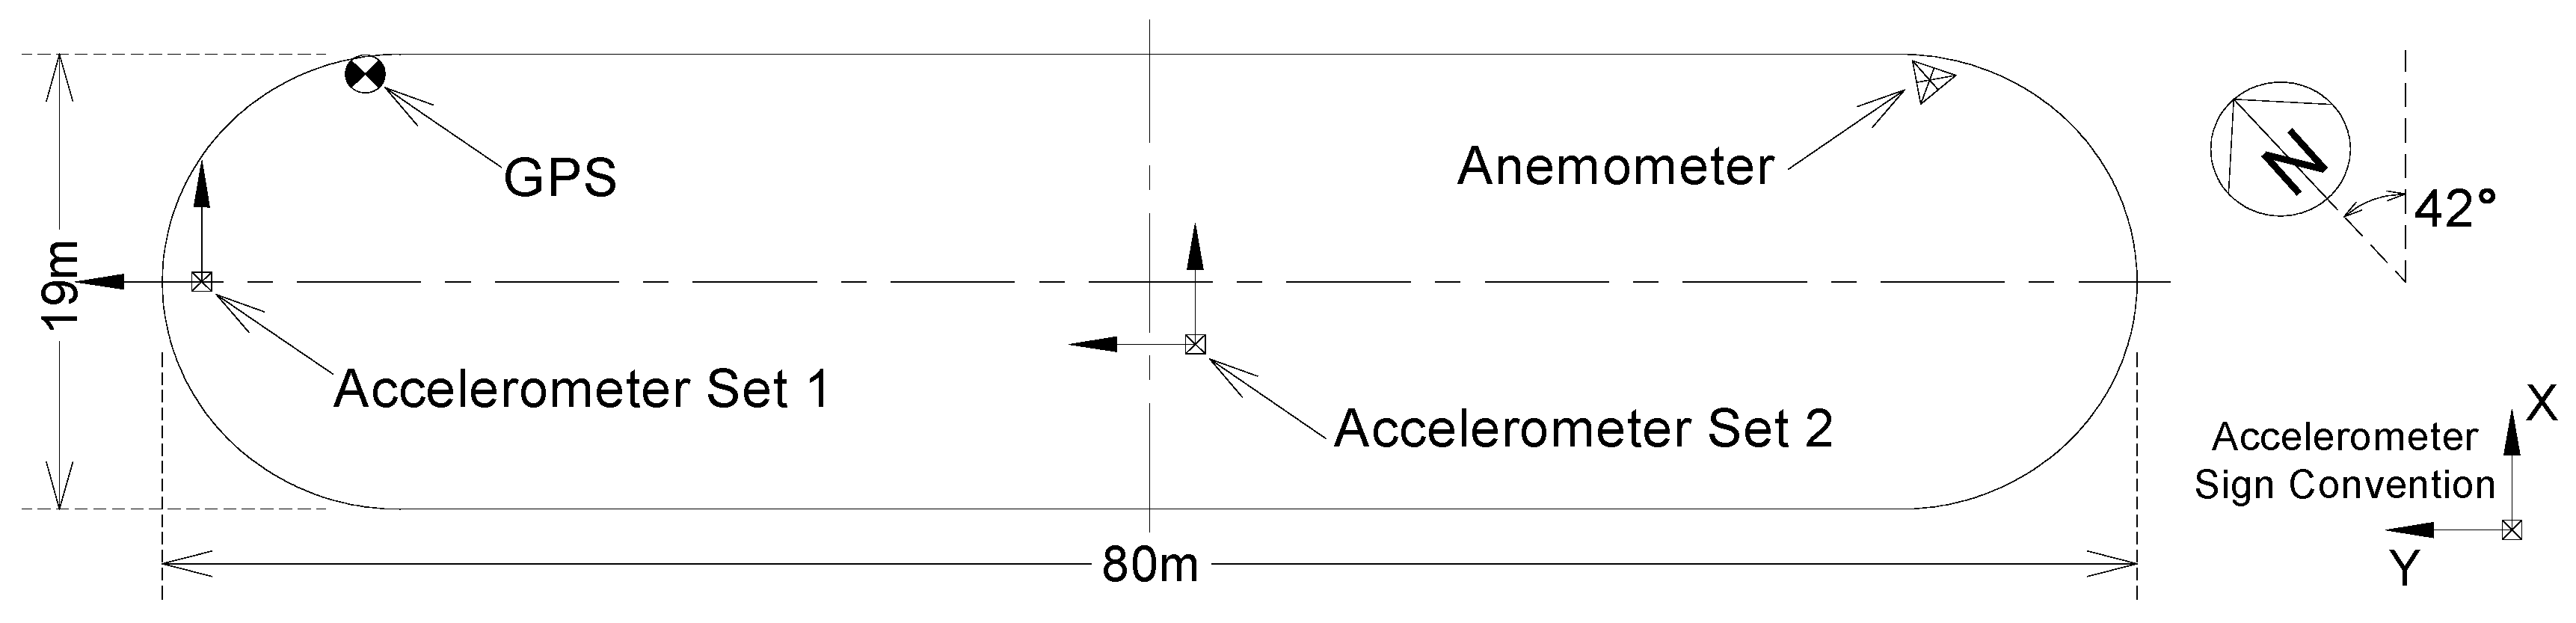
4.1. Data Acquisition
4.2. Analysis of Monitoring Results
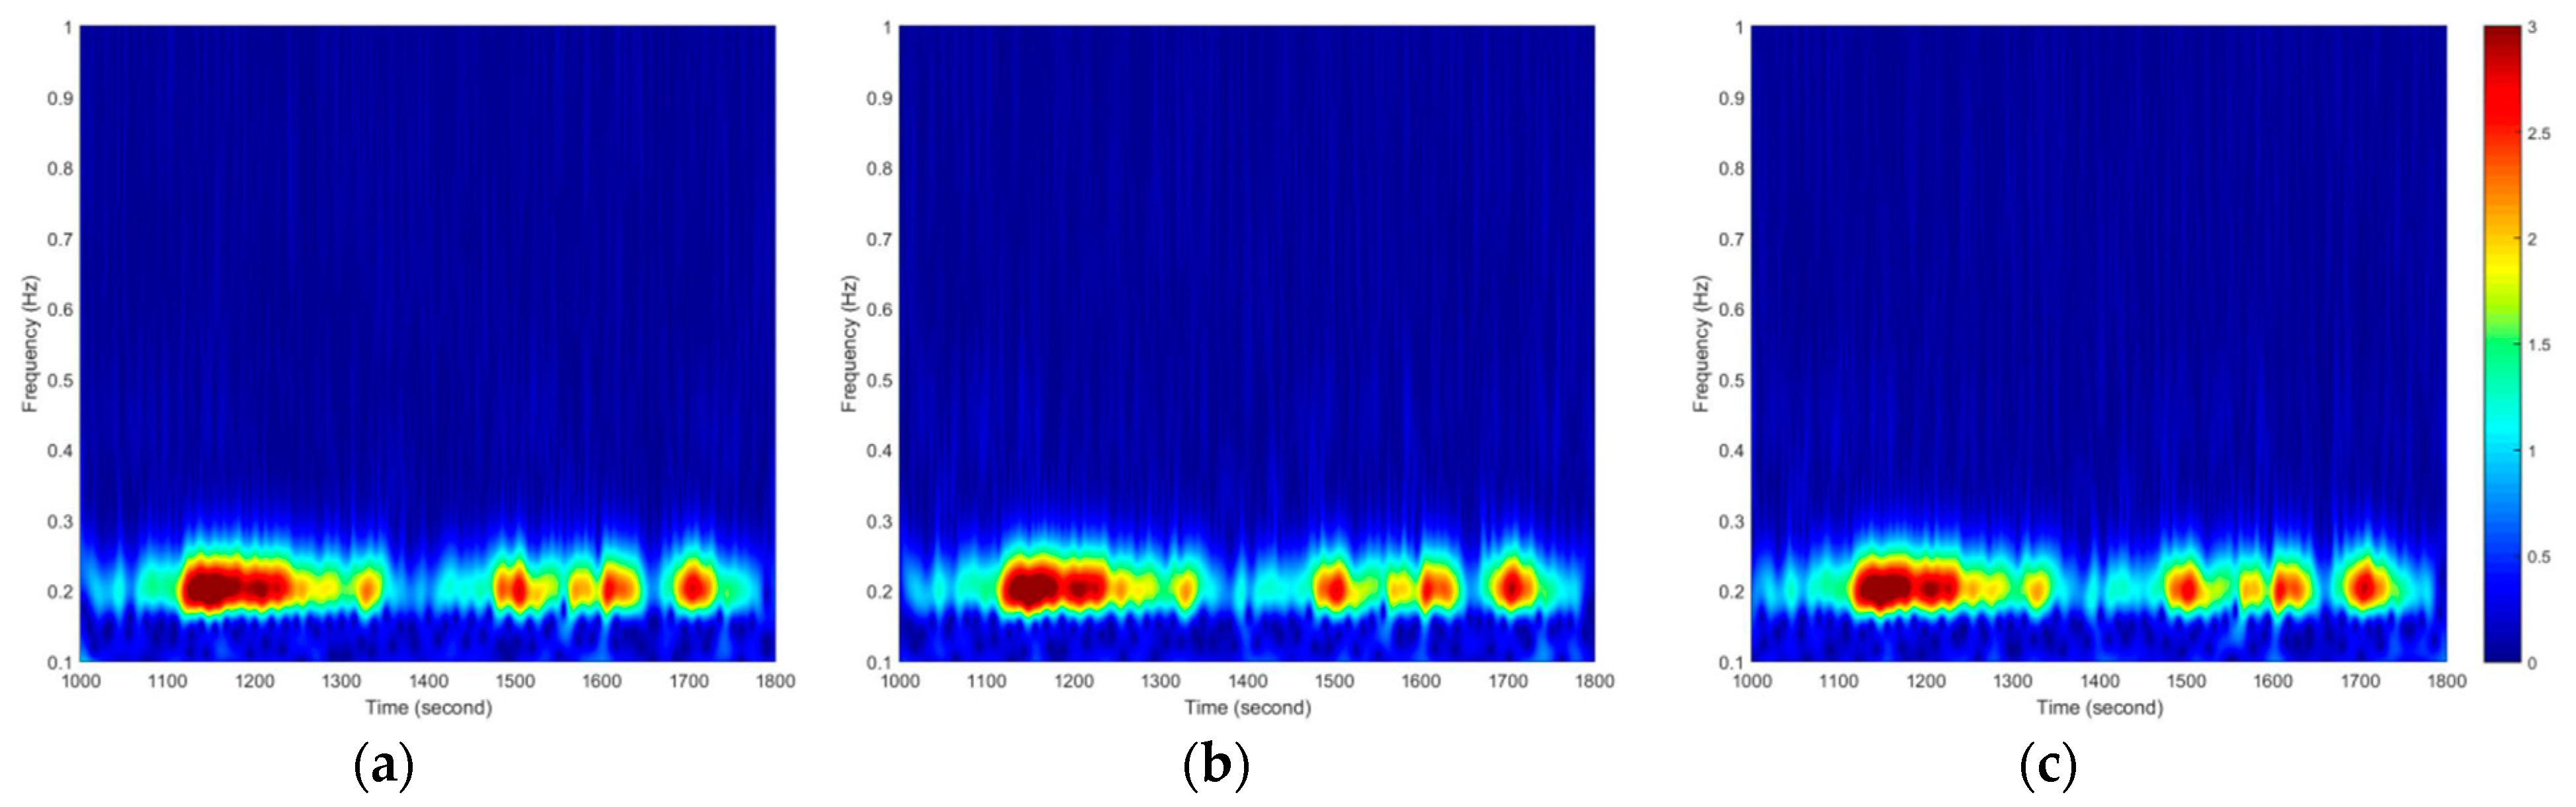
4.2.1. Modal Parameter Identification
4.2.2. Wind-Induced Vibration Displacement Analysis
4.2.3. Wind-Induced Quasi-Static Deformation Analysis
5. Conclusions
Author Contributions
Funding
Acknowledgments
Conflicts of Interest
References
- Kuang, C.L.; Kwok, K.C.S.; Hitchcock, P.A.; Ding, X.L. Wind-induced response characteristics of a tall building from GPS and accelerometer measurements. Positioning 2011, 2, 1–13. [Google Scholar] [CrossRef][Green Version]
- Breuer, P.; Chmielewski, T.; Górski, P.; Konopka, E.; Tarczyński, L. Monitoring horizontal displacements in a vertical profile of a tall industrial chimney using Global Positioning System technology for detecting dynamic characteristics. Struct. Control. Health Monit. 2015, 22, 1002–1023. [Google Scholar] [CrossRef]
- Kijewski-Correa, T.; Asce, M.; Kareem, A. Experimental Verification and Full-Scale Deployment of Global Positioning Systems to Monitor the Dynamic Response of Tall Buildings. J. Struct. Eng. 2006, 132, 1242–1253. [Google Scholar] [CrossRef]
- Górski, P. Dynamic characteristic of tall industrial chimney estimated from GPS measurement and frequency domain decomposition. Eng. Struct. 2017, 148, 277–292. [Google Scholar] [CrossRef]
- Kwok, K.C.S.; Hitchcock, P.A.; Burton, M.D. Perception of vibration and occupant comfort in wind-excited tall buildings. J. Wind Eng. Ind. Aerodyn. 2009, 97, 368–380. [Google Scholar] [CrossRef]
- Wu, J.R. Field measurements and numerical study and wind effects on tall building. Ph.D. Thesis, City University of Hong Kong, Hong Kong, China, 2006. [Google Scholar]
- Yu, J.; Zhu, P.; Xu, B.; Meng, X. Experimental assessment of high sampling-rate robotic total station for monitoring bridge dynamic responses. Measurement 2017, 104, 60–69. [Google Scholar] [CrossRef]
- Marendić, A.; Paar, R.; Damjanović, D. Measurement of bridge dynamic displacements and natural frequencies by RTS. Građevinar 2017, 69, 281–294. [Google Scholar]
- Silva, I.D.; Ibañez, W.; Poleszuk, G. Experience of Using Total Station and GNSS Technologies for Tall Building Construction Monitoring. In Proceedings of the International Congress and Exhibition “Sustainable Civil Infrastructures: Innovative Infrastructure Geotechnology”, Cairo, Egypt, 24–28 November 2017; pp. 471–486. [Google Scholar]
- Dai, W.J. A Study of Data Processing for Precise Dynamic Deformation Monitoring Using GPS. Ph.D. Thesis, Central South University, Changsha, China, 2007. [Google Scholar]
- Dai, W.J.; Zhu, J.J.; Ding, X.L. Single Epoch Ambiguity Resolution in Structure Monitoring Using GPS. Geomat. Inf. Sci. Wuhan Univ. 2007, 32, 234–237. [Google Scholar]
- Yi, T.H.; Li, H.N.; Gu, M. Experimental assessment of high-rate GPS receivers for deformation monitoring of bridge. Measurement 2013, 46, 420–432. [Google Scholar] [CrossRef]
- Yi, T.H.; Li, H.N.; Gu, M. Wavelet based multi-step filtering method for bridge healthmonitoring using GPS and accelerometer. Smart Struct. Syst. 2013, 11, 331–348. [Google Scholar] [CrossRef]
- Yi, T.H.; Li, H.N.; Gu, M. Recent research and applications of GPS-based monitoring technology for high-rise structures. Struct. Control. Health Monit. 2013, 20, 649–670. [Google Scholar] [CrossRef]
- Tamuraa, Y.; Matsuib, M.; Pagninic, L.-C.; Ishibashid, R.; Yoshidaa, A. Measurement of wind-induced response of buildings using RTK-GPS. J. Wind Eng. Ind. Aerodyn. 2002, 90, 1783–1793. [Google Scholar] [CrossRef]
- Elnabwy, M.T.; Kaloop, M.R.; Elbeltagi, E. Talkha steel highway bridge monitoring and movement identification using RTK-GPS technique. Measurement 2013, 46, 4282–4292. [Google Scholar] [CrossRef]
- Yu, J.; Meng, X.; Shao, X.; Yan, B.; Yang, L. Identification of dynamic displacements and modal frequencies of a medium-span suspension bridge using multimode GNSS processing. Eng. Struct. 2014, 81, 432–443. [Google Scholar] [CrossRef]
- Xi, R.; Jiang, W.; Meng, X.; Chena, H.; Chen, Q. Bridge monitoring using BDS-RTK and GPS-RTK techniques. Measurement 2018, 120, 128–139. [Google Scholar] [CrossRef]
- Kuang, C.L.; Yi, Z.H.; Dai, W.J.; Zeng, F. Measuring wind-induced response characteristics of tall building based on GPS PPP method. J. Cent. South Univ. Sci. Technol. 2013, 11, 4588–4596. [Google Scholar]
- Yigit, C.O. Experimental assessment of post-processed kinematic Precise Point Positioning method for structural health monitoring. Geomat. Nat. Hazard. Risk 2016, 7, 360–383. [Google Scholar] [CrossRef]
- Yigit, C.O.; Coskun, M.Z.; Yavasoglu, H.; Arslanb, A.; Kalkan, Y. The potential of GPS Precise Point Positioning method for point displacement monitoring: A case study. Measurement 2016, 91, 398–404. [Google Scholar] [CrossRef]
- Yigit, C.O.; Gurlek, E. Experimental testing of high-rate GNSS precise point positioning (PPP) method for detecting dynamic vertical displacement response of engineering structures. Geomat. Nat. Hazard. Risk 2017, 8, 893–904. [Google Scholar] [CrossRef]
- Kaloop, M.; Elbeltagi, E.; Hu, J.; Elrefai, A. Recent Advances of Structures Monitoring and Evaluation Using GPS-Time Series Monitoring Systems: A Review. ISPRS Int. J. Geo-Inf. 2017, 6, 382. [Google Scholar] [CrossRef]
- Euler, H.J.; Landau, H. Fast GPS ambiguity resolution on-the-fly for real-time application. In Proceedings of the Sixth International Geodetic Symposium on Satellite Positioning, Columbus, OH, USA, 17–20 March 1992; pp. 650–659. [Google Scholar]
- Hwang, P.Y.C. Kinematic GPS: Resolving integer ambiguities on the fly. In Proceedings of the IEEE Symposium on Position Location and Navigation: A Decade of Excellence in the Navigation Sciences, Las Vegas, NV, USA, 20 March 1990; pp. 579–586. [Google Scholar]
- Abidin, H.Z. On-the-Fly Ambiguity Resolution. GPS World. April 1994, pp. 40–49. Available online: http://folk.uio.no/treiken/GEO4530/On_the_fly_ambiguity_res.PDF (accessed on 8 May 2018).
- Corbett, S.J.; Cross, P.A. GPS single epoch ambiguity resolution. Surv Rev. 1995, 33, 149–160. [Google Scholar] [CrossRef]
- Han, S.W. Quality Control Issues Relating to Instantaneous Ambiguity Resolution for Real-time GPS Kinematic Positioning. J. Geod. 1997, 71, 351–361. [Google Scholar] [CrossRef]
- Han, S.; Rizos, C. Single-Epoch Ambiguity Resolution for Real-time GPS Attitude Determination with the Aid of One-dimensional Optical Fiber Gyro. GPS Solut. 2003, 3, 5–12. [Google Scholar] [CrossRef]
- Yi, T.H.; Li, H.N.; Gu, M. Characterization and extraction of global positioning system multipath signals using an improved particle-filtering algorithm. Meas. Sci. Technol. 2011, 22, 075101. [Google Scholar] [CrossRef]


| Item | Single-Epoch Relative Positioning | Time-Differenced Positioning |
|---|---|---|
| Observations | Double-differenced L1 and L2 code and phase | Time-differenced ionosphere-free phase combination |
| Observation weight | Elevation dependent weight | Elevation dependent weight |
| Satellite obit and clock | Broadcast ephemeris | Precise orbit and clock from IGS |
| Tropospheric delay | Saastamoinen model | Saastamoinen model |
| Mapping function | Global Mapping Function (GMF) | Global Mapping Function (GMF) |
| Ionospheric delay | Neglected | First order effect eliminated by ionosphere-free linear combination |
© 2018 by the authors. Licensee MDPI, Basel, Switzerland. This article is an open access article distributed under the terms and conditions of the Creative Commons Attribution (CC BY) license (http://creativecommons.org/licenses/by/4.0/).
Share and Cite
Yi, Z.; Kuang, C.; Wang, Y.; Yu, W.; Cai, C.; Dai, W. Combination of High- and Low-Rate GPS Receivers for Monitoring Wind-Induced Response of Tall Buildings. Sensors 2018, 18, 4100. https://doi.org/10.3390/s18124100
Yi Z, Kuang C, Wang Y, Yu W, Cai C, Dai W. Combination of High- and Low-Rate GPS Receivers for Monitoring Wind-Induced Response of Tall Buildings. Sensors. 2018; 18(12):4100. https://doi.org/10.3390/s18124100
Chicago/Turabian StyleYi, Zhonghai, Cuilin Kuang, Yarong Wang, Wenkun Yu, Changsheng Cai, and Wujiao Dai. 2018. "Combination of High- and Low-Rate GPS Receivers for Monitoring Wind-Induced Response of Tall Buildings" Sensors 18, no. 12: 4100. https://doi.org/10.3390/s18124100
APA StyleYi, Z., Kuang, C., Wang, Y., Yu, W., Cai, C., & Dai, W. (2018). Combination of High- and Low-Rate GPS Receivers for Monitoring Wind-Induced Response of Tall Buildings. Sensors, 18(12), 4100. https://doi.org/10.3390/s18124100