Article

Temporal Trends in Reef Fish Diversity and Nutrient Excretion Proxies Across Sites on San Andrés Island, Colombia


by
Amílcar Leví Cupul-Magaña
1,*,
Adriana Santos-Martínez
2 and
Diana Morales-de-Anda
3
1
Laboratorio de Ecología Marina, Centro de Investigaciones Costeras, Centro Universitario de La Costa, Universidad de Guadalajara, Avenida Universidad de Guadalajara No. 203, Puerto Vallarta 48280, Jalisco, Mexico
2
Universidad Nacional de Colombia–Sede Caribe, San Luis Free Town, # 52-44, San Andrés Isla 880001, Colombia
3
Departamento de Recursos del Mar, Cinvestav Mérida, Km. 6 Carretera Antigua a Progreso, Cordemex, Mérida 97319, Yucatán, Mexico
*
Author to whom correspondence should be addressed.
Diversity 2026, 18(4), 198; https://doi.org/10.3390/d18040198
Submission received: 10 February 2026 / Revised: 23 March 2026 / Accepted: 27 March 2026 / Published: 28 March 2026

Abstract

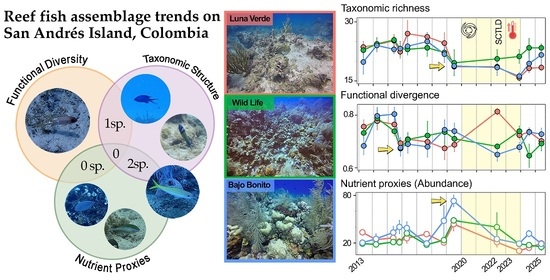
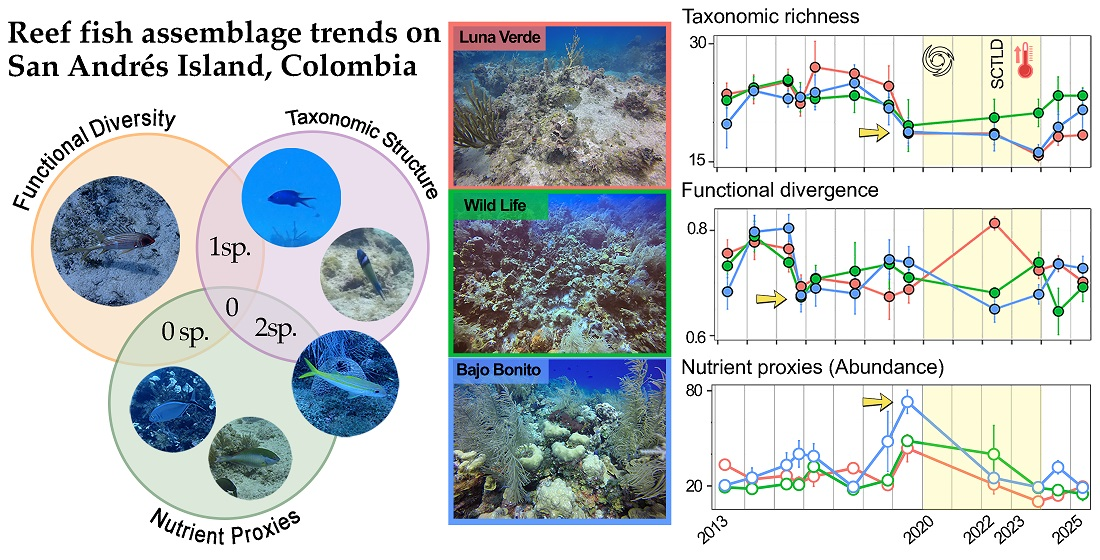
Long-term monitoring is essential for understanding how recurring disturbances, such as hurricanes and coral bleaching, affect reef fish communities and ecosystem processes. This study evaluates temporal trends (2013–2025) in fish assemblage composition, functional diversity, and nutrient excretion proxies (C, N, and P) across three reef sites on San Andrés Island in the Colombian Caribbean. Our results reveal significant shifts in community structure following major disturbances in 2020 (Hurricanes Eta, Iota) and 2023 (mass bleaching event). Taxonomic and functional richness (TRich, FRich) fluctuated throughout the study period, whereas functional divergence (FDiv) declined earlier (2016), highlighting site-specific differences. A trait-based nutrient-excretion proxy (NPC composite score) identified key species that maintain nutrient cycling. Despite recent coral bleaching, certain sites exhibited functional resilience, sustained by the persistence of high-performing nutrient providing species. However, the overall disconnect between taxonomic recovery and functional stability suggests that ecosystem-level processes remain vulnerable, even when species richness appears to recover. This highlights the importance of integrating functional traits and nutrient recycling proxies into monitoring programs to better predict long-term variability in San Andrés Island reefs under a changing climate. Our findings provide a framework for prioritizing management efforts in the Seaflower Biosphere Reserve with emphasis on maintaining ecosystem services.

Graphical Abstract

1. Introduction

Monitoring ecosystem changes over long timescales is vital for identifying trends, dynamics, and gradual shifts, particularly in highly impacted ecosystems like coral reefs [1]. In addition to gradual environmental change, coral reefs experience acute disturbances, such as hurricanes and thermal stress events, which can rapidly alter habitat structure and benthic community composition, thereby reshaping fish assemblages and their ecological functions [2,3]. Determining whether reefs follow consistent trajectories after these events requires approaches that extend beyond species identity and explicitly consider the functional organization of fish assemblages.
Reef fish are widely used as indicators of reef condition and human pressure, as they integrate habitat quality, trophic interactions, and impacts of exploitation. Indicator performance improves when metrics are aligned with ecological mechanisms, for example by focusing on herbivory and fish life-history traits linked to sensitivity to fishing and habitat change [4,5,6].
Beyond describing taxonomic change, functional approaches provide a mechanistic lens to interpret community organization and how reorganization may alter ecological roles. Functional diversity metrics have been shown to detect spatio-temporal change in coral reef fish communities that can be overlooked by taxonomic descriptors alone [7].
A key next step is to link community reorganization directly to ecosystem processes. Reef fishes influence nutrient dynamics both through biomass storage and through excretion of dissolved nutrients that can be immediately available to primary producers. Importantly, species differ markedly in excretion rates and stoichiometry (N:P). Thus, changes in species identity, abundance, and size structure can alter both the magnitude and balance of nutrient supply [8]. Empirical and modeling studies show that fish communities can mediate nutrient storage and supply at reef scales, and that selective harvest can reduce fish-mediated nutrient capacity even without species richness loss [9,10]. Fish-derived nutrients can also shape benthic dynamics by promoting macroalgae under some conditions and suppressing coral recovery, highlighting context-dependent outcomes of bottom-up [11].
Despite these advances, long-term datasets that jointly evaluate temporal changes in reef fish assemblages, functional diversity, and process-oriented indicators remain scarce for insular Caribbean reef systems. San Andrés Island in the Colombian Caribbean region, part of the Seaflower Biosphere Reserve, provides an opportunity to integrate these perspectives and to identify potential different dimensions of ecosystem change in reefs monitored over more than a decade.
Recently, San Andrés Island has been impacted by major disturbances such as hurricanes Eta and Iota in 2020, a mass coral bleaching event in 2023, and coral diseases such as SCTLD, whose combined effect has significantly decreased coral cover from 2020 to 2024, which have promoted changes in the reef fish assemblages through coral reefs degradation [12,13,14].
Our objectives are to: (i) assess whether reef fish have shifted over time and across sites, particularly during years marked by major disturbances; (ii) evaluate changes in functional diversity indicators, such as richness and divergence across these periods and sites; (iii) examine how changes in community composition relate to variation in a trait-based nutrient-excretion potential proxy (C, N, and P) derived from species-level excretion coefficients; and (iv) identify species that consistently influence community abundance or repeatedly emerge as key taxa across taxonomic, functional, and nutrient-proxy criteria.
By linking together long-term changes in functional structure with measures of nutrient recycling processes, this analysis aims to identify early signs of altered ecosystem function following major disturbances. Because different species affect nutrient supply through unique excretion rates and stoichiometries, emphasizing species-specific contributions may provide valuable early warning signals of shifts in ecosystem functioning [1,8,11].

2. Materials and Methods

2.1. Study Area and Site Selection

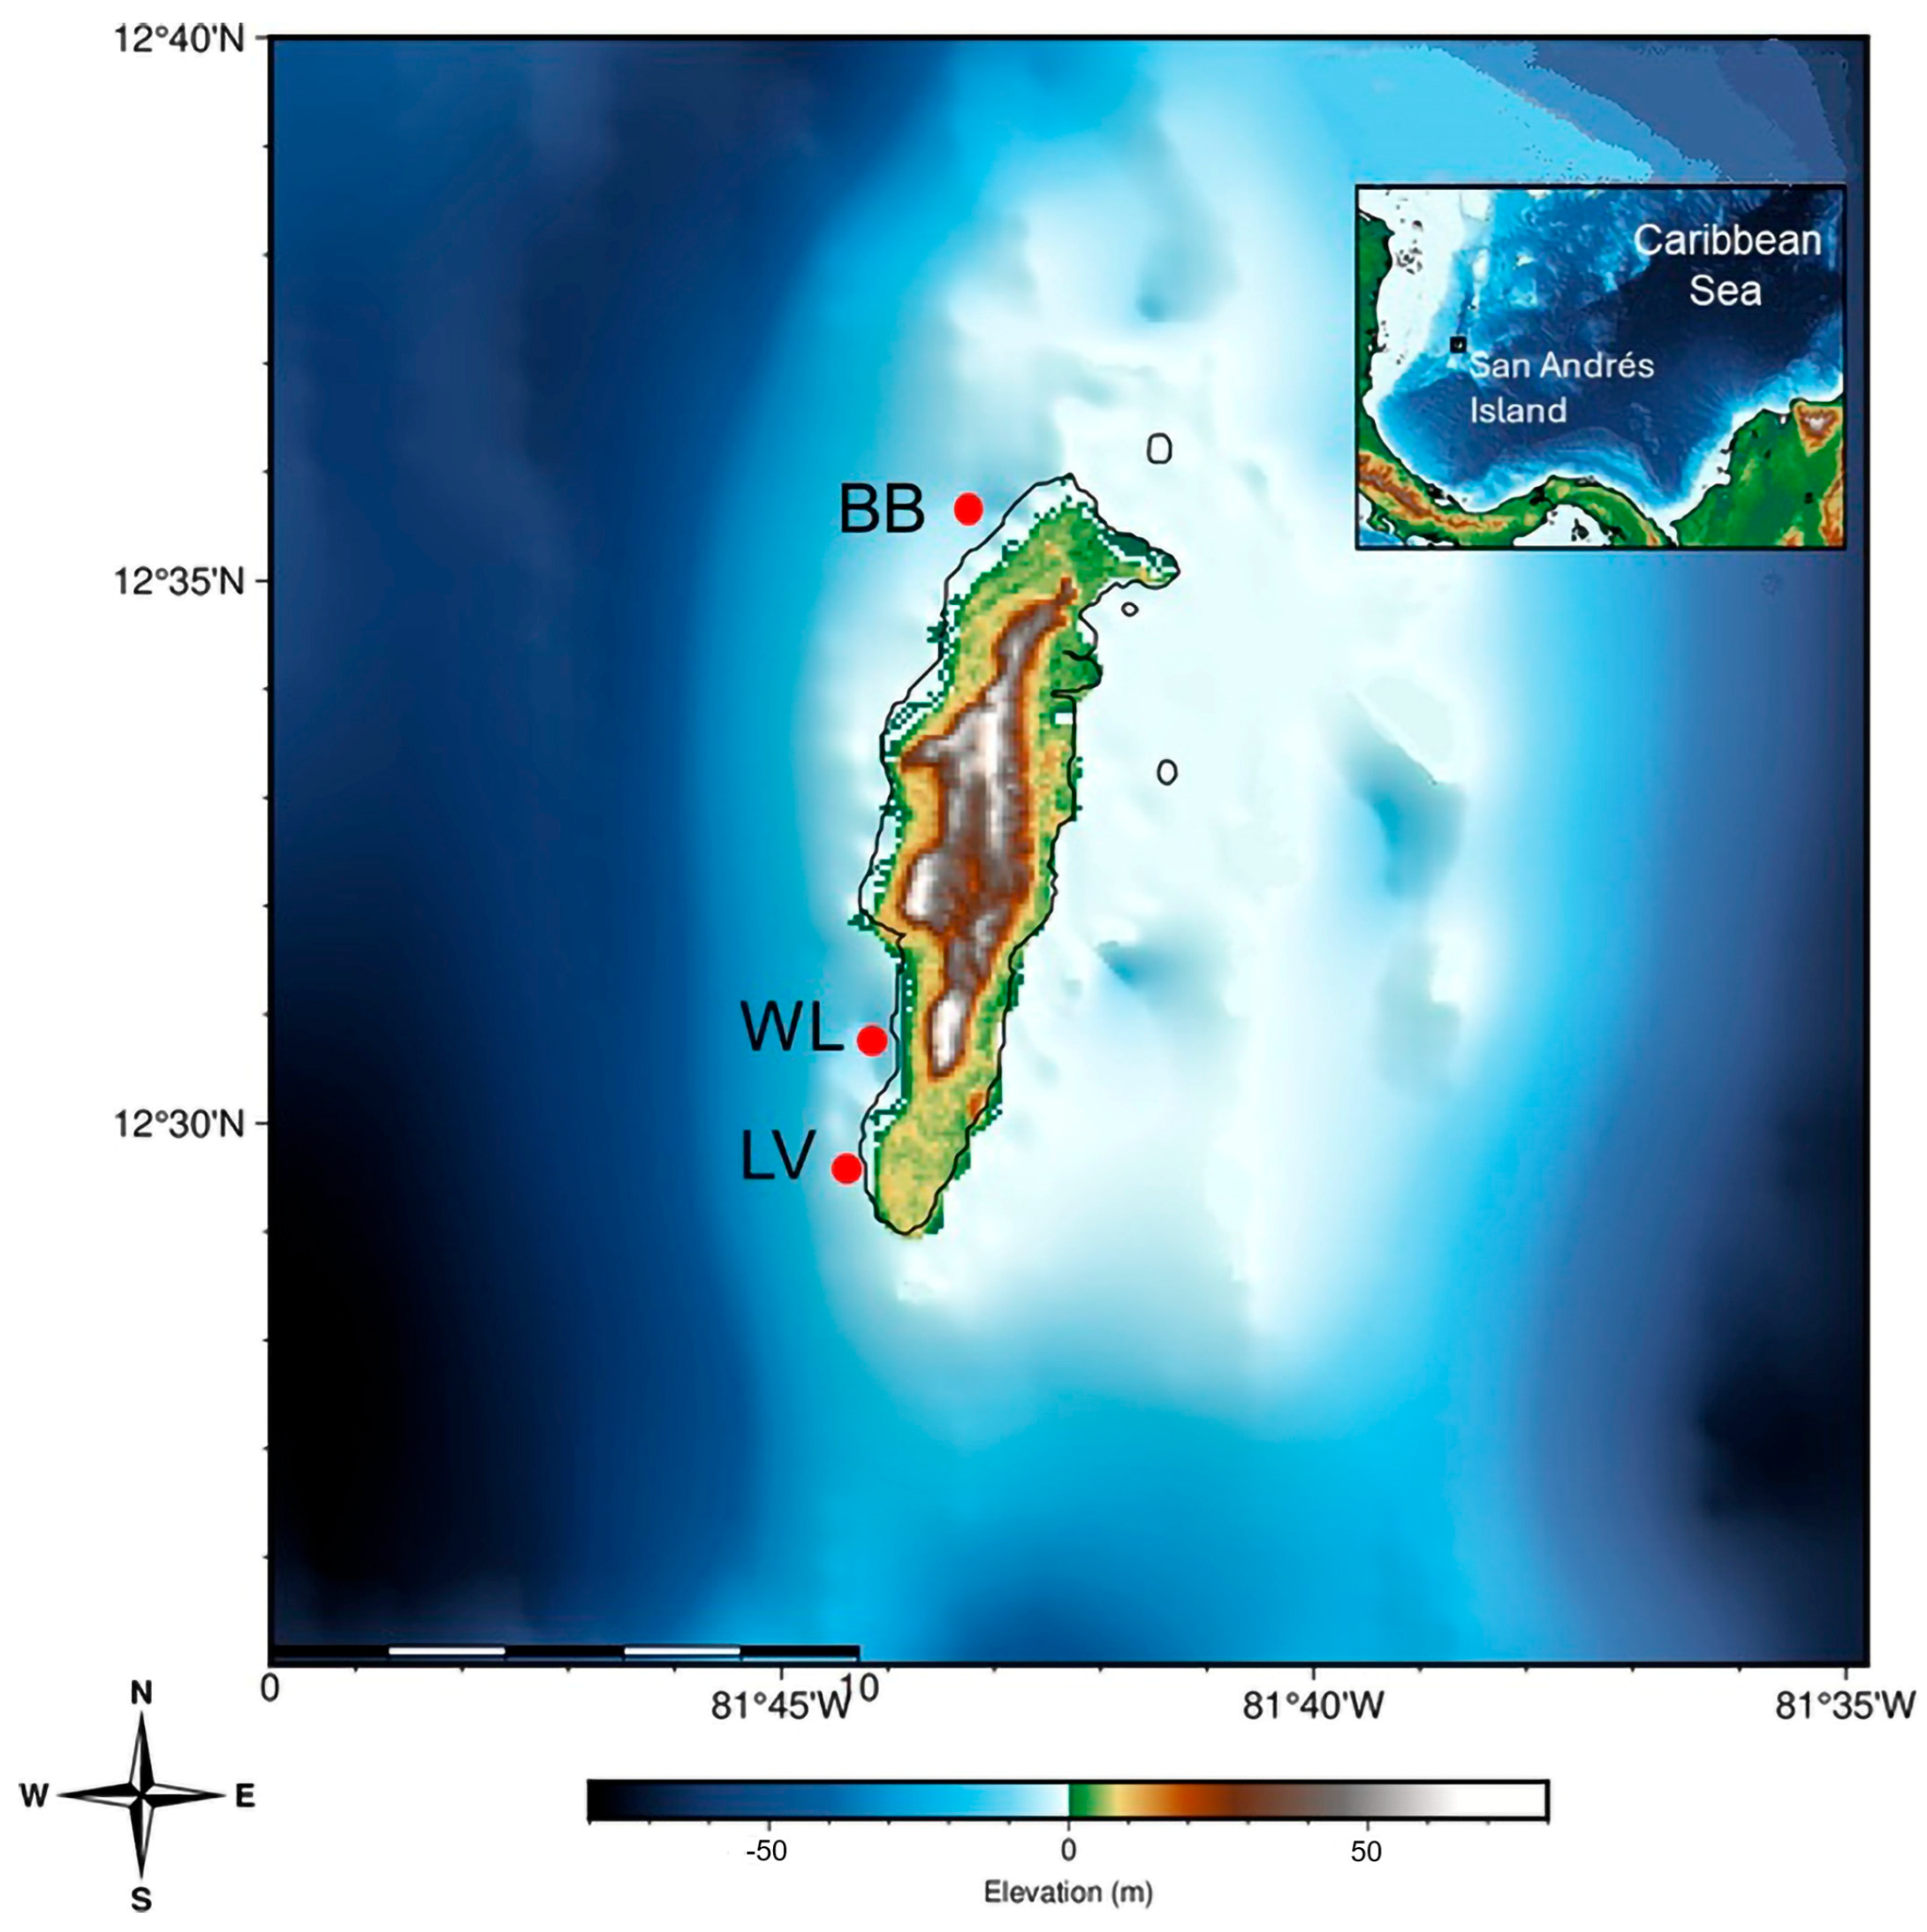
This research was conducted on San Andrés Island in the Colombian Caribbean, within the Seaflower Biosphere Reserve in the Department of the Archipelago of San Andrés, Providencia and Santa Catalina. Three reef sites, Bajo Bonito (BB; 9–14 m), Luna Verde (LV; 6–12 m), and Wild Life (WL; 12–16 m), were selected to capture spatial heterogeneity around the island (Figure 1). The Luna Verde and Wild Life sites are characterized by extensive coral platforms comprising both hard and soft corals, along with algae and sponges, while Bajo Bonito consists of patch reefs surrounded by sandy substrates. The data used in this study are part of an ongoing long-term reef monitoring program conducted by the Universidad Nacional de Colombia Sede Caribe. Fish data collected between 2013 and 2025 (excluding 2020 and 2021 due to COVID 19 lockdowns) were analyzed.

2.2. Fish Data Collection

Fish data were obtained through long-term monitoring conducted on the island as part of a collaboration among multiple institutions and local allies. Visual fish censuses were conducted at each site following WWF methodology [15]. Each survey consisted of five belt transects, each measuring 50 m × 2 m (100 m2 per transect). During each transect, an expert diver recorded all observed species, their abundance, and estimated total length using predefined size-class intervals.

2.3. Fish Traits

To characterize functional differences among fish assemblages, we distinguished between traits describing species’ ecological strategies and traits directly linked to ecosystem processes.
Ecological traits for functional diversity. We assembled a species-by-trait matrix using six traits commonly applied to characterize reef fish ecological strategies: body size class, trophic group, gregariousness, mobility, position in the water column, and diel activity [16]. Traits of fish species can be found in Table S1.
Process-oriented traits for nutrient recycling. We compiled species-level excretion coefficients for carbon, nitrogen, and phosphorus (F0C, F0N, F0P) from the data published by Schiettekatte et al. [17] on https://github.com/nschiett/global_proc (accessed on 3 October 2025). In this study, these coefficients were used to rank species and to build relative excretion-potential proxies, not to estimate absolute excretion potential or nutrient fluxes.

2.4. Analysis

We quantified temporal and spatial variation in (i) taxonomic structure (species richness), (ii) multidimensional functional structure (FRic and FDiv), and (iii) trait-based nutrient-excretion potential proxies. We summarized trajectories using site means (±SE across transects) and visualized site- and year-specific patterns. Because biomass and individual-size information required for absolute flux estimation were not available for the full time series, we did not compute fish-mediated nutrient fluxes or nutrient ratios.
We tested for spatial and temporal differences using a permutation-based two-way ANOVA implemented in PRIMER v7 with PERMANOVA+. For each univariate response (species richness, total abundance, functional indices, and the High/Low nutrient-excretion potential proxy abundances), we constructed a Euclidean-distance resemblance matrix and ran Type III (partial) sums of squares with Site (3 levels) and Year (11 levels) as fixed crossed factors, including the Site × Year interaction. Significance was assessed by permuting residuals under a reduced model with 9999 permutations, reporting pseudo-F and permutation p-values.

Functional Trait Space and Functional Diversity Indices

Trait-based functional diversity was computed from a species × trait matrix including an ordered body-size class and five categorical traits (diet, schooling behavior, mobility, vertical position, and diel activity). Pairwise functional dissimilarities among species were calculated using Gower distance, which accommodates mixed trait types [18]. All six ecological traits were equally weighted, and body size was registered in size classes reducing its potential influence on pairwise dissimilarities and computations were implemented with the R package mFD Version 1.0.7.9000 [19]. Species were projected into a multidimensional functional space using Principal Coordinates Analysis (PCoA) on the functional distance matrix. The number of retained axes was selected from the mFD quality diagnostics, which evaluate how well Euclidean distances in the reduced functional space reproduce the original Gower trait distances. We retained the first four PCoA axes because the 4-dimensional structure, accounting for 17.1% of the cumulative corrected variance, provided a suitable compromise between functional-space quality and dimensionality, with low distortion between the original trait-based distances and the reduced Euclidean distances.
From this functional space and the site × year assemblage (abundance) matrix, we calculated two multidimensional alpha functional diversity indices: functional richness (FRic) and functional divergence (FDiv). FRic quantifies the volume of trait space occupied by an assemblage, reflecting the range of functional strategies present; FDiv describes the extent to which species abundances are distributed toward the extremes of trait space, indicating whether the most abundant or dominant species are functionally distinct from the center of the assemblage [16,19].

2.5. Trait-Based Nutrient Excretion Potential Proxy

To link changes in community structure to potential nutrient recycling without estimating absolute fluxes, we built a trait-based proxy from species-level excretion coefficients (F0C, F0N, F0P) obtained from data published by Schiettekatte et al. [17] and matched to the fish species recorded at San Andrés. We first converted each nutrient-specific coefficient into a percentile rank across all species in the database (higher percentiles indicate higher excretion potential). We then computed an NPC composite score for each species as the mean of its percentile ranks for C, N, and P. Species were classified as high excretion potential (NPC ≥ 75th percentile; upper quartile) or low excretion potential (NPC ≤ 25th percentile; lower quartile). For each transect (100 m2), we summed the abundances of species in each group and expressed these totals as individuals per 100 m2. These group abundances are used as a proxy for the relative contribution of high- versus low-potential taxa to nutrient recycling across sites and years. To highlight the total contribution of species to nutrient recycling, the NPC composite score is used to assign species to nutrient deciles. Representative nutrient-related taxa were then selected as the two most abundant species within each of the upper deciles, using total observed abundance across the study.

Key Species Identification and Overlap Among Criteria

We identified key species using three complementary criteria: (i) taxonomic drivers of temporal change, (ii) functional extremes, and (iii) nutrient-proxy taxa. First, to identify taxonomic drivers, we ran a SIMPER analysis (Bray–Curtis dissimilarity) on the species-by-sample abundance matrix, grouping samples by site and year; for each site, we retained the top 10 species ranked by their maximum contribution to dissimilarity across pairwise comparisons involving that site. Second, we identified functional-edge species from the multivariate trait space used for functional diversity analyses. Using the species coordinates in functional space, we defined edge species as those located on (or closest to) the convex hull boundary and retained the top 10 edge species per site (and a global set across all sites). Third, to represent nutrient processes without estimating fluxes, we defined a nutrient-proxy set as species in the upper quartile of the NPC composite score (NPC ≥ 75th percentile); in complementary visualizations, we also tracked the lower-quartile group (NPC ≤ 25th percentile) to capture numerically dominant but low-potential taxa.

3. Results

3.1. Temporal and Spatial Trends of Community Indicators

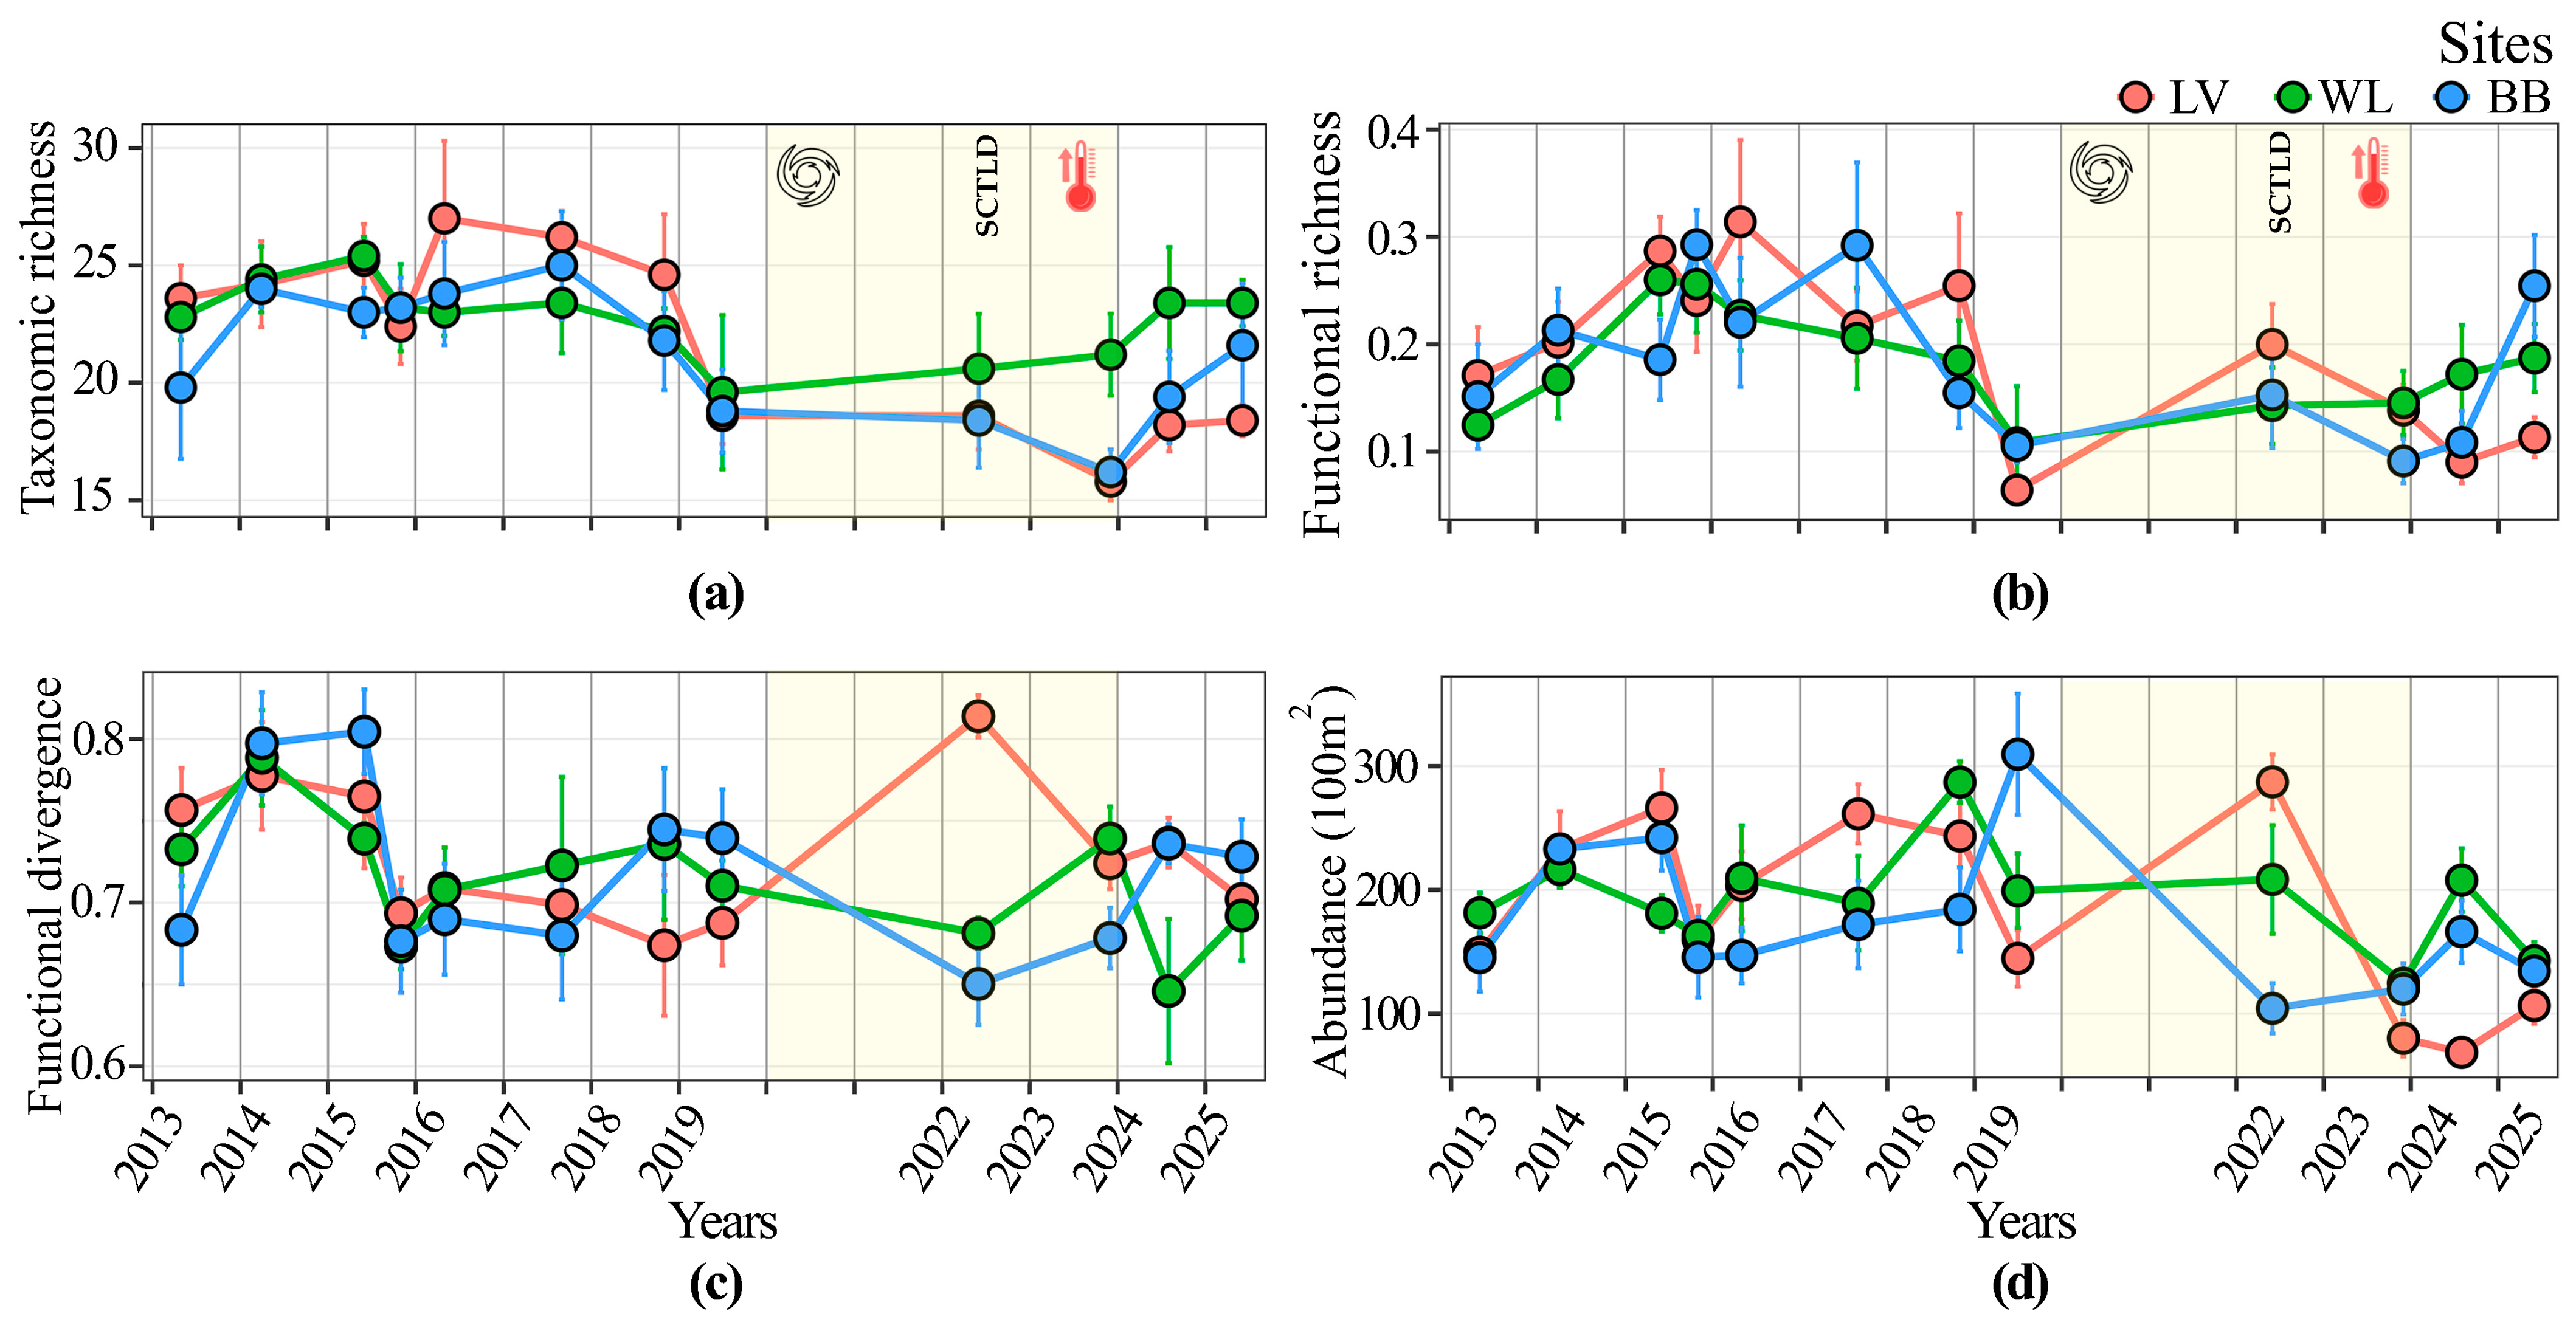
Taxonomic richness (TRic) and functional richness (FRic) exhibited similar patterns, with significant differences among years (p < 0.001). High values persisted until 2018, followed by a decline, with the lowest richness recorded in 2019 (Figure 2a,b). Richness increased after 2019, reaching levels in 2025 comparable to those prior 2019. Although the pattern was relatively consistent across the three sites with no significant differences (p > 0.05), particularly for FRic that reflects the volume of the trait-functional space, Luna Verde (LV) remained slightly higher in the years before 2019, and recorded the lower FRic values in 2019, having an increase in 2022 but remained lower that Bajo Bonito (BB) and Wild Life (WL), for the following years (Figure 2b).
Alongside FRic, functional divergence (FDiv) provided insight into shifts in reef fish assemblages by measuring how abundance was distributed relative to the center of functional trait space. This metric, calculated as the deviation from the center of gravity in trait space, highlighted more pronounced contrasts in assemblage structure over time, with significant changes in the interaction between sites and years (p = 0.0241; Figure 2c). Notably, although FDiv followed a trajectory similar to richness metrics, its decline began earlier than declines observed in other community indicators. FDiv values declined markedly beginning in 2016 and remained low in subsequent years (Figure 2c). Site-specific differences in FDiv were evident; for example, Luna Verde (LV) consistently exhibited the lowest values, with a notable peak in 2022 that indicates a temporary shift in functional composition (Figure 2c).
Because FDiv integrates species abundance, examining the abundance per transect provides insight into the observed trends. The notable peak in FDiv for LV coincides with a corresponding increase in fish abundance at that site (Figure 2c,d). Additionally, significant changes were also observed for abundance in site x years (p = 0.0001), showing considerable variability across years. Consistent with other community indicators, Bajo Bonito (BB) generally exhibited higher abundance values throughout the study period (Figure 2d). Permutation-based two-way ANOVA results for TRic, FRic, FDiv, and total abundance are summarized in Table S2.
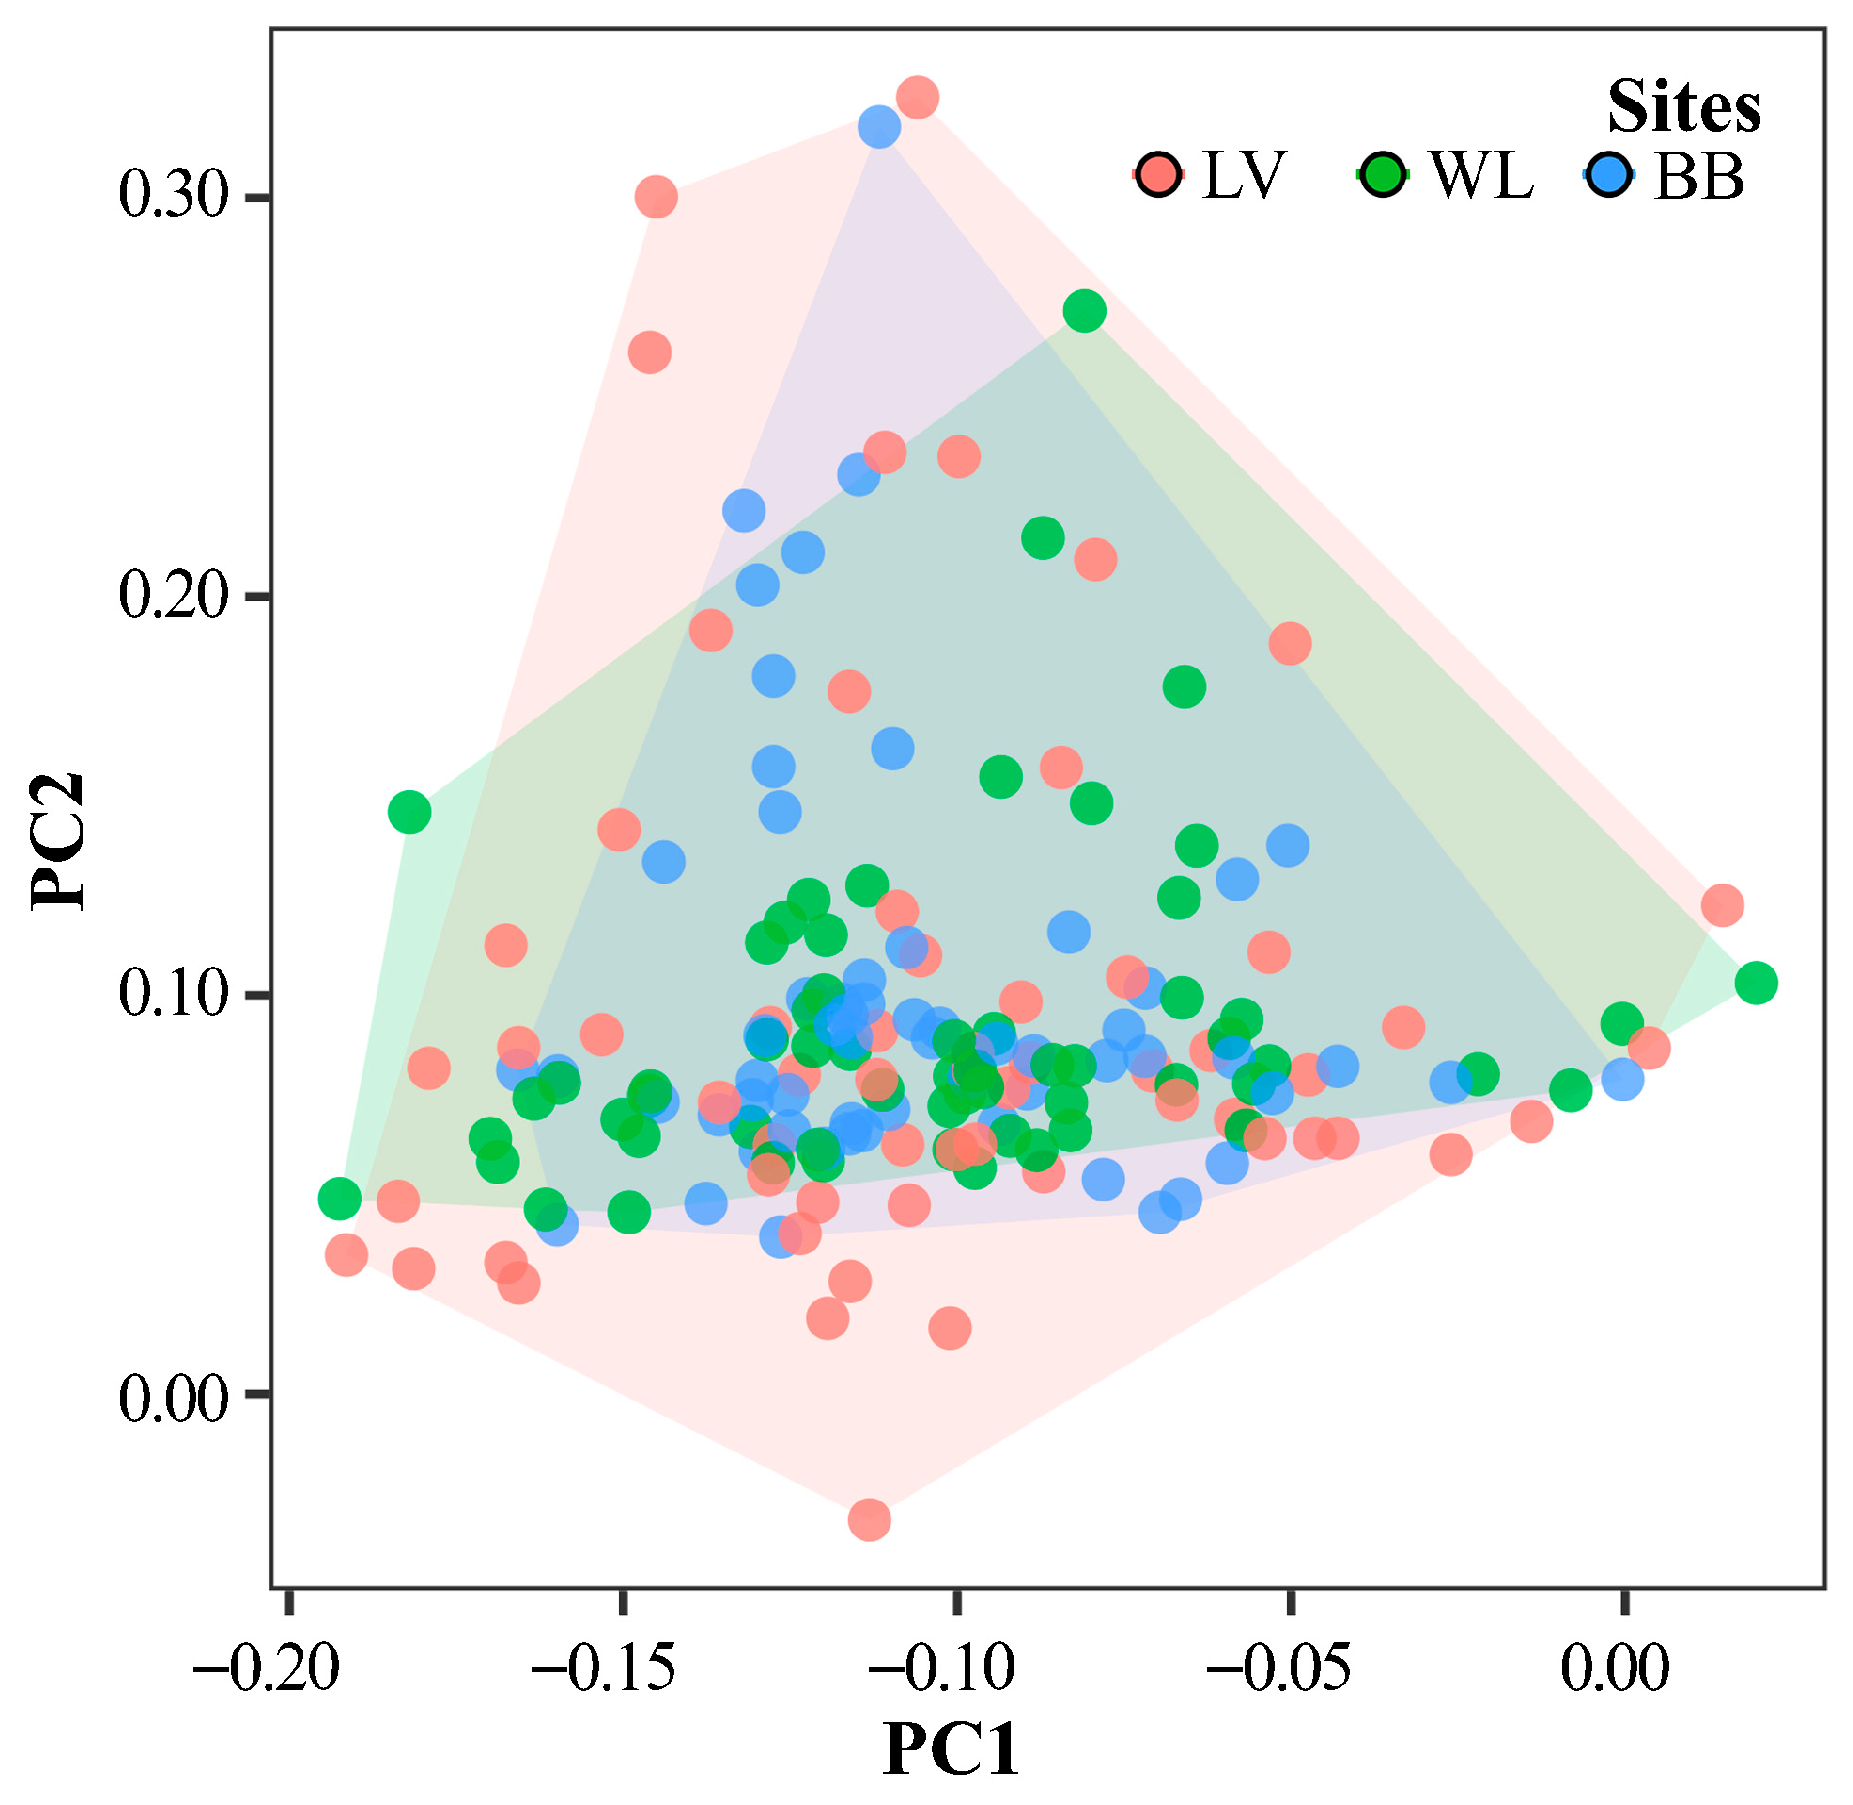
To further explore spatial differences among sites, we analyzed species composition at each site by examining their distribution within the functional trait space, specifically using the first two axes of the Principal Coordinates Analysis (PCoA; PC1–PC2). Fish assemblages from LV, WL, and BB exhibited substantial overlap in the functional trait space (Figure 3). This overlap indicates that the functional roles represented within each assemblage were broadly similar across the study period. The volume of the convex hull (FRic), which reflects functional richness, showed patterns consistent with those observed in community indicators (Figure 2a–d) across 2013–2017. Notably, LV encompassed the largest area within the functional trait space, indicating the highest functional richness among the sites (Figure 3). In contrast, WL and BB occupied more concentrated regions within the same space, suggesting a narrower range of functional traits in those assemblages.
Despite overall overlap in functional trait space, each site occupied distinct positions at the edges of the space. These peripheral positions suggest that each assemblage contained unique trait combinations, reflecting site-specific functional identities (Figure 3).

3.2. Temporal and Spatial Trends of Processes (Nutrient Excretion Proxies)

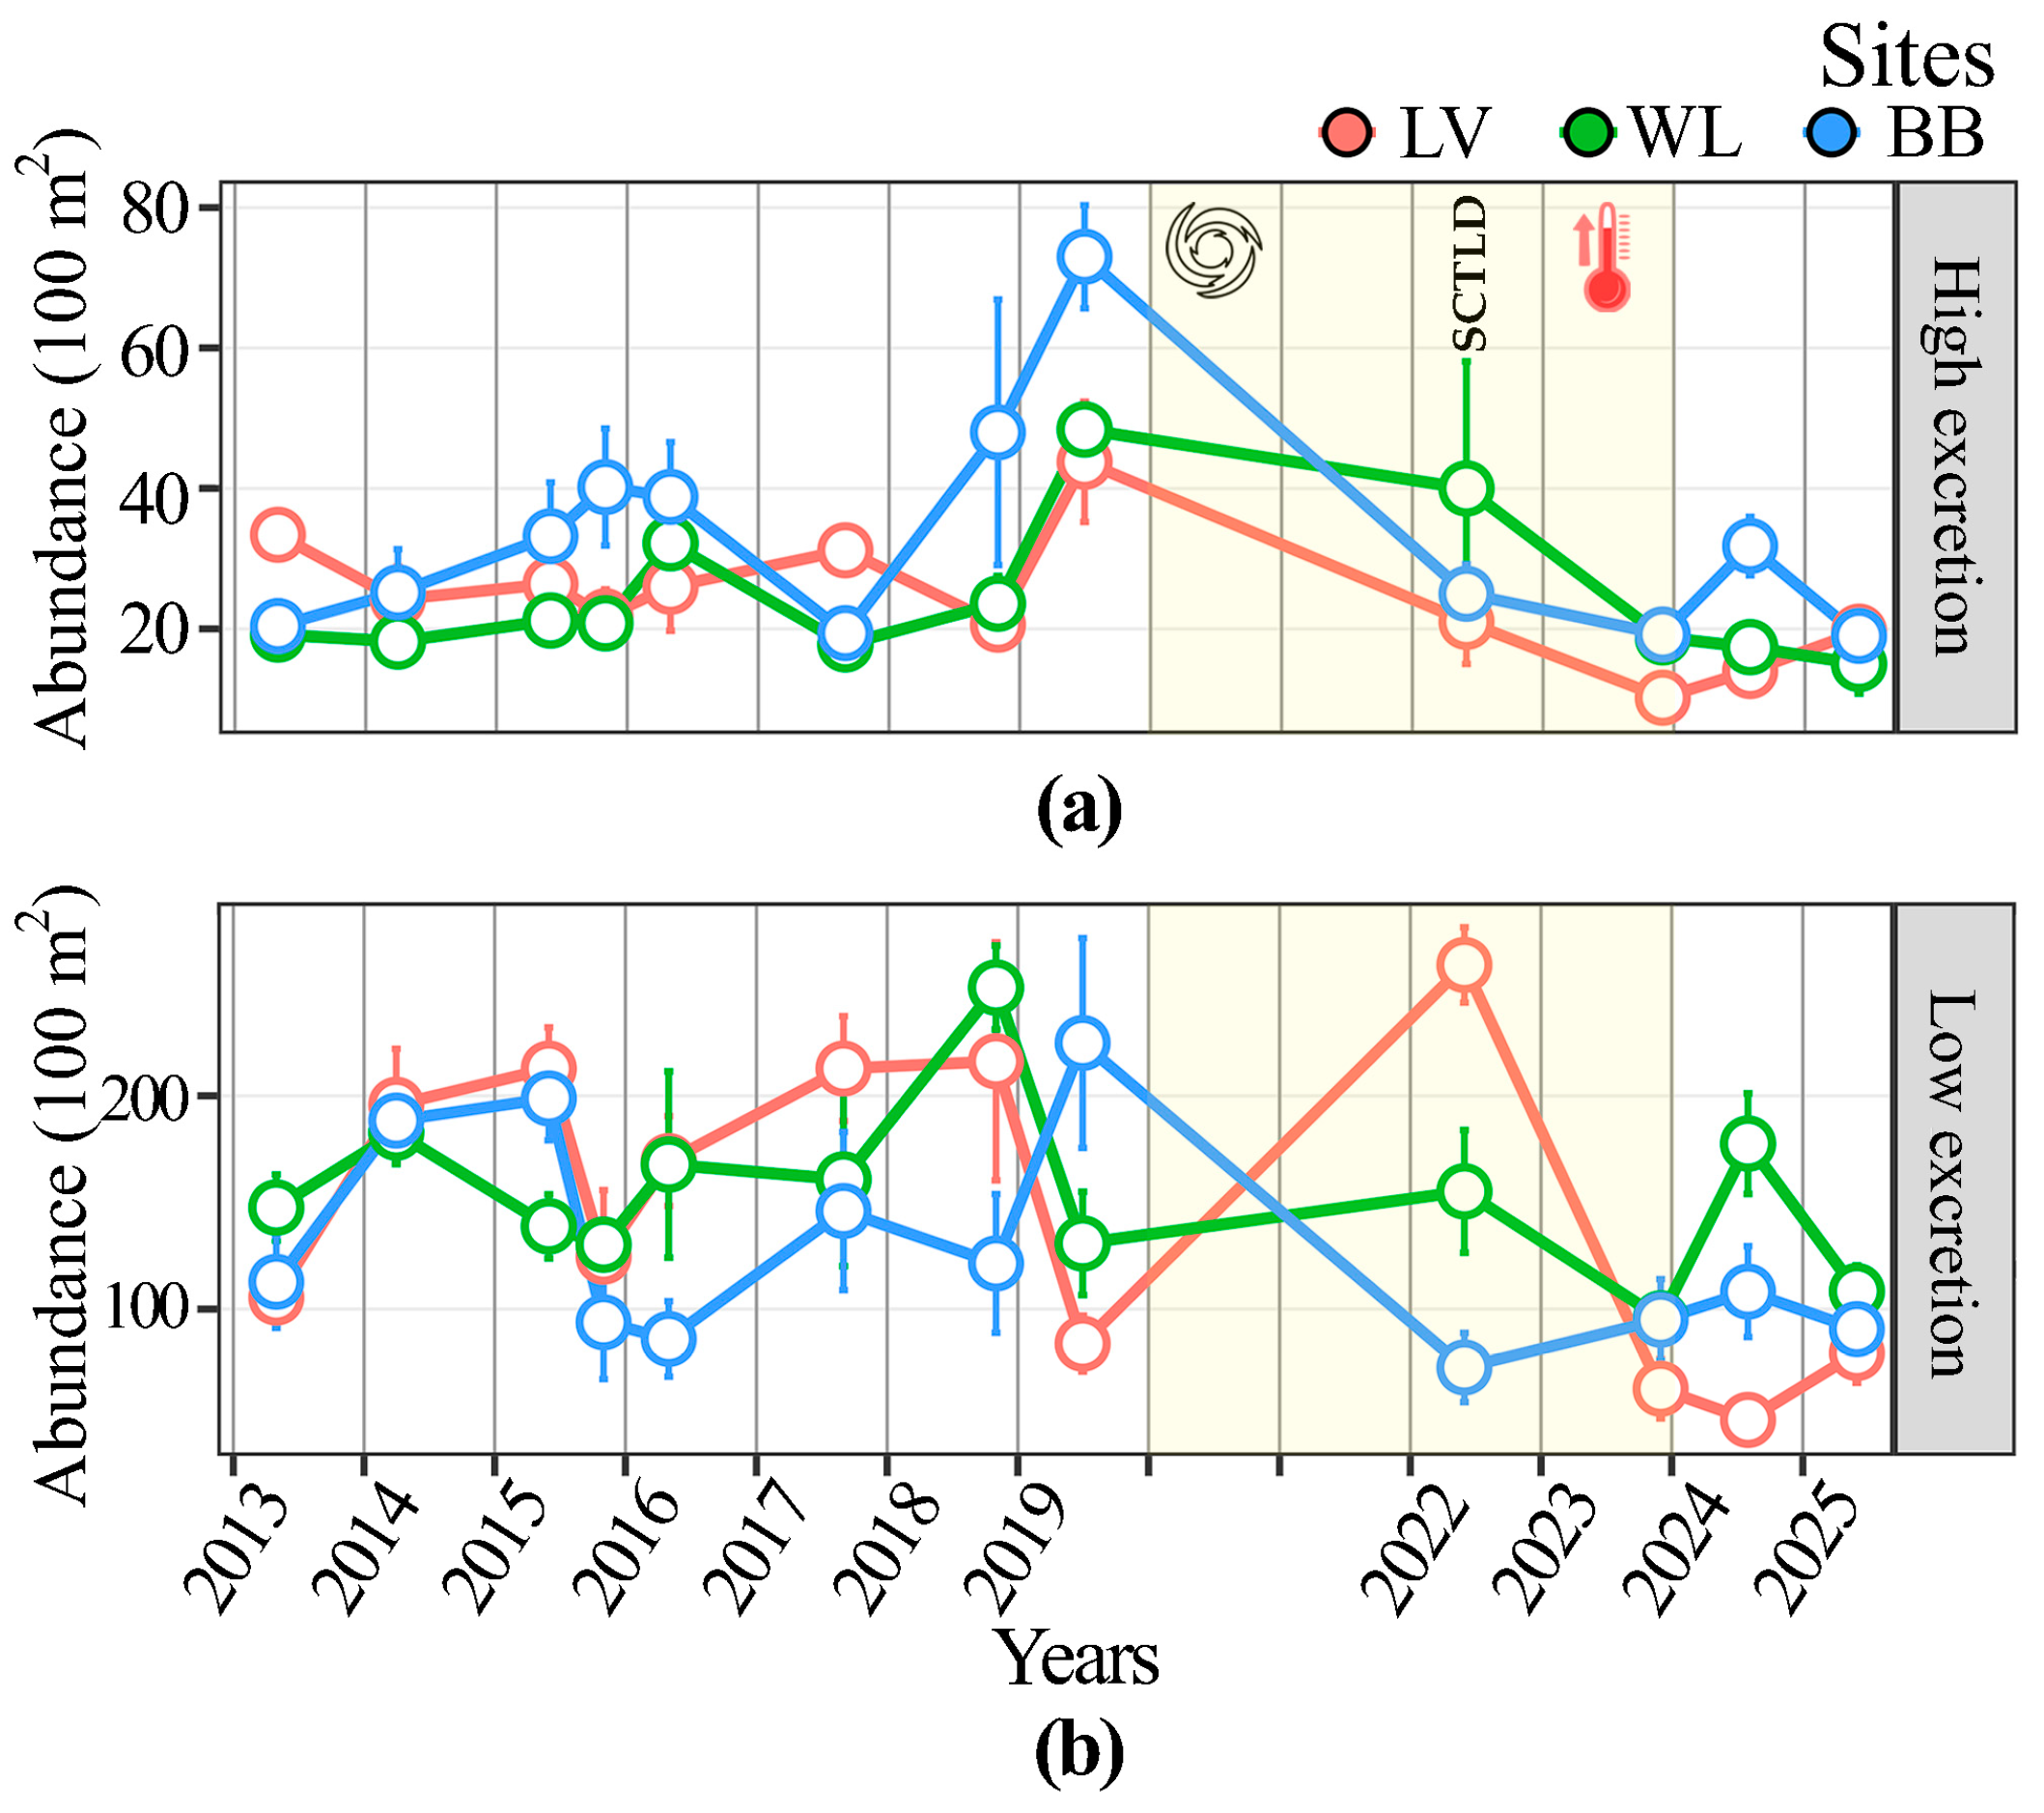
We explored temporal changes in a trait-based nutrient-excretion potential proxy (NPC composite) by reef fish assemblages across years and sites (Figure 4a,b). Species were classified as high excretion potential (NPC ≥ 75th percentile; upper quartile) or low excretion potential (NPC ≤ 25th percentile; lower quartile) based on their species-level excretion coefficients (F0C, F0N, F0P). For each transect, we summed the abundance of species in each group and plotted these totals as individuals per 100 m2. These values represent relative shifts in the composition and numerical dominance of high- versus low-potential taxa, not absolute nutrient fluxes (Table S3).
Results showed significant temporal and spatial variability in the interaction among factors (p < 0.05), revealing two main patterns. First, for species with high contributions to nutrient excretion, abundance increased notably in 2018, reaching a peak in 2019 (Figure 4a). This trend was observed at all three sites but was particularly pronounced at BB compared with LV and WL. After this peak, the abundance of high-excretion species declined from 2022 to 2025. The observed peak in these high-excretion species may be linked to an increase in parrotfish populations (e.g., Scarus taeniopterus) in the area.
In contrast, species with low nutrient excretion values exhibited more variable temporal patterns. The abundance peak seen in 2018 among high excretion species (Figure 4a) did not appear in the abundance patterns of low excretion species (Figure 4b). Although these low excretion species contribute less to nutrient cycling on an individual basis, their overall abundance at the sites is greater than that of the high excretion group (see Figure 4a,b).

3.3. Trophic-Group and Species-Level Contributions to Nutrient Excretion

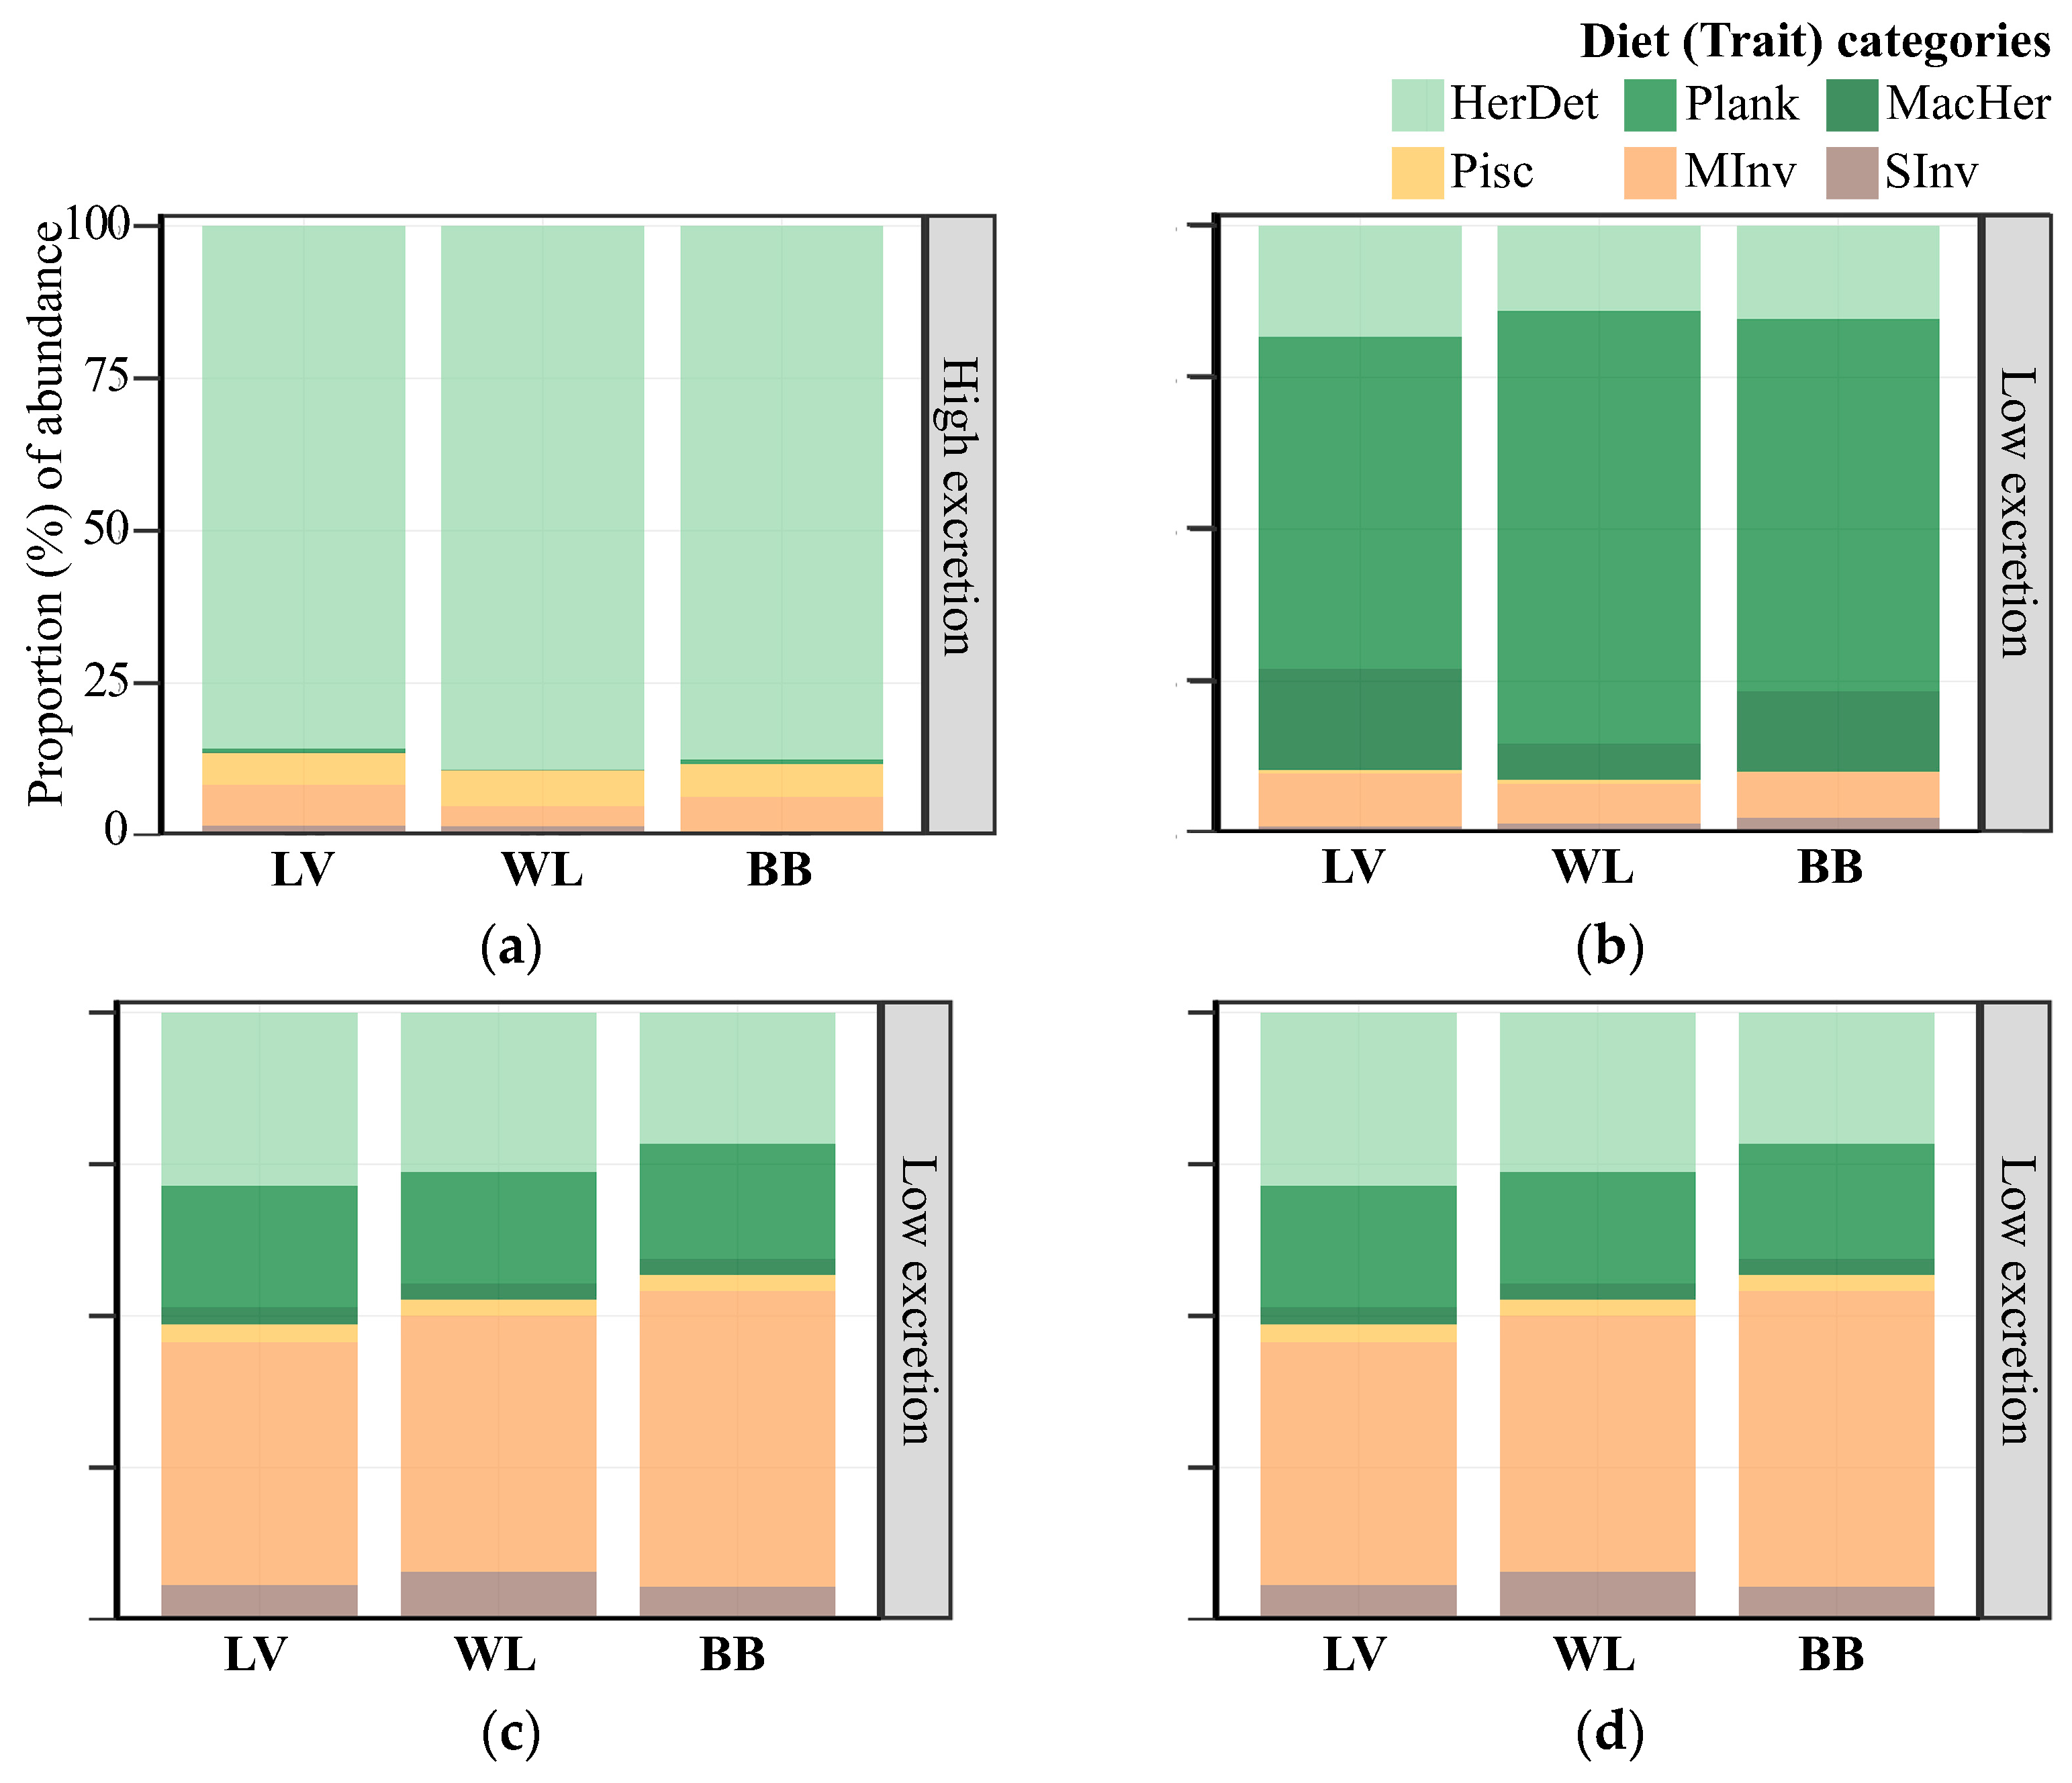
To better understand the role of diet in shaping nutrient contributions among reef fish, we analyzed excretion patterns across diet trait categories using the nutrient excretion potential (NPC) composite score. The results revealed clear and consistent trends at all study sites (LV, BB, and WL).
Among the species grouped by diet traits, those classified as Herbivorous Microvores Detritivores (HerDet) overwhelmingly dominated in abundance and contributed the most to overall nutrient excretion. This pattern was evident across all three sites and highlights the significant role that HerDet species play in nutrient cycling within these reef ecosystems. Following the HerDet group, piscivorous (Pisc) and macroinvertivorous (Minv) species contributed to nutrient excretion, but their abundance and proportional contribution were notably lower.
In contrast, when examining the species that contributed less to nutrient excretion, it was apparent that planktivorous fish (Plank) were dominant within this lower excretion group. Although these planktivores individually contribute less to nutrient excretion, their overall abundance—consistent with previous findings (see Figure 4b)—suggests that they may still be relevant to nutrient cycling processes at the community level. This abundance-driven relevance was observed consistently across all three sites.
To further explore these patterns, we examined the percentage of species within each diet trait group that were associated with high and low excretion potential (see Figure 5b). Among the high excretion group, the largest proportion of species corresponded to Pisc, Minv, and HerDet. In contrast, the species representing lower excretion potential were Minv.

3.4. Overlap Among SIMPER Drivers, Functional-Edge Species, and Top Nutrient Contributors

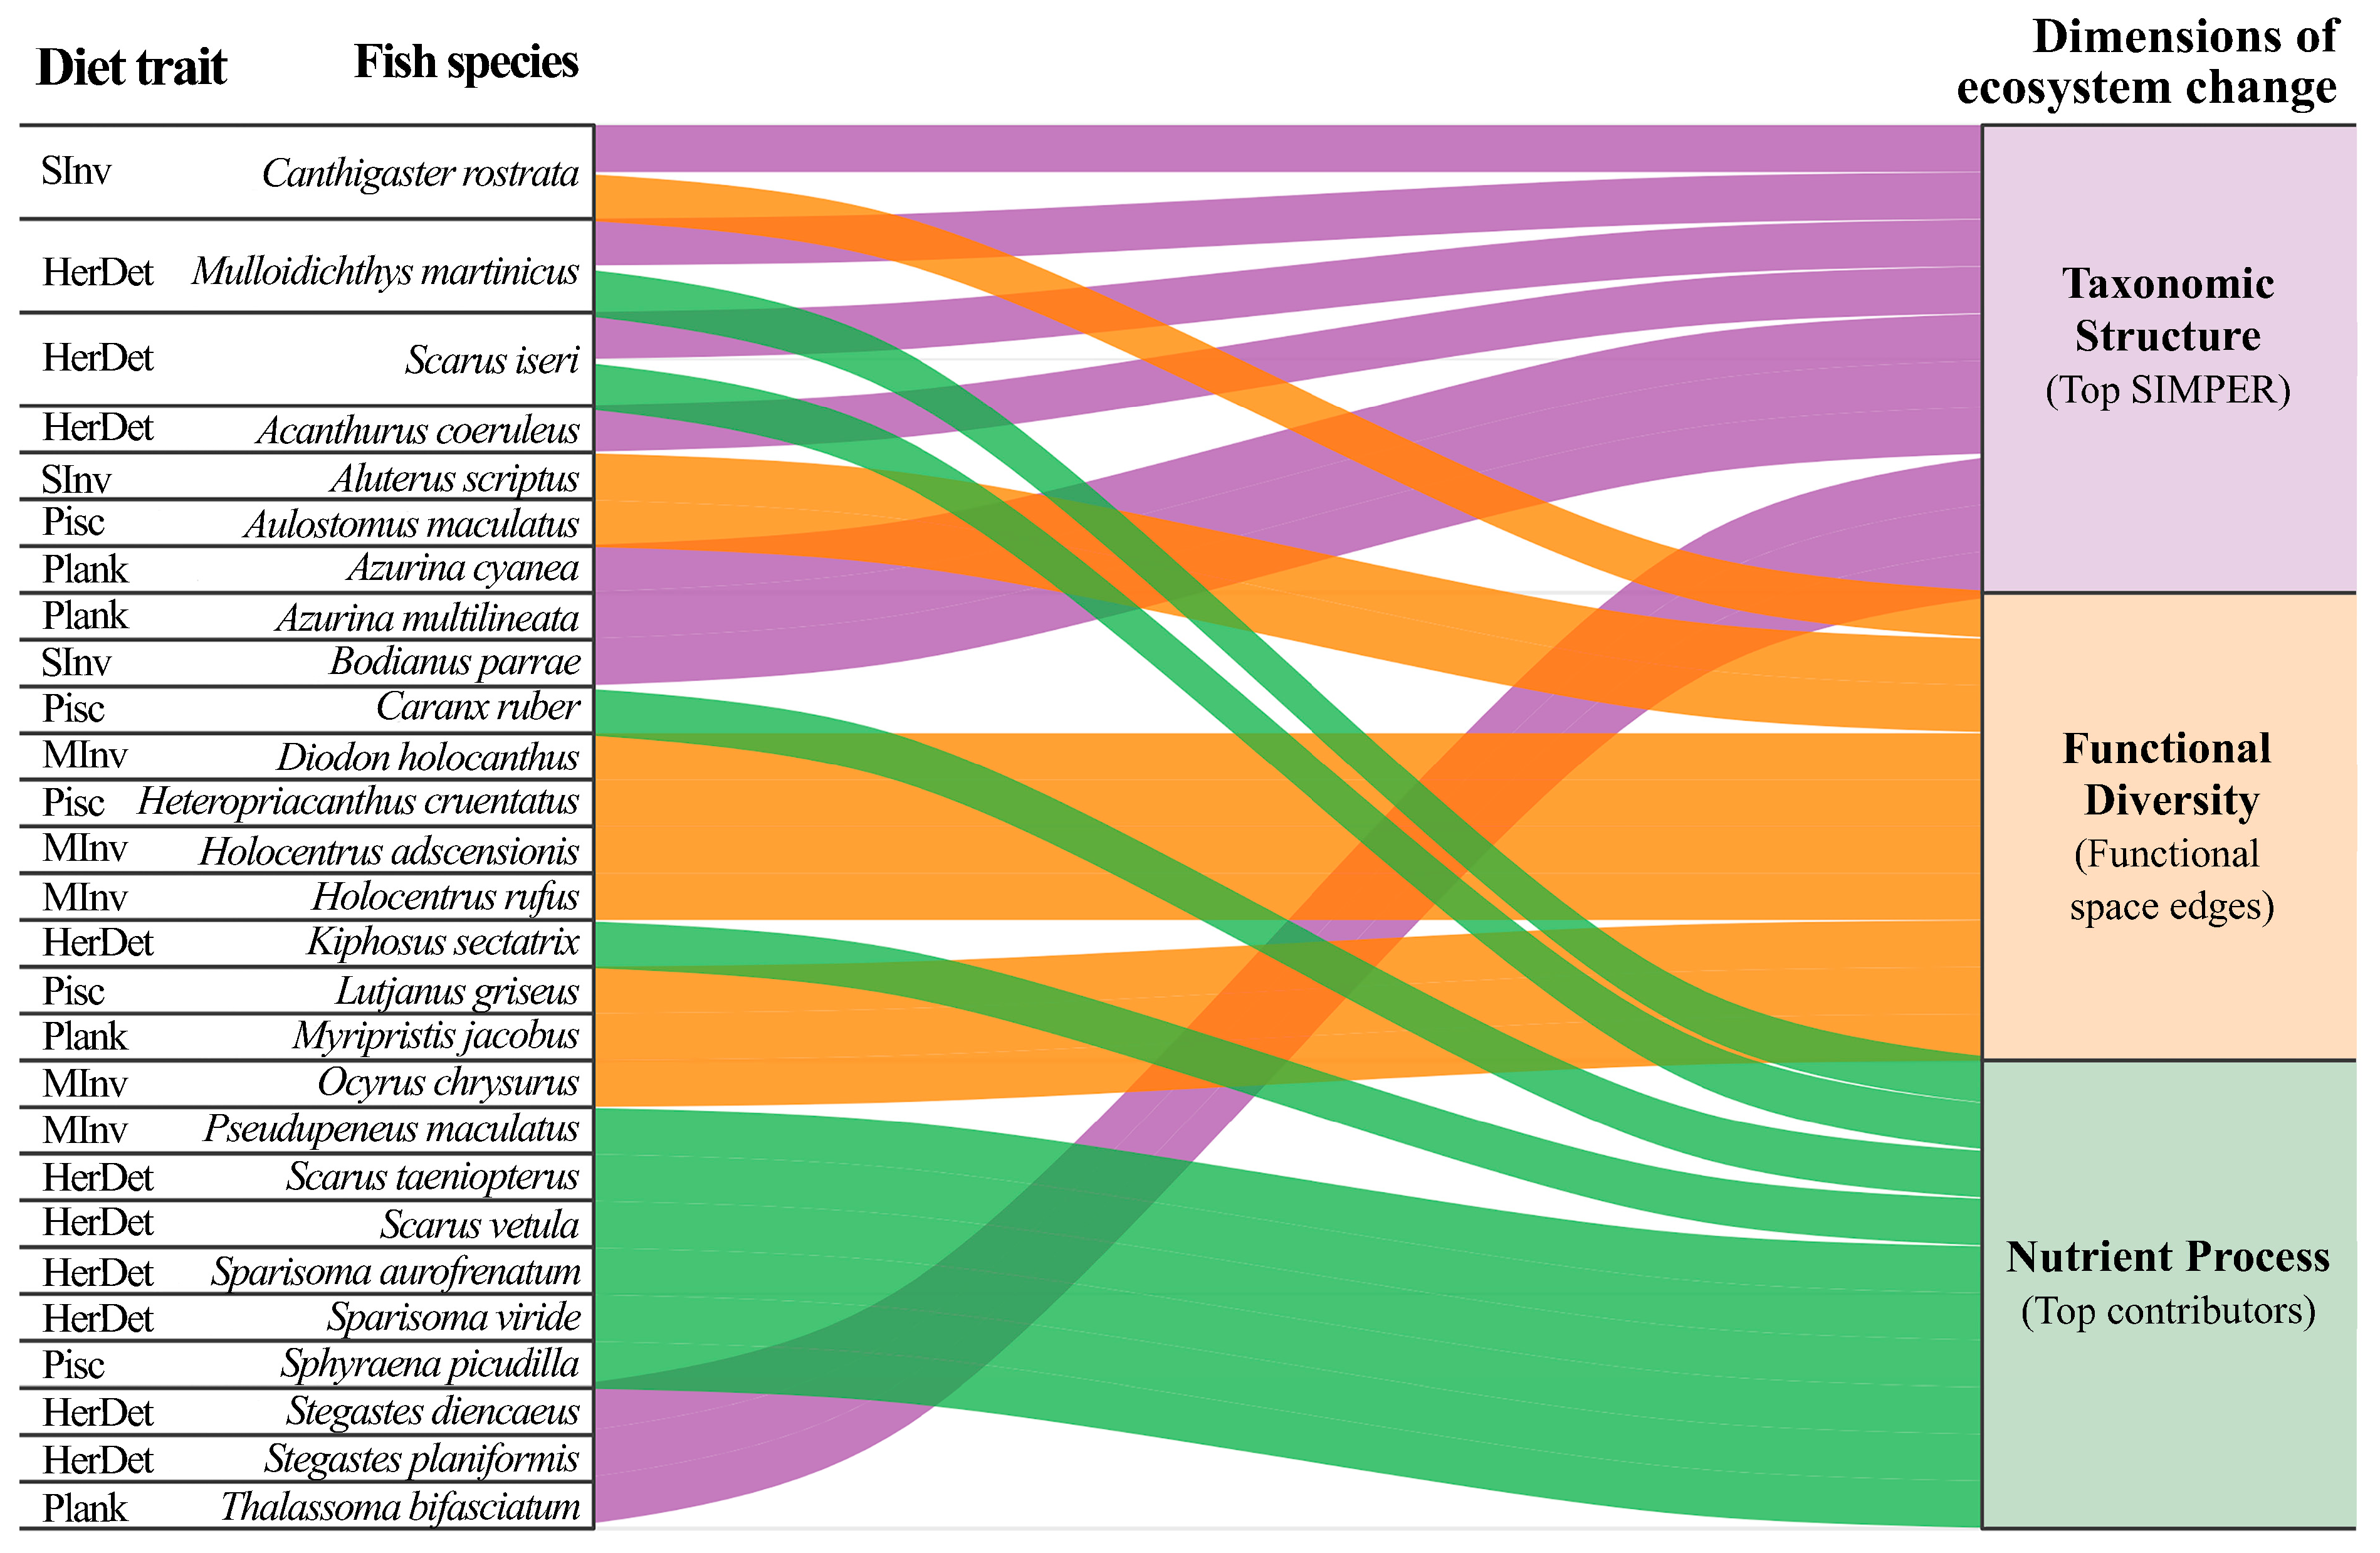
We explored the top fish species contributing to three core dimensions of ecosystem change: taxonomic structure, functional diversity, and nutrient processing. Through SIMPER analyses, we identified a consistent group of taxa that accounted for most of the temporal dissimilarity at each site. Notably, species such as Azurina cyanea, A. multilineata, Canthigaster rostrata, and Scarus iseri were significant contributors across multiple sites (Figure 6). In terms of diet traits, these species include plank and HerDet species, which are also abundant at the sites.
Within the functional diversity dimension, species positioned at the edge of the functional trait space, primarily contributing to FRic and FDiv (Figure 6), were characterized as Plank, such as Aluterus scriptus, and as mostly carnivorous fish (Pisc, Minv, Sinv), such as Aulostomus maculatus, Lutjanus griseus, Ocyurus chrysurus and C. rostrata. The latter species was not only associated with shifts in functional diversity but also linked to changes in taxonomic structure (SIMPER top drivers). Other important edge species in the functional space were the angelfishes Holacanthus ciliaris and H. tricolor, as well as the yellowtail snapper O. chrysurus.
When examining nutrient excretion processes, we observed that HerDet were key contributors. These included Scarus taeniopterus, S. vetula, Sparisoma aurofrenatum, S. viride, and Kyphosus sectatrix, which were among the top contributors to nutrient excretion. Only S. iseri was also considered a contributor to changes in taxonomic structure observed across years and sites. Piscivorous fish such as Caranx ruber and Sphyraena picudilla are also among the top nutrient contributors. Notably, these species, unlike those more prominent in the top SIMPER, are not more abundant but, as individuals, they contribute more to excretion (Table S3). Remarkably, only three species overlap among the top contributors across taxonomic structure, functional diversity, and nutrient processing, namely C. rostrata, Mulloidichthys martinicus, and S. iseri. This distinct separation highlights how each ecosystem dimension is defined by a different subset of species, emphasizing the multifaceted nature of ecological change within San Andrés Island’s fish communities.
Overall, the results reveal several key patterns in the structure and functioning of fish communities around San Andrés Island. First, there was a system-wide contraction in both taxonomic and functional richness by 2019 (Figure 2). Second, at the BB site, proxies of fish abundance and nutrient excretion potential declined markedly in the later years of the series (2023–2024; Figure 4). Site-level trends also indicated functional reorganization, with distinct shifts in assemblage composition among areas (Figure 3). At the trophic-group and species levels, the nutrient-excretion potential proxy was concentrated in a limited set of diet categories and taxa (Figure 5).
The integrative diagram (Figure 6) shows that the species contributing most to each dimension of ecosystem change are not shared across dimensions. Taxonomic structure, functional diversity, and nutrient processing were each dominated by partially distinct subsets of species, with limited overlap, particularly between edge species in functional trait space and the top contributors to taxonomic structure and nutrient processing (Figure 2b,c and Figure 6).

4. Discussion

Long-term monitoring across the three study sites (BB, LV, and WL) revealed distinct, site-specific trajectories in reef fish assemblage structure and functional composition. Rather than a single uniform pattern of change, assemblages showed temporal variability that differed among sites, consistent with the idea that local habitat context, exposure to disturbances, and community reorganization can produce divergent pathways even within the same regional setting. This multi-year, multi-site evidence is valuable for management because it helps distinguish short-lived fluctuations from directional change and supports the design of monitoring programs that are sensitive to both ecological state and recovery dynamics [5,6].
Together, these patterns indicate that ecological change in San Andrés is multidimensional: different species track changes in taxonomic structure, functional composition, and nutrient processing. The late-series declines at BB may reflect localized pressures operating unevenly across sites. Notably, edge species in functional space emerge as complementary indicators of change that are not captured by abundance-driven taxonomic shifts or nutrient-dominant taxa.
Beyond changes in taxonomic richness, functional diversity metrics provided complementary insight into how assemblages reorganized in trait space. In particular, functional richness (FRic) and functional divergence (FDiv) can capture changes in the breadth of ecological strategies present and the way abundance is distributed within that functional space [19]. This matters because communities can retain similar numbers of species while shifting toward more functionally redundant, or more functionally constrained, configurations, with implications for key processes such as herbivory, predation, and nutrient recycling. Trait-based assessments have therefore been recommended as part of multi-indicator approaches to reef status and resilience [7,20,21].
Interpreting temporal patterns in fish assemblages requires explicit consideration of disturbance context during the monitoring period. Tropical storms and hurricanes can rapidly modify reef habitat, alter benthic cover, and restructure fish communities through direct mortality and indirect habitat-mediated effects. Empirical evidence from the Caribbean indicates that hurricane impacts can produce abrupt changes in both benthic and fish assemblage structure, followed by multi-month to multi-year reorganization whose magnitude and direction depend on pre-disturbance conditions and local habitat features [12].
In addition to storms, the monitoring window overlaps with a major heat-stress and bleaching episode beginning in 2023. Thermal stress and coral bleaching have increased in frequency and spatial extent, and recurrent events can reduce the time available for reef recovery [22,23]. NOAA Coral Reef Watch reported that the world entered a fourth global coral bleaching event in 2024, with widespread heat stress affecting reefs since early 2023. In this context, 2024 can be interpreted as reflecting an immediate post-2023 heat-stress signal, and the addition of 2025 observations becomes crucial to test whether site trajectories represent transient disturbance responses, early recovery, or continued decline.
A useful way to frame patterns at BB, LV, and WL is to evaluate whether key metrics show step-changes aligned with disturbance years or more gradual trends consistent with cumulative pressures. Comparing the timing of shifts in taxonomic richness with changes in FRic and FDiv can help diagnose whether disturbances primarily affected species numbers, the breadth of functional strategies, or dominance structure within trait space. Because functional metrics can be sensitive to the loss or decline of particular ecological strategies, they may detect change that is muted in richness-based metrics [7,24,25].
Fish-mediated nutrient recycling provides a mechanistic link between community reorganization and ecosystem functioning. On coral reefs, fish can supply nitrogen (N) and phosphorus (P) via excretion, and repeated aggregation or site fidelity can create localized nutrient hotspots that influence benthic communities [26]. Recent work also highlights that egestion can contribute meaningfully to reef nutrient budgets and that the quantity and quality of organic nutrient release vary among taxa and trophic guilds [17,27]. Overall, the magnitude and elemental balance of fish-derived nutrient recycling are strongly composition-dependent because species differ in body size, metabolism, diet, and elemental demands [9,10]. Consequently, communities with similar total abundance can differ in nutrient recycling potential if they differ in dominant taxa or functional traits.
Within this framework, phosphorus (P) deserves particular attention. Phosphorus is often limiting in oligotrophic reef settings, and reductions in the abundance of high P-excretion-potential taxa (proxy) may therefore signal altered ecosystem functioning, especially if declines are driven by losses or reductions in key contributing species. Prior work indicates that diverse fish assemblages can stabilize nutrient storage and recycling potential, whereas shifts in composition can reduce nutrient delivery and alter nutrient balance, with downstream consequences for benthic interactions [9,11].
Interpreting N- and P-related patterns alongside abundance (and biomass, when available) is essential to distinguish changes driven by overall fish abundance from changes driven by species identity and traits. We recommend explicitly separating “quantity” effects (e.g., total abundance/biomass) from “composition” effects (e.g., identity- or trait-weighted indicators) using species-level contribution plots and, where possible, size-structured estimates. Such decomposition can clarify whether nutrient-proxy signals reflect broad declines in fish abundance, changes in dominance by taxa, or a reweighting toward functional groups with different recycling profiles [10,17,28].
Benthic implications should be interpreted cautiously because fish-derived nutrients can reinforce different community states depending on herbivory and benthic context. For example, fish nutrient supply can enhance macroalgal productivity and may be negatively associated with juvenile coral density in some Caribbean settings, suggesting feedback that could impede coral recovery when herbivory is low [11]. At the same time, reductions in fish biomass through selective harvest can diminish nutrient supply and alter nutrient regimes, emphasizing that management actions affecting fish communities can indirectly influence nutrient availability.
The temporal dynamics of key taxa can help translate community-level patterns into operational monitoring indicators. Sentinel candidates are most useful when they are consistently surveyed, exhibit interannual variability aligned with broader assemblage shifts, and are plausibly linked to ecosystem processes (e.g., by disproportionately influencing nutrient recycling potential or representing a distinct functional strategy) [29,30].
A complementary perspective is to contrast dominant taxa with rare or episodic species. Rare species can contribute to functional structure by occupying unique regions of trait space yet may contribute little to nutrient recycling potential because of low abundance or biomass. Conversely, a small set of abundant taxa can dominate nutrient-recycling signals, meaning that changes in their trajectories can drive strong ecosystem-level patterns even if changes in richness are modest [31,32]. These considerations reinforce the value of per-species contribution figures and of evaluating whether leading contributors differ among nutrients, sites, and years.
From a monitoring perspective, our findings support the importance of conducting repeated site-level reef fish surveys over time and including functional approaches in routine assessments, as these can detect changes that are not visible through taxonomic patterns alone [4,7,25]. Several next steps can strengthen inference and increase the usefulness of these results for conservation and management in the Seaflower Biosphere Reserve. First, continuing monitoring beyond 2025 will help to evaluate persistence versus recovery following the 2023 heat-stress period and improve the ability to distinguish step-changes from longer-term trends. Second, linking fish metrics to concurrent benthic and habitat data (e.g., coral cover, macroalgal cover, and structural complexity) would strengthen causal interpretation of site-specific trajectories and help identify habitat pathways through which disturbances affect fish functional structure. Third, the NPC proxy used here depends on relative scores instead of absolute nutrient fluxes. If biomass and size data become available, future work could move from relative proxies to species- and size-resolved flux estimates with uncertainty propagation for bioenergetics-based models, to test whether observed changes are driven by demography, species turnover, or both [9,27].
Finally, integrating functional diversity indices with process-based proxies of nutrient recycling offers a practical bridge between biodiversity monitoring and ecosystem functioning. Combined community-level and species-level metrics can support adaptive management by enabling early detection of functional changes, identifying taxa that consistently support ecosystem processes, and evaluating whether changes are consistent across sites or concentrated in particularly vulnerable locations.

Supplementary Materials

The following supporting information can be downloaded at: https://www.mdpi.com/article/10.3390/d18040198/s1, Table S1: Species-level trait categories obtained from different sources for reef fishes on San Andrés Island, Colombia; Table S2: Summary of permutation-based two-way ANOVA (PERMANOVA) results testing the effects of Site, Year, and Site × Year on univariate community metrics and nutrient-excretion potential proxy abundances of reef fish in San Andrés Island, Colombia; Table S3: Species selected as key contributors across three dimensions of ecosystem change: taxonomic structure (Top SIMPER species), functional diversity (species located at the edges of trait space), and nutrient excretion (species identified as major contributors to the nutrient-excretion potential proxy). Abundance is reported in LV = Luna Verde, WL = Wild Life, BB = Bajo Bonito, and overlap categories indicate species selected in more than one dimension.

Author Contributions

Conceptualization, all authors; methodology, A.L.C.-M. and D.M.-d.-A.; formal analysis, D.M.-d.-A. and A.L.C.-M.; investigation, all authors; Resources A.S.-M. and A.L.C.-M.; data curation, A.L.C.-M. and D.M.-d.-A.; writing—original draft preparation, A.L.C.-M. and D.M.-d.-A.; writing—review and editing, all authors; visualization, all authors; supervision, A.L.C.-M. and D.M.-d.-A.; project administration, A.S.-M. and A.L.C.-M.; funding acquisition, A.S.-M. and A.L.C.-M. All authors have read and agreed to the published version of the manuscript.

Funding

This research was possible thanks to funding provided by the Universidad Nacional de Colombia Sede Caribe to A.S.M. for maintaining the fish census monitoring from 2013 to 2022 (Conectividad ecosistémica de comunidades marinas en las islas de San Andrés, Providencia y Santa Catalina, Reserva de Biósfera Seaflower-Caribe Insular Colombiano-UNAL Hermes Código 26652, and 2022 to 2026 Project Fortalecimiento de la Gestión del Riesgo—BPIN: 2021000100041 Sistema General de Regalías, Ministerio de Ciencia y Tecnología Colombia). The Internationalization Coordination Office of the Universidad de Guadalajara supported A.L.C.M. with travel expenses (2013–2017) to San Andrés Island, Colombia, project PIFI 2013-2017 14MSU0010Z-01-02.

Data Availability Statement

Raw data are available from the corresponding author upon request. All key results for interpreting the findings are included in the manuscript and Supplementary Materials.

Acknowledgments

Thanks to the divers from San Andrés and the Universidad Nacional de Colombia, Sede Caribe, for their support during field sampling. We also acknowledge institutional support from Cinvestav for D.M.-d.-A., including research assistance from J. Mirella Hernández de Santillana with trait data compilation and data filtering, and we thank Andrea Fonseca for her support and valuable input on nutrient-related aspects of the study.

Conflicts of Interest

The authors declare no conflicts of interest. The funders had no role in the design of the study; in the collection, analyses, or interpretation of data; in the writing of the manuscript; or in the decision to publish the results.

Abbreviations

The following abbreviations are used in this manuscript:
SCTLDStony coral tissue loss disease
BBBajo Bonito
LVLuna Verde
WLWild Life
WWFWorld Wildlife Fund
F0CCarbon Flux
F0NNitrogen Flux
F0PPhosphorus Flux
TRicTaxonomic Richness
FRicFunctional Richness
FDivFunctional Divergence
SIMPERSimilarity Percentage

References

  1. Alvarez-Filip, L.; Paddack, M.J.; Collen, B.; Robertson, D.R.; Côté, I.M. Simplification of Caribbean Reef-Fish Assemblages over Decades of Coral Reef Degradation. PLoS ONE 2015, 10, e0126004. [Google Scholar] [CrossRef]
  2. Ceccarelli, D.M.; Emslie, M.J.; Richards, Z.T. Post-Disturbance Stability of Fish Assemblages Measured at Coarse Taxonomic Resolution Masks Change at Finer Scales. PLoS ONE 2016, 11, e0156232. [Google Scholar] [CrossRef]
  3. Robinson, J.P.W.; Wilson, S.K.; Jennings, S.; Graham, N.A.J. Thermal Stress Induces Persistently Altered Coral Reef Fish Assemblages. Glob. Change Biol. 2019, 25, 2739–2750. [Google Scholar] [CrossRef]
  4. Heenan, A.; Williams, I.D. Monitoring Herbivorous Fishes as Indicators of Coral Reef Resilience in American Samoa. PLoS ONE 2013, 8, e79604. [Google Scholar] [CrossRef] [PubMed]
  5. McClanahan, T.R. Coral Reef Fish Community Life History Traits as Potential Global Indicators of Ecological and Fisheries Status. Ecol. Indic. 2019, 96, 133–145. [Google Scholar] [CrossRef]
  6. Samoilys, M.; Roche, R.C.; Gudka, M.; Thouless, C.; Obura, D.; Rowlands, S.; Mbugua, J.; Osuka, K. Fish as Indicators of Coral Reef Ecosystem Status. Ecol. Indic. 2025, 179, 114137. [Google Scholar] [CrossRef]
  7. Rincón-Díaz, M.P.; Pittman, S.J.; Arismendi, I.; Heppell, S.S. Functional Diversity Metrics Detect Spatio-temporal Changes in the Fish Communities of a Caribbean Marine Protected Area. Ecosphere 2018, 9, e02433. [Google Scholar] [CrossRef]
  8. McIntyre, P.B.; Jones, L.E.; Flecker, A.S.; Vanni, M.J. Fish Extinctions Alter Nutrient Recycling in Tropical Freshwaters. Proc. Natl. Acad. Sci. USA 2007, 104, 4461–4466. [Google Scholar] [CrossRef]
  9. Allgeier, J.E.; Layman, C.A.; Mumby, P.J.; Rosemond, A.D. Consistent Nutrient Storage and Supply Mediated by Diverse Fish Communities in Coral Reef Ecosystems. Glob. Change Biol. 2014, 20, 2459–2472. [Google Scholar] [CrossRef]
  10. Allgeier, J.E.; Valdivia, A.; Cox, C.; Layman, C.A. Fishing down Nutrients on Coral Reefs. Nat. Commun. 2016, 7, 12461. [Google Scholar] [CrossRef]
  11. Burkepile, D.E.; Allgeier, J.E.; Shantz, A.A.; Pritchard, C.E.; Lemoine, N.P.; Bhatti, L.H.; Layman, C.A. Nutrient Supply from Fishes Facilitates Macroalgae and Suppresses Corals in a Caribbean Coral Reef Ecosystem. Sci. Rep. 2013, 3, 1493. [Google Scholar] [CrossRef]
  12. Mancera Pineda, J.E.; Osorio, A.F.; Toro, C.; Velásquez-Calderón, C.S. Climate Change Adaptation and Mitigation in the Seaflower Biosphere Reserve: From Local Thinking to Global Actions; Springer Nature: Singapore, 2025; 327p. [Google Scholar]
  13. Prato-Valderrama, J.; Mejía-Rentería, J.C.; Forbes, M.; Santos-Martinez, A.; Castaño, D.; Schuhmann, P.P.W. Extreme Temperatures in 2023 Generate Mass Coral Reef Bleaching in the Western Caribbean, Seaflower Biosphere Reserve. Bull. Mar. Sci. 2024, 100, 793–794. [Google Scholar] [CrossRef]
  14. Pizarro, V.; Vanegas Gonzalez, J.; Prato-Valderrama, J.; Torres Acero, J.; Rivera-Sosa, A. Seaflower Biosphere Reserve. In Status and Trends of Caribbean Coral Reefs: 1970–2024; Wicquart, J., Mathon, L., Petit, A., Rivera-Sosa, A., McField, M., Eds.; Global Coral Reef Monitoring Network (GCRMN); International Coral Reef Initiative (ICRI): Washington, DC, USA, 2025; pp. 252–256. [Google Scholar]
  15. WWF. Mejores Prácticas de Pesca en Arrecifes Coralinos. Guía para la Colecta de Información Que Apoye el Manejo de Pesquerías Basado en Ecosistemas; WWF: Mexico City, México, 2006; 81p. [Google Scholar]
  16. Mouillot, D.; Graham, N.A.J.; Villéger, S.; Mason, N.W.H.; Bellwood, D.R. A Functional Approach Reveals Community Responses to Disturbances. Trends Ecol. Evol. 2013, 28, 167–177. [Google Scholar] [CrossRef] [PubMed]
  17. Schiettekatte, N.; Brandl, S.J.; Casey, J.M.; Graham, N.A.J.; Barneche, D.R.; Burkepile, D.E.; Allgeier, J.E.; Arias-Gonzaléz, J.E.; Edgar, G.J.; Ferreira, C.E.L. Biological Trade-Offs Underpin Coral Reef Ecosystem Functioning. Nat. Ecol. Evol. 2022, 6, 701–708. [Google Scholar] [CrossRef]
  18. Gower, J.C. A General Coefficient of Similarity and Some of Its Properties. Biometrics 1971, 27, 857–871. [Google Scholar] [CrossRef]
  19. Magneville, C.; Loiseau, N.; Albouy, C.; Casajus, N.; Claverie, T.; Escalas, A.; Leprieur, F.; Maire, E.; Mouillot, D.; Villéger, S. mFD: An R Package to Compute and Illustrate the Multiple Facets of Functional Diversity. Ecography 2022, 2022, e05904. [Google Scholar] [CrossRef]
  20. Hughes, T.P.; Barnes, M.L.; Bellwood, D.R.; Cinner, J.E.; Cumming, G.S.; Jackson, J.B.C.; Kleypas, J.; Van De Leemput, I.A.; Lough, J.M.; Morrison, T.H. Coral Reefs in the Anthropocene. Nature 2017, 546, 82–90. [Google Scholar] [CrossRef]
  21. Lefcheck, J.S.; Innes-Gold, A.A.; Brandl, S.J.; Steneck, R.S.; Torres, R.E.; Rasher, D.B. Tropical Fish Diversity Enhances Coral Reef Functioning across Multiple Scales. Sci. Adv. 2019, 5, eaav6420. [Google Scholar] [CrossRef]
  22. Richardson, L.E.; Graham, N.A.J.; Pratchett, M.S.; Eurich, J.G.; Hoey, A.S. Mass Coral Bleaching Causes Biotic Homogenization of Reef Fish Assemblages. Glob. Change Biol. 2018, 24, 3117–3129. [Google Scholar] [CrossRef]
  23. Pratchett, M.S.; Hoey, A.S.; Wilson, S.K.; Messmer, V.; Graham, N.A.J. Changes in Biodiversity and Functioning of Reef Fish Assemblages Following Coral Bleaching and Coral Loss. Diversity 2011, 3, 424–452. [Google Scholar] [CrossRef]
  24. Dubuc, A.; Quimbayo, J.P.; Alvarado, J.J.; Araya-Arce, T.; Arriaga, A.; Ayala-Bocos, A.; Julio Casas-Maldonado, J.; Chasqui, L.; Cortés, J.; Cupul-Magaña, A.; et al. Patterns of Reef Fish Taxonomic and Functional Diversity in the Eastern Tropical Pacific. Ecography 2023, 2023, e06536. [Google Scholar] [CrossRef]
  25. Russet-Rodríguez, A.J.; Pérez-España, H.; Payan-Alcacio, J.A.; Peterson, M.S.; De La Cruz-Agüero, G.; Enríquez-García, A.B.; Ornelas-Vargas, A.; Cruz-Escalona, V.H. Functional Diversity in Reef Fish Assemblages in the Parque Nacional Sistema Arrecifal Veracruzano, Mexico: Temporal and Spatial Changes. Front. Mar. Sci. 2023, 10, 1102373. [Google Scholar] [CrossRef]
  26. Shantz, A.A.; Ladd, M.C.; Schrack, E.; Burkepile, D.E. Fish-derived nutrient hotspots shape coral reef benthic communities. Ecol. Appl. 2015, 25, 2142–2152. [Google Scholar] [CrossRef]
  27. Schiettekatte, N.M.D.; Barneche, D.R.; Villéger, S.; Allgeier, J.E.; Burkepile, D.E.; Brandl, S.J.; Casey, J.M.; Mercière, A.; Munsterman, K.S.; Morat, F. Nutrient Limitation, Bioenergetics and Stoichiometry: A New Model to Predict Elemental Fluxes Mediated by Fishes. Funct. Ecol. 2020, 34, 1857–1869. [Google Scholar] [CrossRef]
  28. Boyer, K.E.; Fong, P.; Armitage, A.R.; Cohen, R.A. Elevated Nutrient Content of Tropical Macroalgae Increases Rates of Herbivory in Coral, Seagrass, and Mangrove Habitats. Coral Reefs 2004, 23, 530–538. [Google Scholar] [CrossRef]
  29. Berthet, B. Sentinel Species. In Ecological Biomarkers: Indicators of Ecotoxicological Effects; CRC Press: Boca Raton, FL, USA, 2012; pp. 155–186. [Google Scholar]
  30. Hourigan, T.F.; Timothy, C.T.; Reese, E.S. Coral Reef Fishes as Indicators of Environmental Stress in Coral Reefs. In Marine Organisms as Indicators; Springer: New York, NY, USA, 1988; pp. 107–135. [Google Scholar]
  31. Grenié, M.; Mouillot, D.; Villéger, S.; Denelle, P.; Tucker, C.M.; Munoz, F.; Violle, C. Functional Rarity of Coral Reef Fishes at the Global Scale: Hotspots and Challenges for Conservation. Biol. Conserv. 2018, 226, 288–299. [Google Scholar] [CrossRef]
  32. Mouillot, D.; Bellwood, D.R.; Baraloto, C.; Chave, J.; Galzin, R.; Harmelin-Vivien, M.; Kulbicki, M.; Lavergne, S.; Lavorel, S.; Mouquet, N. Rare Species Support Vulnerable Functions in High-Diversity Ecosystems. PLoS Biol. 2013, 11, e1001569. [Google Scholar] [CrossRef] [PubMed]
Figure 1. Location of San Andrés Island, Colombia, and sample sites. LV = Luna Verde, WL = Wild Life, BB = Bajo Bonito.
Diversity 18 00198 g001
Figure 2. Temporal and spatial trends (mean ± SE) in (a) taxonomic richness, (b) functional richness, (c) functional divergence, and (d) fish abundance (individuals per 100 m2) across sampling years (2013–2019, 2022–2025) at three sites BB: Bajo Bonito, LV: Luna Verde and WL: Wild Life on San Andrés Island. Shaded area with symbols indicates timing of the major disturbance events ((left): hurricanes, (center): Stony Coral Tissue Loss Disease (SCTLD), (right): massive coral bleaching).
Diversity 18 00198 g002
Figure 3. Functional space overlap among sites. Assemblage positions in the functional trait space are shown on the first two PCoA axes (PC1–PC2) derived from Gower functional distances computed from six traits (size, diet, schooling, mobility, position, activity). Each point represents one species ordinated according to their traits and colors indicate sites: BB (Bajo Bonito), LV (Luna Verde), and WL (Wild Life). Shaded polygons represent the convex hull enclosing assemblages from each site, illustrating the extent and overlap of the occupied functional space in two dimensions.
Diversity 18 00198 g003
Figure 4. Temporal trends in fish abundance (individuals per 100 m2) for species classified as high ((a); NPC ≥ 75th percentile) or low ((b); NPC ≤ 25th percentile) nutrient-excretion potential (NPC composite score). Lines show site means (±SE across transects) for Luna Verde (LV), Wild Life (WL), and Bajo Bonito (BB); points are positioned by sampling month within each year. Shaded area with symbols indicates timing of the major disturbance events ((left): hurricanes; (center): Stony Coral Tissue Loss Disease (SCTLD); (right): massive coral bleaching event).
Diversity 18 00198 g004
Figure 5. Percent composition of diet (trait) categories by site (LV: Luna Verde, WL: Wild Life, BB: Bajo Bonito) for species classified as high vs. low nutrient-excretion contributors. Panels show proportions by total abundance (high: (a); low: (b)) and species richness (high: (c); low: (d)). Diet categories: HerDet = herbivorous microvores/detritivores; Plank = planktivores; MacHer = macroalgae–micro-invertivore herbivores; Pisc = piscivores; MInv = mobile invertivores; SInv = sessile invertivore.
Diversity 18 00198 g005
Figure 6. Global overlap of fish taxa across three ecosystem-change dimensions around San Andrés Island, taxonomic structure (top SIMPER), functional diversity (trait-space edges), and nutrient processes (nutrient-proxy taxa defined by NPC percentile thresholds). Ribbons indicate shared species identity across dimensions, and colors denote the corresponding ecosystem-change dimension. Ribbon width was kept uniform for visual clarity and does not reflect abundance, biomass, or the magnitude of contribution.
Diversity 18 00198 g006
Disclaimer/Publisher’s Note: The statements, opinions and data contained in all publications are solely those of the individual author(s) and contributor(s) and not of MDPI and/or the editor(s). MDPI and/or the editor(s) disclaim responsibility for any injury to people or property resulting from any ideas, methods, instructions or products referred to in the content.