Article

Frog Diversity in Chebera Churchura National Park, South-Western Ethiopia

1
Department of Biology, College of Natural Sciences, Jimma University, Jimma P.O. Box 378, Ethiopia
2
Department of Zoological Sciences, College of Natural Sciences, Addis Ababa University, Addis Ababa P.O. Box 1176, Ethiopia
3
Center for Genomics and Systems Biology, New York University Abu Dhabi, Saadiyat Island, Abu Dhabi P.O. Box 129188, United Arab Emirates
4
Animal Biodiversity Research, Ethiopian Biodiversity Institute, Addis Ababa P.O. Box 30726, Ethiopia
5
Cognitive Ethology Laboratory, German Primate Center, Leibniz Institute for Primate Research, 37077 Göttingen, Germany
6
Department of Primate Cognition, Georg-August-University, 37073 Göttingen, Germany
*
Author to whom correspondence should be addressed.
Diversity 2026, 18(4), 199; https://doi.org/10.3390/d18040199
Submission received: 8 January 2026 / Revised: 9 March 2026 / Accepted: 10 March 2026 / Published: 29 March 2026
(This article belongs to the Special Issue Amphibian and Reptile Adaptation: Biodiversity and Monitoring)

Abstract

Amphibians are threatened globally by habitat loss and emerging diseases, yet information on their diversity and distribution remains scarce in many regions. Ethiopia is renowned for its rich anuran diversity, but little is known about the diversity and abundance of anurans in Chebera Churchura National Park (CCNP). We conducted surveys from June 2022 to April 2024 along transects in various habitats during both dry and wet seasons. Methods included visual encounter surveys, acoustic monitoring, opportunistic observations, and pitfall traps with drift fences. Species identification was primarily based on morphology and subsequently validated through genetic barcoding using mitochondrial 16S rRNA sequence analysis for five species. A total of 2175 individuals were recorded, representing 16 species from 8 families. The families Bufonidae and Ptychadenidae were the most dominant. Riverine forest habitats exhibited the highest anuran diversity, followed by montane forest, woodland, and savannah grassland. These findings underscore the importance of CCNP as a refuge for Ethiopian anuran species and the need for further research into the park’s unexplored areas.

1. Introduction

Global amphibian diversity is under increasing threat. The IUCN [1] reports that more than 40% of amphibian species are currently experiencing population decline, making them one of the most vulnerable vertebrate groups worldwide. These declines are primarily driven by habitat destruction and fragmentation, climate change, pollution, infectious diseases such as chytridiomycosis, and direct exploitation. This global conservation crisis underscores the urgent need for comprehensive biodiversity inventories, particularly in understudied regions that may harbour significant or unique amphibian communities. Establishing baseline data on species diversity, distribution, and abundance is a critical first step in informing effective conservation strategies and monitoring future population trends.
Ethiopia is recognised as a significant centre of biodiversity, harbouring a remarkable array of endemic and rare amphibian species [2]. Despite this, amphibians in Ethiopia remain one of the least studied vertebrate groups, with many regions of high conservation priority remaining critically under-surveyed [3]. This knowledge gap hinders effective conservation planning and risks the unrecorded loss of species.
Chebera Churchura National Park (CCNP), located in the south-western part of Ethiopia, epitomises this combination of high potential and limited research. The park encompasses a range of pristine habitats, including Afromontane forests, riverine ecosystems, and wetlands, which are theoretically ideal for supporting a diverse amphibian community [4]. However, a comprehensive assessment of the park’s herpetofauna is lacking.
The current study aimed to fill this critical knowledge gap by determining the anuran diversity in CCNP. We aimed to document species composition, species richness and relative abundance of anurans across the park’s major habitat types. Our study provided information to support evidence-based biodiversity conservation efforts, directly inform park management strategies, and serve as a foundational reference to encourage and guide future herpetological research in south-western Ethiopia.

2. Materials and Methods

2.1. Study Area

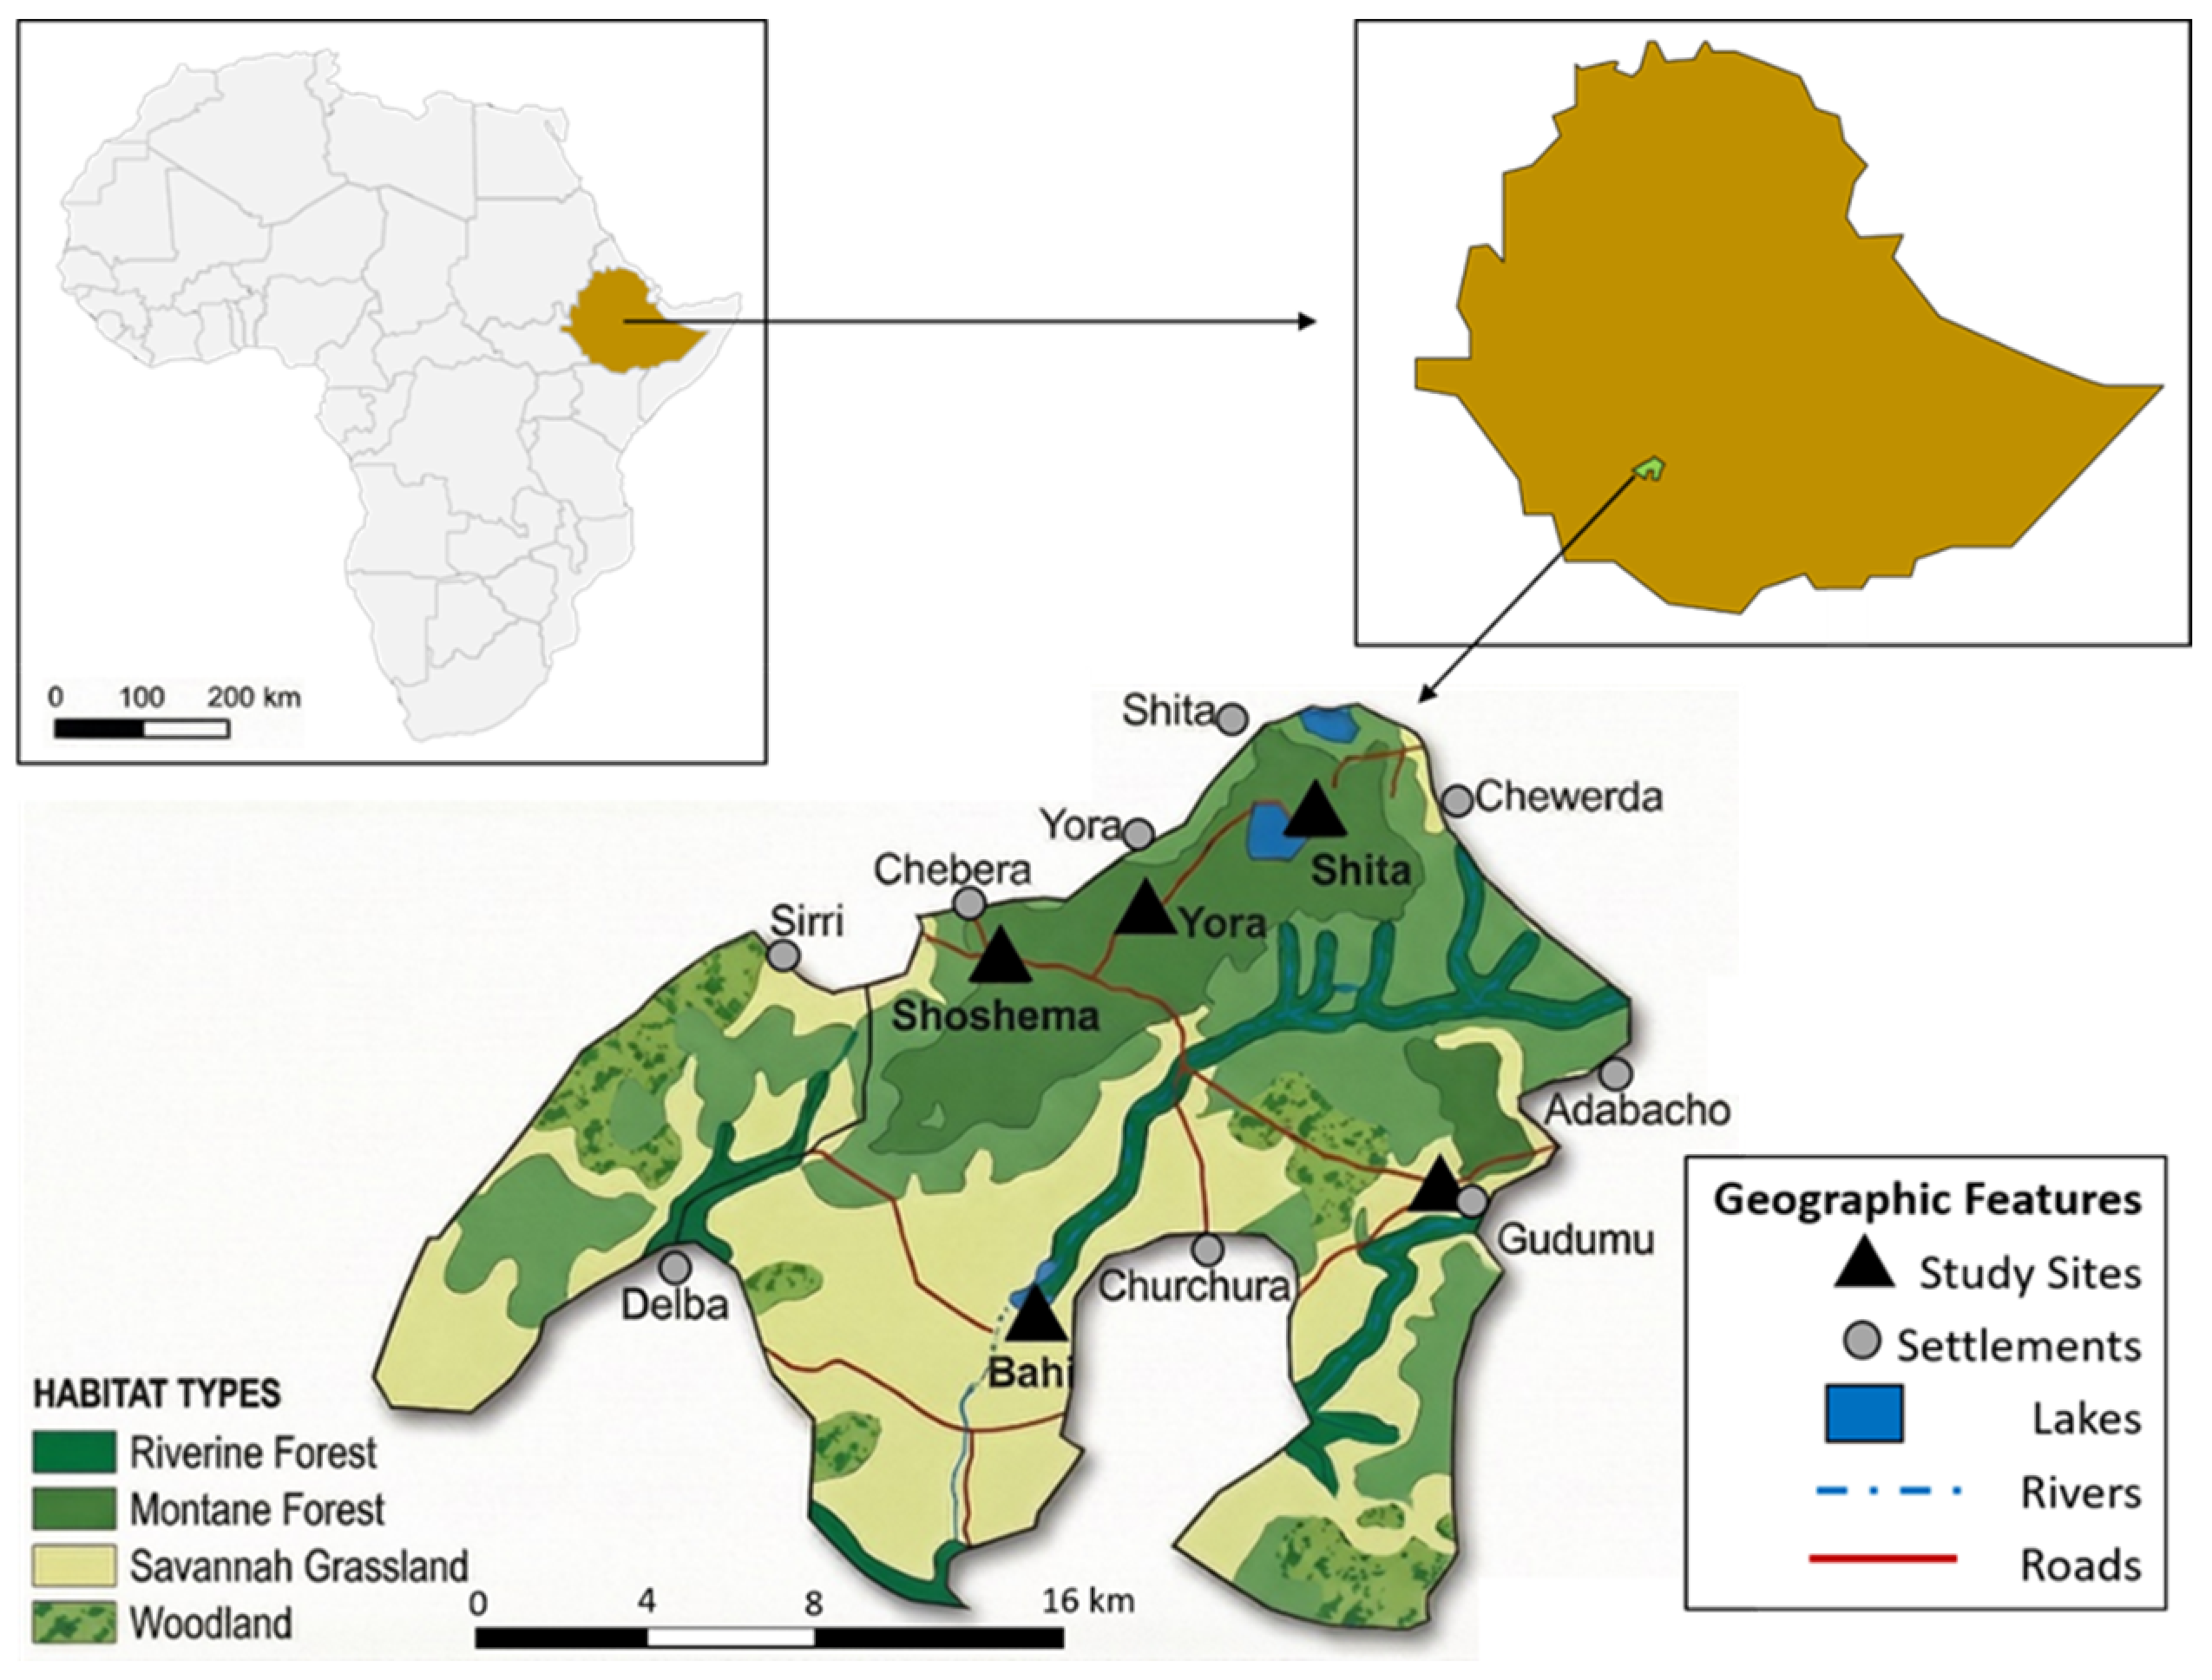
We conducted a study of the anuran diversity in CCNP, located in the Dawro Zone of south-western Ethiopia. Geographically, the park is situated between latitudes 6°49′ and 7°08′ N and longitudes 36°27′ and 36°57′ E, encompassing a total area of approximately 1250 km2 [4] (Figure 1). Established in 2005, CCNP was designated to protect wildlife, including a population of African elephants (Loxodonta africana), and to conserve the region’s unique and diverse ecosystems [5].
Figure 1. Geographic location of Chebera Churchura National Park (green highlighted area) within Ethiopia (indicated in brown) and distribution of the four major habitat types sampled. Triangles indicate the locations of the five study sites. Each study site represents a single habitat type, although one habitat type is represented by two separate sites, and transects were established within the corresponding habitat as detailed in Table 1.
Diversity 18 00199 g001
Table 1. Geographic location, habitat type, and sampling effort (number of transects) for each study site in Chebera Churchura National Park.
Study SiteLatitudeLongitudeAltitude (m)Habitat TypeNumber of Transects
Shoshuma6.966736.63331250riverine forest4
Bahi6.975036.56501500riverine forest1
Yora6.904236.59151400montane forest5
Shita6.958336.61251950savannah grassland5
Gudumu6.937536.65422000woodland5
Total 420
The topography of CCNP is characterised by a significant altitudinal gradient, ranging from 550 m to over 2000 m above sea level. This variation fosters a complex mosaic of habitat types, including Afromontane forests, bamboo thickets, woodlands, riverine forests, grasslands, and wetlands [6,7]. The habitat diversity supports a rich assemblage of flora and fauna, making CCNP a critical centre for biodiversity in Ethiopia.
The climate of CCNP is characterized by a unimodal rainfall pattern, with a prolonged rainy season from March to October delivering an annual precipitation of 1200–2200 mm. Average annual temperatures are moderate, typically ranging from 15 °C to 25 °C [4]. This humid environment sustains a network of perennial rivers, including the Zigna, Shoshuma, and Churchura, which provide essential aquatic habitats for amphibians and other freshwater organisms. These relatively unaltered hydrological and climatic conditions make CCNP a site of high potential for conserving Ethiopia’s lesser-studied vertebrates, particularly amphibians. However, this potential is increasingly threatened by anthropogenic pressures, including livestock grazing, agricultural encroachment, and settlement expansion, which pose significant risks to the park’s ecological integrity [5].

2.2. Sampling Design

We conducted our study from June 2022 to April 2024 to encompass both wet and dry seasons. We did our survey across four distinct habitat types within the park, riverine forest, montane forest, savannah grassland, and woodland, based on distinct ecological units within CCNP, differing in vegetation structure, microclimate, and moisture availability [8]. We selected five study sites representing four habitat types: riverine forest, montane forest, woodland, and savannah grassland (Table 1). Each study site corresponded to a single habitat type, with one habitat type represented by two separate sites. In each habitat type, five transects were established to ensure statistical representativeness and to minimize the effects of random variation or local anomalies.
Each transect was rectangular, measuring 200 m by 100 m, resulting in a total perimeter length of 600 m. Following the standard methods of Rodel and Ernst [9], this perimeter was divided into 25 m segments for systematic data collection. Each segment was marked with coloured flag tape for clear identification.

2.3. Data Collection and Sampling Effort

We collected our data on anuran diversity and distribution during both the wet and dry seasons by walking the transect lines at a consistent pace. All amphibians detected visually, both terrestrial and arboreal, within one meter on either side of the transect line were recorded. This procedure follows standardised transect sampling protocols, adapted from [9,10,11]. Each transect was surveyed for a total of six days per season, with three hours of effort per day (18 h per transect per season). A team of four researchers sampled four transects daily during two key activity periods: from 6:00 to 9:00 a.m. and from 6:00 to 9:00 p.m. These periods were deliberately selected to coincide with peak anuran activity and detectability in tropical environments and widely used in standardized visual encounter and acoustic surveys [11].
We acknowledge that some taxa, including species of Leptopelis, may show peak activity later at night (e.g., around midnight). The absence of Leptopelis in our records may reflect low local abundance or habitat specificity, which may further reduce detectability during standardized surveys. Nocturnal surveys were conducted using headlamps to aid in species detection.
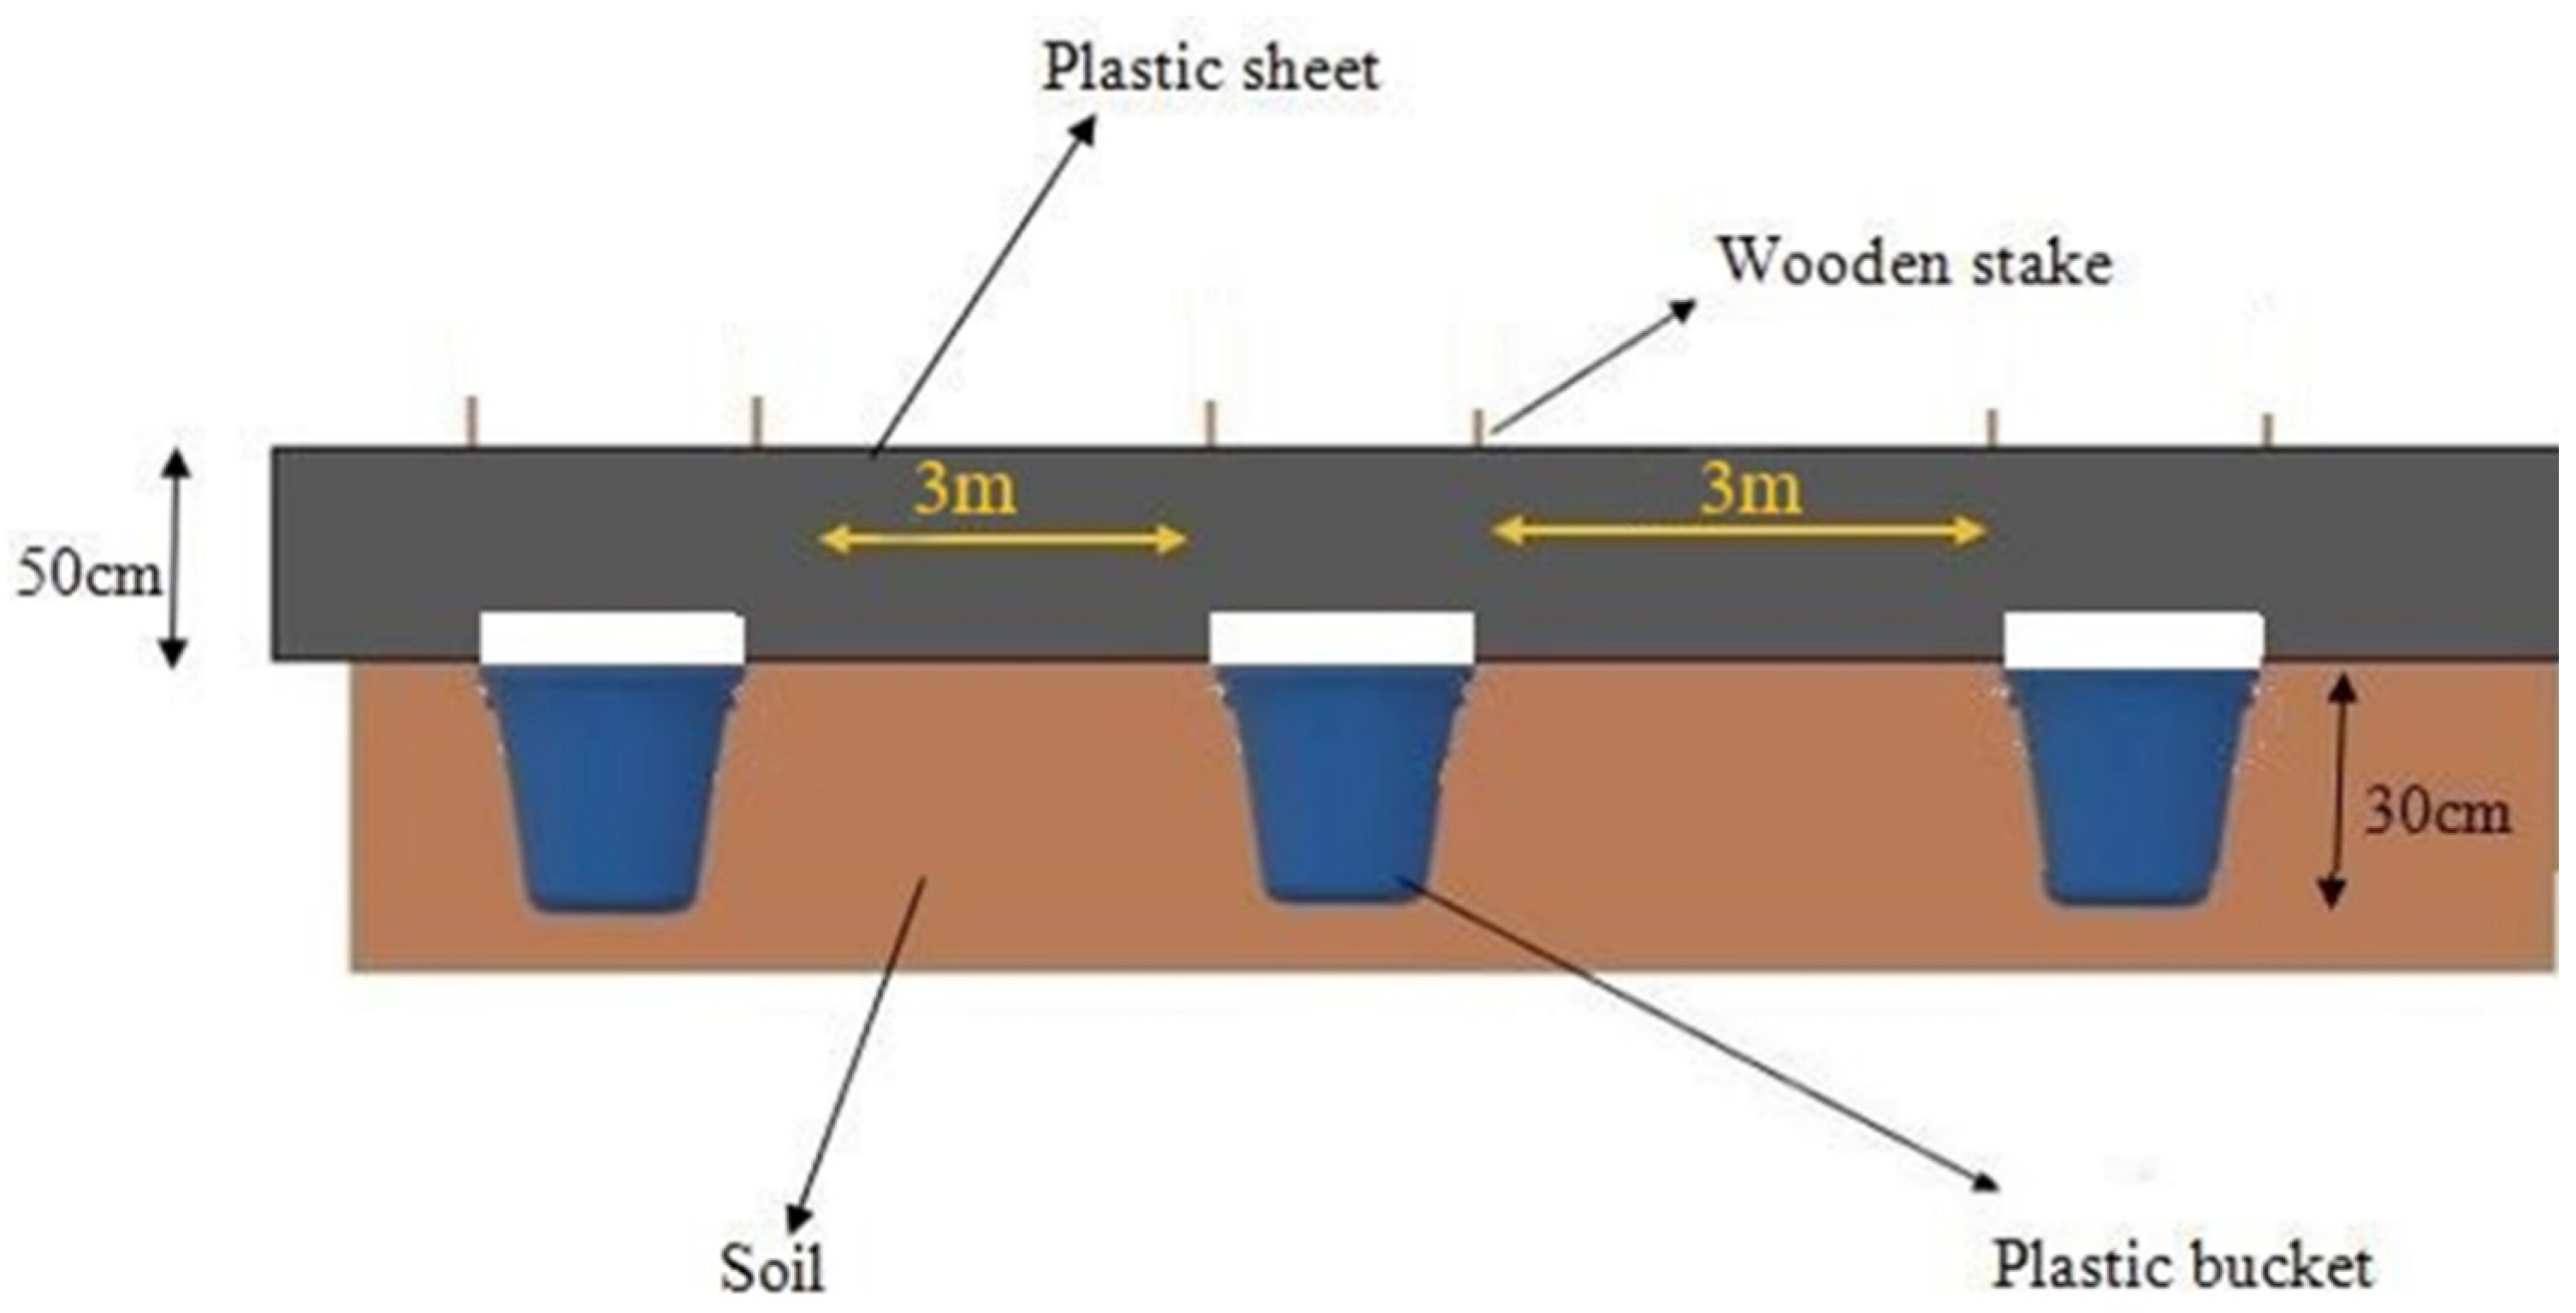
To complement the transect surveys, a trapping system was employed specifically within the riverine forest habitats. This involved installing drift fences with pitfall traps, following the design of Heyer [11]. Each drift fence was constructed from a 55-m-long 50-cm-high plastic sheet, designed to intercept ground-dwelling amphibians (Figure 2). Ten pitfall traps, made from 10-L capacity buckets, were buried at 3 m intervals along both sides of the fence. These traps were checked twice daily, in the early morning and before sunset, to document captured specimens.
In addition, an active search for amphibians was conducted at random locations away from the transect lines. This involved turning over logs, leaf litter, tree holes, rocks, and other potential hiding places. To assess the completeness of the species inventory and the sufficiency of our sampling effort, we generated a species accumulation curve.
Sampling effort was standardized across all sites by maintaining a consistent time and area protocol (18 h per transect per season). While we utilized species accumulation curves to assess detectability and inventory completeness, no mathematical effort correction (such as rarefaction) was applied because the curves reached a clear plateau, indicating that the standardized sampling effort was sufficient to capture the majority of the local species pool. Similarly, opportunistic searches conducted away from transect lines were standardized across habitats in terms of time effort and were used solely to complement the species checklist. These records were excluded from abundance-based statistical analyses to avoid sampling bias.

2.4. Specimen Handling

Amphibian handling and identification followed strict ethical and scientific protocols to ensure specimen integrity. All captured individuals were handled with care to minimize stress and prevent injury. We housed each specimen temporarily in a clean, ventilated plastic container lined with moist paper towels to maintain hydration.

Field Identification and Assignment of Individuals

All amphibians encountered (n = 2175 individuals) were initially identified in the field based on external morphology, coloration, body size, skin texture, webbing, parotoid gland structure, call characteristics, and habitat association. Of these, 2032 individuals (93.4%) belonged to 11 species with well-established and unambiguous diagnostic characters and were therefore considered confidently identified in the field.
The remaining 143 individuals (6.6%) belonged to five taxa within genera known to exhibit high phenotypic plasticity or cryptic diversity (Hoplobatrachus, Sclerophrys, Ptychadena, and Phrynobatrachus). Initial identification of these five taxa relied on a combination of morphological features and advertisement call characteristics, following established taxonomic keys for the region. However, we acknowledge that in the absence of comprehensive molecular data for all individuals, the species richness within these cryptic lineages may be underestimated, as phenotypic traits alone may not always distinguish sister species. We identified species in the field using authoritative taxonomic keys and field guides (e.g., [2,13,14,15,16]). We collected morphometric data from live animals whenever possible. Specimens that could not be confidently identified in the field were humanely euthanised for further analysis as voucher specimens. Specimens selected for voucher deposition were euthanised using topical application of 20% benzocaine gel. Immediately following euthanasia and prior to formalin fixation, a small liver or thigh muscle tissue sample was collected using sterile instruments. Tissue samples were preserved in 97% ethanol in 2.0 mL tubes and stored separately from formalin at all times. Voucher specimens were subsequently fixed in 10% buffered formalin and reinjected daily for the first three days to ensure adequate fixation, before long-term storage in 70% ethanol.
In addition to species identification, each individual was classified by life stage as adult, juvenile, or metamorph/froglet based on body size, degree of limb development, and tail resorption. Sex was determined for adults when secondary sexual characters were visible, such as nuptial pads, vocal sacs, calling behaviour, or gravid condition. Sex could not be reliably determined for juveniles, metamorphs, or non-calling adults lacking clear dimorphic traits.

2.5. Molecular Species Identification

Species identification was primarily based on morphological characteristics, with molecular validation performed for five taxa belonging to genera known for high phenotypic plasticity or cryptic diversity [17,18], while the remaining 11 species exhibited unambiguous diagnostic characteristics enabling confident identification based solely on morphology.
Sequencing was restricted to individuals for which properly vouchered tissue samples were available, and that yielded sufficient, high-quality DNA for amplification. Additional constraints included project budget limits. Several recorded species (including Phrynobatrachus sp. 1) were not sequenced because available specimens did not meet molecular-quality requirements (e.g., inadequate preservation or insufficient DNA yield). Where appropriate, we retained voucher specimens for future molecular work (Table S3).
We collected muscle tissue and stored it in 2.0 mL Eppendorf tubes containing 97% ethanol. All DNA extractions were performed using the Qiagen Tissue and Blood kit, following the manufacturer’s instructions. Due to the universal success of 16S primers and their widespread application in anuran barcoding, we decided to amplify this region, sequencing one individual representative from each morphologically identified species [19].
The PCR thermo-cycling conditions were as follows: initial denaturation for 2 min at 94 °C, followed by 35 cycles of denaturation at 94 °C for 30 s, where DNA separates into single strands; annealing at 48 °C for 30 s, where primers bind to the single-stranded DNA; and extension at 72 °C for 1 min, where Taq DNA polymerase adds nucleotides to the 3′ end of the growing strand.
A master mix PCR reaction volume of 48 μL was prepared, using the primer pair 16S_F (5′-CGCCTGTTTAYCAAAAACAT-3′) and 16S_R (5′-CCGGTYTGAACTCAGATCAYGT-3′). Unpurified PCR products were sequenced in both forward and reverse directions using the BGISEQ-500 sequencing service. All amplicons were sequenced at BGI using Sanger sequencing. We checked the sequence electropherograms by eye and aligned the 16S sequences in BioEdit Sequence Alignment Editor version 7.2.5 [20]. To confirm species identity, we employed BLAST (https://blast.ncbi.nlm.nih.gov/Blast.cgi; accessed 10 April 2024; NCBI, Bethesda, MD, USA). However, 16S sequences were not available in GenBank for every anuran species potentially occurring in Ethiopia. In the second step, we downloaded those orthologous sequences from GenBank that matched our 16S sequences best, aligned them with our sequences and reconstructed a phylogenetic tree for 16S using the Maximum Likelihood (ML; GTR + G + I) algorithm with 1000 bootstrap replications in MEGA12 [21]. Since all anuran species in our genetic sample were members of the suborder Neobatrachia, we used Xenopus (Mesobatrachia) as an outgroup.

Selection of Individuals for Sequencing

Molecular sequencing was used to validate species identity rather than to barcode all individuals. Representative individuals were selected for sequencing based on (i) availability of well-preserved tissue collected prior to formalin fixation, (ii) representation of each uncertain morphotype, (iii) coverage across sites and sampling years. Once molecular identity was confirmed for a given morphotype, all remaining individuals exhibiting identical morphology, size class, coloration, call (when available), and habitat association were assigned to the same species.

2.6. Species Diversity

To characterize anuran diversity, we calculated the Shannon index (H′), Simpson’s index (1 − D), and Pielou’s evenness (J′) for each habitat type and for the entire study area [22,23,24]. Differences in species composition among the four habitat types were assessed using Jaccard’s and Sorensen’s similarity indices. All statistical procedures, including the calculation of diversity indices and similarity measures, were performed using R version 4.4.1 [25]. Specifically, the ‘vegan’ package version 2.6-6 was utilized for these diversity estimates to ensure full reproducibility of the results.

2.7. Multivariate Community Analyses

To assess differences in anuran community composition among habitat types, multivariate analyses were performed using species abundance data per transect. Abundances were square-root-transformed to down-weight highly dominant species, and a Bray–Curtis similarity matrix was constructed. We visualized community clustering at the transect level using Non-metric Multidimensional Scaling (NMDS). Differences in composition among habitats were statistically tested using Analysis of Similarities (ANOSIM), with pairwise R-values used to evaluate specific habitat-level differences. Pairwise R-values were interpreted as follows: R ≈ 1 indicates complete separation; R > 0.75 indicates well-separated communities; R > 0.5 indicates overlapping but clearly different groups; R < 0.25 indicates weak separation; and R ≈ 0 indicates no separation. To further visualize these relationships, a secondary NMDS was performed based on the ANOSIM R-values to show relative habitat dissimilarity.
Finally, a Similarity Percentages (SIMPER) analysis was conducted to identify the species contributing most to the observed dissimilarities. All these statistical procedures, including NMDS, ANOSIM, and SIMPER, were performed using R (version 4.4.1). Specifically, the ‘vegan’ package was utilized to conduct these community composition tests to ensure full reproducibility of the results.

3. Results

3.1. Species Accumulation Curve

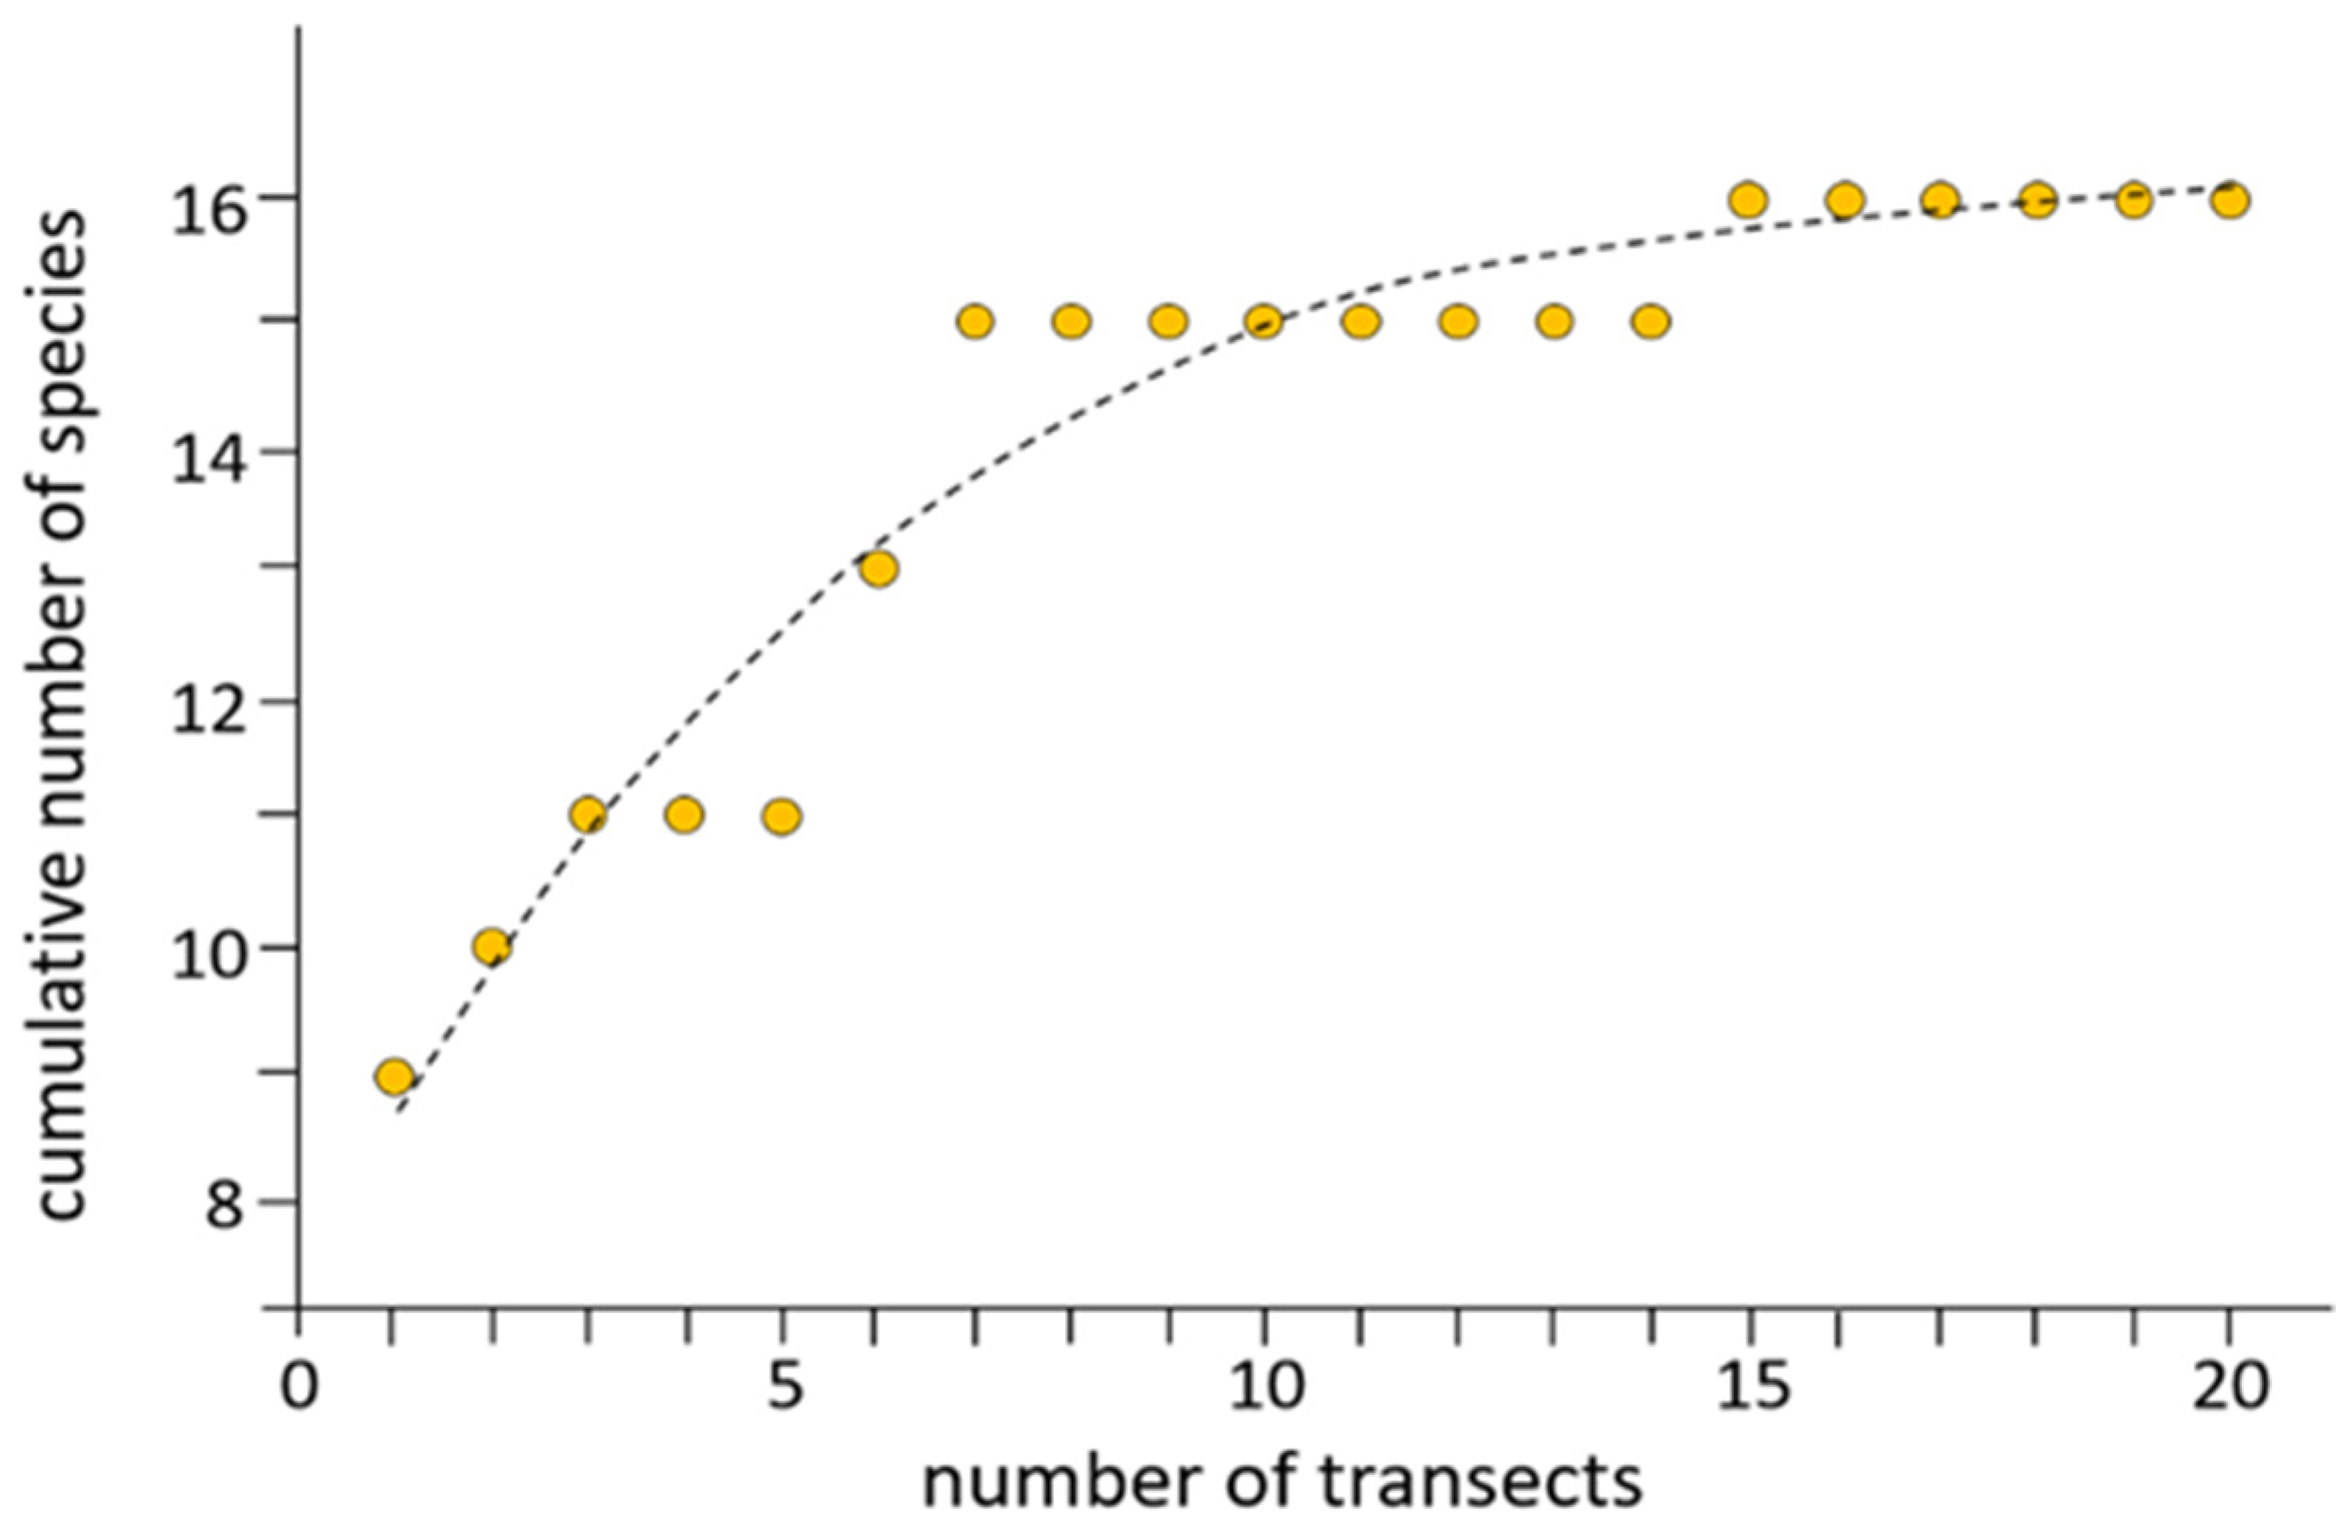
The species accumulation curve indicated that sampling effort was sufficient to capture most of the anuran diversity present within the surveyed habitats. A total of 16 anuran species were recorded across 20 transects, with species richness increasing steadily during the initial sampling phase before reaching a plateau during the final six transects (Figure 3).
This asymptotic pattern suggests that additional sampling would likely yield few additional species within the sampled habitats, supporting the completeness and reliability of our inventory. (Additional information about the recorded species is provided in Table S2).

3.2. Molecular Species Identification

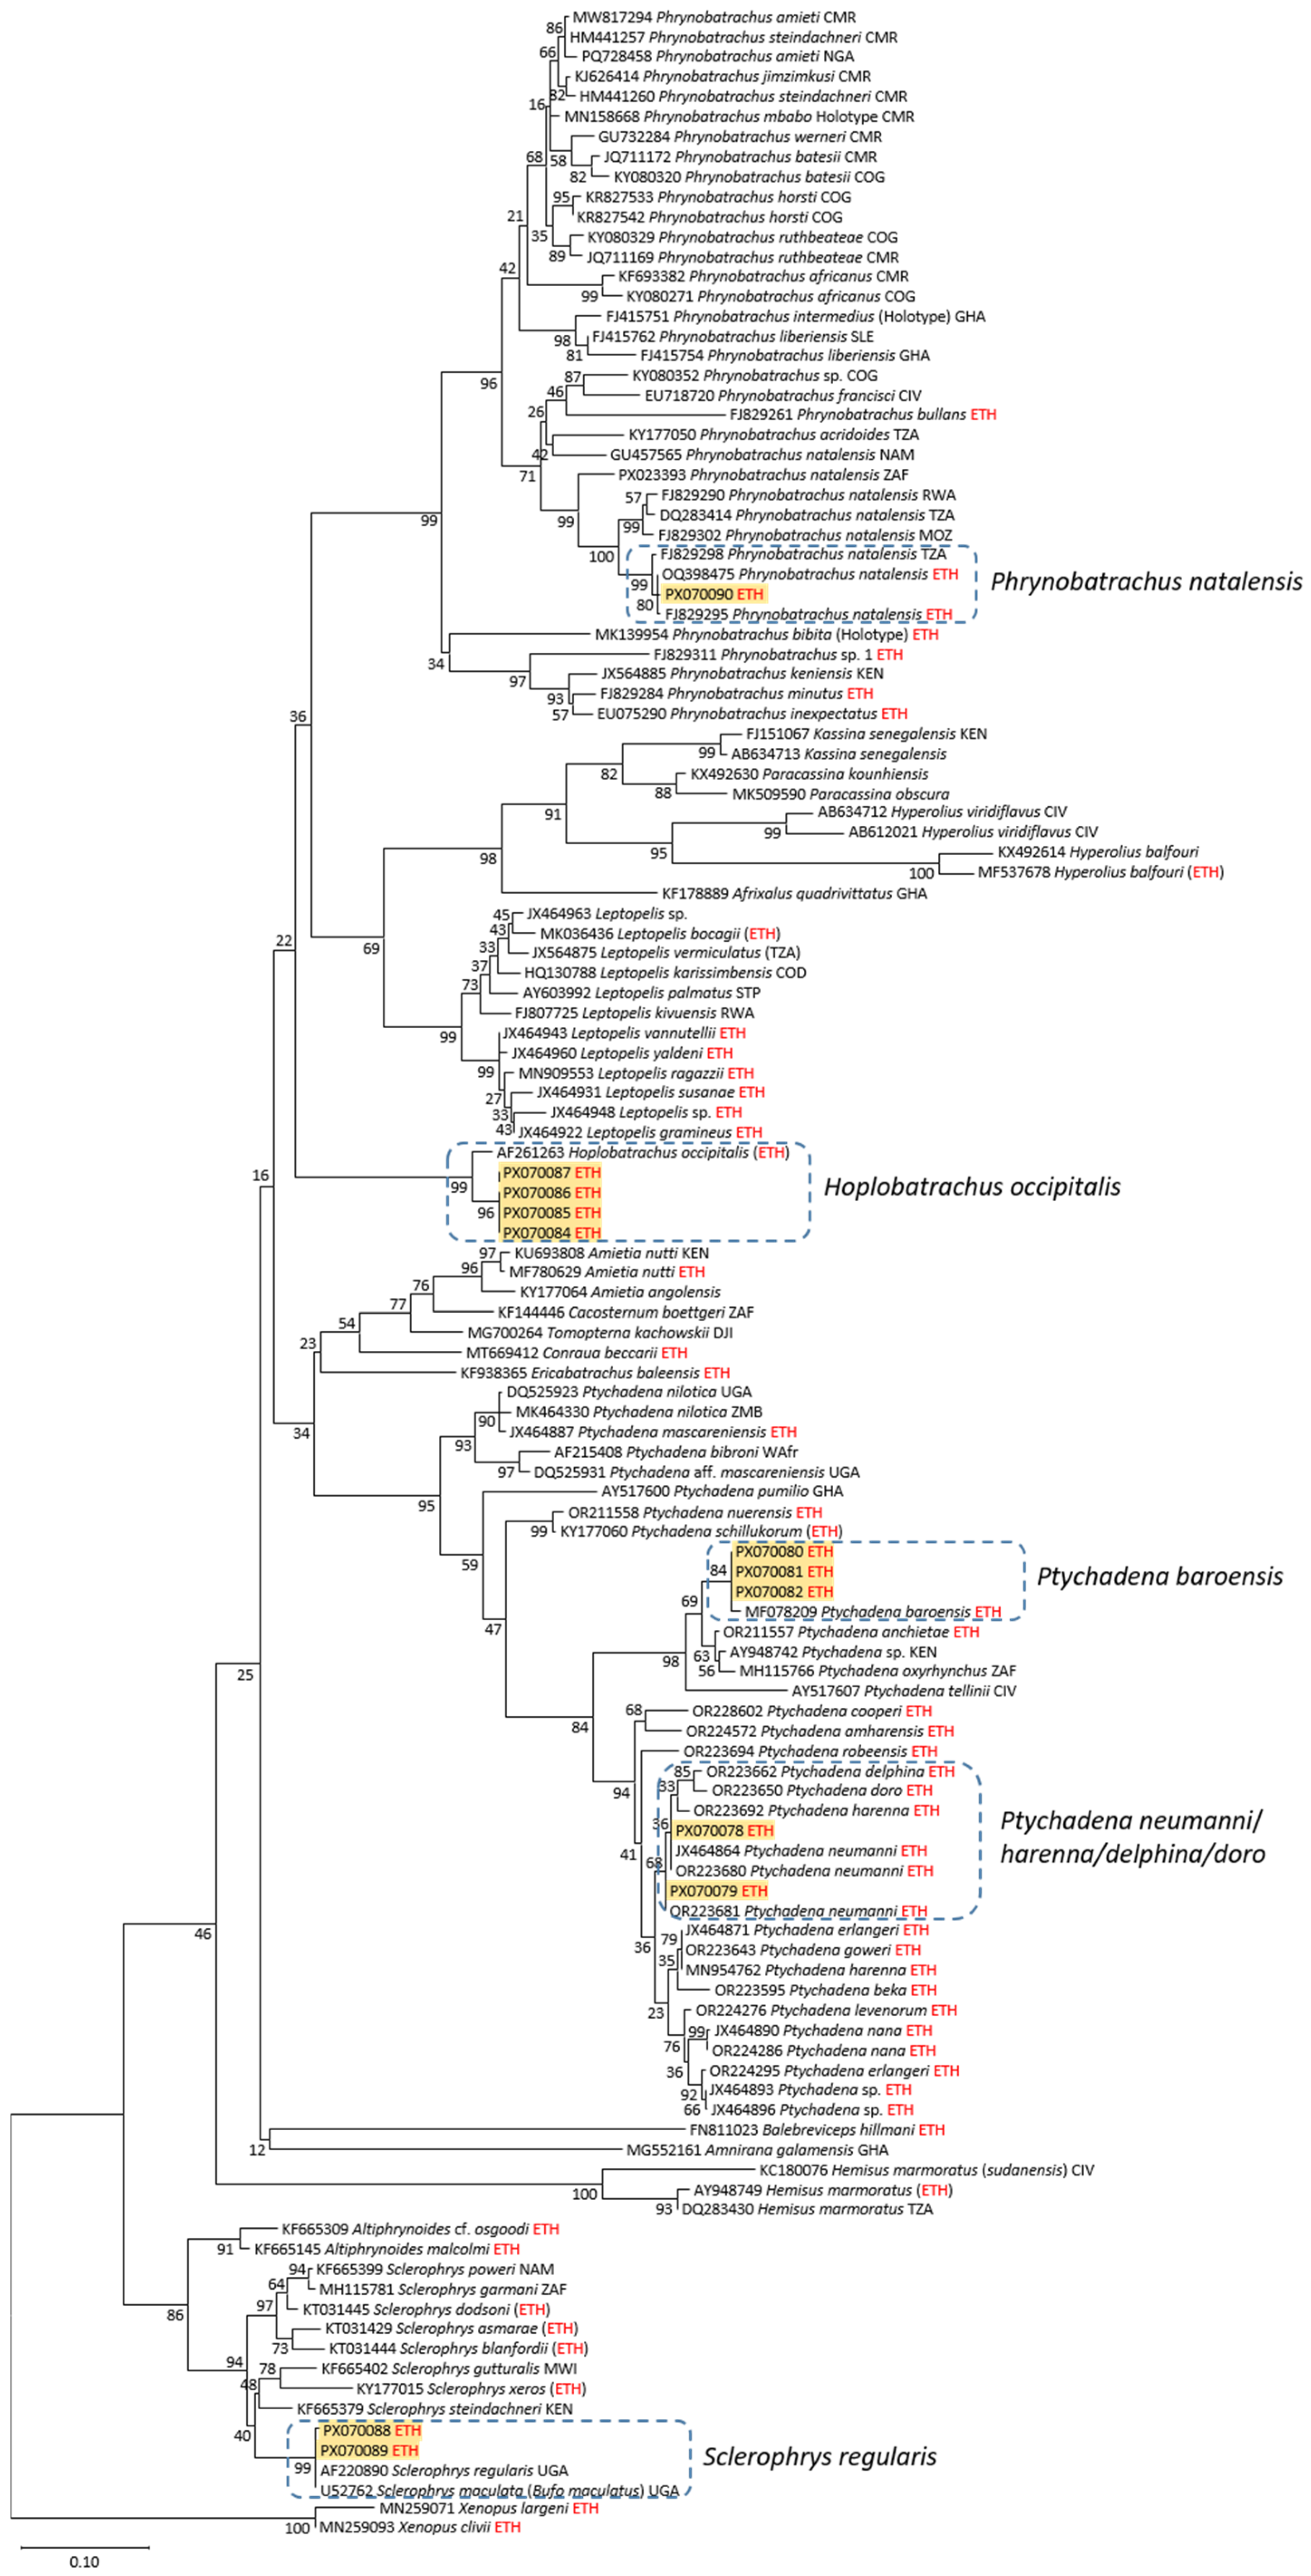
Our genetic species identification and phylogenetic reconstruction revealed that three anuran taxa belong to widespread African species, Hoplobatrachus occipitalis, Sclerophrys regularis, and Phrynobatrachus natalensis (Figure 4). Several of our collected specimens were juveniles, and we identified them phenotypically as Ptychadena anchietae and Ptychadena erlangeri.
However, the 16S sequence of samples identified morphologically as P. anchietae exhibited a higher sequence similarity to the recently described endemic P. baroensis (100% identity) than to P. anchiatae. The phylogenetic clustering of our sequences with sequences of P. baroensis confirms this result (Figure 4). The sequences that were assigned phenotypically to P. erlangeri were identical to sequences of the endemic P. neumanni, which is the most widespread species of highland Ptychadena in the Southwest of Ethiopia. On the phylogenetic tree, our sequences group with a clade consisting of P. neumanni, P. harenna, P. delphina and P. doro (Figure 4). The relationships between species appear unresolved, which is not surprising due to the evolutionary proximity between these species and because 16S does not offer sufficient phylogenetic resolution at that scale. However, we can exclude that our samples belong to the other species of this clade because the 16S sequences differ from P. harenna, P. delphina and P. doro by 13, 15 and 16 mutations respectively, while it is identical to sequences of P. neumanni.
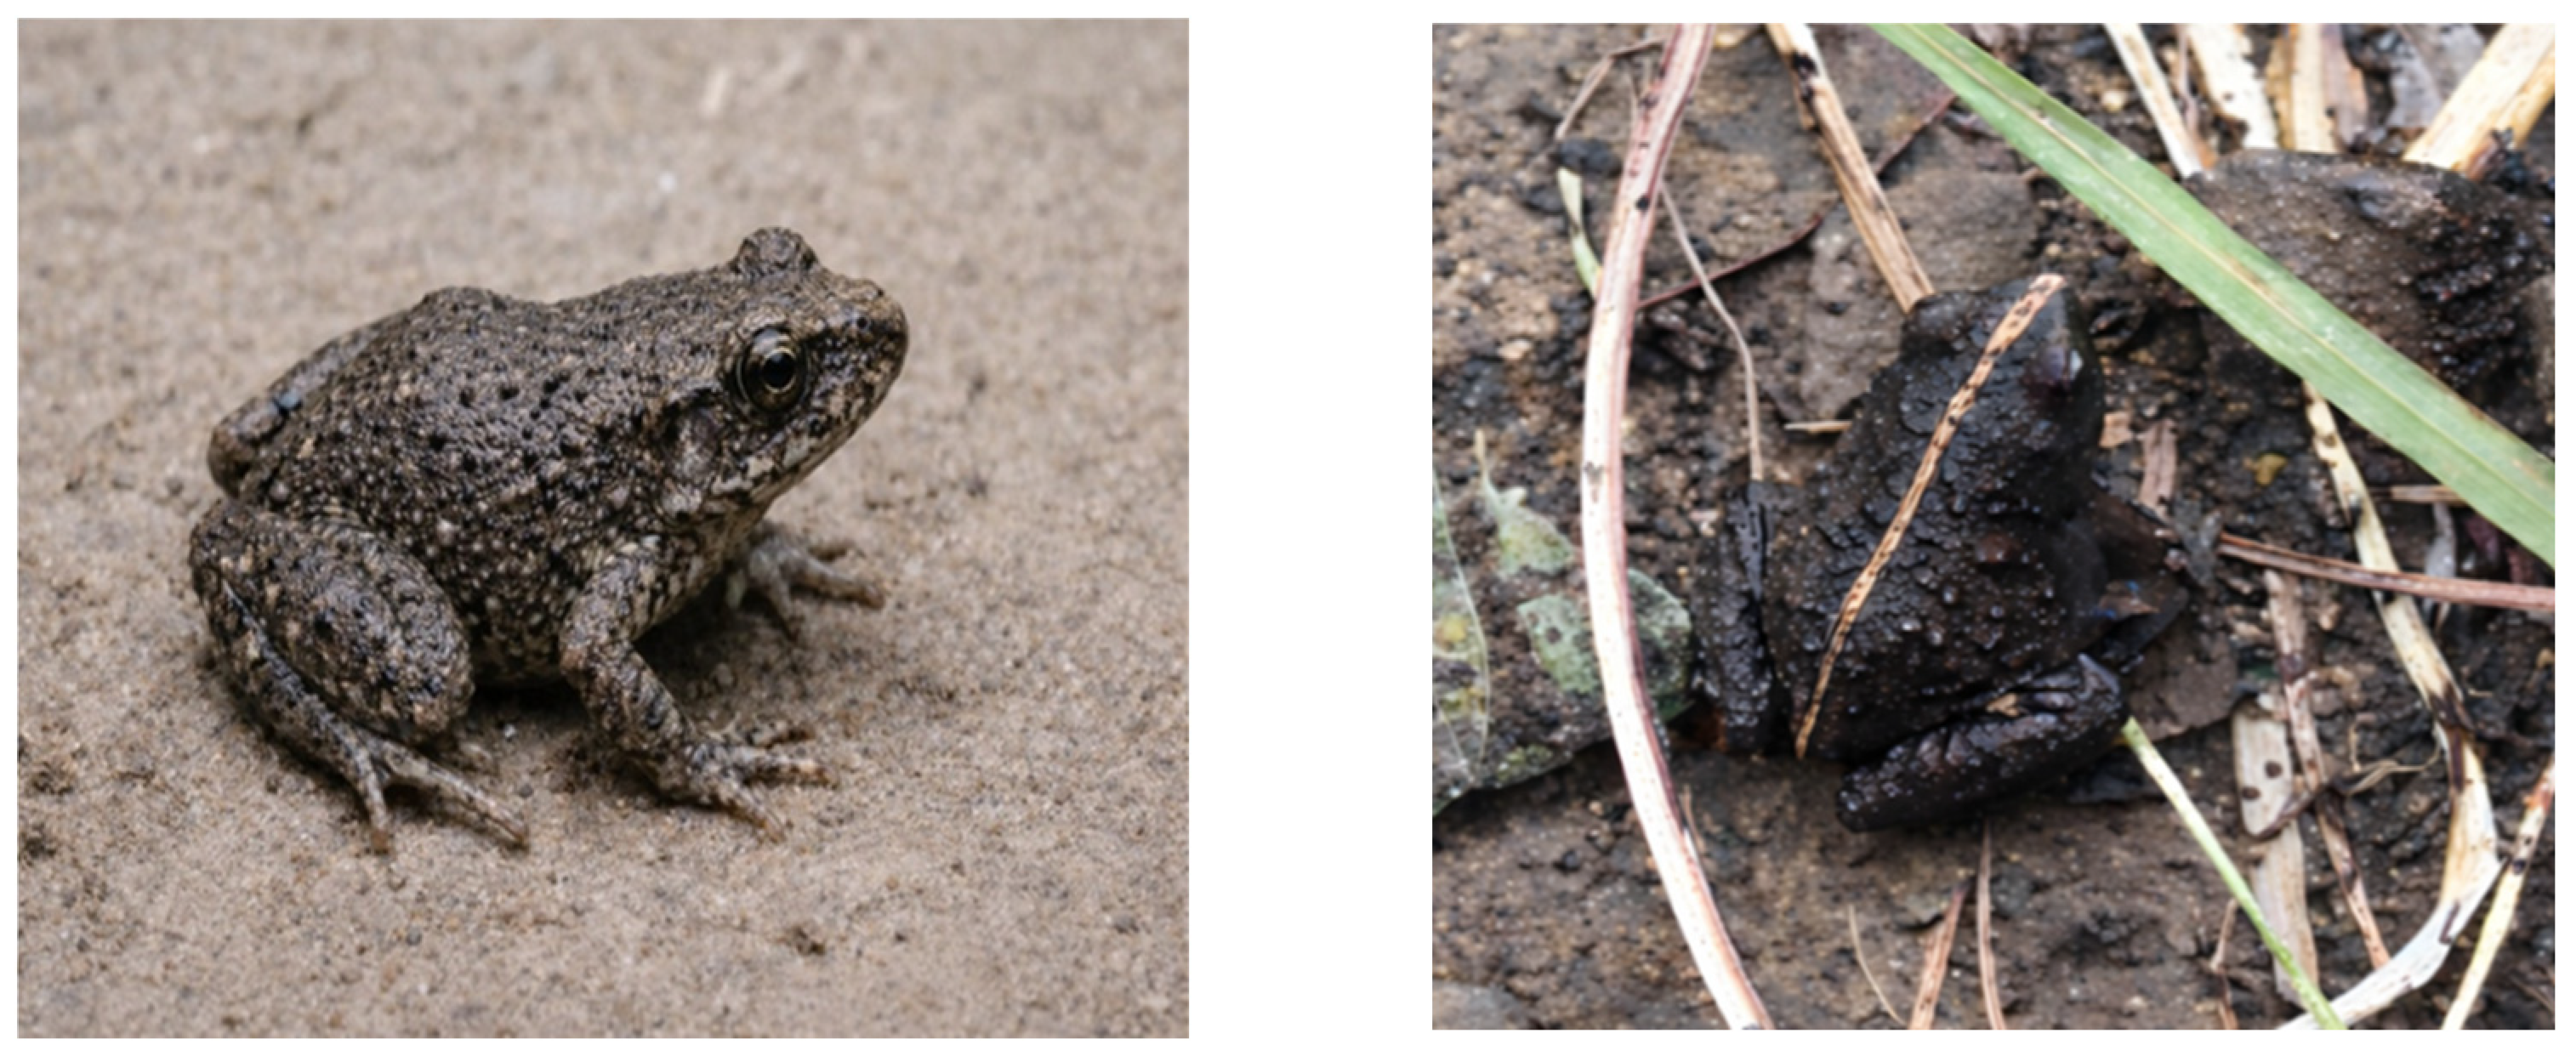
Not all recorded taxa were subjected to molecular sequencing, primarily due to limitations in tissue quality or DNA yield. In particular, Phrynobatrachus sp. 1 could not be successfully sequenced despite repeated attempts to amplify the 16S fragment. Nevertheless, its consistent morphological traits, ecological association, and clear differentiation from P. natalensis support its conservative treatment as a distinct taxon within the genus. While molecular confirmation is still required, the available evidence justifies its provisional recognition pending future targeted genetic analyses. However, phenotypic characters clearly support its placement within the genus Phrynobatrachus, and we therefore treat it conservatively as Phrynobatrachus sp. Phenotypically, this taxon resembles Phrynobatrachus inexpectatus (Figure 5), an endemic frog found in the Harenna Forest of Ethiopia (https://www.inaturalist.org/taxa/25378-Phrynobatrachus-inexpectatus; accessed 15 April 2024).

3.3. Species Composition

We detected 2175 individual anurans from 8 families and 16 species. Ptychadenidae was the most abundant family, comprising 606 individuals from four species, followed by Bufonidae, with 381 individuals from four species. The Phrynobatrachidae had the smallest abundance with 124 individuals from two species (Table 2).

3.4. Seasonal Variation in Anuran Species Across Habitats

Anuran species richness and abundance were greater in the wet season (1796 individuals of 14 species) than in the dry season (379 individuals of 11 species), reflecting most likely seasonal breeding and activity patterns commonly observed in anurans (Table 3).
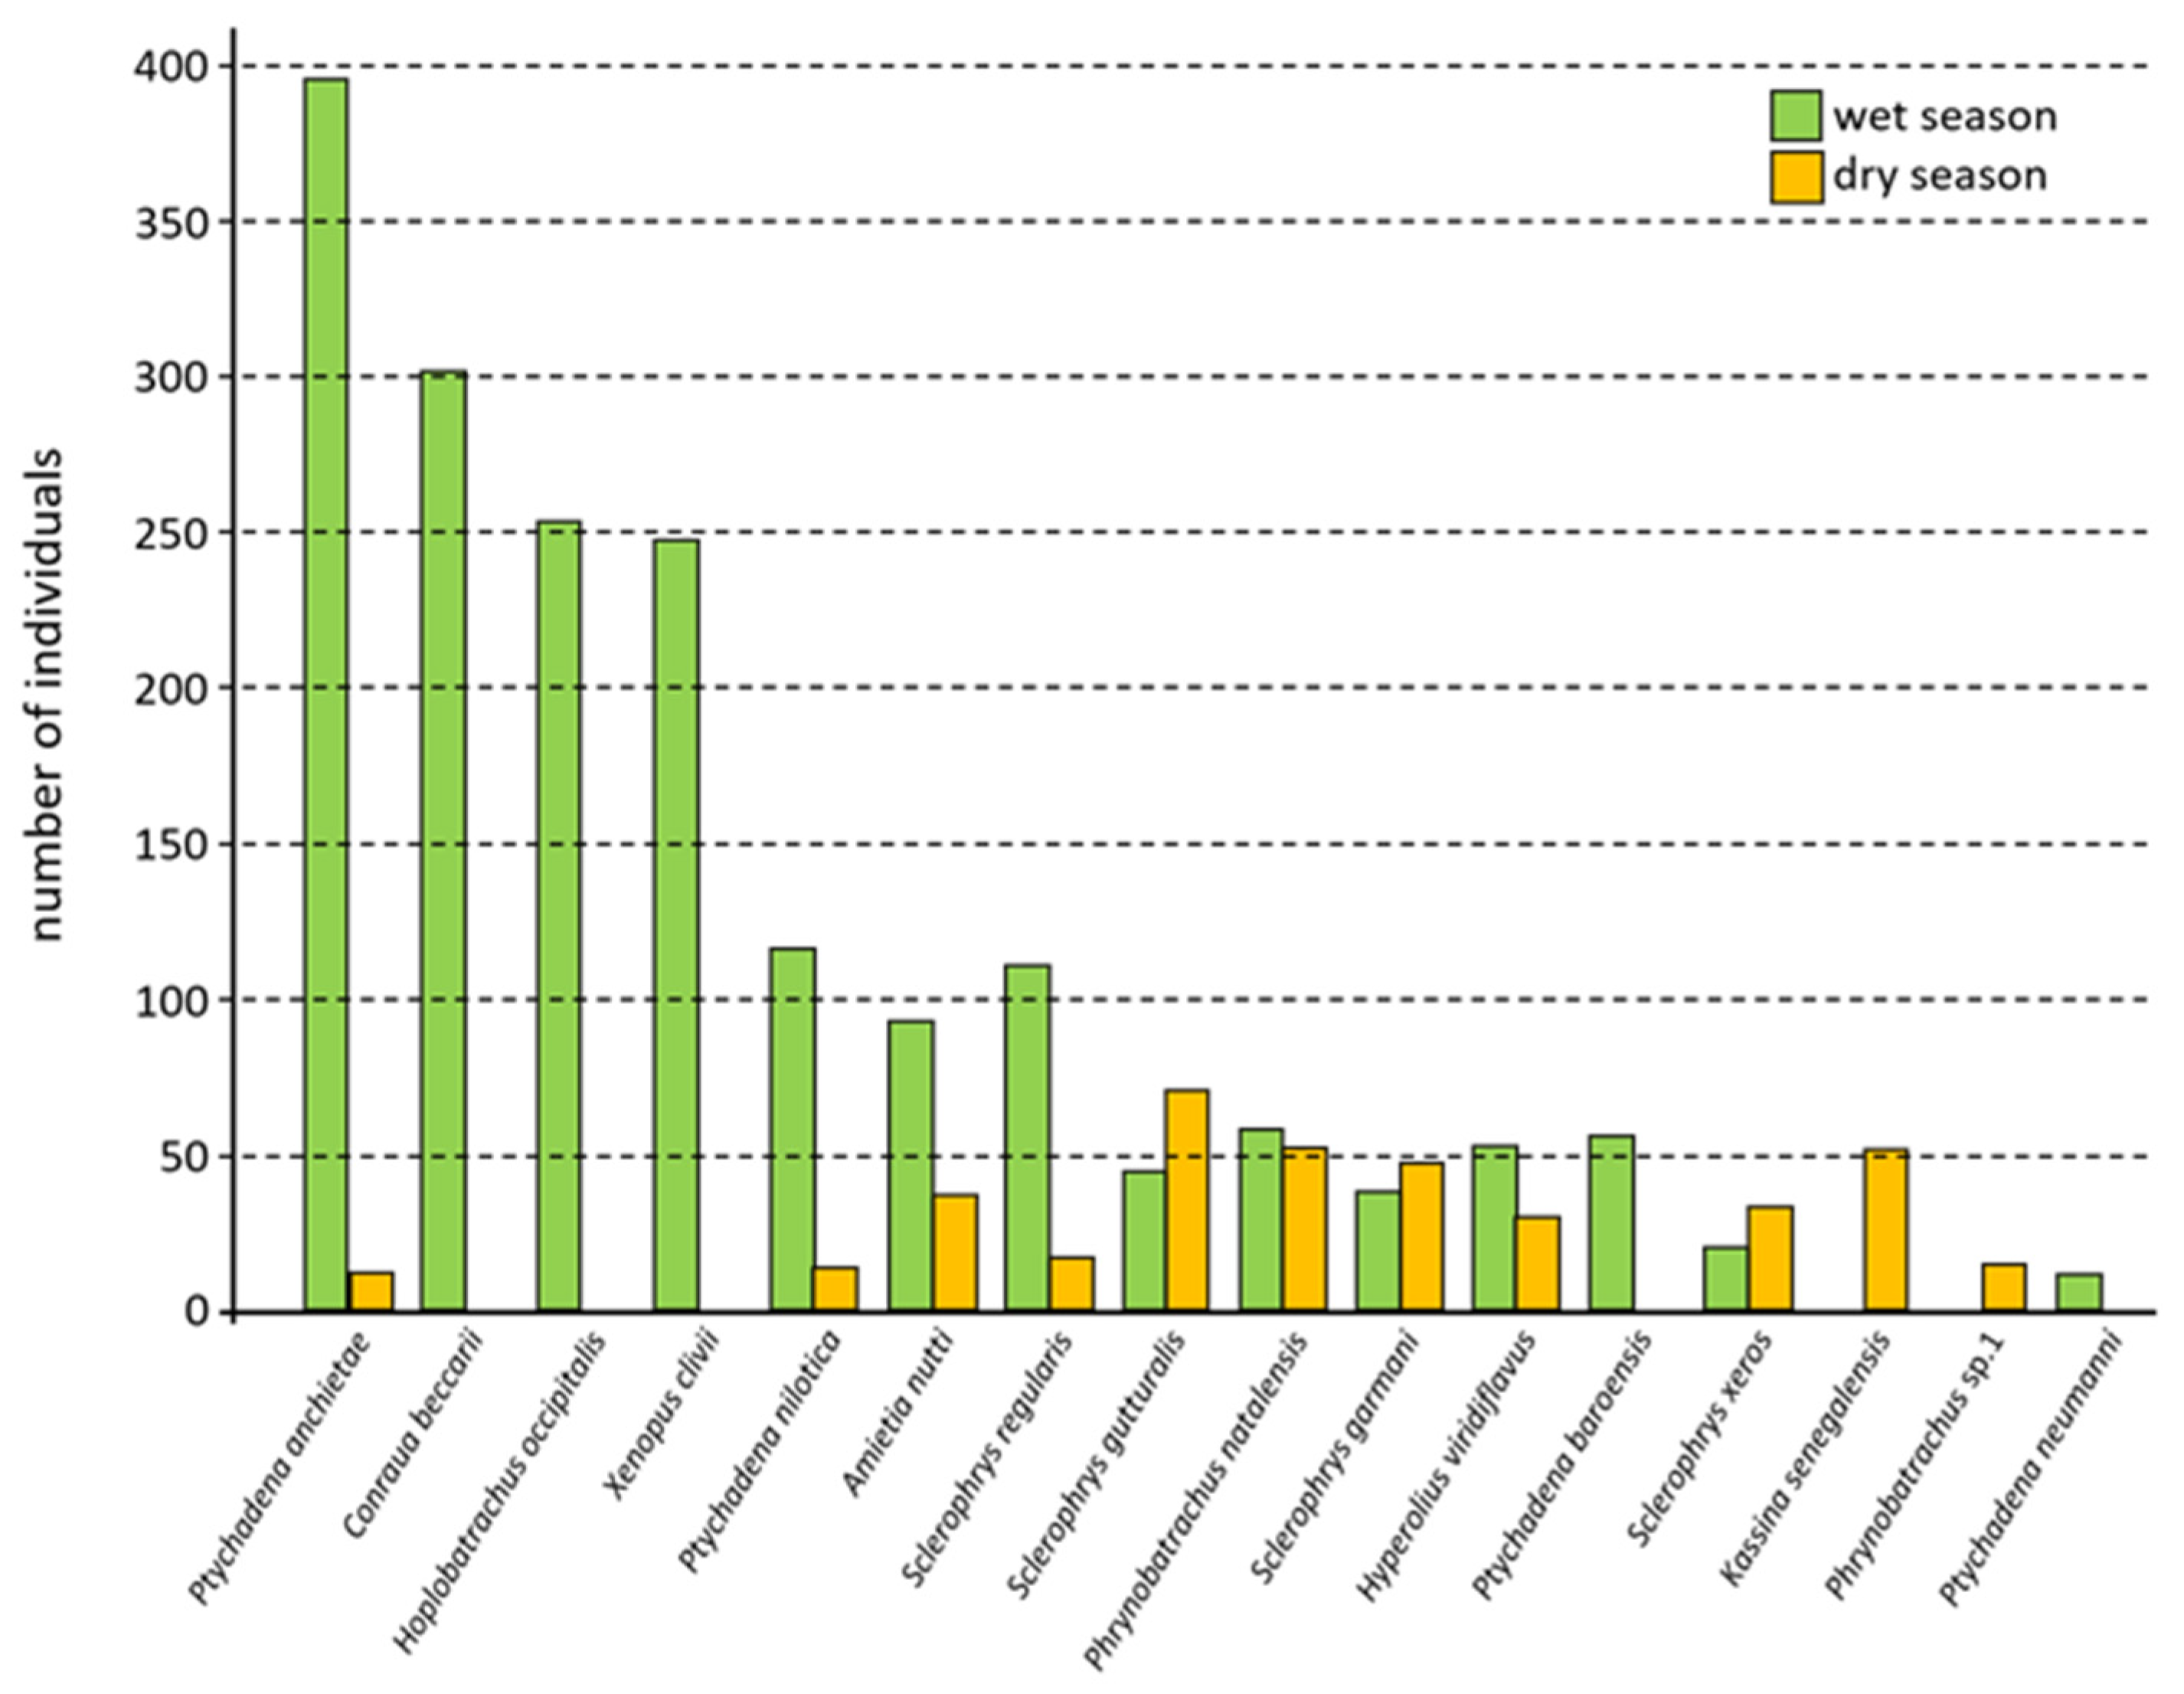
We found larger species richness and abundance in three of four habitat types during the wet season, but the contrary for woodland. Species with markedly higher wet season abundance than dry season include Ptychadena anchietae, Ptychadena nilotica, Sclerophrys regularis and Amietia nutti. Only Sclerophrys gutturalis, Sclerophrys xeros and Sclerophrys garmani show slightly higher abundance in the dry season than the wet season (Figure 6).
Most species exhibited higher detectability during the wet season, particularly in riverine forests and savannah grasslands (Table 3). During the dry season, fewer species were active, primarily restricted to permanent or semi-permanent water bodies that retained moisture year-round or for extended periods.
Riverine forest and savannah grassland supported the highest number of species. Several taxa exhibited strong habitat specificity, including Conraua beccarii and Xenopus clivii restricted to riverine forest and Phrynobatrachus sp. 1 confined to woodland.
Life-stage composition varied strongly between seasons. Adults dominated records during the wet season, coinciding with peak breeding activity, whereas juveniles and metamorphs were more frequently recorded toward the late wet season and early dry season. Species such as Ptychadena anchietae, P. nilotica, and Sclerophrys regularis showed pronounced juvenile recruitment following heavy rainfall events (Table S3).

3.5. Species Richness and Abundance Across Habitats

The results detail the abundance of 16 amphibian species across the four sampled habitat types, with a total of 2175 individual amphibians recorded across the study. The total number of individuals varied dramatically across the habitats, clearly showing that the riverine forest is the dominant habitat for amphibian abundance (Table 4). The riverine forest alone accounted for over half (53.3%) of all recorded individuals, highlighting its critical role in supporting the amphibian community, likely due to its high moisture availability and permanent water sources. Woodland habitat had the lowest total abundance, suggesting it is the least favorable of the four habitats for the total amphibian community.

3.6. Diversity Indices of Anuran Species per Habitat Types

Diversity indices were calculated for each transect (n = 5) within the four habitat types. Riverine forests exhibited the highest species richness and abundance, while savannah grasslands showed the lowest diversity. Although riverine forests supported most species, their evenness was lower than that of woodland and montane forests (Table 5).

3.7. Similarity Indices of Anuran Species Between Habitats

Similarity indices were calculated to measure the overlap in species composition between habitats. Table 6 presents the Jaccard similarity indices below the diagonal and the Sorensen similarity indices above the diagonal. We found the highest similarity between riverine forest and savannah grassland (Jaccard = 0.643, Sorensen = 0.783), while the lowest similarity was observed between riverine forest and woodland (Jaccard = 0.118, Sorensen = 0.211).

3.8. Multivariate Differences in Anuran Community Composition

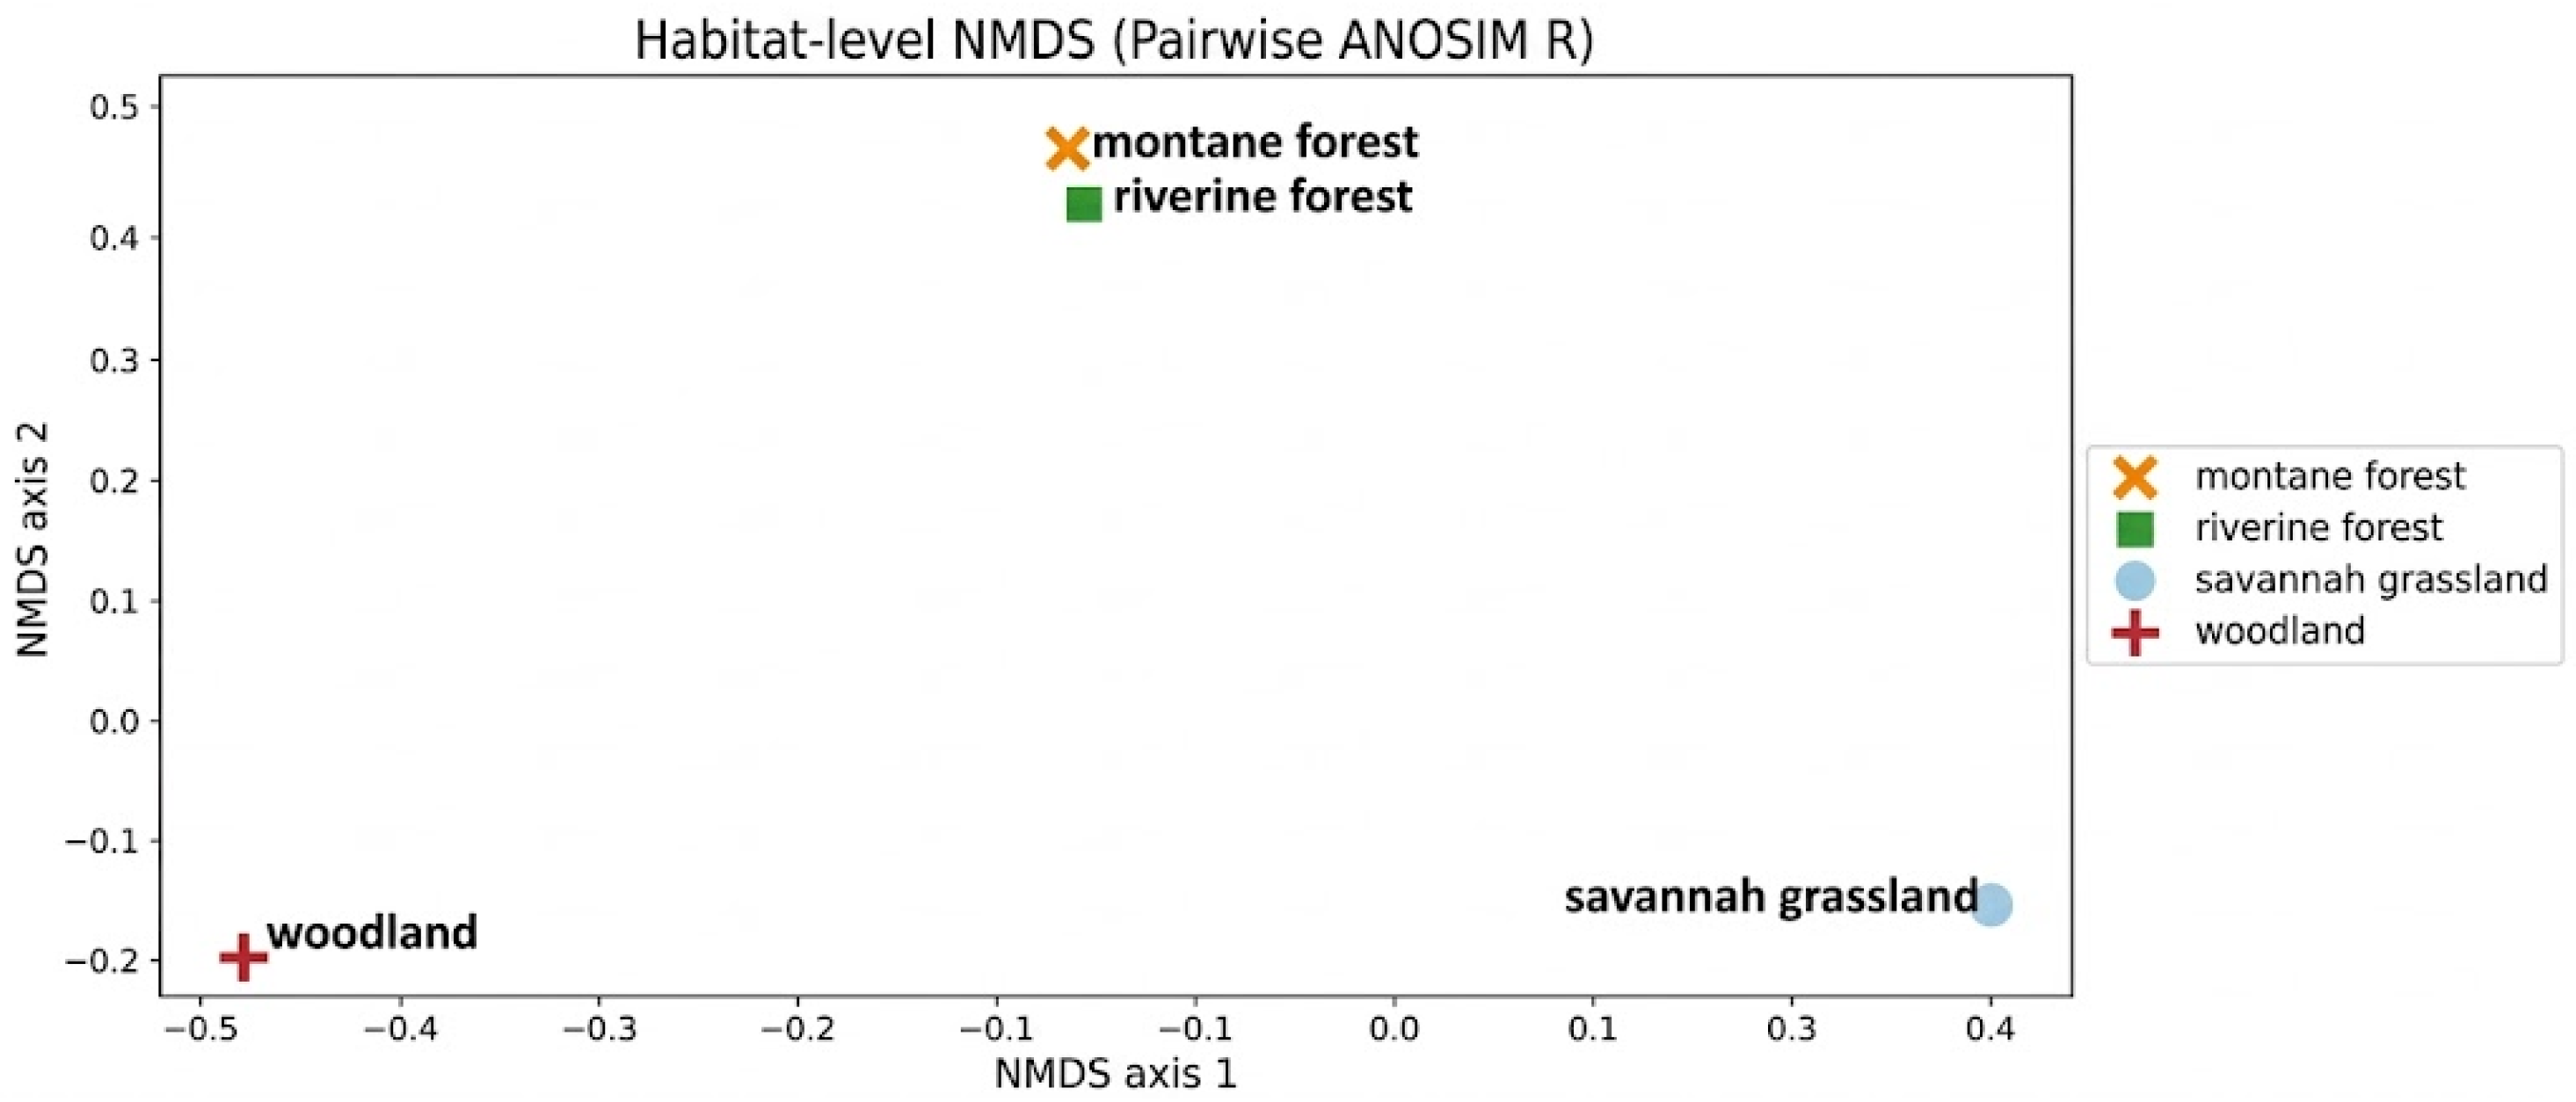
Multivariate analyses revealed significant habitat-associated differences in anuran community composition. ANOSIM detected overall significant differentiation among habitat types (global R = 0.62, p < 0.001), indicating moderate to strong community structuring. Pairwise comparisons showed the greatest dissimilarity between riverine forest and woodland habitats (R = 0.88), indicating well-separated assemblages. In contrast, montane forest and savannah grassland exhibited lower differentiation (R = 0.42), reflecting partial compositional overlap.
SIMPER analysis indicated that differences between riverine forests and other habitats were primarily driven by high abundances of Conraua beccarii, Xenopus clivii, and Hoplobatrachus occipitalis, which were largely restricted to riverine environments (Table 7). In contrast, woodland communities were characterized by higher contributions from disturbance-tolerant species such as Sclerophrys xeros and Sclerophrys gutturalis. Savannah grassland assemblages were dominated by open-habitat species, particularly Ptychadena anchietae and P. nilotica.
The transect-level NMDS based on Bray–Curtis dissimilarity showed considerable overlap among habitat types and therefore did not provide clear visual separation of communities. Given this overlap, we focus our interpretation on habitat-level differentiation as represented by ANOSIM results and a secondary NMDS derived from pairwise ANOSIM R-values. The secondary NMDS ordination highlights relative dissimilarity among habitats rather than individual transects (Figure 7). Riverine forest assemblages were clearly separated from woodland (pairwise R = 0.88), indicating well-separated communities (R > 0.75). In contrast, montane forest and savannah grassland exhibited lower differentiation (pairwise R = 0.42), reflecting overlapping but compositionally distinct assemblages (R > 0.25 but <0.5). These results demonstrate moderate but ecologically meaningful habitat structuring of anuran communities.

4. Discussion

4.1. Molecular Species Identification

Molecular species identification confirmed that anuran specimens in this study clustered consistently with reference sequences, supporting the reliability of morphological identifications. Several taxa were confirmed as widespread African species, including Hoplobatrachus occipitalis, Sclerophrys regularis, and Phrynobatrachus natalensis [26].
The occurrence of a small-bodied population, provisionally referred to here as Phrynobatrachus sp. 1, highlights unresolved taxonomic diversity within the genus in south-western Ethiopia. As illustrated in Figure 5, Phrynobatrachus sp. 1 exhibits a distinct combination of morphological characters—specifically overall body size, dorsal coloration, and patterning—that distinguish it from both P. natalensis and P. inexpectatus.
This specific taxon (Phrynobatrachus sp. 1) was recorded at an elevation of 1220 m. While the known altitudinal range for the genus in Ethiopia extends significantly higher (e.g., P. natalensis occurs up to ~2200 m asl [26]), this 1220 m record provides important ecological and altitudinal context for this newly identified, small-bodied lineage within the region’s diverse landscape.
Although high-quality photographs and a tissue sample were obtained, the sample was not used for genetic sequencing and was therefore excluded from phylogenetic analyses. Further targeted surveys are required to collect appropriate molecular material and resolve its taxonomic status. This finding is consistent with recent work by Kassie [12], which suggested that small Phrynobatrachus populations in south-western Ethiopia may represent undescribed species, highlighting the potential for unrecognised amphibian diversity in the region.
In contrast, two taxa within the genus Ptychadena proved difficult to identify using morphology alone and can be regarded as cryptic species. Sequences of specimens initially identified as Ptychadena anchietae clustered with Ptychadena baroensis, an Ethiopian endemic. The phylogeny tree clearly supports P. baroensis as a genetically distinct lineage, emphasizing its taxonomic validity and conservation significance. In the current study, P. baroensis was recorded at elevations of 1400–1500 m, within Sudanian-type lowland habitats that represent a distinct evolutionary and ecological component of Ethiopia’s amphibian fauna [27]. Similarly, specimens morphologically identified as P. erlangeri were identical in sequences with P. neumanni, which is the most widespread highland Ptychadena species in the vicinity of Chebera Churchura.
Overall, our study demonstrates that molecular approaches are indispensable for accurate species identification in morphologically conserved anuran lineages. Failure to detect cryptic endemic taxa may lead to an underestimation of biodiversity and conservation value [7], underscoring the importance of integrative taxonomic frameworks combining molecular and morphological evidence for amphibian assessments in Ethiopia.

4.2. Species Composition

The current study demonstrated that the family Ptychadenidae was the most abundant (606 individuals from four species), followed by Bufonidae (381 individuals from four species), and then other families with fewer individuals. The dominance of a few families (and indeed a few species) is consistent with many amphibian community studies, which often show an uneven distribution, a few abundant species and many rarer ones. For example, a study in the Yoko Forest Reserve in the Democratic Republic of Congo reported a few species accounting for a large share of individuals [28].
Seasonal variation strongly influenced anuran abundance and detectability in CCNP. Fourteen species comprising 1796 individuals were recorded during the wet season, compared to 11 species and 379 individuals in the dry season. This pronounced seasonal difference is consistent with well-documented breeding phenology in tropical amphibians, where rainfall triggers reproductive activity, increases calling behavior, and enhances surface activity [12,29,30]. The substantially higher wet-season abundance therefore reflects increased detectability and recruitment rather than seasonal species turnover.

4.3. Habitat and Seasonal Variation in Abundance and Species Richness

Although we found a significant difference between seasons in the number of individuals, species richness did not differ between the wet and dry seasons. Although some species may be less detectable or inactive during the dry season due to breeding phenology, microhabitat drying, or behavioural dormancy, the relatively consistent rainfall throughout the year likely maintains suitable conditions for amphibians in both seasons, resulting in comparable species availability [31,32].
Habitat type had a much stronger influence on anuran abundance and richness than seasonality. Riverine forests supported the highest number of individuals (1165), whereas woodland had the lowest abundance (249). The high diversity and abundance in riverine forests can be attributed to the presence of permanent water bodies, including rivers, wetlands, ponds, and swampy areas, which create consistently moist conditions favourable for amphibians. This habitat was dominated by stream- and forest-associated species such as Conraua beccarii, Xenopus clivii, and Hoplobatrachus occipitalis, which together accounted for a large proportion of the total abundance.
In addition to abundance-based observations, an additional survey method was employed to improve inference of amphibian diversity in riverine habitats. Specifically, acoustic encounter surveys were conducted alongside standardized visual encounter surveys to account for species that are cryptic, nocturnal, or more readily detected through advertisement calls than by direct observation. This approach is particularly relevant in riverine forests, where dense vegetation and complex microhabitats may limit visual detectability, while permanent water bodies promote calling activity. The combined use of visual and acoustic methods reduces detectability bias and has been shown to provide a more complete assessment of amphibian species richness in tropical environments [9,11]. Consequently, the higher diversity and abundance recorded in riverine forests are supported not only by numerical dominance but also by methodological complementarity that enhances detection of stream- and forest-associated taxa.
Seasonal variation in abundance was evident across all habitats, but was most pronounced in the riverine forest, where abundance declined sharply from 1117 individuals in the wet season to 48 in the dry season. In contrast, woodland showed a smaller absolute seasonal contrast (86 individuals in the wet season and 163 in the dry season), likely reflecting its generally lower baseline abundance and reduced dependence on permanent surface water. Savannah grassland habitats were primarily inhabited by open-habitat specialists, particularly Ptychadena anchietae, P. baroensis, and P. nilotica, species commonly associated with seasonally inundated grasslands and temporary water bodies [2]. These species exhibit ecological adaptations to fluctuating hydroperiods and open-canopy environments, allowing them to exploit breeding opportunities during rainfall events. However, comparatively lower structural complexity and higher exposure to disturbance likely limit overall species diversity in this habitat relative to forested systems. Woodland habitats were dominated by a limited assemblage of disturbance-tolerant generalist species, including Phrynobatrachus sp. 1, Sclerophrys gutturalis, and Sclerophrys xeros. These taxa are known for their ecological flexibility and ability to persist in modified or agroforestry landscapes [2]. In CCNP, woodland areas are partially influenced by agricultural activities, grazing, and human settlement, which may reduce habitat suitability for moisture-dependent forest specialists. Consequently, amphibian assemblages in woodland habitats appear shaped by disturbance regimes favoring generalist species with broader ecological tolerances.
The multivariate analyses indicate significant but moderate habitat structuring of anuran communities in CCNP. While overall ANOSIM results revealed significant differentiation among habitats, pairwise comparisons demonstrated that the strongest separation occurred between riverine forest and woodland assemblages. In contrast, montane forest and savannah grassland exhibited partial overlap, reflecting shared generalist species and transitional ecological gradients. These findings suggest ecologically meaningful differentiation rather than complete segregation of amphibian communities across habitats.
While our results demonstrate significant differences in anuran community composition across the four sampled habitat types, we acknowledge certain limitations in our sampling design. Specifically, with the exception of riverine forests (represented by two sites), each habitat type was sampled at a single site. Consequently, the observed differences in species richness and diversity may be influenced by site-specific factors other than habitat type alone. Furthermore, the study sites span an altitudinal gradient of nearly 1000 m (from 1250 m to 2000 m asl). As anuran diversity in Ethiopia typically declines with increasing altitude, it is likely that the patterns observed here are a combined result of both habitat structure and elevational constraints. Future studies with broader site replication across similar elevations are needed to fully decouple these effects.

4.4. Anuran Diversity Indices Among Four Habitat Types

Shannon’s diversity indices indicated that the riverine forest supported the highest anuran species diversity in CCNP, followed by montane forest, woodland, and savannah grassland. Despite its lower overall richness, woodland exhibited relatively high species evenness compared to the other habitats. In CCNP, woodland areas are largely modified landscapes dominated by banana (Musa sp.) and enset (Ensete ventricosum) cultivation [33] to support the statement that amusa and Ensete dominate the habitat). These agro-forestry systems appear to provide suitable microhabitats for anurans by offering abundant insect prey, shelter, and moisture retention. Similar patterns have been reported from south-western Ethiopia, where enset plantations within the Keffa forest support diverse anuran assemblages and contribute to ecosystem functioning through insect pest regulation [12].
In CCNP, the riverine forests serve as critical biodiversity hotspots, supporting the highest levels of species richness and abundance due to the presence of permanent water and stable microclimates. Comparable patterns have been documented elsewhere in Ethiopia and across tropical Africa, where riparian habitats consistently harbour the highest amphibian diversity relative to surrounding habitats [12] of the other studies). Montane forests supported relatively high species richness and are widely recognized as important refugia for amphibians under changing climatic conditions. Their structural complexity, stable microclimates, and altitudinal gradients create diverse ecological niches that buffer temperature and moisture fluctuations [9]. Such environmental heterogeneity promotes both species persistence and coexistence, making montane habitats critical for long-term amphibian conservation in tropical highland systems.
In contrast, savannah grasslands exhibited the lowest diversity indices among the four habitat types. This pattern likely reflects drier microclimatic conditions, reduced canopy cover, and greater exposure to anthropogenic disturbance, including grazing and burning [5,12]. Similar declines in amphibian diversity with increasing aridity and habitat disturbance have been documented across sub-Saharan Africa [34], reinforcing the sensitivity of amphibians to moisture limitation and habitat simplification.
The variation in anuran diversity among habitat types in CCNP may be influenced by differences in disturbance intensity. Two major forms of disturbance—frequent burning and trampling by large herbivores—were commonly observed during field surveys. Amphibians are particularly sensitive to habitat disturbance because of their small body size, limited dispersal ability, and narrow ecological requirements [35].
At the national and continental levels, the amphibian diversity recorded in CCNP—particularly within riverine and montane forest habitats—appears comparable to that reported from other south-western Ethiopian protected areas with broadly similar environmental conditions. Ethiopia harbours approximately 78 amphibian species overall, and several protected areas in the south-western region support 12–14 species within relatively limited survey areas [36]. In this context, the diversity documented in CCNP can be considered typical for heterogeneous forest–woodland mosaics rather than exceptionally high.
Bale Mountains National Park, a well-studied highland reserve, supports a substantially higher amphibian richness (25 species), including multiple endemics and threatened taxa, highlighting the strong influence of altitude, habitat specialization, and long-term research effort on recorded diversity patterns [36]. At the continental scale, African amphibian hotspots such as the Albertine Rift reach much higher richness levels (up to ~58 species), far exceeding those recorded from lowland and savannah-dominated systems [37,38].
Given that no previous amphibian-focused studies have been conducted in CCNP, the present results should be interpreted as baseline data rather than evidence of unusually high diversity. Nevertheless, the findings demonstrate that CCNP supports a representative assemblage of amphibians for this habitat type and region, emphasizing the park’s importance for maintaining amphibian communities in south-western Ethiopia and providing a foundation for future standardized and comparative studies.


5. Conclusions

In conclusion, this study provides the first comprehensive assessment of anuran diversity, abundance, and habitat associations in Chebera Churchura National Park (CCNP), identifying 16 species across various landscapes. Our findings demonstrate that CCNP supports an ecologically structured amphibian assemblage, with diversity patterns strongly shaped by seasonal rainfall and habitat characteristics. Riverine and montane forests emerged as critical biodiversity hotspots, underscoring the importance of permanent water availability and structurally complex environments for amphibian persistence.
However, we acknowledge that because habitat types in this region are inherently linked to specific altitudes and were not fully replicated across multiple sites, our conclusions regarding the singular influence of habitat type must be treated with caution. The distinct community structures observed likely reflect a complex interaction between vegetation type, microclimate, and the significant 1000 m altitudinal gradient of the park.
The observed patterns in species richness and evenness indicate that maintaining habitat heterogeneity and stable moisture regimes is crucial for the survival of these communities, particularly for habitat specialists vulnerable to hydrological alterations. Disturbance pressures, such as burning and land-use change, pose potential risks to this diversity. Overall, these findings provide a valuable baseline for long-term ecological monitoring and reinforce the importance of CCNP within the broader context of amphibian conservation in Ethiopia and tropical Africa.

Supplementary Materials

The following supporting information can be downloaded at: https://www.mdpi.com/article/10.3390/d18040199/s1, Table S1: Recorded anuran species in the study area; Table S2: Data of sequenced specimens (Collection ID, Gene Bank accession number, year of collection, location and geographic coordinates [decimal degrees]; Table S3: Life-stage composition of anuran species recorded in Chebera Churchura National Park. Life stages are classified as adult (A), juvenile (J), and metamorph/froglet (M).

Author Contributions

W.A. conceptualised the study, while W.A., A.K. and S.G. contributed to the methodology and developing laboratory, molecular, or statistical procedures. W.A. led the investigation and data curation and prepared the original draft. T.H., A.A., S.G. and S.B. were involved in the writing, review, and editing processes. D.Z. did the phylogenetic reconstruction and edited the final version of the draft. Supervision was provided by T.H., A.A. and D.Z. All authors have read and agreed to the published version of the manuscript. This work was supported by the Jimma University Higher Education Doctoral Research Fund and New York University Abu Dhabi.

Funding

This research was partially supported by New York University Abu Dhabi Research Funds AD180 (to S.B.).

Institutional Review Board Statement

The Jimma University review committee examined and approved the research proposal for implementation. Furthermore, we adhered to the guidelines outlined in the letter from Jimma University (ref. number 182/1100/2014, dated 18 October 2014), which emphasises compliance with international research ethics and animal care standards.

Informed Consent Statement

Not applicable.

Data Availability Statement

The original contributions presented in this study are included in the article/Supplementary Materials. Further inquiries can be directed to the corresponding author. All DNA sequences generated during this study have been deposited in the NCBI GenBank database (Accession numbers [PX070078–PX070090]).

Acknowledgments

We thank NYUAD (New York University, Abu Dhabi) for providing specimen sequencing that enabled our molecular study. Additionally, we appreciate the support from the Jimma University School of Graduate Student Fund for the field work. Lastly, we would like to thank the officials from the Dawuro and Konta zones’ Environment, Forest, and Climate Change departments for allowing us to conduct our work there.

Conflicts of Interest

The authors declare no conflicts of interest.

Abbreviations

The following abbreviations are used in this manuscript:
NYUADNew York University, Abu Dhabi
CCNPChebera Churchura National Park
NCBINational Center for Biotechnology Information
DNADeoxyribonucleic Acid
NMDSNon-Metric Multidimensional Scaling
ANOSIMAnalysis of Similarities
SIMPERSimilarity Percentage Analysis

References

  1. IUCN. The IUCN Red List of Threatened Species. 2025. Available online: https://www.iucnredlist.org (accessed on 18 April 2025).
  2. Largen, M.J.; Spawls, S. Amphibians and Reptiles of Ethiopia and Eritrea; Edition Chimaira: Frankfurt, Germany, 2010. [Google Scholar]
  3. Gower, D.J.; Doherty-Bone, T.M.; Kassahun, R.; Mengistu, A.; Menegon, M.; de Sá, R.; Saber, S.; Cunningham, A.A.; Loader, S.P. High prevalence of the amphibian chytrid fungus (Batrachochytrium dendrobatidis) across multiple taxa and localities in the highlands of Ethiopia. Herpetol. J. 2013, 22, 225–233. [Google Scholar]
  4. Ethiopian Wildlife Conservation Authority (EWCA). Chebera Churchura National Park General Management Plan (2020–2030); Ethiopian Wildlife Conservation Authority (EWCA): Addis Ababa, Ethiopia, 2000.
  5. Megaze, A.; Balakrishnan, M.; Belay, G. Human–wildlife conflict and attitude of local people towards conservation of wildlife in Chebera Churchura National Park, Ethiopia. Afr. Zool. 2017, 52, 1–8. [Google Scholar] [CrossRef]
  6. Ethiopian Wildlife Conservation Authority (EWCA). Chebera Churchura National Park General Management Plan (2013–2023); Ethiopian Wildlife Conservation Authority: Addis Ababa, Ethiopia, 2013.
  7. Yihune, M.; Tsegaye, A. Human–wildlife conflict: The case of Chebera Churchura National Park, South-West Ethiopia. Trop. Conserv. Sci. 2024, 17, 1–12. [Google Scholar] [CrossRef]
  8. Yadeta, T.; Tessema, Z.K.; Kebede, F.; Mengesha, G.; Asefa, A. Land use land cover change in and around Chebera Churchura National Park, Southwestern Ethiopia: Implications for management effectiveness. Environ. Syst. Res. 2022, 11, 21. [Google Scholar] [CrossRef]
  9. Rödel, M.O.; Ernst, R. Measuring and monitoring amphibian diversity in tropical forests: An evaluation of methods with recommendations for standardization. Ecotropica 2004, 10, 1–14. [Google Scholar]
  10. Veith, M.; Kosuch, J.; Ohler, A.; Dubois, A.; Vences, M. Molecular phylogeny of African and Malagasy ranid frogs (Anura: Ranidae), with comments on the biogeography of the group. J. Zool. Syst. Evol. Res. 2004, 42, 18–29. [Google Scholar] [CrossRef]
  11. Heyer, W.R.; Donnelly, M.A.; McDiarmid, R.W.; Hayek, L.C.; Foster, M.S. (Eds.) Measuring and Monitoring Biological Diversity: Standard Methods for Amphibians; Smithsonian Institution Press: Washington, DC, USA, 1994. [Google Scholar]
  12. Kassie, A.; Simegn, A.B.; Bogale, G.A.; Goutte, S.; Boissinot, S. Diversity, distribution, and habitat association of anuran species from Keffa, Southwest Ethiopia. Diversity 2023, 15, 300. [Google Scholar] [CrossRef]
  13. Largen, M.J. Catalogue of the amphibians of Ethiopia, including a key for their identification. Trop. Zool. 2001, 14, 307–402. [Google Scholar] [CrossRef]
  14. Channing, A.; Rödel, M.O.; Channing, J. Tadpoles of Africa: The Biology and Identification of All Known Tadpoles in Sub-Saharan Africa; Edition Chimaira: Frankfurt, Germany, 2012. [Google Scholar]
  15. Channing, A.; Rödel, M.O. Field Guide to the Frogs and other Amphibians of Africa; Struik Nature: Parklands, South Africa, 2019. [Google Scholar]
  16. Goutte, S.; Reyes-Velasco, J.; Freilich, X.; Kassie, A.; Boissinot, S. Taxonomic revision of grass frogs (Ptychadenidae, Ptychadena) endemic to the Ethiopian highlands. ZooKeys 2021, 1016, 77–141. [Google Scholar] [CrossRef]
  17. Bickford, D.; Lohman, D.J.; Sodhi, N.S.; Ng, P.K.; Meier, R.; Winker, K.; Ingram, K.K.; Das, I. Cryptic species as a window on diversity and conservation. Trends Ecol. Evol. 2007, 22, 148–155. [Google Scholar] [CrossRef]
  18. Vieites, D.R.; Wollenberg, K.C.; Andreone, F.; Köhler, J.; Glaw, F.; Vences, M. Vast underestimation of Madagascar’s biodiversity evidenced by an integrative amphibian inventory. Proc. Natl. Acad. Sci. USA 2009, 106, 8267–8272. [Google Scholar] [CrossRef]
  19. Vences, M.; Thomas, M.; Bonett, R.M.; Vieites, D.R. Deciphering amphibian diversity through DNA barcoding: Chances and challenges. Philos. Trans. R. Soc. B Biol. Sci. 2005, 360, 1859–1868. [Google Scholar] [CrossRef]
  20. Hall, T.A. BioEdit: A user-friendly biological sequence alignment editor and analysis program for Windows 95/98/NT. Nucleic Acids Symp. 1999, 41, 95–98. [Google Scholar]
  21. Kumar, S.; Stecher, G.; Suleski, M.; Sanderford, M.; Sharma, S.; Tamura, K. MEGA12: Molecular Evolutionary Genetic Analysis Version 12 for adaptive and green computing. Mol. Biol. Evol. 2024, 41, msae263. [Google Scholar] [CrossRef]
  22. Magurran, A.E. Ecological Diversity and Its Measurement; Princeton University Press: Princeton, NJ, USA, 1988. [Google Scholar]
  23. Hutcheson, K. A test for comparing diversities based on the Shannon formula. J. Theor. Biol. 1970, 29, 151–154. [Google Scholar] [CrossRef] [PubMed]
  24. Pielou, E.C. The measurement of diversity in different types of biological collections. J. Theor. Biol. 1966, 13, 131–144. [Google Scholar] [CrossRef]
  25. R Core Team. R: A Language and Environment for Statistical Computing. R Foundation for Statistical Computing. 2022. Available online: https://www.r-project.org/ (accessed on 18 April 2025).
  26. Van Bocxlaer, I.; Biju, S.D.; Loader, S.P.; Bossuyt, F. Higher-level phylogenetic relationships of African toads (Amphibia: Anura: Bufonidae) based on 2.6 kb of mitochondrial DNA. Mol. Phylo. Evol. 2009, 51, 344–354. [Google Scholar] [CrossRef]
  27. Zimkus, B.M.; Rödel, M.-O.; Hillers, A. Complex patterns of continental speciation: Molecular phylogenetics and biogeography of African monotypic puddle frog genera (Anura: Phrynobatrachidae). Mol. Phylo. Evol. 2010, 55, 883–900. [Google Scholar] [CrossRef]
  28. Musubaho, L.; Iyongo, L.; Mukinzi, J.-C.; Mukiranya, A.; Mutahinga, J.; Badjedjea, G.; Lango, L.; Bogaert, J. Diversity and endemism of amphibian fauna in the Yoko Forest Reserve, Democratic Republic of Congo. Diversity 2024, 16, 457. [Google Scholar] [CrossRef]
  29. Kouassi, P.; Adeoti, K.; Gbogbo, F.; Rödel, M.O. Herpetofaunal diversity in a Dahomey Gap savannah of Togo (West Africa): Effects of seasons on amphibians and reptiles. Diversity 2022, 14, 964. [Google Scholar] [CrossRef]
  30. Okeyoyin, A.O.; Odewumi, O.S.; Akinyemi, A.F. Spatial and seasonal dynamics of amphibians from shallow waters and forests in urban and peri-urban sites. GSC Biol. Pharm. Sci. 2022, 21, 126–133. [Google Scholar] [CrossRef]
  31. Wells, K.D. The Ecology and Behavior of Amphibians; University of Chicago Press: Chicago, IL, USA, 2007. [Google Scholar]
  32. Gardner, T.A.; Ribeiro-Júnior, M.A.; Barlow, J.O.S.; Àvila-Pires, T.C.S.; Hoogmoed, M.S.; Peres, C.A. The value of primary, secondary, and plantation forests for a Neotropical herpetofauna. Conserv. Biol. 2007, 21, 775–787. [Google Scholar] [CrossRef]
  33. Girma, M.; Maryo, M. The Diversity and Composition of Woody Plants in Chebera Churcura National Park (CCNP), Southern Ethiopia. Open J. For. 2018, 8, 439–458. [Google Scholar] [CrossRef][Green Version]
  34. Ficetola, G.F. Habitat availability explains large-scale patterns of amphibian richness. Glob. Ecol. Biogeogr. 2015, 24, 1430–1442. [Google Scholar] [CrossRef]
  35. Pough, F.H.; Andrews, R.M.; Crump, M.L.; Savitzky, A.H.; Wells, K.D.; Brandley, M.C. Herpetology, 4th ed.; Oxford University Press: Oxford, UK, 2015. [Google Scholar] [CrossRef]
  36. Sperling, K.; Isselhard, H.; Ziegler, T.; Rödder, D. Amphibians and reptiles of Ethiopia—Biogeography, conservation priority areas, and potentials for “One Plan Approach” conservation measures. Integr. Conserv. 2025, 4, 442–463. [Google Scholar] [CrossRef]
  37. Plumptre, A.J.; Davenport, T.R.B.; Behangana, M.; Kityo, R.; Eilu, G.; Ssegawa, P.; Moyer, D. The biodiversity of the Albertine Rift. Biol. Conserv. 2007, 134, 178–194. [Google Scholar] [CrossRef]
  38. Behangana, M. The Diversity and Distribution of Amphibian Fauna in the Albertine Rift. PhD Thesis, Makerere University, Kampala, Uganda, 2009. [Google Scholar]
Figure 2. Sketch of a drift fence and pitfall trap layout [12].
Diversity 18 00199 g002
Figure 3. Anuran species accumulation curve by number of transects in Chebera Churchura National Park.
Diversity 18 00199 g003
Figure 4. Phylogenetic tree for anuran taxa based on approximately 520 bp of the 16S rRNA. (ML tree, GTR G+I; 1000 bootstraps; MEGA12). The tip labels provide information on the species name, the GenBank accession number, and the country of origin. Orange-marked labels indicate samples from our study.
Diversity 18 00199 g004
Figure 5. Pictures of Phrynobatrachus natalensis (left) and Phrynobatrachus sp. 1 (right), both from Chebera Churchura National Park (photos by Wondifraw Adnew).
Diversity 18 00199 g005
Figure 6. Seasonal abundance of anuran species in Chebera Churchura National Park. Species assignments reflect molecular validation of representative individuals combined with consistent morphological, ecological, and acoustic characteristics across unsequenced individuals.
Diversity 18 00199 g006
Figure 7. Secondary NMDS ordination derived from a matrix of pairwise ANOSIM R-values, illustrating relative community distinctiveness among the four habitat types. Distances between habitat centroids reflect the magnitude of assemblage differentiation. Riverine forest shows strong separation from woodland, while montane forest and savannah grassland exhibit moderate overlap.
Diversity 18 00199 g007
Table 2. Species richness, abundance, and relative abundance of amphibian families recorded in Chebera Churchura National Park.
FamilyNumber of GeneraNumber of SpeciesAbundanceRelative Abundance (%)
Pipidae1124811.4
Ptychadenidae1460627.9
Bufonidae1438117.5
Hyperoliidae221336.1
Pyxicephalidae111295.9
Dicroglossidae1125311.6
Phrynobatrachidae121245.7
Conrauidae1130113.8
Total9162175100
Table 3. Anuran abundance (Abu.) and observed richness (Obs. R.) per habitat and per season (wet and dry) in Chebera Churchura National Park.
HabitatAbu. WetAbu. DryObs. R. WetObs. R. Dry
Riverine forest11174885
Montane forest19710877
Savannah grassland3966095
Woodland8616356
Total17963791411
Table 4. Abundance of anuran species in the four habitat types in Chebera Churchura National Park (end = endemic to Ethiopia). The IUCN status for all species is Least Concern (LC).
SpeciesEndRiverine ForestMontane ForestSavannah GrasslandWoodlandSum
Amietia nuttino3247500129
Conraua beccariino301000301
Hoplobatrachus occipitalisno245080253
Hyperolius viridiflavusno112303982
Kassina senegalensisno00114051
Phrynobatrachus natalensisno2942390110
Phrynobatrachus sp. 1?0001414
Ptychadena anchietaeno19102170408
Ptychadena baroensisyes25031056
Ptychadena neumanni/P. harennayes1101012
Ptychadena niloticano4833490130
Sclerophrys garmanino017105986
Sclerophrys gutturalisno1059046115
Sclerophrys regularisno2493100127
Sclerophrys xerosno0205153
Xenopus cliviino248000248
sum 11653054562492175
? = endemism status of this taxon is unclear.
Table 5. Diversity indices of anuran communities in four habitat types in Chebera Churchura National Park.
Diversity IndicesRiverine ForestMontane ForestSavannah GrasslandWoodlandTotal
Species richness12811616
Abundance11653054562492175
Shannon index (H’)1.8891.8031.7221.7242.48
Simpson index (1 − D)0.8140.8100.7210.8140.90
Pielou’s Evenness (J′)0.7600.8670.7180.9620.89
Table 6. Similarity indices of anuran species between habitats in Chebera Churchura National Park. Jaccard similarity indices are shown below the diagonal, and Sorensen similarity indices are shown above the diagonal.
HabitatsRiverine ForestSavannah GrasslandWoodland
Riverine Forest0.7830.211
Savannah Grassland0.643
Woodland0.118
Table 7. SIMPER analysis shows the main frog species contributing to dissimilarity between major habitat types. Only species contributing cumulatively up to 70% of total dissimilarity are shown.
SpeciesHabitat AssociationContribution (%)
Conraua beccariiriverine forest13.8
Xenopus cliviiriverine forest11.4
Hoplobatrachus occipitalisriverine forest11.3
Ptychadena anchietaesavannah grassland10.3
Sclerophrys xeroswoodland2.3
Sclerophrys gutturaliswoodland2.1
Disclaimer/Publisher’s Note: The statements, opinions and data contained in all publications are solely those of the individual author(s) and contributor(s) and not of MDPI and/or the editor(s). MDPI and/or the editor(s) disclaim responsibility for any injury to people or property resulting from any ideas, methods, instructions or products referred to in the content.