Abstract
The genetic diversity and the genetic structure of widely distributed species are meaningful to explore plant adaptation mechanisms to the environment. This study investigated the effects of climatic factors on the genetic diversity and structure of Agropyron michnoi, and modeled its large-scale potential distribution shifts. A. michnoi was studied under different temperature and precipitation gradients on grassland of Inner Mongolia and North China using rbcL and trnL-F sequences. The results showed that the genetic diversity of A. michnoi was low and significantly influenced by precipitation. AMOVA results showed that genetic variation in A. michnoi occurred mainly within the population, accounting for 70.57%. Both Mantel test and partial Mantel test support a significant IBE pattern. STRUCTURE and UPGMA analyses divided the populations into two clusters. Population 10 was closely related to one cluster. The haplotype network shows only one cluster H1, and all other haplotypes have evolved from H1, which is likely the ancestral haplotype. A. michnoi, as a widely distributed species. Originating from a primitive haplotype. Large scale precipitation caused genetic differentiation into two genetic branches. The MaxEnt model predicts that A. michnoi’s distribution has expanded since the Last Glacial Maximum and will shift to higher elevations in the future due to climate change.
1. Introduction
The level of genetic diversity reflects the ability of a species to adapt to environmental changes, and it directly affects the survival, reproduction, and long-term evolutionary potential of the population [1]. These genetic variations are manifested at different biological scales (molecular, cellular, tissue, individual, and population scales, etc.) and ultimately converge and are reflected in the genetic structure of the population [2]. Genetic structure refers to the spatial distribution pattern of genetic variations and the frequencies of specific genes and genotypes [3]. The genetic structure of a population can reflect the evolutionary processes such as migration, isolation, gene flow, and natural selection in the population’s history. Therefore, analyzing the genetic structure of a population is considered a key to understanding the evolutionary history of the population and also provides a scientific basis for predicting the dynamic response of the population to environmental change pressures in the future [4]. For this reason, studying the genetic diversity and structure of species can not only simulate their historical dynamics but also predict the future changes of the population in a turbulent environment.
Climate is a primary driver of local adaptation in plant species. Ongoing climate change has the potential to reshape the genetic diversity of plant populations, thereby affecting community dynamics and ecosystem processes [5]. Typically, genetic variation among populations exhibits patterns of change correlated with climatic gradients such as temperature and precipitation, but the direction and strength of this association show significant species specificity. Research indicated that genetic diversity increases in certain species when temperatures or precipitation levels rise, while it decreases in others [6]. This variability implies that different species will possess distinct evolutionary potentials under future climate scenarios. Rapid shifts in temperature and precipitation exert novel selection pressures on plant populations, significantly affecting their physiology, abundance, and distribution [7]. In response to extreme climate events such as extreme temperatures or drought, plants may adjust key life history traits; for example, flowering time may advance under extreme temperature or moisture stress [8]. In summary, the ongoing climate change not only presents a critical opportunity to uncover the evolutionary adaptation mechanisms of plants and refine species distribution prediction models, but also fundamentally underscores the vital importance of studying species genetic diversity at large scales.
Grassland ecosystems are a major biome and landscape type widely distributed across China, covering approximately 40% of the country’s land area [9]. Studying widely distributed grass species helps reveal how large-scale climate factors drive genetic diversity and adaptive evolution within species [10]. Widely distributed species are distributed across various climatic conditions and may develop adaptive capacity in response to climate change to maintain higher levels of diversity [11]. Under the influence of climate change at large scales, species can adapt to widespread climate change in two ways: by diverging into a series of populations, each specifically adapted to local climatic conditions, or through high phenotypic plasticity, which allows each individual to thrive under a wide range of conditions. Studies of a variety of widespread species have shown that different species exhibit high inter-population genetic differentiation [12] and extensive gene flow [13]. Furthermore, multiple studies indicate that changes in temperature and precipitation gradients can significantly influence the species composition and genetic structure of widespread species [14]. Therefore, it is particularly important for widespread species to cope with changes in temperature and precipitation under large-scale conditions.
Chloroplast DNA (cpDNA), which is non-recombinant and matrilineally inherited in most angiosperms, is not disturbed by genetic recombination and has a relatively independent evolutionary pathway [15]. It has been widely used in both intraspecific and interspecific studies as a molecular marker that is very conserved and preferably used to reveal genetic diversity [16]. In previous studies, cpDNA has been applied to reveal genetic diversity in a variety of herbaceous plants such as barley, alfalfa, etc. [17]. It has been pointed out that the non-coding regions of chloroplasts can generate more variant sites than coding regions due to less restriction and can provide more informative sites [18]. Currently, non-coding regions of chloroplast genes such as rbcL and trnL-trnF are widely used in the study of species genetic diversity. In recent years, studies based on chloroplast non-coding regions in herbaceous plants have also been increasing [19]. Studies based on chloroplast genes indicate significant interspecific differences in the genetic diversity levels of herbaceous plants across large-scale climatic gradients, such as low genetic diversity in herbs such as meadow morning glory [20] and marsh mat grass, while some herbs such as Glen horseweed [21] and reed [22] have a higher level of genetic diversity. These differences may be related to factors such as geographic distribution, but the specific driving mechanisms remain unclear. Therefore, to thoroughly elucidate the impact of climatic factors on plant genetic diversity, it is essential to conduct studies along climatic gradients using widespread species. Given their extensive distribution across diverse climatic zones, populations of widespread species can better demonstrate how genetic structure responds to environmental changes, making them ideal models for elucidating evolutionary mechanisms under large-scale climatic patterns.
Agropyron michnoi is a widely distributed guerrilla asexual long rhizomatous grass in northern China covering a sizeable environmental gradient, belonging to Agropyron and Poaceae [23], with nutritional solid reproduction, early rejuvenation, late yellowing, drought and cold resistance, and other advantages, and high nutritional value [24]. Against this backdrop, Chinese researchers have achieved a series of significant advances in this field. Relevant studies indicate that a high level of genetic diversity exists among various germplasm resources within the genus Agropyron [25]. However, the mechanisms underlying the changes in genetic diversity and genetic structure, as well as the potential distribution of A. michnoi, change along large-scale gradients of climatic factors are not yet clear.
In this study, we investigated the genetic diversity and structure of A. michnoi in a long climatic gradient based on chloroplast genes. We also calculated the past, current, and future potential distributions using ecological niche modeling (ENM). The objectives of this study were (a) to investigate the genetic diversity and structure of A. michnoi and the mechanisms of its change along a long climatic gradient and (b) to predict the distributional trends of A. michnoi populations under climate change.
2. Materials and Methods
2.1. Plant Materials
Plant materials of Agropyron michnoi were collected from 15 populations in northeastern Inner Mongolia (The shaded area on the right side of Figure 1) and one population in central Xinjiang (The shaded area on the left in Figure 1), China, from July to August 2012, covering a total transect length of approximately 2800 km (Figure 1). The specific latitude and longitude coordinates of the sampling points are listed in Table 1. In each natural population, 5–20 individuals were randomly selected, and to avoid collecting the same genotypic divisions, the minimum spacing of each individual was 10 m, which made a total of 274 individuals. The geographic locations of the 16 populations and the number of samples are shown in Table 1. The collected fresh leaves of the samples were dried in silica gel bags and then stored at −20 °C for indoor experiments.
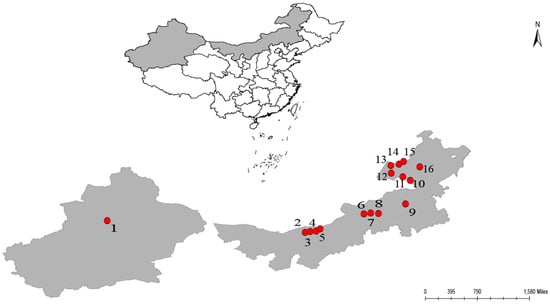
Figure 1.
The sampling points distribution of the 16 Agropyron michnoi populations. (The map was created using ArcGIS 10.2).

Table 1.
Basic information on Agropyron michnoi study sites.
2.2. DNA Extraction
The modified CTAB method was used to extract the total genomic DNA of A. michnoi [26]. First, an appropriate amount of young leaves (approximately 0.025 to 0.030 g) was collected and ground into powder with liquid nitrogen, and then 40 μL CTAB extraction buffer was immediately added to the ground sample and water-bathed in water at 65 °C for 30 min, during which time gently oscillating every 10 min. The mixture was then extracted twice with 400 μL Tris saturated phenol. After centrifugation, the supernatant was further extracted twice with chloroform: isoamyl alcohol (24:1). An equal volume of potassium acetate was then added to the supernatant and left on ice for 5 min. Anhydrous ethanol was then added 2.5 times the volume of the liquid volume in the centrifuge tube (i.e., the sum of the volumes of the supernatant + potassium acetate) and then mixed and centrifuged with a spot motion and allowed to stand on ice for at least 15 min. The precipitate was washed twice with 70% ethanol, dried, and then solubilized by adding 100 μL of 1 × Tris-EDTA (TE) buffer [27]. DNA quality and quantity were assessed by 0.8% agarose gel. The concentration and purity of the extracted DNA were determined using a UV-Vis spectrophotometer, and the DNA concentration was close to 20 ng μL−1. All DNA samples were stored at −20 °C for chloroplast DNA amplification.
2.3. Chloroplast DNA Amplification
Two chloroplast DNA fragments were amplified for analysis: rbcL and trnL-F. The detailed sequences of the rbcL amplification primers were referred by Li [28]. The primers (“e” and “f”) of Taberlet [29] were used to amplify trnL-F with the following modifications:e: 5′-GGT TCA AGT CCC TCT A TC CC-3′, f: 5′-TTT GAA CTG GTG ACA CGA G-3′.
The PCR amplification reaction system was 25 μL, including 1 μL of DNA template, 0.25 μL of Taq enzyme, 2.5 μL of 10 × Buffer (Mg+-free), 2 μL of Mg+, 2 μL of dNTP, 1 μL of forward and reverse primers, and 25 μL of double-distilled sterilized water to make up.
The PCR cycle conditions were as follows: initial denaturation at 95 °C for 3 min, denaturation at 95 °C for 30 s, 32 cycles, annealing at 57 °C for 30 s for trnL-F, annealing at 52 °C for 30 s for rbcL, extension at 72 °C for 1 min, 35 cycles, and finally extension at 72 °C for 5 min.
The PCR products were detected by electrophoresis on 1% agarose, and those with clear bands and no tailing were sent to Shanghai Biotech for sequencing. The sequencing primers were consistent with the PCR amplification primers.
2.4. Data Analysis
The obtained original sequencing sequences were viewed by the peak comparison map with Bioedit software (Bioedit 7.2.5), read out the sequences, and saved in Fasta format. The two cpDNA fragments were spliced into a whole long fragment using Sequence Matrix 1.8. Sequence comparison was performed using ClustalX2.
Haplotype polymorphism (Hd) and nucleotide polymorphism (π) were calculated for each population using Dnasp 6.0. The PERMUT software (version 2.0) was used to calculate the genetic diversity (Ht) of cpDNA sequences, the average genetic diversity (Hs) of populations, the inter-population genetic differentiation coefficient (Gst) and the Nst values of populations, and 1000 substitution tests were performed during the calculation. Fst values were calculated using Arlequin 3.5, and an analysis of molecular variance (AMOVA) was performed to estimate the distribution of genetic variation between and within populations.
To estimate the effect of geographic and environmental distance on genetic differentiation between populations, we constructed genetic differentiation matrices. For environmental distance, we created matrices combining two variables, temperature and precipitation. We analyzed this using the Mantel test of 999 permutations (vegan package for R). First, we tested the effect of geographic and environmental distance on genetic distance using the Mantel test. Then, using partial Mantel tests, we tested the effect of each environmental distance on genetic distance after excluding geography and the effect of geographic distance on genetic distance after excluding environmental distance, respectively.
A haplotype network was constructed using the NJ algorithm in PopART 1.7 to show the relationship between cpDNA haplotypes. Phylogenetic analysis of populations was performed using the UPGMA method using the phangorn package for R, and evolutionary trees were drawn using the ggtree package. The model-based Bayesian clustering method implemented in STRUCTURE 2.3.44 [30] was utilized to infer population genetic structure by assuming a mixing model between populations and associated allele frequencies. For each K value (from 1 to 16), 10 independent runs with 200,000 aging cycle steps were performed, followed by 1,200,000 Markov Chain Monte Carlo simulations (MCMC), and the optimal K value was determined by calculating ∆K via STRUCTURE HARVESTER [31]. CLUMPP software (version 1.1.2) was clumpp used for repeated sampling analysis, and Distruct software (version 1.1) was used to draw the population genetic structure map [32].
3. Results
The genetic diversity of different chloroplast fragments of the selected Agropyron michnoi materials varied. TrnL-F fragment had a relatively high level of genetic diversity, the haplotype polymorphism (Hd) of all populations was 0.370, nucleotide polymorphism (π) was 0.00536, and the average number of nucleotide differences (K) was 8.22243 (Table 2), which indicated that the level of genetic diversity of A. michnoi was low. 2 chloroplast fragments of the two chloroplast fragments were negative (Table 3), and both were significant (p < 0.05); after the sequences were merged, the Tajima’D value was −2.33804 and was significant, indicating that A. michnoi may have experienced population expansion in the process of evolution.
Table 2.
The genetic diversity and haplotype diversity analysis of 16 populations in Agropyron michnoi.
Table 3.
The genetic diversity and haplotype diversity analysis of different populations in Agropyron michnoi based on 2 cpDNA. (*: p < 0.05, **: p < 0.01.).
AMOVA analysis showed that 70.57% of the genetic variation in A. michnoi populations existed within populations and 29.43% existed between populations, and intra-population genetic variation was more remarkable than inter-population genetic variation (Table 4), and intra-population variation was main source of variation in A. michnoi. The coefficient of genetic differentiation, Fst = 0.29 (Fst > 0.25), indicated that there was a great deal of genetic differentiation between A. michnoi populations. According to the relationship between gene flow (Nm) and Fst (Table 4): Nm = (1-Fst)/4Fst, we obtained that Nm was 0.60, and gene flow was less than 1, indicating that limited gene flow was the main reason for promoting population differentiation.
Table 4.
AMOVA analysis for different populations in Agropyron michnoi based on combined sequence.
According to the Mantel test, the environmental distance between population A. michnoi was significantly positively correlated with the genetic distance (Figure 2), but there was no significant correlation between geographical distance and genetic distance, and the environmental distance was also significantly positively correlated with the geographical distance. In addition, the Mantel test was conducted to compare the genetic distance of the whole sample strip with MAP, MAT, and AI. The results showed that the level of genetic diversity of A. michnoi increased significantly with the increase of MAP and AI. However, there was no significant correlation between its genetic diversity in terms of MAT. Partial Mantel test showed that MAP had no significant effect on genetic distance when geographical distance was excluded (Figure 3).
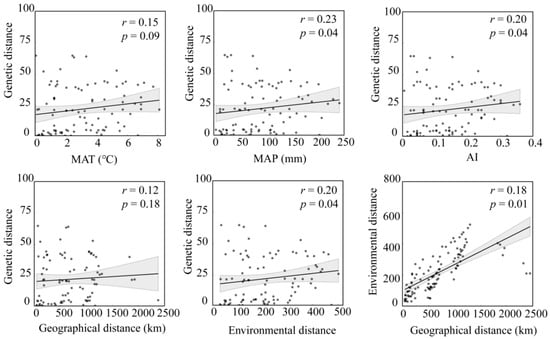
Figure 2.
The Spearman coefficient was used to perform a Mantel test on the correlation between genetic diversity parameters and interpreted distances (geographical, genetic, and environmental). (MAT refers to the Mean Annual Temperature, MAP signifies the Mean Annual Precipitation, and AI stands for the Aridity Index.).
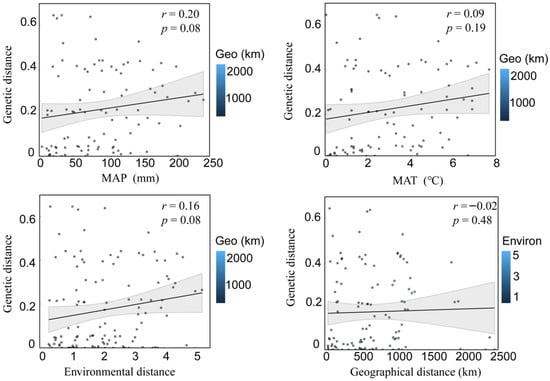
Figure 3.
The Spearman coefficient was used to perform a partial Mantel test on the correlation between genetic diversity parameters and interpreted distances (geographical, genetic, and environmental). (MAP signifies the Mean Annual Precipitation, MAT refers to the Mean Annual Temperature).
The population structure analysis showed that the inflection point occurred at k = 2 (Figure 4). Based on the mixing model at K = 2, the individuals were divided into two subpopulations (Figure 5). The STRUCTURE results showed that population 10 was the most clearly differentiated from the other populations. The UPGMA cluster analysis of the rhizomatous A. michnoi populations is shown in Figure 6, and the results of the cluster analysis also divided all the populations into two clusters, with population 10 being more distantly related to the other populations.
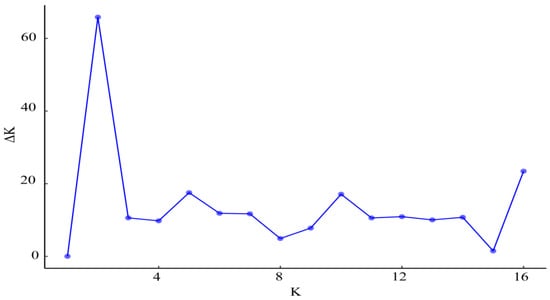
Figure 4.
Determinations of subpopulations (K) of Agropyron michnoi population.
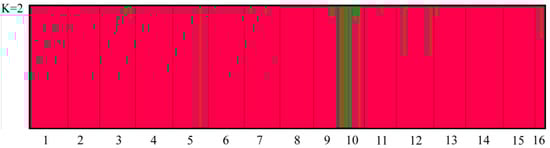
Figure 5.
Population structure for K = 2.
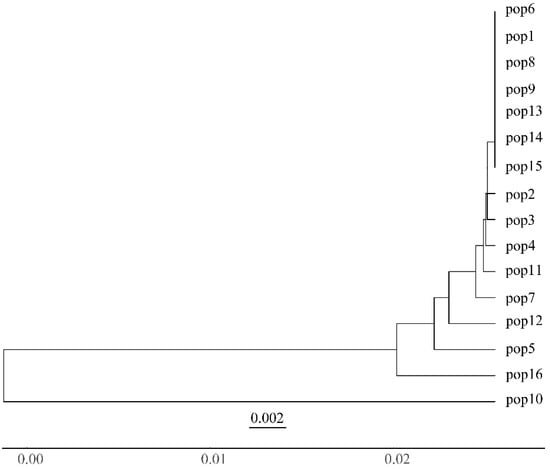
Figure 6.
UPGMA dendrogram of 16 populations of Agropyron michnoi based on Nei’s genetic distance.
The haplotype network diagram among different haplotypes of A. michnoi was constructed based on the Neighbor-Joining (NJ) method (Figure 7). 16 haplotypes of 16 selected icegrass populations were divided into a cluster, and the evolutionary relationships of haplotypes were shown on an intermediate connectivity network, in which Hap1 was located in the inner part with multiple connections and distributed in all populations. Haplotypes Hap11, Hap12, Hap7, Hap8, Hap3 and Hap13 are distant from Hap1.
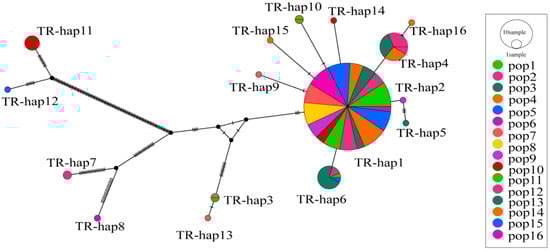
Figure 7.
The network for cpDNA haplotypes based on combined sequence (Note: The size of the circle area is proportional to the haplotype frequency, pop denotes different population and TR-hap denotes different haplotype).
The average training AUC of 10 repetitive runs during the LGM period was 0.979 with a standard deviation of 0.02, the average training AUC of 10 repetitive runs under current climate conditions was 0.980 with a standard deviation of 0.014, and the average training AUC of 10 repetitive runs under future climate conditions was 0.808 with a standard deviation of 0.101, indicating that the model has good prediction performance. The predicted distribution of A. michnoi (Figure 8) is consistent with the existing distribution records in Inner Mongolia and Xinjiang, indicating that the distribution of A. michnoi is constrained by environmental factors. Future and present distributions of A. michnoi differ significantly in geographic extent (Figure 8b,c), and predictions of suitable habitat in the future have increased significantly from the present. Inner Mongolia is predicted to be the most suitable habitat for the current distribution. These predictions suggest that A. michnoi may move to higher elevations as its distribution expands since the LGM (Figure 8a).
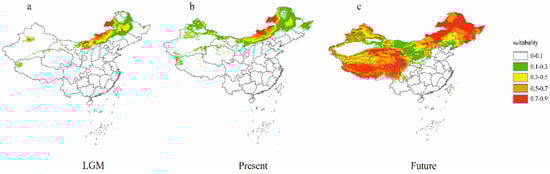
Figure 8.
Potential distribution of Agropyron michnoi at 3 different times. Suitability values range from 0~1, with darker shades of red as habitat suitability increases. (a) Last Glacial Maximum (LGM) scenario, (b) current scenario, (c) future scenario.
4. Discussion
The genetic diversity of Agropyron michnoi was low (Pi = 0.54 × 10⁻², Hd = 0.37) compared to previously reported ISSR-tagged Agropyron. The slower rate of evolution of chloroplast genes and less variation among individuals may have contributed to the lower genetic diversity in this study. Among the three gene segments (rbcL, trnL-F, and merged sequences), the trnL-F sequence has relatively high genetic diversity. The noncoding regions of chloroplast genes are less restricted than the coding regions [18].
The genetic diversity of A. michnoi was significantly and positively correlated with MAP. This result is consistent with previously reported relationships between genetic diversity and MAP in herbaceous plants such as big needlegrass [33] and small-leafed brome [34]. The rate of sexual reproduction of A. michnoi may increase with increasing precipitation, which, to some extent, will increase the genetic diversity of the population [35]. In the sample strip, from west to east, the change in MAT was not significant, resulting in no significant effect of MAT on the genetic diversity of A. michnoi. The influence of environmental distance on the genetic diversity of A. michnoi is greater than that of geographical distance. After excluding the influence of geographical distance, the MAP has no significant effect on genetic diversity. Only the pure influence of environmental distance is significant, indicating that in addition to precipitation, there are other environmental factors that affect the genetic diversity of A. michnoi.
AMOVA analysis showed that most of the variation occurred within the mesocosm. This is consistent with findings in other grasses [36]. The high level of genetic variation within A. michnoi populations suggests a high adaptability to environmental conditions [37]. The coefficient of genetic differentiation between populations (Fst = 0.29) was higher than long-lived perennials (Fst = 0.25) and heterozygotes (Fst = 0.25) but lower than wide-ranging species (Fst = 0.34) [38], and breeding systems, life forms, and distribution ranges may be responsible for the current genetic structure of A. michnoi. Gene flow (Nm) is 0.6, and gene flow affects population genetic structure when Nm > 0.5, while gene flow is only one of many essential factors that affect the genetic structure and evolutionary processes, other factors (e.g., precipitation and temperature) may affect population genetic structure more than gene flow [39,40,41]. The significant IBE(Isolation By Environment) pattern in this study also emphasizes the importance of precipitation on the genetic structure of A. michnoi, and changes in precipitation gradients may have exerted selection pressure on A. michnoi [42], affecting its genetic structure more than gene flow.
According to Mantel’s test and partial Mantel’s test, genetic differentiation among populations was not related to geographic distance, suggesting that gene flows through seed or pollen dispersal between populations are infrequent [43] and that there are significant genetic differences between some geographically similar populations, also suggesting that IBD (Isolation By Distance) is not a major driver of population differentiation in A. michnoi. The environmental correlates of the IBE model had a greater influence on A. michnoi population differentiation than geographic distance. With more than a twofold difference in precipitation from the western to the eastern part of the sample zone, selection pressure from precipitation may have contributed to population differentiation [44]. At the same time, the heterogeneous environments of geographically distinct populations due to precipitation significantly suppressed gene exchange among A. michnoi populations, and there may have been beneficial allelic exchanges for populations from similar environments [45]. Thus, A. michnoi populations are genetically variable under different precipitation environments, leading to genetic differentiation of A. michnoi populations in the east-west sample zone.
STRUCTURE and UPGMA clustering trees showed that genetic differentiation was not significantly related to geographic distance between populations, suggesting that the main factor affecting genetic differentiation of populations is not migration or gene flow but selection pressure caused by environmental factors [46]. Although the structure results show that the genetic structure among populations is relatively weak, population 10 is significantly different from other populations. The results of the comprehensive UPGMA clustering tree all indicate that population 10 has a relatively distant genetic relationship with other populations. Population 10 is distributed in the southern part of Xinbaerhu Zuoqi, and distant mountain ranges (Greater Khingan Range) can hinder gene exchange between populations, which may lead to a significant differentiation of population 10 from other populations. There was a significant difference between the results of STRUCTURE and haplotype network diagrams for estimating the genetic structure of A. michnoi, with STRUCTURE dividing all populations into two clusters. In contrast, the haplotype network diagrams showed only one cluster. Although the STRUCTURE 2.3.4 software is widely used to analyze population genetic structure, there may be some limitations to its use in distinguishing between populations with weaker genetic structure. And based on the discovery that the H1 haplotype is distributed in all populations, it is inferred that H1 is very likely to be the ancestral haplotype. We believe that it is more appropriate to group all populations into one cluster.
MaxEnt modeling confirms the role of climate in shaping the distribution of A. michnoi, which has expanded from the last glacial maximum (LGM) to the present and future under changing climatic conditions. Atmospheric circulation models (GCMs) predict gradually increasing temperatures and decreasing rainfall in the future, and the A. michnoi is a perennial species with a long reproduction cycle and a slow rate of evolution that is more susceptible to the impacts of these changes, so these changes are likely to drive the expansion of the distribution of rooted glacier [47]. The model predicts a shift in the A. michnoi range to higher elevations, a pattern already observed for many plant species [48]. A. michnoi, to avoid the risk of extinction due to climate change, may tend to maintain genetic diversity, which may facilitate the spread of rhizomatous ice grasses to new suitable ranges. However, whether the rate of plant species dispersal can keep pace with rapid environmental changes needs to be further explored.
5. Conclusions
In this study, we analyzed the genetic diversity and genetic structure as well as the potential distribution of Agropyron michnoi under temperature and precipitation gradients in Inner Mongolia and Xinjiang using Rbcl and trnL-trnF sequences. The results showed that the genetic diversity level of rhizomatous iceplant was low, and precipitation had a significant effect on the genetic diversity and genetic structure of rhizomatous iceplant. Genetic variation of A. michnoi mainly occurred within the population. Genetic distance was significantly correlated with environmental distance, indicating that environmental factors were the leading cause of population differentiation. The genetic structure of A. michnoi was weak. The results of STRUCTURE and UPGMA clustering trees divided all populations into two clusters, and the haplotype network diagrams showed only one cluster. The MaxEnt model predicted that A. michnoi would expand its distribution range from the last glacial maximum (LGM) to the present and the future under the change of climatic conditions. The distribution range would move to higher altitudes. The range will be shifted to higher altitudes. This study further deepens the understanding of genetic diversity and genetic structure of LGM and provides a reference for its resource conservation and utilization.
Author Contributions
Conceptualization, Z.Z.; data curation, R.S. and C.Z.; formal analysis, R.S. and T.Y.; funding acquisition, C.Z.; investigation, T.Y.; methodology, Z.Z.; project administration, C.Z.; resources, C.Z.; software, Z.Z. and R.S.; supervision, Z.Z. and C.Z.; validation, R.S.; visualization, T.Y.; writing—original draft, Z.Z., R.S. and T.Y.; writing—review and editing, C.Z. All authors have read and agreed to the published version of the manuscript.
Funding
This research was supported by the National Natural Scientific Foundation of China (32471778).
Data Availability Statement
Data is contained within the article.
Acknowledgments
We extend our gratitude to the reviewers and editors for taking the time to read this manuscript and provide valuable suggestions.
Conflicts of Interest
The authors declare that they have no known competing financial interests or personal relationships that could have appeared to influence the work reported in this paper.
References
- Hughes, A.R.; Inouye, B.D.; Johnson, M.T.; Underwood, N.; Vellend, M. Ecological Consequences of Genetic Diversity. Ecol. Lett. 2008, 11, 609–623. [Google Scholar] [CrossRef]
- Erickson, D.L.; Hamrick, J.; Kochert, G.D. Ecological Determinants of Genetic Diversity in an Expanding Population of the Shrub Myrica Cerifera. Mol. Ecol. 2004, 13, 1655–1664. [Google Scholar] [CrossRef] [PubMed]
- Proksa, B.; Uhrin, D.; Adamcova, J.; Fuska, J. Ecological and Evolutionary responses to Recentclimate Change. Annu. Rev. Ecol. Evol. Syst. 2006, 37, 637–669. [Google Scholar] [CrossRef]
- Aguirre-Liguori, J.A.; Ramírez-Barahona, S.; Tiffin, P.; Eguiarte, L.E. Climate Change Is Predicted to Disrupt Patterns of Local Adaptation in Wild and Cultivated Maize. Proc. R. Soc. B 2019, 286, 20190486. [Google Scholar] [CrossRef]
- Avolio, M.L.; Beaulieu, J.M.; Smith, M.D. Genetic Diversity of a Dominant C 4 Grass Is Altered with Increased Precipitation Variability. Oecologia 2013, 171, 571–581. [Google Scholar] [CrossRef]
- Zhang, C.; Sun, M.; Zhang, X.; Chen, S.; Nie, G.; Peng, Y.; Huang, L.; Ma, X. Aflp-Based Genetic Diversity of Wild Orchardgrass Germplasm Collections from Central Asia and Western China, and the Relation to Environmental Factors. PLoS ONE 2018, 13, e0195273. [Google Scholar] [CrossRef]
- Wang, T.; Wang, Z.; Xia, F.; Su, Y. Local Adaptation to Temperature and Precipitation in Naturally Fragmented Populations of Cephalotaxus Oliveri, an Endangered Conifer Endemic to China. Sci. Rep. 2016, 6, 25031. [Google Scholar] [CrossRef]
- Parmesan, C.; Yohe, G. A Globally Coherent Fingerprint of Climate Change Impacts across Natural Systems. Nature 2003, 421, 37–42. [Google Scholar] [CrossRef] [PubMed]
- Kang, L.; Han, X.; Zhang, Z.; Sun, O.J. Grassland Ecosystems in China: Review of Current Knowledge and Research Advancement. Philos. Trans. R. Soc. B Biol. Sci. 2007, 362, 997–1008. [Google Scholar] [CrossRef] [PubMed]
- Gibson, D.J. Grasses and Grassland Ecology; Oxford University Press: Oxford, UK, 2009. [Google Scholar] [CrossRef]
- Broadhurst, L.; Breed, M.; Lowe, A.; Bragg, J.; Catullo, R.; Coates, D.; Encinas-Viso, F.; Gellie, N.; James, E.; Krauss, S. Genetic Diversity and Structure of the Australian Flora. Divers. Distrib. 2017, 23, 41–52. [Google Scholar] [CrossRef]
- Hamann, E.; Kesselring, H.; Armbruster, G.F.; Scheepens, J.F.; Stöcklin, J. Evidence of Local Adaptation to Fine-and Coarse-Grained Environmental Variability in Poa Alpina in the Swiss Alps. J. Ecol. 2016, 104, 1627–1637. [Google Scholar] [CrossRef]
- Volis, S.; Ormanbekova, D.; Shulgina, I. Role of Selection and Gene Flow in Population Differentiation at the Edge Vs. Interior of the Species Range Differing in Climatic Conditions. Mol. Ecol. 2016, 25, 1449–1464. [Google Scholar] [CrossRef]
- Wu, Z.; Dijkstra, P.; Koch, G.W.; Hungate, B.A. Biogeochemical and Ecological Feedbacks in Grassland Responses to Warming. Nat. Clim. Change 2012, 2, 458–461. [Google Scholar] [CrossRef]
- Li, R.; Zhang, H.; Zhou, X.; Guan, Y.; Yao, F.; Song, G.; Wang, J.; Zhang, C. Genetic Diversity in Chinese Sorghum Landraces Revealed by Chloroplast Simple Sequence Repeats. Genet. Resour. Crop Evol. 2010, 57, 1–15. [Google Scholar] [CrossRef]
- Zhu, Z.-M.; Gao, X.-F.; Fougère-Danezan, M. Phylogeny of Rosa Sections Chinenses and Synstylae (Rosaceae) Based on Chloroplast and Nuclear Markers. Mol. Phylogenet. Evol. 2015, 87, 50–64. [Google Scholar] [CrossRef] [PubMed]
- Sheng, J.; Yan, M.; Wang, J.; Zhao, L.; Zhou, F.; Hu, Z.; Jin, S.; Diao, Y. The Complete Chloroplast Genome Sequences of Five Miscanthus Species, and Comparative Analyses with Other Grass Plastomes. Ind. Crops Prod. 2021, 162, 113248. [Google Scholar] [CrossRef]
- Albert, V.A.; Backlund, A.; Bremer, K.; Chase, M.W.; Manhart, J.R.; Mishler, B.D.; Nixon, K.C. Functional Constraints and Rbcl Evidence for Land Plant Phylogeny. Ann. Mo. Bot. Gard. 1994, 81, 534–567. [Google Scholar] [CrossRef]
- Wu, Z.; Tian, C.; Yang, Y.; Li, Y.; Liu, Q.; Li, Z.; Jin, K. Comparative and Phylogenetic Analysis of Complete Chloroplast Genomes in Leymus (Triticodae, Poaceae). Genes 2022, 13, 1425. [Google Scholar] [CrossRef]
- Raggi, L.; Bitocchi, E.; Russi, L.; Marconi, G.; Sharbel, T.F.; Veronesi, F.; Albertini, E. Understanding Genetic Diversity and Population Structure of a Poa Pratensis Worldwide Collection through Morphological, Nuclear and Chloroplast Diversity Analysis. PLoS ONE 2015, 10, e0124709. [Google Scholar] [CrossRef]
- Tso, K.L.; Allan, G.J. Environmental Variation Shapes Genetic Variation in Bouteloua Gracilis: Implications for Restoration Management of Natural Populations and Cultivated Varieties in the Southwestern United States. Ecol. Evol. 2019, 9, 482–499. [Google Scholar] [CrossRef]
- Wani, G.A.; Shah, M.A.; Tekeu, H.; Reshi, Z.A.; Atangana, A.R.; Khasa, D.P. Phenotypic Variability and Genetic Diversity of Phragmites Australis in Quebec and Kashmir Reveal Contrasting Population Structure. Plants 2020, 9, 1392. [Google Scholar] [CrossRef]
- Zhang, J.; Zhou, C.; Yang, Y. Crecimiento de módulos clonales de Agropyron michnoi en la planicie Songnen del Noreste de China. Phyton 2015, 84, 417–422. [Google Scholar] [CrossRef]
- Yang, Y.-F.; Zheng, H.-Y.; Li, J.-D. The Effects of Grazing on Age Structure in Clonal Populations of Agropyron michnoi. Chin. J. Plant Ecol. 2001, 25, 71. [Google Scholar]
- Chen, S.; Ma, X.; Zhang, X.; Huang, L.; Zhou, J. Genetic Diversity and Relationships among Accessions of Five Crested Wheatgrass Species (Poaceae: Agropyron) Based on Gliadin Analysis. Genet. Mol. Res. 2013, 12, 5704–5713. [Google Scholar] [CrossRef]
- Doyle, J.J.; Doyle, J.L. A Rapid DNA Isolation Procedure for Small Quantities of Fresh Leaf Tissue. Phytochem. Bull. 1987, 19, 11–15. [Google Scholar]
- Shimizu, Y.; Ando, M.; Sakai, F. Clonal Structure of Natural Populations of Cryptomeria Japonica Growing at Different Positions on Slopes, Detected Using Rapd Markers. Biochem. Syst. Ecol. 2002, 30, 733–748. [Google Scholar] [CrossRef]
- Li, C.; Lu, S.; Yang, Q. Asian Origin for Polystichum (Dryopteridaceae) Based on Rbc L Sequences. Chin. Sci. Bull. 2004, 49, 1146–1150. [Google Scholar] [CrossRef]
- Taberlet, P.; Gielly, L.; Pautou, G.; Bouvet, J. Universal Primers for Amplification of Three Non-Coding Regions of Chloroplast DNA. Plant Mol. Biol. 1991, 17, 1105–1109. [Google Scholar] [CrossRef]
- Pritchard, J.K.; Stephens, M.; Donnelly, P. Inference of Population Structure Using Multilocus Genotype Data. Genetics 2000, 155, 945–959. [Google Scholar] [CrossRef]
- Earl, D.; Harvester, B.V.S. A Website and Program for Visualizing Structure Output and Implementing the Evanno Method. Conserv. Genet. Resour. 2012, 4, 359–361. [Google Scholar] [CrossRef]
- Rosenberg, N.A.; Pritchard, J.K.; Weber, J.L.; Cann, H.M.; Kidd, K.K.; Zhivotovsky, L.A.; Feldman, M.W. Genetic Structure of Human Populations. Science 2002, 298, 2381–2385. [Google Scholar] [CrossRef] [PubMed]
- Zhao, N.; Gao, Y.; Wang, J.; Ren, A.; Xu, H. Rapd Diversity of Stipa Grandis Populations and Its Relationship with Some Ecological Factors. Acta Ecol. Sin. 2006, 26, 1312–1318. [Google Scholar] [CrossRef]
- Huang, W.-D.; Zhao, X.-Y.; Zhao, X.; Li, Y.-L.; Pan, C.-C. Environmental Determinants of Genetic Diversity in Caragana microphylla (Fabaceae) in Northern China. Bot. J. Linn. Soc. 2016, 181, 269–278. [Google Scholar] [CrossRef]
- Hao, Z.; Xin, L.; Fenghe, J. Effects of Different Water Supply on the Reproduction of Stipa Krylovii and Artemisia Frigida Populations in Degraded Steppe. Acta Agrestia Sin. 2005, 13, 106–110. [Google Scholar] [CrossRef]
- Chen, S.; Chen, R.; Zeng, X.; Chen, X.; Qin, X.; Zhang, Z.; Sun, Y. Genetic Diversity, Population Structure, and Conservation Units of Castanopsis sclerophylla (Fagaceae). Forests 2022, 13, 1239. [Google Scholar] [CrossRef]
- Kabiel, H.; Hegazy, A.; Faisal, M.; Doma, E. Genetic Variations within and among Populations of Anastatica Heirochuntica at Macroscale Geographical Range. Appl. Ecol. Environ. Res. 2013, 11, 343–354. [Google Scholar] [CrossRef]
- Nybom, H. Comparison of Different Nuclear DNA Markers for Estimating Intraspecific Genetic Diversity in Plants. Mol. Ecol. 2004, 13, 1143–1155. [Google Scholar] [CrossRef]
- Sexton, J.P.; Hangartner, S.B.; Hoffmann, A.A. Genetic Isolation by Environment or Distance: Which Pattern of Gene Flow Is Most Common? Evolution 2014, 68, 1–15. [Google Scholar] [CrossRef]
- Still, D.; Kim, D.-H.; Aoyama, N. Genetic Variation in Echinacea Angustifolia Along a Climatic Gradient. Ann. Bot. 2005, 96, 467–477. [Google Scholar] [CrossRef]
- Edelaar, P.; Bolnick, D.I. Non-Random Gene Flow: An Underappreciated Force in Evolution and Ecology. Trends Ecol. Evol. 2012, 27, 659–665. [Google Scholar] [CrossRef] [PubMed]
- Hancock, A.M.; Witonsky, D.B.; Alkorta-Aranburu, G.; Beall, C.M.; Gebremedhin, A.; Sukernik, R.; Utermann, G.; Pritchard, J.K.; Coop, G.; Di Rienzo, A. Adaptations to Climate-Mediated Selective Pressures in Humans. PLoS Genet. 2011, 7, e1001375. [Google Scholar] [CrossRef] [PubMed]
- Al-Gharaibeh, M.; Hamasha, H.; Rosche, C.; Lachmuth, S.; Wesche, K.; Hensen, I. Environmental Gradients Shape the Genetic Structure of Two Medicinal Salvia Species in Jordan. Plant Biol. 2017, 19, 227–238. [Google Scholar] [CrossRef]
- Gray, M.M.; St Amand, P.; Bello, N.M.; Galliart, M.B.; Knapp, M.; Garrett, K.A.; Morgan, T.J.; Baer, S.G.; Maricle, B.R.; Akhunov, E.D. Ecotypes of an Ecologically Dominant Prairie Grass (Andropogon gerardii) Exhibit Genetic Divergence across the Us Midwest Grasslands’ Environmental Gradient. Mol. Ecol. 2014, 23, 6011–6028. [Google Scholar] [CrossRef]
- Song, R.; Zhang, X.; Zhang, Z.; Zhou, C. Climatic Factors, but Not Geographic Distance, Promote Genetic Structure and Differentiation of Cleistogenes squarrosa (Trin.) Keng Populations. Front. Bioinform. 2024, 4, 1454689. [Google Scholar] [CrossRef]
- Pacheco-Hernández, Y.; Villa-Ruano, N.; Lozoya-Gloria, E.; Barrales-Cortés, C.A.; Jiménez-Montejo, F.E.; Cruz-López, M.D.C. Influence of Environmental Factors on the Genetic and Chemical Diversity of Brickellia Veronicifolia Populations Growing in Fragmented Shrublands from Mexico. Plants 2021, 10, 325. [Google Scholar] [CrossRef] [PubMed]
- Brandt, J.S.; Haynes, M.A.; Kuemmerle, T.; Waller, D.M.; Radeloff, V.C. Regime Shift on the Roof of the World: Alpine Meadows Converting to Shrublands in the Southern Himalayas. Biol. Conserv. 2013, 158, 116–127. [Google Scholar] [CrossRef]
- Steinbauer, M.J.; Grytnes, J.-A.; Jurasinski, G.; Kulonen, A.; Lenoir, J.; Pauli, H.; Rixen, C.; Winkler, M.; Bardy-Durchhalter, M.; Barni, E. Accelerated Increase in Plant Species Richness on Mountain Summits Is Linked to Warming. Nature 2018, 556, 231–234. [Google Scholar] [CrossRef]
Disclaimer/Publisher’s Note: The statements, opinions and data contained in all publications are solely those of the individual author(s) and contributor(s) and not of MDPI and/or the editor(s). MDPI and/or the editor(s) disclaim responsibility for any injury to people or property resulting from any ideas, methods, instructions or products referred to in the content. |
© 2025 by the authors. Licensee MDPI, Basel, Switzerland. This article is an open access article distributed under the terms and conditions of the Creative Commons Attribution (CC BY) license (https://creativecommons.org/licenses/by/4.0/).