Abstract
Chickpea (Cicer arietinum L.) is a cheap source of protein and rich in minerals for people living in developing countries. In order to assess the existing molecular genetic diversity and determine population structures in selected Ethiopian chickpea germplasm accessions (118), a set of 46 simple sequence repeat (SSR) markers equally distributed on the chickpea genome were genotyped. A total of 572 alleles were detected from 46 SSR markers, and the number of alleles per locus varied from 2 (ICCM0289) to 28 (TA22). The average number of alleles per locus, polymorphism information content, and expected heterozygosity were 12, 0.684, and 0.699, respectively. Phylogenetic analysis grouped the 118 chickpea genotypes from diverse sources into three evolutionary and/or biological groups (improved desi, improved kabuli, and landraces). The population structure analysis revealed six sub-populations from 118 chickpea genotypes studied. AMOVA revealed that 57%, 29%, and 14% of the total genetic variations were observed among individuals, within populations, and among populations. The insights into the genetic diversity at molecular levels in the Ethiopian germplasm lines can be used for designing conservation strategies as well as the diverse germplasm lines identified in this study can be used for trait dissection and trait improvement.
1. Introduction
Chickpea (Cicer arietinum L.) is a diploid crop plant (2n = 2x = 16) with a haploid genome size of approximately 740 Mb [1]. Southeastern Turkey and adjoining Syria are the primary Vavilovian centers of origin, and Ethiopia is the secondary center of diversity [2,3]. In Ethiopia, chickpea is one of the most economically important legumes produced on an area of 258,486 ha, with a production of 470,000 tons [4,5,6]. Ethiopia is one of the top ten chickpea growing countries across the world and is the leading producer, consumer, and exporter of chickpeas in Africa [7]. In Ethiopia, chickpea is consumed as a green vegetable (eshet), roasted (kollo), boiled (nifro), dry vegetable, ‘shimbra asa’, shiro wot (sauce), and snacks, which are cheap and healthy diets that are rich in protein, vitamins, and minerals for the poor farmers who cannot afford animal products. Moreover, chickpea generates income for the poor farmers and draws foreign currency to the country, improves food and nutritional security and soil fertility, provides livestock feed, and requires low production costs [6,7,8]. The major chickpea growing zones of Ethiopia are South Gondar, North Gondar, East Gojam, West Gojam, North Shewa, East Shewa, West Shewa, South Wollo, North Wollo, and Tigray [9]. In Ethiopia, there are about 1173 chickpea accessions collected from different agroecologies and geographical origins and stored at the Institute of Biodiversity and Conservation [10]. Although Ethiopia is bestowed with diverse agroecologies and, especially, crop diversity, the productivity of chickpea is about 850 kg/ha [7] due to the exposure of the crop to several biotic and abiotic stresses.
Deeper insights into genetic diversity enable the use of appropriate germplasm lines in breeding programs to develop climate-resilient varieties. The investigation of the nature and structure of genetic diversity and relatedness within and among the cultivated chickpea and its wild relatives helps to identify new sources of germplasm bearing valuable genes for improving yield, grain quality, and enhancing resistance to various biotic and abiotic stresses. Additionally, studying genetic diversity is important in the management, conservation, and selection of diverse plant materials for intraspecific and interspecific crossing [11]. Genomics revolution during the last two decades led to the development of several genomics resources, including the genome sequence [1], molecular markers [12,13], and technologies for assessing the genetic diversity of germplasm lines at the genome level [14,15,16].
Earlier, efforts were made to understand the genetic structure using highly polymorphic simple sequence repeat (SSR) markers that are required to facilitate the chickpea genetic improvement [17]. SSR markers are robust and quite cheap markers for allele mining, molecular genetic diversity pattern, genetic relationships, association genetics, genetic mapping and identification of genes, phylogenetic patterns, population genetic structure studies, cloning gene(s), and marker-assisted selection in chickpea accessions [18,19,20,21,22]. However, most of these studies assessed the genetic diversity among germplasm lines from Southeast Asia [19,20,21,22,23] and Mediterranean regions [24,25,26,27,28]. The genetic diversity among the Ethiopian germplasm lines was seldom studied [18,20] using SSR markers, and most of the genetic diversity studies of chickpea so far focused on morphological characterizations. Ethiopia is the secondary center of origin, and assessing the molecular genetic diversity and determining the population structures among Ethiopian germplasm lines would help designing breeding programs as well as germplasm conservation and management strategies. In this study, we report the assessment of molecular genetic diversity and population structures of 118 chickpea genotypes (115 Ethiopian chickpea landraces, breeding lines, and cultivars and 3 Indian elite varieties) by using 46 genome-wide SSR markers.
2. Materials and Methods
2.1. Plant Materials and DNA Extraction
A total of 118 chickpea genotypes (115 Ethiopian landraces, lines, and varieties and 3 Indian elite varieties) were grown at Debre Zeit Lath house, Ethiopia (Table 1). DNA was extracted from 22-days-old seedlings (leaves from ten plants per genotype were pooled) using a modified CTAB protocol [29] at the Institute of Biotechnology, Addis Ababa University, Ethiopia. At ICRISAT, Patancheru, India, the DNA samples were treated with RNase A (by adding 15 µL of RNase A to each DNA sample) for three hours at 37 °C. The RNase A treatment was further purified following the NucleoSpin 96 Plant II kit purification protocol [30]. The quality check, quantification, and normalization to 5 ng/µL of DNA samples were made using 1% agarose by using lambda DNA (50 ng) as a standard and 8000 NanoDrop Spectrophotometer (Thermo Fisher Scientific, Waltham, MA, USA).

Table 1.
Passport information of chickpea genotypes used in the present study.
2.2. Polymerase Chain Reaction (PCR), Capillary Gel Electrophoresis, Allele Calling, and Sizing
A total of 46 polymorphic SSR markers (Table 2) distributed equally on the genome were used to genotype 118 chickpea genotypes. The 46 SSR markers were selected based on quality criteria, genome coverage, and locus-specific information content of the published data [18,20,22,31] and unpublished data. All 46 SSR markers were genotyped as described earlier [12,13]. PCR products were separated based on the size of amplicons by an automated DNA fragment analyzer and Sanger sequencer (Capillary gel electrophoresis, ABI Prism 3730 XL, Applied Biosystems, Foster City, CA, USA) by using an internal size standard, GeneScan-500 LIZ. GeneMapper4.0 (Applied Biosystems, Foster City, CA, USA) software was used for allele calling.
Table 2.
Major allele frequency, polymorphic information content, heterozygosity, allele size, number of alleles per locus, and allelic composition of 46 SSR markers across 118 chickpea genotypes.
2.3. Diversity Analysis
Based on SSR allelic data, the molecular-genetic relationships (dendrogram) of 118 chickpea genotypes were determined by using the neighbor-joining weighted pair-group method with arithmetic averages (WPGMA), i.e., clustering of simple matching dissimilarity indices with the help of the DARwin-6.0 program [32]. PowerMarker version 3.51 [33] was used to determine the major allele frequency, the number of alleles per locus, polymorphic information content (PIC), gene diversity (expected heterozygosity), and observed heterozygosity.
2.4. Population Structure
STRUCTURE 2.3.4 [34] software was used to estimate the number of natural genetic groups (K), the distribution of individuals among these groups, and to assign individual genotypes to a specified number of groups ´K´ based on the membership coefficients calculated from the genotype data. The genetic structure of 118 chickpea genotypes was explored using the Admixture model implemented in the STRUCTURE software. A range of population numbers (K = 2 to K = 10) was assessed using a burn-in period of 10,000 steps, followed by 100,000 MCMC (Monte Carlo Markov chain) replicates with 5× iterations. The rate of change of the Napierian logarithm probability relative to the standard deviation (ΔK) was determined by using the [35] method. The output of this population structure was taken from the STRUCTURE HARVESTER program online [36], which showed the highest peak at K = 6, indicating the presence of six major distinct populations. The 46 SSR loci were analyzed based on populations (geographical distributions) of the chickpea genotypes using GenALEX 6.5 software [37]. Population-specific genetic diversity, allelic frequency, observed, expected and unbiased expected heterozygosity, Shannon information index, the total number of alleles, average number of alleles and genotype-specific alleles per locus, percentage of polymorphism, gene flow, Nei’s pairwise genetic distance between populations [38], and genetic differentiation were computed. Based on the pair-wise genetic distance between genotypes, principal coordinate analysis (PCoA) was also analyzed in GenAlEX 6.5 to complement the analyses of STRUCTURE and dendrogram.
The statistical significances of molecular genetic variance components (Analysis of molecular variance, AMOVA) for each hierarchical comparison (among populations, among individuals, individuals within populations) were tested using 999 permutations. Moreover, F-statistics among individuals, within and among populations were determined using GenAlEX 6.5 [37].
3. Results
A total of 572 alleles were detected with 46 genome-wide polymorphic SSR markers across 118 chickpea genotypes, out of which 113 were considered rare, 435 common, and 34 most frequent alleles. Large numbers of rare allelic compositions were found for TS72, CaM1101, and TA14. The number of alleles per locus varied from 2 (ICCM0289) to 28 (TA22), and an average of 12 alleles per locus was perceived (Table 2). A total of 126 genotype-specific alleles were also found (data not shown). Polymorphic information content (PIC), expected heterozygosity (He), and observed heterozygosity (Ho) varied from 0.05 to 0.94, 0.05 to 0.95, and 0 to 0.52, respectively. An average value of PIC, He, Ho, and major allele frequency (MAF) were 0.684, 0.69, 0.22, and 0.41 in their respective order. Allele sizes of 46 polymorphic markers varied from 115 (TA194) to 345 bp (CaM1101; Table 2).
Large numbers of alleles and high PIC values were obtained (15–28, >0.8) with 23 SSR markers, namely TA22, CaM1101, TS72, TA130, ICCM249, TA118, TA96, TA176, CaM1158, CaM0443, TA14, TA37, CaM0436, H1G16, TR29, CaM1402, TA78, TA113, STMS11, TA71, TA122, TA194, and TA103 in their respective order, which might have great potential to discriminate 118 chickpea genotypes into different genetic groups. Nevertheless, SSR markers such as GAA47, ICCM0289, CaM0610, and H1D24 had a low polymorphic power (PIC ≤ 0.1) to discriminate 118 chickpea genotypes into different genetic groups. The numbers of alleles per locus were directly proportional to variations of the allele size, PIC, and He, and inversely proportional to the major allele frequency (MAF). There was a parallelism between PIC and He; both might reflect the discriminating powers (genetic diversity) of the SSR markers across 118 chickpea genotypes (Table 2).
3.1. Phylogenetic Relationships and Principal Coordinate Analysis (PCoA)
Molecular genetic relationships among 118 chickpea genotypes were revealed by phylogenetic relationships (dendrograms) and principal coordinate analysis (PCoA; Figure 1 and Figure 2). The phylogenetic relationships of 118 chickpea genotypes were determined based on pairs of a simple matching dissimilarity matrix of hierarchical neighbor-joining weighted pair group arithmetic average (WPGMA) that resolved the 118 chickpea genotypes into three clusters: landraces, improved kabuli, and desi (Figure 1). In addition, the principal coordinate analysis (PCoA) of the molecular data was analyzed based on a pairwise distance matrix across 118 chickpea genotypes by using GenAlex 6.5 software. Hence, the PCoA analysis confirmed the same result as the WPGMA dendrogram; 118 chickpea genotypes were grouped into three clusters: landraces, improved desi, and kabuli (Figure 2).
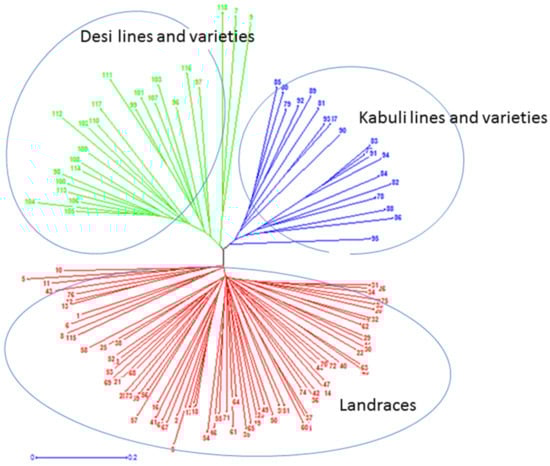
Figure 1.
Phylogenetic analysis of 118 chickpea genotypes from diverse geographical regions of Ethiopia and India were grouped into three clusters. Landraces, improved desi, and improved kabuli were shown in red, green, and blue colors, respectively. Improved genotypes in each category include advanced lines and varieties.
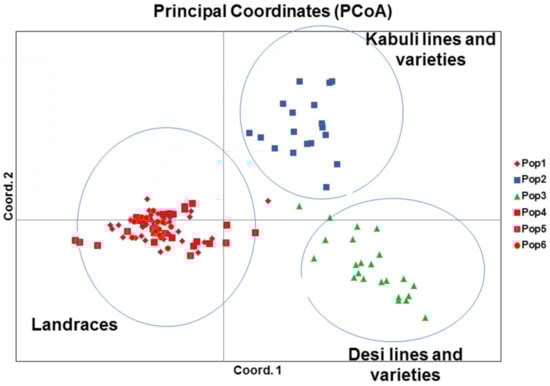
Figure 2.
Principal coordinates analysis (PCoA) grouped 118 chickpea genotypes into three clusters: landraces, desi lines and varieties (improved desi), and kabuli lines and varieties (improved kabuli).
3.2. Population Structure, Genetic Differentiation, and Geographic Distribution
According to an online output of population structure [36] by using the Evano et al. [35] method, the varying probable numbers of populations (K = 2 to K = 10) and the maximum delta K (∆K) value were clearly obtained at K = 6 (Figure 3a). Therefore, the admixture model from the STRUCTURE 2.3.4 software analysis clearly revealed that 118 chickpea genotypes (115 Ethiopian and 3 Indian genotypes) were categorized into six groups of populations (desi, kabuli, and 4 distinct groups of landraces, Figure 3b). Populations 1, 4, 5, and 6 were comprised of landraces collected from North Shewa, SNNP (Southern Nations, Nationalities, and Peoples), West Shewa, South Wollo, and Tigray; East Shewa, Arsi, North Shewa, and South Wollo; North Shewa and West Harerge; and South Gondar, East Gojam, and West Gojam, respectively. Pop2 and Pop3 comprised of improved kabuli and desi (Figure 3b).
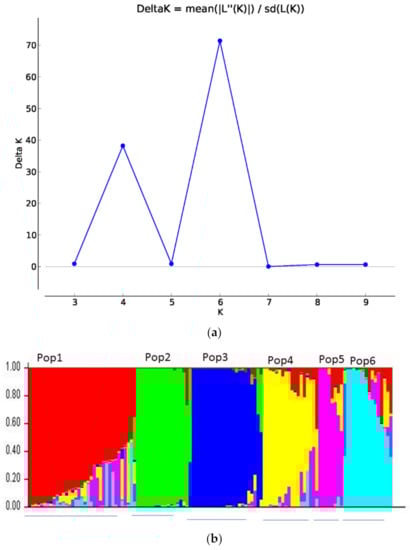
Figure 3.
Population structure (a) According to Evano et al. [35], the probable number populations was detected from K = 2 to K = 10 and the highest pick was depicted at K = 6, (b) six sub-populations were identified among 118 chickpea genotypes using STRUCTURE 2.3.4 software analysis. Six separate bar plots were shown, and each bar plot represented a distinct population.
In this study, 60% of the membership coefficient was used as a threshold value of individual genotypes to be clustered into their own genetic groups. However, the average membership coefficient value of individual genotypes per population group was greater than 80%. Based on this threshold, membership coefficients of 32, 18, 22, 15, 7, and 13 individual chickpea genotypes belonged to populations 1–6 in their respective order; nevertheless, 11 genotypes possessed a membership coefficient of less than 60% that had admixture ancestry among the 6 populations.
Pop1 possessed the largest number of alleles (390) and genotype-specific alleles (47) per population, maximum average number of alleles (8.5), and average genotype-specific alleles per locus (1.1), Shannon information index (1.49), and observed heterozygosity (0.3), and a high percentage of polymorphism (93.48%), genetic diversity (0.62), and unbiased expected heterozygosity (0.63). Pops 3 and 2 had high percentage of polymorphism (93.48–95.65%), the highest F value (0.71–0.77), less observed heterozygosity (0.13–0.17), and Shannon information index (1.21–1.22). Pop6 had the least average genotype-specific alleles per locus (0.17), Shannon information index (1.18), and percentage of polymorphism (84.78%; Table 3).
Table 3.
Allelic richness and genetic diversity among six populations of chickpea.
Nei’s pairwise genetic distances among populations varied from 0.15 to 0.52. Pop1 was distant to Pop3 (0.52) and Pop2 (0.46), while Pop1 was closer to Pop6 (0.15) and Pop4 (0.16). Pops 2 and 3 were closer (0.44) to each other than to either of the landrace groups and distant from Pop5 (0.66 and 0.67) and Pop6 (0.55 and 0.58). Among 118 chickpea genotypes, the most distant and closest chickpea genotypes to all other genotypes were an Indian elite desi variety, ICCV96029 (Pop3), and an Ethiopian landrace, 207654 (Pop1) collected from North Shewa. Landraces collected from different regions of Ethiopia were very close to each other, rather than the lines and varieties of desi and kabuli taken from Ethiopia and India (ICRISAT; Table 4).
Table 4.
Pairwise population matrix of Nei’s genetic distance, pairwise population divergence values, and mean genetic distance and mean genetic divergence among individuals within populations.
Pairwise genetic divergence (FST) among populations varied from 0.04 to 0.12. Pops 1 and 3 had the highest genetic divergence (0.12), and Pops 1 and 4 had the least genetic divergence (0.04). The inbreeding coefficient value of each population varied from 0.08 (Pop1) to 0.42 (Pop5; Table 4). The trends of genetic differentiation detected by FST among six populations were consistent with Nei’s pairwise genetic distance. The population structure analysis of this study confirmed the same result as the WPGMA dendrogram and PCoA except for further clustering of landraces into four distinct populations. This is partially due to the geographical proximity of collected landraces; nevertheless, in some cases, landraces collected from geographically distant zones like North Shewa, West Shewa, South Wollo, Tigray, and SNNP were clustered into the same population. Landraces collected from North Shewa and West Harerge were also grouped under the same population. Moreover, even landraces collected from the same geographical zone (for example, in North Shewa) were clustered into 3 distinct groups of populations (Pops 1, 4, and 5).
3.3. Analysis of Molecular Variance (AMOVA)
The genetic diversity among 118 chickpea genotypes was depicted by the Shannon information index, genetic diversity parameters, AMOVA, F-statistics, and gene flow. The Shannon information index revealed that the genetic diversity among the population was 28% while, within populations, it was 72%. Population differentiation based on the AMOVA has shown that 14%, 57%, and 29% of the total genetic variation was obtained among populations, among individuals, and within populations, respectively (Table 5 and Figure 4), and all the genetic variance components were highly significantly different (p < 0.001). F-statistics (fixation index or inbreeding coefficient) explained that the genetic variation among individuals (FIT, 0.71) and within subpopulations (FIS, 0.67) was higher than among the populations (FST, 0.14). The mean gene flow (Nm) among the six populations was 1.57 (Table 5).
Table 5.
Analysis of molecular variance (AMOVA), gene flow and genetic divergences within individuals, among populations and individuals.
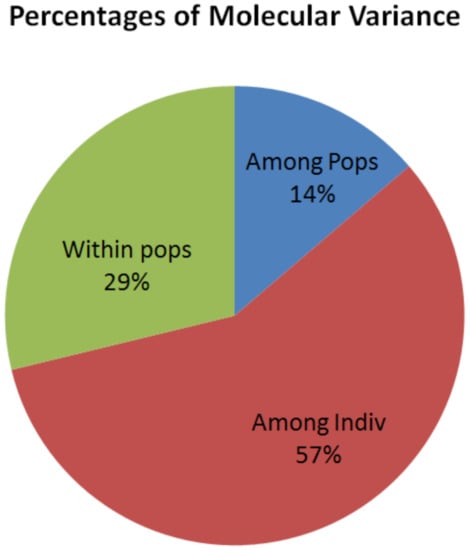
Figure 4.
The percentage of molecular genetic variations of 118 chickpea genotypes within populations, among individuals, and populations revealed by SSR markers.
4. Discussion
4.1. Allelic Variation and Molecular Genetic Diversity
The number of alleles per locus, number of genotype-specific, rare, common, frequent, and group-specific alleles, variability of allele sizes, PIC values, and He were allelic variation and genetic diversity parameters that can infer the discrimination power of an SSR marker for measuring phylogenetic relationships, molecular genetic diversity, geographical relationship, and genetic differentiation patterns of chickpea accessions [17,18,19,20,22,23,24,26,27,28]. The number of alleles per locus showed a positive correlation with the ranges of allele sizes, PIC, and genetic diversity [11,20,22,28], which were in agreement with the present study.
In the present study, a total of 572 alleles were detected from 46 SSR markers, the number of alleles and allele sizes varied from 2 to 28 alleles per locus and 115 to 345 bp, an average number of alleles per locus, PIC, and genetic diversity were 12, 0.68, and 0.69, respectively. Similar results were reported by [20,24,26,28]. In these studies, 218, 122, 504, and 309 alleles were detected with 22, 9, 48, and 16 SSR markers, respectively. The number of alleles per locus varied from 2 to 26 (mean 9.9), 9 to 20 (mean 13.5), 3 to 22 (mean 10.5), and 8 to 29 (mean 19.3) in their respective order. Their average genetic diversity and PIC ranged from 0.7–0.8. The allele sizes were in a similar range (131 to 344 bp), as reported earlier [24].
On the contrary, Refs. [21,22] reported a relatively large number of total numbers of alleles (917 and 1683) from 35 and 48 SSR markers, the average number of alleles per locus (26.2 and 35), and genetic diversity (0.48–0.96 and 0.87). On the other hand, Refs. [11,18,25,27,39] detected a small number of alleles per locus and average alleles per locus, less average PIC, and genetic diversity values. These authors detected 58, 119, 480, 117, and 111 alleles from 10, 19, 100, 38, and 33 SSR markers in their respective order. According to the reports of these authors, the number of alleles, average alleles per locus, PIC, and genetic diversity varied from 2–13, 3–6.25, and 0.41–0.68, respectively. The number, type, genome-wide distribution, and polymorphic nature of the SSR markers, and the number, biological status, type, geographical distributions, and agroecology of the germplasm accessions might account for these differences.
The presence of genotype-specific alleles is important for genetic characterizations of agronomic and quality traits and marker-assisted selection (gene tagging) [40]. A total of 106 genotype-specific alleles were identified from 307 Iranian chickpea accessions [22,26], reporting 470 unique alleles across 2915 composite chickpea collections as revealed by SSR markers. Moreover, Upadhyaya et al. [22] found a higher percentage (55.5%) of rare alleles than common (42.8%) and most frequent (1.7%) alleles. In the present study, comparatively large numbers of genotype-specific alleles (126) were found. The common alleles (74%) were found to be extremely higher than the rare alleles (19.9%). Upadhyaya et al. [22] confirmed that accessions from East Africa regions were highly polymorphic and genetically diverse with beneficial traits.
In the present study, from the total molecular genetic variations, 72% and 28% of the genetic variation was found within and among populations. In agreement with this study, the AMOVA revealed that 73% and 27% [18], 59% and 41% [27], and 62% and 38% [28] of the variation observed in the chickpea accessions was found within and among populations. This might be due to the presence of high genetic variation within landraces collected from the primary and second centers of chickpea [24]. The study of genetic diversity and relationships among chickpea genotypes used in this study might be important to the management, conservation, and selection of diverse plant materials for the intraspecific crossing of distantly related chickpea genotypes (e.g., Ethiopian landraces with Indian elite varieties, ICCV96029, and JG 14) to improve yield and mitigate abiotic stresses such as drought, heat, cold, and salinity in the national chickpea breeding programs. Phenotypic data confirmed that few of the chickpea accessions proved to be heat resilient under heat stress environments (data not shown). Similarly, Keneni et al. [18] emphasized that crossings between genetically distant parents and those from diverse local sources might produce higher heterosis, better genetic recombination, and segregation in their progenies and result in varieties with a broad genetic base.
4.2. Population Structure and Patterns of Population Genetic Divergence
Chickpea accessions might form clusters based on evolutionary (phylogenetic) relationships, market classes, and geographical distributions [20,22,26,27]. In the present study, 118 chickpea genotypes were taken from diverse geographical regions of Ethiopia, Debre Zeit Agricultural Research Center (Ethiopia), and ICRISAT (India). They were grouped into three clusters and six distinct genetic populations based on phylogenetic and structural analyses, respectively. Similarly, phylogenetic analyses of 48 [25] and 103 [24] chickpea entries were clustered into five and three distinct populations. Saeed et al. [27] and Sefera et al. [20] reported that by using the UPGMA clustering method, 44 and 48 chickpea accessions were clustered into eight and two populations, respectively. In addition, the population structure analysis revealed that 46 [19], 155 [18], and 94 [17] chickpea genotypes were divided into five, five, and six distinct populations, respectively.
In this study, chickpea landraces collected from a single origin or two or more geographical origins clustered into a single population, and landraces collected from a single geographical origin could be clustered into more than one cluster. For instance, all landraces collected from SNNP were grouped into a single cluster; however, landraces collected from North Shewa were grouped into four of the landrace clusters with different proportions of individuals. The number of entries varied from cluster to cluster, and individual chickpea genotypes within a cluster were definitely more closely related with each other (possessed a membership coefficient of ≥ 60%) than with those individual members in different clusters. Intra- and inter-regional similarities were observed between adjoining geographical origins due to an exchange of germplasms. Especially, there might be a massive seed accumulation and movement from North Shewa (central part of the country) into different geographical origins of Ethiopia through the market or other mechanisms. This could be due to North Shewa being an adjoining geographical area to the national chickpea breeding program, which might have received significant benefit out of it. In agreement with the present study, Choudhary et al. [11] reported that the overall clustering pattern did not strictly follow the grouping of accessions according to their geographic origins. Moreover, Keneni et al. [18] explained that chickpea genotypes taken from different sources might be evolved from different lines of ancestry and/or derived from independent events of evolutionary forces, namely genetic drift, mutation, migration, selection, and influx/outflux of genes in the form of germplasm exchange that differentiated chickpea genotypes into different gene pools. Three elite desi varieties taken from ICRISAT (Hyderabad, India) were clustered together with the Ethiopian improved desi genotypes. This clearly indicated that Ethiopia and India have common breeding lines and varieties, which exchanged chickpea genetic material often. This is in line with the report of Sefera et al. [20]: there was correspondence between the grouping of cultivars released in Ethiopia and India.
5. Conclusions
A total of 572 natural alleles and 126 genotype-specific alleles were detected at 46 SSR loci across 118 chickpea genotypes. The number of alleles per locus varied from 2 (ICCM0289) to 28 (TA22), and an average of 12 alleles per locus was found. TA22 and CaM0610 markers had the highest and least polymorphic information content, genetic diversity, allele sizes, and a total number of alleles per locus, respectively. AMOVA revealed that there was a higher genetic diversity (59%) among individuals than among populations (14%). The presence of high genetic diversity within populations, a wide range of allele sizes, large numbers of alleles per locus and genotype specific alleles per population, high polymorphic information content, and expected heterozygosity had breeding implications on the national chickpea improvement program by helping to enhance yield and improve specific traits such as heat, cold, and drought through the crossing of genetically distant genotypes.
Author Contributions
K.T., M.T. and R.K.V. conceptualized the research work. T.G. performed the experiments, analyzed the data prepared, and wrote the first draft. R.K.V., A.F., T.H. and A.C. contributed to the resources. K.T., R.K.V., A.F. and M.T. reviewed and edited the MS. All authors have read and agreed to the published version of the manuscript.
Funding
This work has been undertaken as part of the CGIAR Research Program on Grain Legumes and Dryland Cereals (GLDC).
Data Availability Statement
The datasets used and/or analyzed in this study are available from the corresponding authors and first author.
Acknowledgments
T.G. is sincerely thankful to the Institute of Biotechnology, Addis Ababa University, for financial support. R.K.V. greatly acknowledges the funding support from the Bill and Melinda Gates Foundation, Tropical Legumes III. This work has been undertaken as part of the CGIAR Research Program on Grain Legumes and Dryland Cereals (GLDC). ICRISAT is a member of CGIAR Consortium.
Conflicts of Interest
All authors declared no conflict of interest.
References
- Varshney, R.K.; Song, C.; Saxena, R.K.; Azam, S.; Yu, S.; Sharpe, A.G.; Cannon, S.; Baek, J.; Rosen, B.D.; Tar’an, B.; et al. Draft genome sequence of chickpea (Cicer arietinum L.) provides a resource for trait improvement. Nat. Biotechnol. 2013, 31. [Google Scholar] [CrossRef] [PubMed]
- Van der Maesen, L.J.G. Origin, History and Taxonomy of Chickpea. In The Chickpea; Saxena, M.C., Singh, K.B., Eds.; C.A.B. International: Wallingford, UK, 1987; pp. 11–34. [Google Scholar]
- Vavilov, N.I. Centers of Origin of Cultivated Plants. Tr. Prikl. Bot. Sel. 1926, 16, 1–248. [Google Scholar]
- Central Statistics Authority (CSA) of Ethiopia. Agricultural on of Sample Survey, Report on Area and Production of Crops; Private Peasant Holdings; Meher Season; Statistical Bulletin 578; Central Statistics Authority (CSA) of Ethiopia: Addis Ababa, Ethiopia, 2016; p. 131. [Google Scholar]
- Fikre, A.; Desmae, H.; Ahmed, S. Tapping the economic potential of chickpea in sub-Saharan Africa. Agronomy 2020, 10, 1707. [Google Scholar] [CrossRef]
- Kebede, E. Grain legumes production and productivity in Ethiopian smallholder agricultural system, contribution to livelihoods and the way forward. Cogent. Food Agric. 2020, 6, 1722353. [Google Scholar] [CrossRef]
- Chichaybelu, M.; Girma, N.; Fikre, A.; Gemechu, B.; Mekuriaw, T.; Geleta, T.; Chiche, W.; Rubyogo, J.C.; Akpo, E.; Ojiewo, C.O. Enhancing chickpea production and productivity through stakeholders’ innovation platform approach in ethiopia. In Enhancing Smallholder Farmers’ Access to Seed of Improved Legume Varieties Through Multi-stakeholder Platforms; Akpo, E., Ojiewo, C.O., Kapran, I., Omoigui, L.O., Diama, A., Varshney, R.K., Eds.; Springer: Singapore, 2021. [Google Scholar] [CrossRef]
- Desta, F.; Bissa, M.; Korbu, L. Crop water requirement determination of chickpea in central vertisol areas of Ethiopia using FAO CROPWAT MODEL. Afri. J. Agri. Res. 2015, 10, 685–689. [Google Scholar]
- Bejiga, G.; Eshete, M. Chickpea in Ethiopia. In Adaptation of Chickpea in the West Asia and North Africa Region; Saxena, N.P., Saxena, M.C., Johansen, C., Virmani, S.M., Harris, H., Eds.; ICRISAT/ICARDA: Andhra Pradesh, India, 1996; pp. 137–153. Available online: http://oar.icrisat.org/10615/1/PNABY847.pdf (accessed on 3 May 2021).
- Chandora, R.; Gayacharan; Shekhawat, N.; Malhotra, N. Chickpea genetic resources: Collection, conservation, characterization, and maintenance. In Chickpea: Crop Wild Relatives for Enhancing Genetic Gains; Academic Press: Cambridge, MA, USA, 2020. [Google Scholar] [CrossRef]
- Choudhary, P.; Khanna, S.M.; Jain, P.K.; Bharadwaj, C.; Kumar, J.; Lakhera, P.C.; Srinivasan, R. Genetic structure and diversity analysis of the primary gene pool of chickpea using SSR markers. Genet. Mol. Res. 2012, 11, 891–905. [Google Scholar] [CrossRef]
- Nayak, N.S.; Zhu, H.; Varghese, N.; Datta, S.; Choi, N.K.; Horres, R.; Jüngling, R.; Singh, J.; Kavi Kishor, B.P.; Sivaramakrishnan, S.; et al. Integration of novel SSR and gene-based SNP marker loci in the chickpea genetic map and establishment of new anchor points with Medicago truncatula genome. Theor. Appl. Genet. 2010, 120, 1415–1441. [Google Scholar] [CrossRef]
- Thudi, M.; Bohra, A.; Nayak, S.N.; Varghese, N.; Shah, T.M.; Penmetsa, R.V.; Thirunavukkarasu, N.; Gudipati, S.; Gaur, P.M.; Kulwal, P.L.; et al. Novel SSR markers from BAC-end sequences, DArT arrays and a comprehensive genetic map with 1291 marker loci for chickpea (Cicer arietinum L.). PLoS ONE 2011, 6, e27275. [Google Scholar] [CrossRef]
- Thudi, M.; Khan, A.W.; Kumar, V.; Gaur, P.M.; Katta, K.; Garg, V.; Roorkiwal, M.; Samineni, S.; Varshney, R.K. Whole genome re-sequencing reveals genome-wide variations among parental lines of 16 mapping populations in chickpea (Cicer arietinum L.). BMC Plant Biol. 2016, 16, 53–64. [Google Scholar] [CrossRef]
- Thudi, M.; Chitikineni, A.; Liu, X.; He, W.; Roorkiwal, M.; Yang, W.; Jian, J.; Doddamani, D.; Gaur, P.M.; Rathore, A.; et al. Recent breeding programs enhanced genetic diversity in both desi and kabuli varieties of chickpea (Cicer arietinum L.). Sci. Rep. 2016, 6, 1–10. [Google Scholar] [CrossRef]
- Varshney, R.K.; Thudi, M.; Roorkiwal, M.; He, W.; Upadhyaya, H.D.; Yang, W.; Bajaj, P.; Cubry, P.; Rathore, A.; Jian, J.; et al. Resequencing of 429 chickpea accessions from 45 countries provides insights into genome diversity, domestication and agronomic traits. Nat. Genet. 2019, 51, 857–864. [Google Scholar] [CrossRef]
- Saxena, M.S.; Bajaj, D.; Kujur, A.; Das, S.; Badoni, S.; Kumar, V.; Singh, M.; Bansal, K.C.; Tyagi, A.K.; Parida, S.K. Natural allelic diversity, genetic structure and linkage disequilibrium pattern in wild chickpea. PLoS ONE 2014, 9, e107484. [Google Scholar] [CrossRef] [PubMed][Green Version]
- Keneni, G.; Bekele, E.; Imtiaz, M.; Dagne, K.; Getu, E.; Assefa, F. Genetic diversity and population structure of Ethiopian chickpea (Cicer arietinum L.) germplasm accessions from different geographical origins as revealed by microsatellite markers. Plant Mol. Biol. Rep. 2011. [Google Scholar] [CrossRef]
- Parida, S.K.; Verma, M.; Yadav, S.K.; Ambawat, S.; Das, S.; Garg, R.; Jain, M. Development of genome-wide informative simple sequence repeat markers for large-scale genotyping applications in chickpea and development of web resource. Front. Plant Sci. 2015, 6, 645. [Google Scholar] [CrossRef] [PubMed]
- Sefera, T.; Abebie, B.; Gaur, P.M.; Assefa, K.; Varshney, R.K. Characterizations and genetic diversity analysis of selected chickpea cultivars of nine countries using simple sequence repeat (SSR) markers. Crop Pasture Sci. 2011, 62, 177–187. [Google Scholar] [CrossRef][Green Version]
- Thudi, M.; Upadhyaya, D.; Rathore, A.; Gaur, P.M.; Krishnamurthy, L.; Roorkiwal, M.; Nayak, S.N.; Chaturvedi, S.K.; Basu, P.S.; Gangarao, N.V.P.R.; et al. Genetic dissection of drought and heat tolerance in chickpea through genome-wide and candidate gene-based association mapping approaches. PLoS ONE 2014, 9, e96758. [Google Scholar] [CrossRef]
- Upadhyaya, H.D.; Dwivedi, S.L.; Baum, M.; Varshney, R.K.; Sripada, M.U.; Cholenahalli, L.L.; Hoisington, D.; Singh, S. Genetic Structure, diversity, and allelic richness in composite collection and reference set in chickpea (Cicer arietinum L.). BMC Plant Biol. 2008, 8, 106. [Google Scholar] [CrossRef]
- Samyuktha, S.M.; Kannan Bapu, J.R.; Geethanjali, S. Molecular genetic diversity and population structure analysis in chickpea (Cicer arietinum L.) germplasm using SSR markers. Int. J. Curr. Microbiol. App. Sci. 2018, 7, 639–651. [Google Scholar] [CrossRef]
- Giovanni, D.C.; Pavan, S.; Taranto, F.; Rienzo, D.V.; Miazzi, M.M.; Marcotrigiano, R.A.; Mangini, G.; Montemurro, C.; Ricciardi, L.; Lotti, C. Genetic variation of a global germplasm collection of chickpea (Cicer arietinum L.) including Italian accessions at risk of genetic erosion. Physiol. Mol. Biol. Plants 2016, 23, 197–205. [Google Scholar] [CrossRef]
- Hajibarat, Z.; Saidi, A.; Hajibarat, Z.; Talebi, R. Genetic diversity and population structure analysis of landrace and improved chickpea (Cicer arietinum) genotypes using morphological and microsatellite markers. Environ. Exper. Biol. 2014, 12, 161–166. [Google Scholar]
- Naghavi, M.R.; Monfared, A.R.; Humberto, G. Genetic diversity in Iranian chickpea (Cicer arietinum L.) landraces as revealed by microsatellite markers. Czech. J. Genet. Plant Breed. 2012, 48, 131–138. [Google Scholar] [CrossRef]
- Saeed, A.; Hovsepyan, H.; Darvishzadeh, R.; Imtiaz, M.; Panguluri, S.K.; Nazaryan, R. Genetic diversity of iranian accessions, improved lines of chickpea (Cicer arietinum L.) and their wild relatives by using simple sequence repeats. Plant Mol. Biol. Rep. 2011, 29, 848–858. [Google Scholar] [CrossRef]
- Torutaeva, E.; Asanaliev, A.; Prieto-Linde, M.L.; Zborowska, A.; Ortiz, R.; Bryngelsson, T.; Garkava-Gustavsson, L. Evaluation of microsatellite-based genetic diversity, protein and mineral content in chickpea accessions grown in Kyrgyzstan. Hereditas 2014, 151, 81–90. [Google Scholar] [CrossRef] [PubMed]
- Borsch, T.; Hilu, K.W.; Quandt, D.; Wilde, V.; Neinhuis, C.; Barthlott, W. Noncoding plastid trnT-trnF sequences reveal a well resolved phylogeny of basal angiosperms. J. Evol. Biol. 2003, 16, 558–576. [Google Scholar] [CrossRef]
- Angel, M. Genomic DNA from Plant User Manual, NucleoSpin® 96 Plant. HC, Germany. 2008. Available online: https://www.mn-net.com/ (accessed on 3 May 2021).
- Varshney, R.K.; Thudi, M.; Upadhyaya, H.; Dwivedi, S.; Udupa, S.; Furman, B.; Baum, M.; Hoisington, D. A SSR kit to study genetic diversity in chickpea (Cicer arietinum L.). Plant Genet. Resour. 2014, 12, S118–S120. [Google Scholar] [CrossRef]
- Perrier, X.; Jacquemoud-Collet, J.P. DARwin Software (2006). Available online: http://darwin.cirad.fr/darwin (accessed on 11 July 2014).
- Liu, K.; Muse, S.V. Power Marker: Integrated analysis environments for genetic marker data. Bioinformatics 2005, 21, 2128–2129. [Google Scholar] [CrossRef]
- Pritchard, J.K.; Stephens, M.; Donnelly, P. Inference of population structure using multi locus genotype data. Genetics 2000, 155, 945–959. [Google Scholar] [CrossRef]
- Evanno, G.; Regnaut, S.; Goudet, J. Detecting the number of clusters of individuals using the software structure: A simulation study. Mol. Ecol. 2005, 14, 2611–2620. [Google Scholar] [CrossRef]
- Earl, D.A.; VonHoldt, B.M. Structure Harvester: A website and program for visualizing STRUCTURE output and implementing the Evanno method. Conserv. Genet. Resour. 2012, 4, 359–361. [Google Scholar] [CrossRef]
- Peakall, R.; Smouse, P.E. GenAlEx 6.5: Genetic Analysis in Excel. Population Genetic Software for Teaching and Research—An update. Bioinformatics 2012, 28, 2537–2539. [Google Scholar] [CrossRef]
- Nei, M. Genetic distance between populations. Am. Nat. 1972, 106, 283–292. [Google Scholar] [CrossRef]
- Cevik, S.; Unyayar, S.; Ergul, A. Genetic relationships between cultivars of Cicer arietinum and its progenitor grown in Turkey determined by using the SSR markers. Turk. J. Field Crops 2015, 20, 109–114. [Google Scholar] [CrossRef][Green Version]
- Lahiri, N.; Kumar, T.; Bharadwaj, C.; Sarker, A.; Rizvi, A.H.; Chauhan, S.K.; Verma, A.K.; Prasad, G. Diversity analysis among chickpea genetic stock as revealed through STMS marker analysis. IJPGRS 2015, 28, 189–197. [Google Scholar] [CrossRef]
Publisher’s Note: MDPI stays neutral with regard to jurisdictional claims in published maps and institutional affiliations. |
© 2021 by the authors. Licensee MDPI, Basel, Switzerland. This article is an open access article distributed under the terms and conditions of the Creative Commons Attribution (CC BY) license (https://creativecommons.org/licenses/by/4.0/).